1. Introduction
The rapid growth in the use of mobile devices has made Android one of the leading operating systems for smartphones and tablets. As of July 2023, Android has the highest market share of 70.8% [
1]. Android is an open-source, Linux-based mobile operating system developed by Google [
2]. Android 13 is the most recent version, released in 2022. It supports many technologies such as Wi-Fi, short message service (SMS), Bluetooth, accelerometers, camera, global positioning systems (GPS), voice over LTE (VoLTE), etc. Because of its open nature, Android has become immensely popular among developers and consumers. Additionally, software developers can quickly alter and upgrade it to conform to the most recent standards for mobile technology. Unfortunately, this popularity has also attracted cybercriminals who exploit users’ private data and personal information without their consent [
3]. One of the most prevalent and disruptive attacks targeting Android devices is ransomware. Ransomware constitutes a type of malware that encrypts files on a device and demands payment for their decryption. Typically, cybercriminals demand payment in cryptocurrencies such as Bitcoin to evade detection. A typical scenario in ransomware attacks often begins when the user downloads a fraudulent application from either the Google Play Store or an alternative third-party marketplace [
4]. With the increasing presence of Android devices and the open nature of the platform, which allows easy app downloads from unofficial sources, the severity of ransomware attacks has reached alarming levels. In such a situation, data recovery can be challenging, and the risk of further attacks and identity theft is increased, leading to a diminished trust in security solutions by users [
5,
6]. Ransomware attacks commonly focus on specific industries. In 2022, manufacturing companies worldwide experienced 437 such attacks, while the food and beverage sector followed closely with more than 50 ransomware incidents. When it comes to the distribution of ransomware attacks on critical infrastructure, North America took the lead among global regions, with Europe following in second place [
7]. Additionally, the global number of ransomware attacks per year from 2017 to 2022 is as follows: in 2022, organizations detected a staggering 493.33 million ransomware attacks worldwide [
7].
Moving forward to how ransomware is carried out in Android devices; firstly, it is important to know that ransomware continually grows with advanced encryption capabilities by displacing established standards, such as phishing, banking trojans, distributed denial-of-service (DDoS), and crypto-jacking. However, criminals use these models as an initial stepping-stone, then escalate the attack and eventually carry out the targeted attacks, hence forcing payment from victims. By opening an email attachment or clicking an ad, accessing a link, or even navigating to a website that has malware embedded in it, one can unknowingly download ransomware onto an electronic device. Once the code has been loaded on a device, it locks access to the device and any stored files and data. Versions that are more destructive can encrypt data on networked devices as well as local drives and attached drives. The users discover it when their data become inaccessible, or when messages pop up informing them of the attack and demanding ransom payments. Criminals threaten to publicly expose confidential data if their victims do not pay within the specified time frame or opt to recover encrypted data through backups. Some attackers even sell confidential data at auction on the dark web. It is essential to know that ransomware attacks have numerous different appearances, and they show up in all shapes and sizes. There are two main categories, namely lock-screen and crypto [
8]. In the lock screen, the ransomware blocks access to the system, asserting that the system is encrypted. Lock-screen ransomware does not usually target critical files; it generally only wants to lock the user out. On the other hand, crypto ransomware encrypts data on a system, such as documents, pictures, and videos, making the content useless without the decryption key and without interfering with basic device functions. Users can see their files but cannot access them unless they pay the ransom demand, or all their files would be deleted. Some examples of Android ransomware include Android/Simplocker, Android/Lockerpin, WannaLocker, etc. [
8]. Consequently, there is a dire need to develop effective methods for detecting Android ransomware to counter this escalating danger.
Android devices come equipped with a variety of embedded sensors that measure motion, orientation, and other environmental factors. The embedded sensors are managed by the Android sensor framework. Sensors are either hardware-based or software-based. Hardware-based sensors are physical components that are integrated into a tablet or phone. They acquire their data by directly sensing certain parameters. Software-based sensors are not physical devices. Software-based sensors, also referred to as virtual or synthetic sensors, obtain their data from one or more hardware-based sensors. Three major categories of sensors (motion, environmental, position) are supported by the Android operating system. Motion sensors measure rotational force and acceleration force in three dimensions. Rotational vector sensors, gyroscopes, accelerometers, and gravity sensors are included in this category. Environmental sensors monitor a range of environmental factors, such as humidity, illumination, ambient air pressure, and temperature. Thermometers, photometers, and barometers fall under this category. Position sensors measure the physical position of a device. Magnetometers and orientation sensors fall under this category. Android sensors provide data as a series of sensor events. These embedded sensors are widely used in many functions in third-party applications. However, third-party applications can read data from embedded sensors without claiming any permissions. This may lead to security issues. Users’ privacy can be compromised by well-designed malicious applications that exploit embedded sensors. A compromised device due to a successful ransomware attack could potentially have broader security implications. If the ransomware is part of a more sophisticated attack, it might seek additional permissions or exploit vulnerabilities in the device’s operating system. This could indirectly impact various functionalities, including sensors. An attacker might attempt to manipulate the sensors for unauthorized access or surveillance. By successfully detecting ransomware attacks, the attack surface can be reduced. Additionally, this will limit unauthorized access to Android sensors.
There are different types of analyses of features for ransomware. Static analysis depends on features gathered without running any code, whereas dynamic analysis derives features based on code execution (or emulation). Static analysis of an Android application can depend on features extracted from either the manifest file or the Java bytecode. Since no code execution is necessary, static analysis is often seen to be more efficient. Meanwhile, features like dynamic code loading and system calls that are gathered while the application is running can be dealt with through dynamic analysis of an Android application. Dynamic analysis is more informative because the executed code is evaluated [
9]. Network traffic analysis within the context of dynamic analysis focuses on monitoring and analyzing the network traffic generated by an Android device to identify any suspicious patterns and malicious behaviors associated with ransomware activity. Network connections are often utilized by ransomware to transfer encryption keys, communicate with command-and-control servers, and assist in data exfiltration or payment procedures. By monitoring the data exchanged between the device and external entities, a network traffic analysis seeks to detect these fraudulent activities. Lastly, hybrid analysis is a strategy for analysis that combines static and dynamic analysis to compensate for their individual shortcomings [
10].
Since the preceding decade, substantial use of AI techniques, namely ML and DL, has been made in the cybersecurity discipline [
11,
12,
13,
14,
15,
16]. The potential of these techniques is to learn from the data that are provided and, as a result, extract valuable insights and correctly predict cases in the future. By enabling automated and intelligent analysis of intricate patterns, features, and behaviors within data, ML and DL play a significant role in malware detection [
17,
18,
19,
20,
21,
22,
23]. These approaches enable security systems to accurately detect and classify malware with high accuracy, even as malware evolves and becomes more sophisticated. An effective solution to protect users against specifically ransomware attacks is ML-based techniques [
24]. ML can be used to detect anomalous activities that are associated with ransomware attacks. ML-based security solutions can be utilized to analyze events across the network and alert administrators of the system about possible attack threats. Moreover, ML algorithms can learn and analyze past ransomware attacks data and build models that are capable of better predicting similar future attacks, which eventually helps to increase the security of systems. While ransomware has been a persistent global threat, it has continued to evolve, making traditional detection methods like signature-based approaches insufficient. As a result, researchers and security experts have turned to ML as a promising alternative for detecting and mitigating ransomware attacks. ML techniques have gained attraction in the realm of Android ransomware detection and classification [
25]. These approaches leverage features, such as network traffic patterns, system calls, and file entropy to distinguish normal behaviors from malicious activities [
26]. DL methods, in particular, have demonstrated remarkable efficacy in identifying various forms of malware, including ransomware, in addressing the dynamic nature of these threats.
While previous research has explored ML-based techniques for Android ransomware detection, there is still a need to comprehensively investigate their effectiveness and accuracy. As ransomware attacks on Android devices continue to rise, an ML-based model holds the potential to detect and prevent such attacks effectively. How effective is an ML-based model at detecting Android ransomware? This research question is crucial, as ransomware attacks on Android devices are becoming increasingly common, and an effective ML-based model can potentially help in detecting and preventing such attacks. Therefore, this study aims to assess the efficacy of ML and DL methods in identifying Android ransomware.
This study specifically concentrates on DT, SVM, KNN, an ensemble of these three algorithms (DT, SVM, KNN), FNN, and TabNet, utilizing a recent dataset readily available on Kaggle. KNN is a straightforward instance-based ML algorithm that is applied for classification and regression purposes. It categorizes data points based on the majority class of their K-nearest neighbors in the feature space [
27]. In contrast, DT is a supervised learning algorithm that constructs a tree-like structure to make decisions [
28]. SVM, on the other hand, is a robust classification and regression algorithm that identifies the hyperplane that optimally separates classes in high-dimensional space and can accommodate non-linear data through kernel functions [
29]. FNN, also recognized as a multilayer perceptron (MLP), represents an artificial neural network (ANN) with unidirectional information flow, spanning multiple layers of interconnected neurons, and it serves various ML tasks [
30]. Finally, TabNet is a specialized deep neural network model developed for tabular data, encompassing structured information commonly found in spreadsheets. It performs exceptionally well in capturing intricate relationships within the data by combining decision trees and attention mechanisms [
31]. In aligning with our comprehensive approach, we utilized an ensemble model, combining DT, SVM, and KNN models. This strategic integration allows us to harness their collective decision-making capabilities, enhancing the model’s ability to capture diverse aspects of the data and yielding robust results.
The key contributions of this paper are as follows:
Utilizing a real-world dataset comprising previously unused samples of well-known ransomware variants. This authentic dataset enhances the reliability of the evaluation, as it represents the actual scenarios encountered by users, making the results more applicable and meaningful.
Identifying the most significant traffic features that contribute to Android ransomware detection.
Introducing an ensemble model that combines the strengths of multiple ML algorithms. This ensemble approach aims to improve overall detection accuracy and robustness against evolving ransomware threats by leveraging the diverse perspectives and decision-making strategies of each individual model.
Exploring and assessing the efficacy of two DL models which have not been deployed in the existing literature in the domain of Android ransomware detection.
The remaining part of this study is organized as follows:
Section 2 provides a review of related literature in this domain.
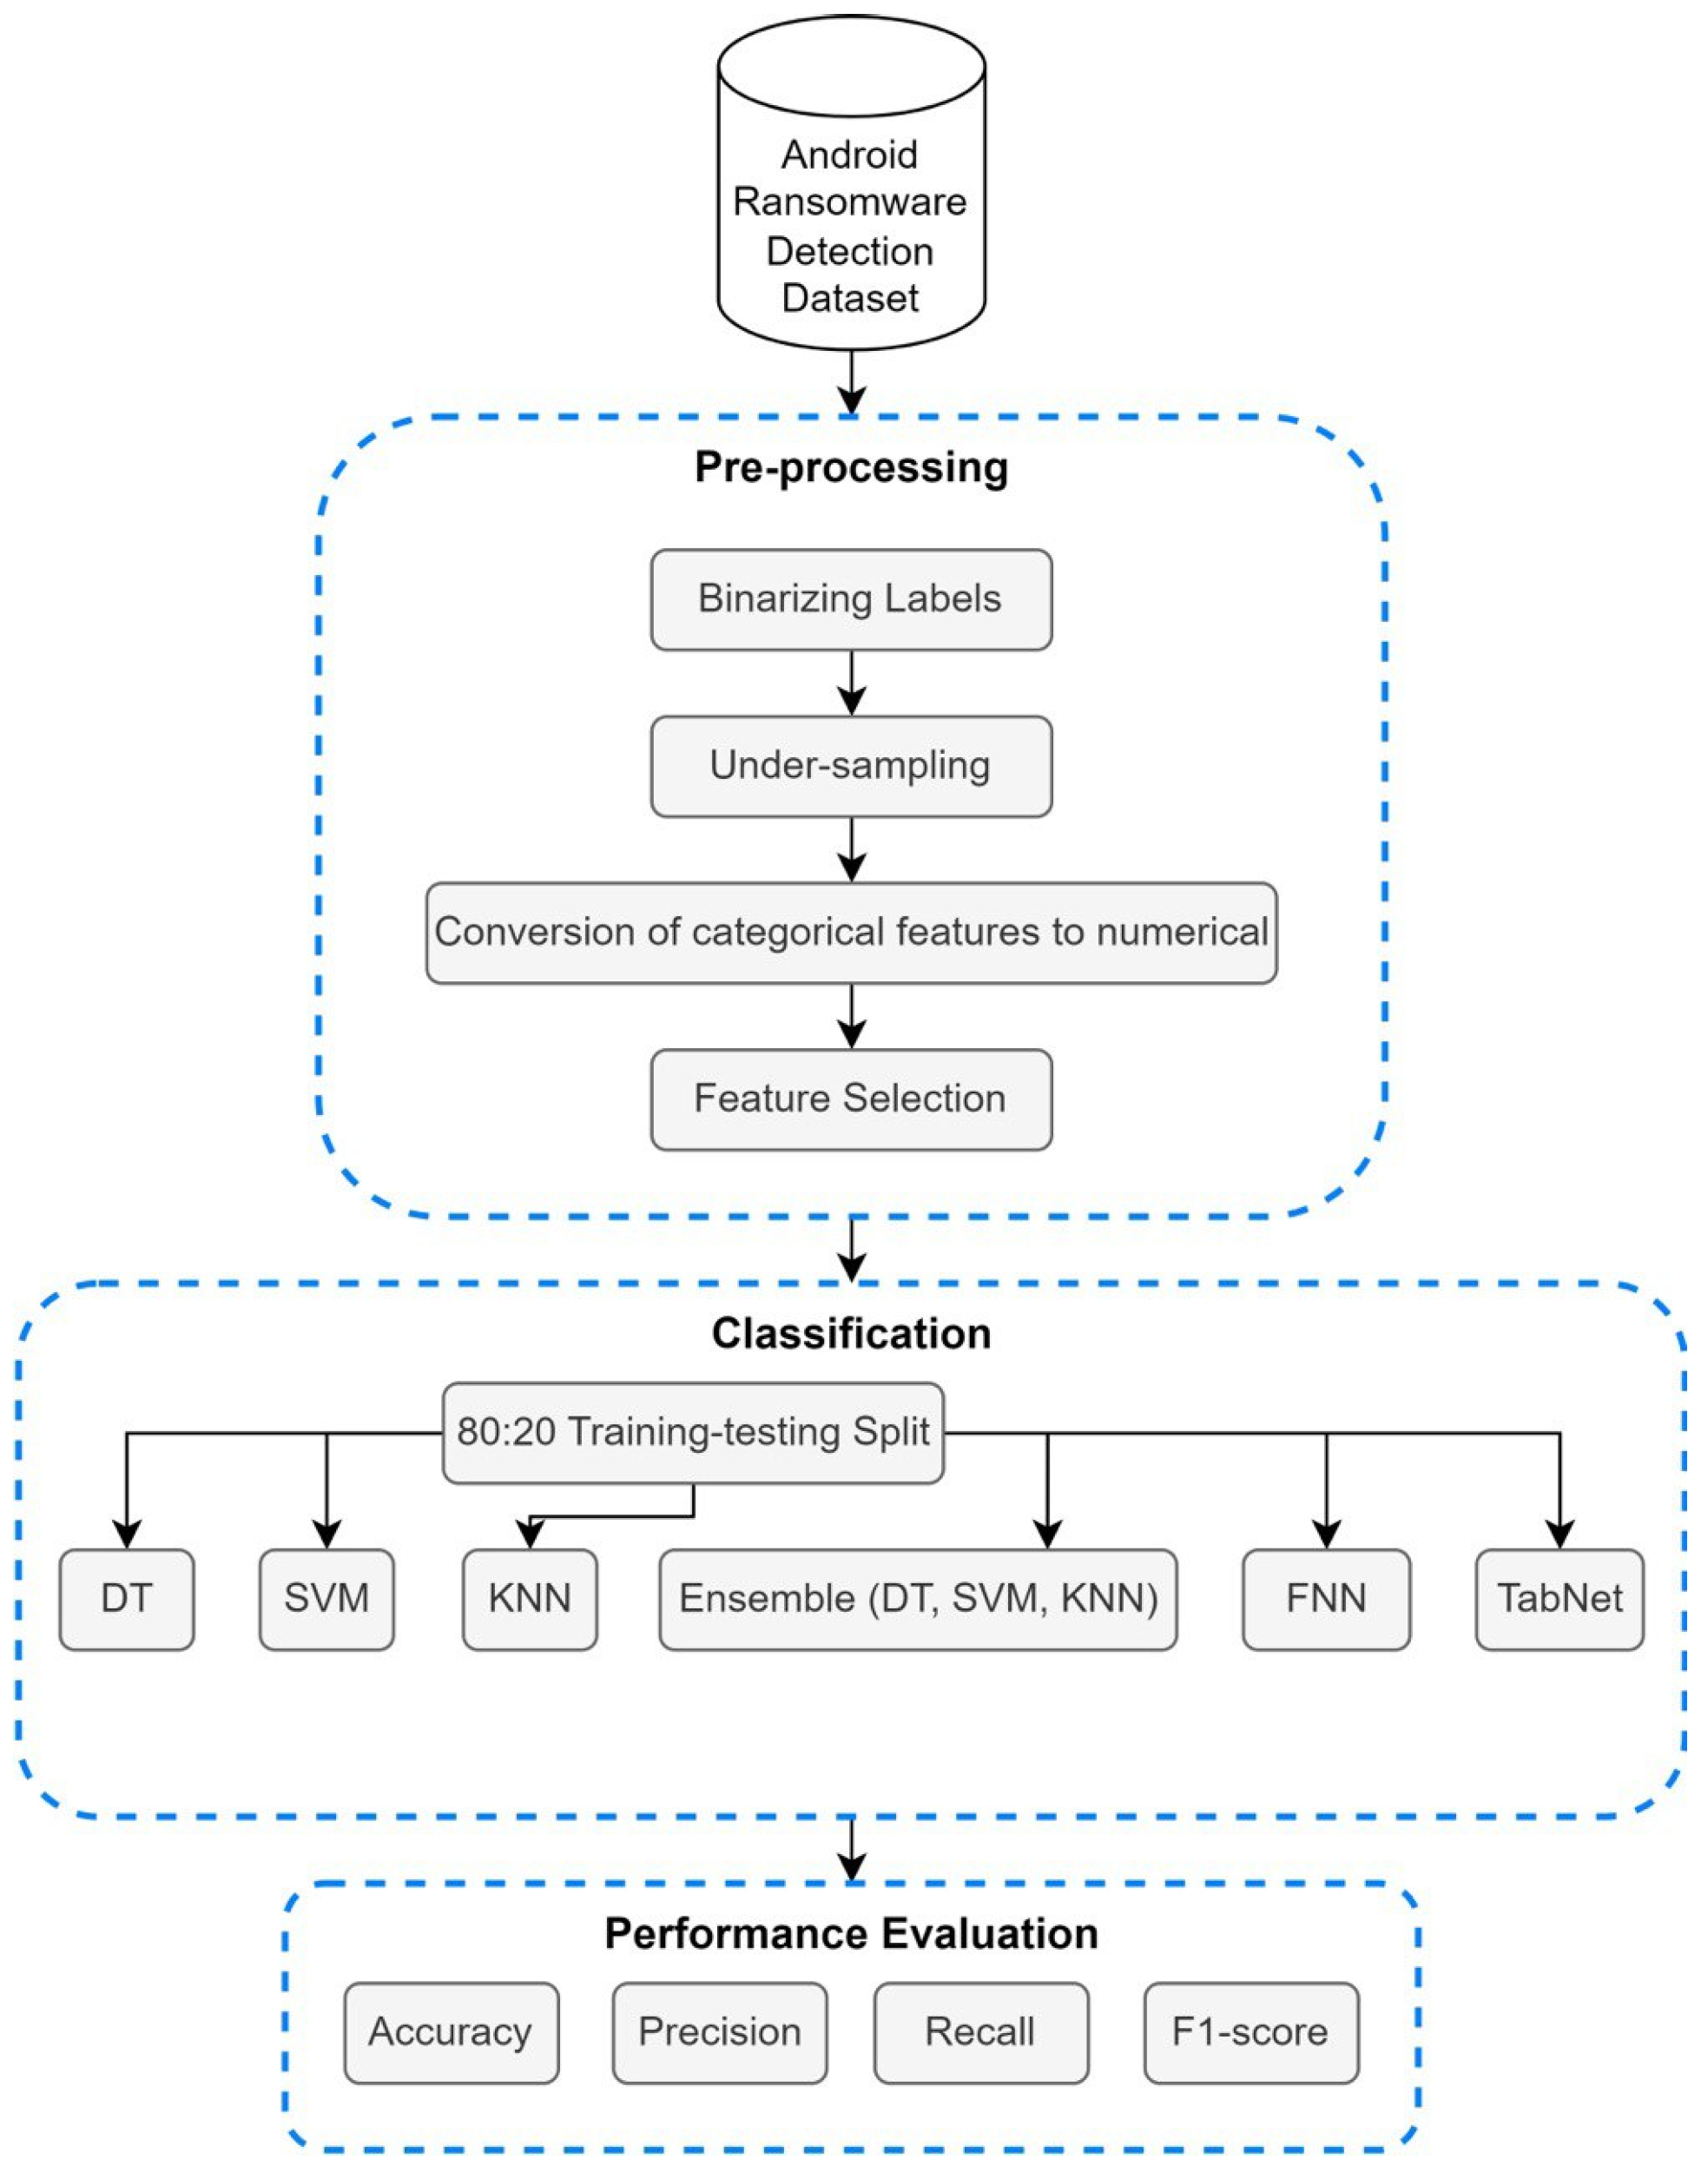
Section 3 presents the proposed methodology, including dataset description and the pre-processing phase, classification phase, and evaluation phase.
Section 4 describes the experimental setup and optimization strategies.
Section 5 presents the results and discussion.
Section 6 highlights the limitations and recommendations.
Section 7 presents the future work, while
Section 8 contains the conclusions derived from this research study.
2. Review of Related Literature
This section presents the studies in the existing literature for the time period of 2018–2022 that utilized ML and DL techniques in the domain of Android ransomware detection.
Most of the studies deployed various ML techniques. Firstly, Khammas [
32] proposed a byte-level static analysis for detecting ransomware attacks using the random forest (RF) model. A dataset consisting of 1680 executable files (840: ransomware, 840: benign) was used to train and evaluate their approach. The dataset was split into 50:50 training–testing sets with the same number of ransomware and goodware files to avoid imbalances. The proposed system used the gain ratio (GR) feature selection method to find the optimal dimension size between 1000 and 7000 features to build the RF model. It was found that constructing the RF model with 1000 features and 100 trees provided the best results in terms of time complexity and accuracy, with a prediction time of 1.37 s and an accuracy of 97.74%. A high number of trees can be considered a limitation to this study given the increased complexity related to it.
Masum et al. [
33] proposed an ML-based approach for detecting and classifying ransomware attacks using a dataset with 54 features and 138,047 samples (96,632: ransomware, 41,415: benign). Of the samples, 70% of the used dataset were ransomware and the remaining 30% were legitimate, showing a clear imbalance issue. However, the authors focused on feature selection methods, including the variance threshold and variance inflation to eliminate low-variant and highly correlated features. Eventually, 12 features were selected to examine five different algorithms, namely decision tree (DT), RF, naive Bayes (NB), logistic regression (LR), and ANN for classification. The results demonstrated that the RF classifier outperformed the other models by achieving the highest accuracy of 99%, recall of 97%, F-beta of 97%, and precision of 99%.
Victoriano [
34] and Ferrante et al. [
35] employed the HelDroid dataset to distinguish Android ransomware from other malware. In Victoriano’s work, the dataset initially contained 1923 Android applications, and feature extraction resulted in 11 features. Utilizing DT, RF, gradient boosting (GB), and Adaboost classifiers, the DT classifier stood out with the highest accuracy of 98.8% and a low false positive rate (FPR) of 0.2%. Building on this dataset, Ferrante et al. proposed a hybrid system for ransomware detection, classifying 50 features with the J48, NB, and LR algorithms. The hybrid system achieved a precision of 100% and an FPR less than 4%, emphasizing the importance of combining static and dynamic analyses. Both studies highlight the need for more extensive and diverse datasets to validate the effectiveness of their approaches in covering all ransomware and legitimate applications.
Alsoghyer et al. [
36] aimed to provide a comprehensive solution to tackle the increasing threat of Android ransomware. The dataset collected from different sources consisted of 1000 applications (500: ransomware, 500: benign). The authors used 116 permissions as a feature obtained through static analysis. Four ML models were used for classification, namely RF, J48, NB, and sequential minimal optimization (SMO). RF outperformed, with an accuracy of 96.9%. The proposed model had the potential to be a valuable addition to the existing ransomware detection systems. However, a limitation to be addressed is the effectiveness of this model, which may be reduced if ransomware creators find ways to bypass the requested permissions or if new types of ransomware emerge that require different detection methods. Further research is needed to address these potential limitations and improve the overall security of Android devices.
Consequently, Alzahrani et al. [
37] presented a new computerized, lightweight approach known as RanDroid for identifying and mitigating ransomware threats on Android devices based on static and dynamic analyses. RanDroid extracted images and text to determine the existing locking screens or threatening notes. The authors used a dataset of 1450 applications (950: ransomware, 500: benign). NB was used for classification, which achieved an accuracy of 91%. This study provided promising results for using NB in detecting ransomware, but further work is needed to enhance its accuracy and expand its capabilities. Additionally, incorporating advanced techniques such as natural language processing (NLP) and spelling auto-correction can improve the model’s performance.
Additionally, Abdullah et al. [
38] presented an Android ransomware detection approach utilizing dynamic analysis. The authors combined a public dataset, namely VirusTotal, and benign applications from Google Play. Eventually, it consisted of 800 applications (400: ransomware, 400: benign). A total of 52 system calls were obtained as features through dynamic analysis. Three ML models were used for classification, namely RF, J48, and NB. RF outperformed, with a true positive rate (TPR) of 98%, FPR of 1.6%, and accuracy of 98.31%.
Almomani et al. [
39] proposed a ransomware detection approach for Android Version 11, API Level 30. The authors used crawlers for benign applications from Google Play, while ransomware applications were collected from the public dataset RansImDS-API & Permissions. A total of 302 permissions and API package calls were considered as features and used to parse 1000 applications (500: ransomware, 500: benign). Furthermore, GR was applied to select the top 225 features. The ML classifiers utilized were RF, DT, SMO, and NB. Comparatively, RF obtained the highest performance, with an accuracy of 98.2%, recall of 99%, and precision of 97.4%. It was found that in terms of size, DT was the least complex model.
However, Gera et al. [
40] suggested a hybrid approach for detecting and eliminating Android ransomware. To extract the dominant feature set, this study utilized a brand-new dominant feature selection algorithm, which eventually selected the 60 most dominant and predictive features in the set. They collected 3249 application samples (1763: ransomware, 1486: benign). They used multiple classifiers during their experiment, such as J48, logistic model tree (LMT), RF, and random tree (RT). The study’s findings demonstrated that their hybrid approach had a 99.85% accuracy rate for detecting Android ransomware. Utilizing the suggested dominant feature selection method to choose the most relevant features was found to significantly improve classification. However, there were several limitations in this study as well, including the small sample size and lack of variety in the ransomware families examined.
Interestingly, a scalable framework known as an application programming interface-based ransomware detection system (API-RDS) was developed by Alsoghyer et al. [
4] to detect ransomware applications. A dataset of 1000 applications (500: ransomware, 500: benign) was utilized for HelDroid and RansomProper projects, Virus Total, Koodous, and Google Play. With the help of the Weka platform, the API-RDS predictive model was built. The feature vector consisted of 174 features of API package calls belonging to Android API 27. Consequently, the data were partitioned using the 10-fold cross-validation technique. The classifiers RF, SMO, J48, and NB were deployed in the first experiment. RF outperformed, with an accuracy of 97%, area under the curve (AUC) of 99.5%, and kappa of 94%. Furthermore, in the second experiment, the framework successfully detected 96% of unseen ransomware samples and 97% of unseen benign samples, with an overall accuracy of 96.5%. It was discovered that java.lang with an average of 15,928.96 calls was the most commonly requested and used package in ransomware applications.
Additionally, a model was presented by Bagui et al. [
41] for an Android ransomware intrusion detection system. A dataset consisting of 10,854 samples (4354: ransomware, 6500: benign) was utilized from CICAndMal2017. Ten ransomware families consisting of 80 features were considered and fed into the models. Three classifiers, J48, NB, and OneR, were deployed. J48 showed the best results, with a precision of 75.76%, recall of 75.73%, and F-score of 75.7%. Moreover, using the J48 classifier provided a decreased execution time with a lower number of attributes. The top 10 attributes in each of the ten ransomware families were found to include Init Win bytes backward and Init Win bytes forward.
Sharma et al. [
42,
43,
44] collaborated using the RansomProber dataset for their Android ransomware detection studies. In their initial work, the RansomDroid framework employed unsupervised ML on 2300 Android package kits (APKs), achieving a 98.08% accuracy using the Gaussian mixture model (GMM). Extending their research to detect locker and crypto ransomware, they achieved a 99.59% accuracy on a dataset of 4076 applications utilizing the LR model. In a subsequent study, the authors developed a framework for classifying benign and malicious Android apps. Using a dataset of 4721 applications, the ensemble RF model achieved an accuracy rate of 99.67% in the binary classification task, demonstrating its potential for real-time identification of ransomware apps on Android-based handsets. The feature set comprised 1045 features across these studies.
Almomani et al. [
45] proposed a novel approach to ransomware identification that relies on an ML technique that is based on evolution. The suggested method’s synthetic minority oversampling technique (SMOTE-tBPSO-SVM) employed the BPSO as the optimization and search algorithm and the linear SVM for classification and detection. They collected 10,153 application samples (500: ransomware, 9653: benign) from different data sources. Using 182 permissions and API calls as features, the performance of the suggested approach SMOTE-tBPSO-SVM outperformed conventional ML algorithms in terms of sensitivity (96.4%), specificity (99.9%), and g-mean (97.5%).
To address the limitations of the low detection accuracy and high computational complexity in existing solutions for Android ransomware detection, Hossain et al. [
46] proposed a new method based on traffic analysis. The proposed method used the CICAndMal2017 dataset, which contains 84 features for four types of malwares, including ten types of ransomware attacks. Pre-processing techniques were applied to normalize and oversample the benign traffic, which resulted in a dataset of 402,834 instances. Afterward, a core step in this study employed particle swarm optimization (PSO) to select traffic features for binary (26) and multi-class (23) classification. Multiple experiments were applied, analyzed, and compared using DT and RF classifiers and different subsets of the selected features to perform detection on two levels: binary classification as ransomware or benign or multi-class classification of the ten types of ransomware traffic. RF showed the best performance in detecting ransomware, with an accuracy of 81.58%, whereas DT was found to be the best for multi-class classification.
Lastly, only one study employed DL, using the same dataset as [
46]. Bibi et al. [
47] proposed a DL-based method for ransomware detection in an Android environment by using an LSTM model. In the pre-processing phase, eight feature selection techniques were applied using the WEKA tool, and the most predictive 19 features were selected. A balanced 40,000 samples (20,000: benign, 20,000: ransomware) were considered for experimentation. They split the data into 80:20 training–testing sets. Then, numerous evaluation metrics were used to assess the performance of the model. The proposed model achieved an accuracy of 97.08% and is claimed to be capable, scalable, and proficient to detect ransomware attacks when placed at the Kernel of the Android OS.
Table 1 provided below presents a summary and comparison of the reviewed studies in the existing literature concerning the detection of Android ransomware, focusing on a wide range of ML [
32,
33,
34,
35,
36,
37,
38,
39,
40,
41,
42,
43,
44,
45,
46] and DL [
47] techniques, datasets utilized, number of samples, type of classification task (binary, multi-class), best-performing technique, and ultimately, the highest accuracy achieved in these studies.
Based on the reviewed literature, we found that a few limitations were more common and frequent than others. For instance, 71% of the studies had a small sample size issue [
4,
32,
34,
35,
36,
37,
38,
39,
40,
42,
43,
44]. All these studies had a sample size below 5 K, which, in consequence, has led these studies to apply ML techniques instead of DL, as the number of samples is not sufficient to build a DL model. We can remark that out of all the studies, only one study employed DL [
47]. Only one study utilized unsupervised ML [
42] as well. The reliance on anti-virus vendors to provide explicit labels to researchers can be an issue, especially when considering applying real-time solutions to detect Android ransomware attacks. Therefore, dependence on historical examples can cause the models to perform poorly when introducing an unknown attack, which can be resolved using unsupervised learning. Despite the excellent performance provided by DL models and unsupervised techniques, they are not adequately explored in recent literature. Therefore, there is an open area for research in applying DL and unsupervised solutions to Android ransomware detection. Although ML can be a viable solution in many cases, the dataset size is a critical factor. In this context, exploring the potential of DL becomes particularly relevant for its ability to handle complex patterns and relationships within the data, which may lead to more robust Android ransomware detection solutions that are especially noteworthy, as DL models are known for their scalability. This is why they can handle large datasets. Moreover, the curse of dimensionality was a common limitation for most of the studies [
32,
35,
36,
38,
39,
40,
41,
42,
43,
44,
45]. These studies included 50 or more features in their experiments, which can be computationally expensive. Highly dimensional data can lead to increased complexity of the models utilized, as well as making the interpretation of the results challenging. Additionally, models built with high-dimensional data have a higher risk of overfitting, thereby being less reliable. Some studies have applied feature selection, but the number of features remained high. Furthermore, many studies [
33,
34,
35,
37,
40,
41,
42,
43,
44,
45,
46] have an imbalanced distribution of class labels, which is common in anomaly detection problems. The “anomaly” cases tend to be much less than regular/normal cases. However, this issue must be resolved by under-sampling the majority class to be even with the minority class. Despite losing valuable data, this solution increases the performance and reliability of the models, as imbalanced data can lead to overfitting or bias. Notably, we can see that almost all the studies worked on binary classification instead of multi-class classification, except [
46], which did both. Binary classification is an advantage, since binary classifiers have higher convergence rates. Moreover, few studies have explored the potential of traffic analysis [
41,
46,
47], regardless of its promising results.
In this study, we aim to address these limitations by utilizing a large dataset based on traffic analysis to solve data imbalance issues. We shall fill the gap in the literature by deploying an ensemble model and two DL models which have not been deployed in the existing literature, in addition to other ML models. A smaller set of features shall be used to overcome the curse of dimensionality and reduce computational complexity. This will provide a cutting-edge solution to Android ransomware detection.
5. Results and Further Discussion
In the two experiments conducted, four evaluation metrics—accuracy, precision, recall, and F1-score—were recorded, and the models were evaluated using them.
Table 5 shows the results obtained for the DT, SVM, KNN, ensemble model of (DT, SVM, KNN) with random_state = 42, FNN, and TabNet models for experiment 1 and experiment 2. In experiment 1, all 70 features were utilized. In experiment 2, the best 19 features were utilized. In terms of accuracy, the highest accuracy of 97.24% was achieved by DT, followed by Ensemble, FNN, SVM, TabNet, and lowest by KNN of 88.43%. In terms of precision, DT achieved the highest value, i.e., 98.50%, and lowest of 88.96% by TabNet. Recall is a metric that accesses the model’s sensitivity by quantifying the model’s ability to correctly identify positive instances from the total number of actual positive instances in the dataset. Therefore, recall is an important evaluation metric for our specific problem. All the models showed a recall greater than 97%. The SVM achieved an outstanding recall of 100%, and TabNet showed the least, i.e., 97.28%. Taking the F1-score into consideration, the DT model achieved the highest score of 98.45%, and the lowest was 93.77% by KNN.
The DT and FNN model showed better performance in experiment 2, i.e., after feature selection. In the case of SVM, it can be seen that the results obtained before and after feature selection remained the same. SVM automatically takes feature importance into account while building a model. It looks for the optimum hyperplane that maximizes the separation between the data points from various classes. Higher weights are assigned to features that contribute more to class separation. This characteristic of SVM can reduce the need for explicit feature selection. Moreover, another possibility could be due to the curse of dimensionality. SVM usually handles large datasets with numerous features well. It effectively performs in high-dimensional spaces. It is able to deal with inherent noise and redundancy in high-dimensional feature spaces; therefore, feature selection may not be highly critical in such cases. KNN experienced a slight decrease in performance in experiment 2 after applying feature selection techniques. Regarding the ensemble model, despite it being able to learn and automatically extract the most relevant features without the need for explicit feature selection, the performance marginally decreased. TabNet’s performance declined to some extent in experiment 2 after feature selection. An infographic shown in
Figure 4 has been provided for a better visualization and comparison of the results of all the models.
The confusion matrices for DT shown in
Figure 5 and
Figure 6 were analyzed. The correct identification of benign Android network traffic is considered a TN; however, correct identification of Android ransomware traffic is a TP. Incorrect identification of benign network traffic as ransomware is a FN, and incorrect identification of ransomware as benign network traffic is a FP. If a model has more TPs and TNs (or fewer FNs and FPs), it is considered more accurate. In the figures for the results of the DT classifier, we can see that the numbers of instances of TPs and TNs are more. It achieved the highest accuracy, precision, and F1-score. The DT model is effective for binary classification and was able to handle a large numerical values dataset. Before the optimization, the DT model achieved an accuracy of 97.23%, precision of 98.50%, recall of 98.39%, and an F1-score of 98.44%. However, through the application of hyperparameter tuning using grid search, minor improvements were observed in the model’s performance. The optimized DT model (with 19 features) exhibited an accuracy of 97.24%, precision of 98.50%, recall of 98.40%, and an F1-score of 98.45%. These results clearly demonstrate the effectiveness of hyperparameter tuning in enhancing the overall performance of DT.
Overall, the DT performed the best in terms of accuracy, precision, and F1-score while requiring the shortest execution time of 3–4 min. The DT is good at capturing non-linear relationships and handling complex feature interactions. Among the ML models, SVM required the longest execution time of 1 h and 30 min but gave the best recall of 100%. This can be considered a major drawback in real-time attack detection. However, SVM is powerful in finding optimal hyperplanes for separating classes in high-dimensional spaces. KNN is effective in identifying local patterns and can handle diverse data distributions. In the existing literature, only two studies used ensemble models. Sharma et al. [
44] used an RF ensemble model, and Almomani et al. [
45] combined BPSO, SVM, and SMOTE. Ferrante et al. [
35] and Gera et al. [
40] made use of a hybrid model. J48, NB, and LR were combined by Ferrante et al. [
35]. RF, J48, LR, and RT were combined by Gera et al. [
40]. This shows that ensemble models have not been explored enough in the domain of Android ransomware detection, emphasizing the need for further investigation into the potential benefits for enhanced model performance. Examining ensemble learning in this context proves to be significant, as it allows us to leverage the strengths of multiple base models, enhancing the overall effectiveness of the ransomware detection system. This was the primary driving force to carry out an experiment to highlight the diversity among the base models (DT, SVM, KNN) and implement hard voting to build an ensemble model. Each model individually has its own strengths and weaknesses. Therefore, in order to fill the existing gap in literature, we utilized an ensemble model. By combining the DT, SVM, and KNN models using hard voting, it was seen that we are able to benefit from their collective decision-making and increase the chance of capturing different aspects of the data, thereby acquiring good results. The proposed ensemble model was able to perform well on our utilized large dataset. The studies in the literature that used ensemble models achieved an accuracy of >99%. However, they used small datasets, which had the data imbalance issue; therefore, there is a possibility that these models suffered from overfitting. Recall is an important evaluation metric with respect to the specific problem being addressed in this study. The proposed ensemble model achieved a very high recall of 99.93%, with only 19 best features.
The results achieved by the two DL models are assessed and compared. FNN was used, as it is more suitable for the data type present in the used dataset. Moreover, we deployed it for our tabular dataset because our dataset size was large enough, i.e., approximately 90 K. It achieved a recall of 99.95%, which demonstrates that DL models which have not been sufficiently explored in the literature hold the capacity to show remarkable performance. FNN is considered as an out-of-date and a simple three-layer model, whereas TabNet is seen as a state-of-the-art model. Nonetheless, FNN demonstrated a better accuracy, precision, and F1-score than TabNet. FNN showed robust performance with all the features and the best 19 features. TabNet performed well with all the features, but with the best 19 features, there was a noticeable drop in its performance. When comparing the nature of the models, the FNN model can be adapted using various data modalities including images, text, and sequences. On the other hand, TabNet is specifically designed for tabular datasets, making it well-suited for our dataset. In terms of execution time, FNN required less than 1 h, whereas TabNet required a longer period of 6.5 h. Furthermore, by parallelizing the code, it was only reduced to 4 h. Given the nature of the dataset utilized and the need to obtain timely results, FNN emerges as the preferable choice due to its quick execution, aligning well with the requirements for rapid and efficient performance in our chosen research subject. Despite FNN being considered outdated, its practicality in meeting the specific demands of our research subject outweighs TabNet. This emphasizes the importance of considering model relevance and applicability over recency in certain contexts.
In terms of quantitative evaluation, the FPR values for KNN, the ensemble model, FNN, and TabNet are high. These models are incorrectly predicting a certain number of instances as ransomware when those instances are benign. However, all the models have extremely low false negative rate (FNR) values, emphasizing their efficacy in detecting ransomware instances. A low FNR is crucial in the context of security, as missing a true ransomware threat could have severe consequences.
In the context of Android ransomware detection, this study primarily focused on the analysis of network traffic data. However, it is noteworthy that Android devices come equipped with diverse built-in sensors, such as accelerometers, gyroscopes, proximity sensors, microphones, and temperature sensors. By implementing a security solution for ransomware detection, this study extends to protect not only the device’s core functionalities but also the Android sensors. Although our current work did not involve the integration of sensor data, the potential role of sensors in enhancing ransomware detection deserves attention. Sensors can provide valuable insights into the physical context and user interactions with the device. In addition to enhancing the accuracy and adaptability of ransomware detection systems against emerging threats, the combination of network traffic analysis and sensor data holds promises for establishing a dynamic and resilient defense mechanism.
Lastly, it is essential to consider the comparative findings from previous research. For instance, in the study referenced as [
34], DT achieved an accuracy rate of 98.8% with 1923 records. In contrast, our study, which employed a dataset encompassing 392,035 records, attained a commendable accuracy rate of 97.24%. Turning our attention to ensemble models, ref. [
44] demonstrated remarkable success, achieving a high accuracy of 99.67% when utilizing a dataset consisting of 4721 records. Similarly, in ref. [
45], an exceptional accuracy of 99.9% was recorded using a dataset comprising 10,153 records. Within the scope of our study, employing a substantial dataset of 392,035 records, we achieved a competitive accuracy level of 90.4%. These comparative findings accentuate the pivotal role played by dataset size in influencing the performance of ML models.
8. Conclusions
In recent times, Android has been experiencing an upsurge in terms of devices, users, and technology, making our day-to-day activities simpler and faster. Nevertheless, ease often accompanies insecurity, which raises many privacy and security concerns. These concerns mainly include cyberattacks, which require very careful handling. In order to address the above-mentioned concerns, this research study attempted to fulfil the current need and aimed to detect Android ransomware attacks by using ML- and DL-based techniques. Firstly, an inclusive literature review was provided to showcase the existing studies in order to analyze gaps and find new research directions. A very recent Android ransomware detection dataset, 2023 from Kaggle, was utilized to carry out two experiments. As part of data pre-processing, a randomized under-sampling technique was adopted to resolve the dataset imbalance. After data pre-processing, feature selection was applied, using forward feature selection and feature importance. A total of 19 features were found to be crucial for analysis and attack identification. After feature selection, a dataset split of 80:20 was performed for training and testing. Two experiments were conducted by deploying DT, SVM, KNN, an ensemble model of (DT, SVM, KNN), FNN, and TabNet. In experiment 1, all 70 features were utilized. In experiment 2, the best 19 features were utilized. The performance of these models was calculated in terms of accuracy, precision, recall, and F1-score. As a result, DT outperformed, with an accuracy of 97.24%, precision of 98.50%, and F1-score of 98.45%. The highest recall of 100% was obtained using the SVM model. The confusion matrices for the DT were also analyzed. The findings of this study contribute to advancing the field of Android ransomware detection by providing valuable insights and securing Android devices in the face of evolving cyber threats.


 ,
, 


