
Robust Point Cloud Registration for Aircraft Engine Pipeline Systems


Abstract
1. Introduction
- We present a fully automated registration framework that enables the acquisitionof accurate and complete point clouds of aircraft engine pipeline systems forinspection purposes.
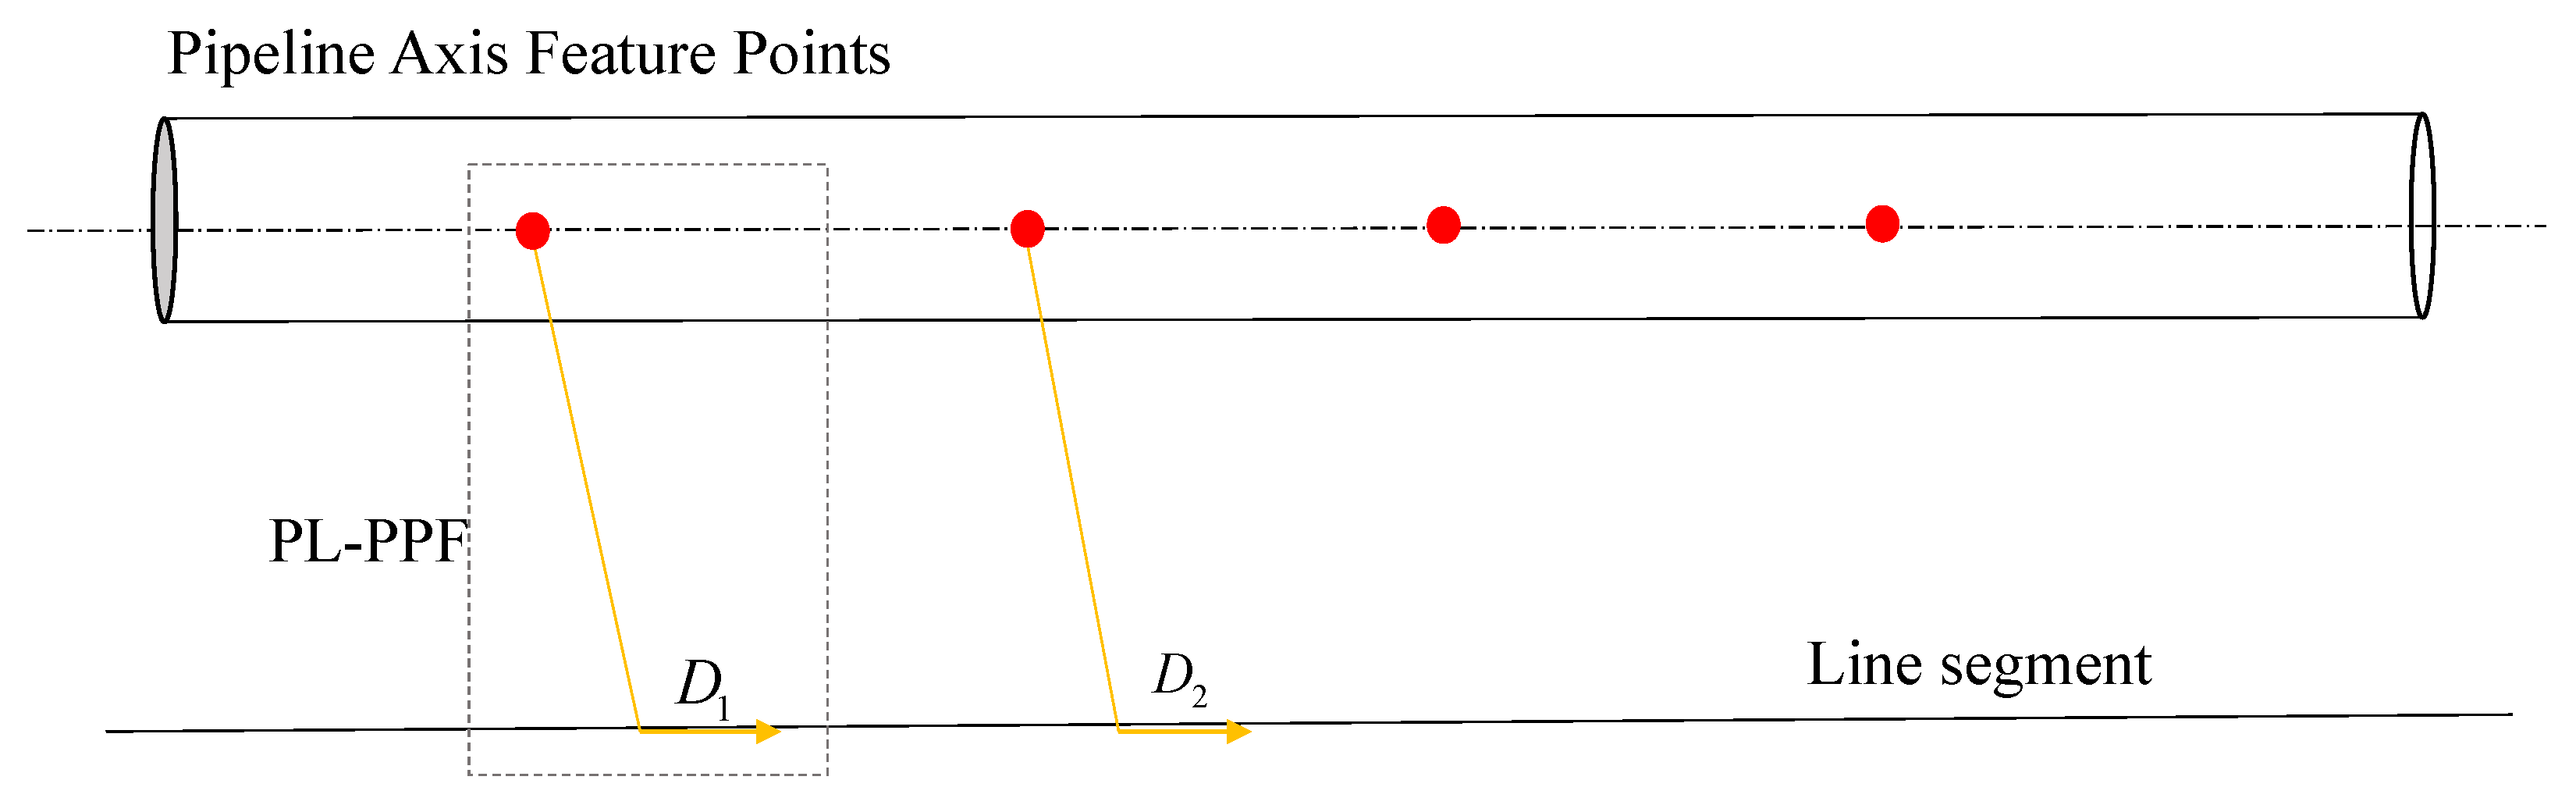
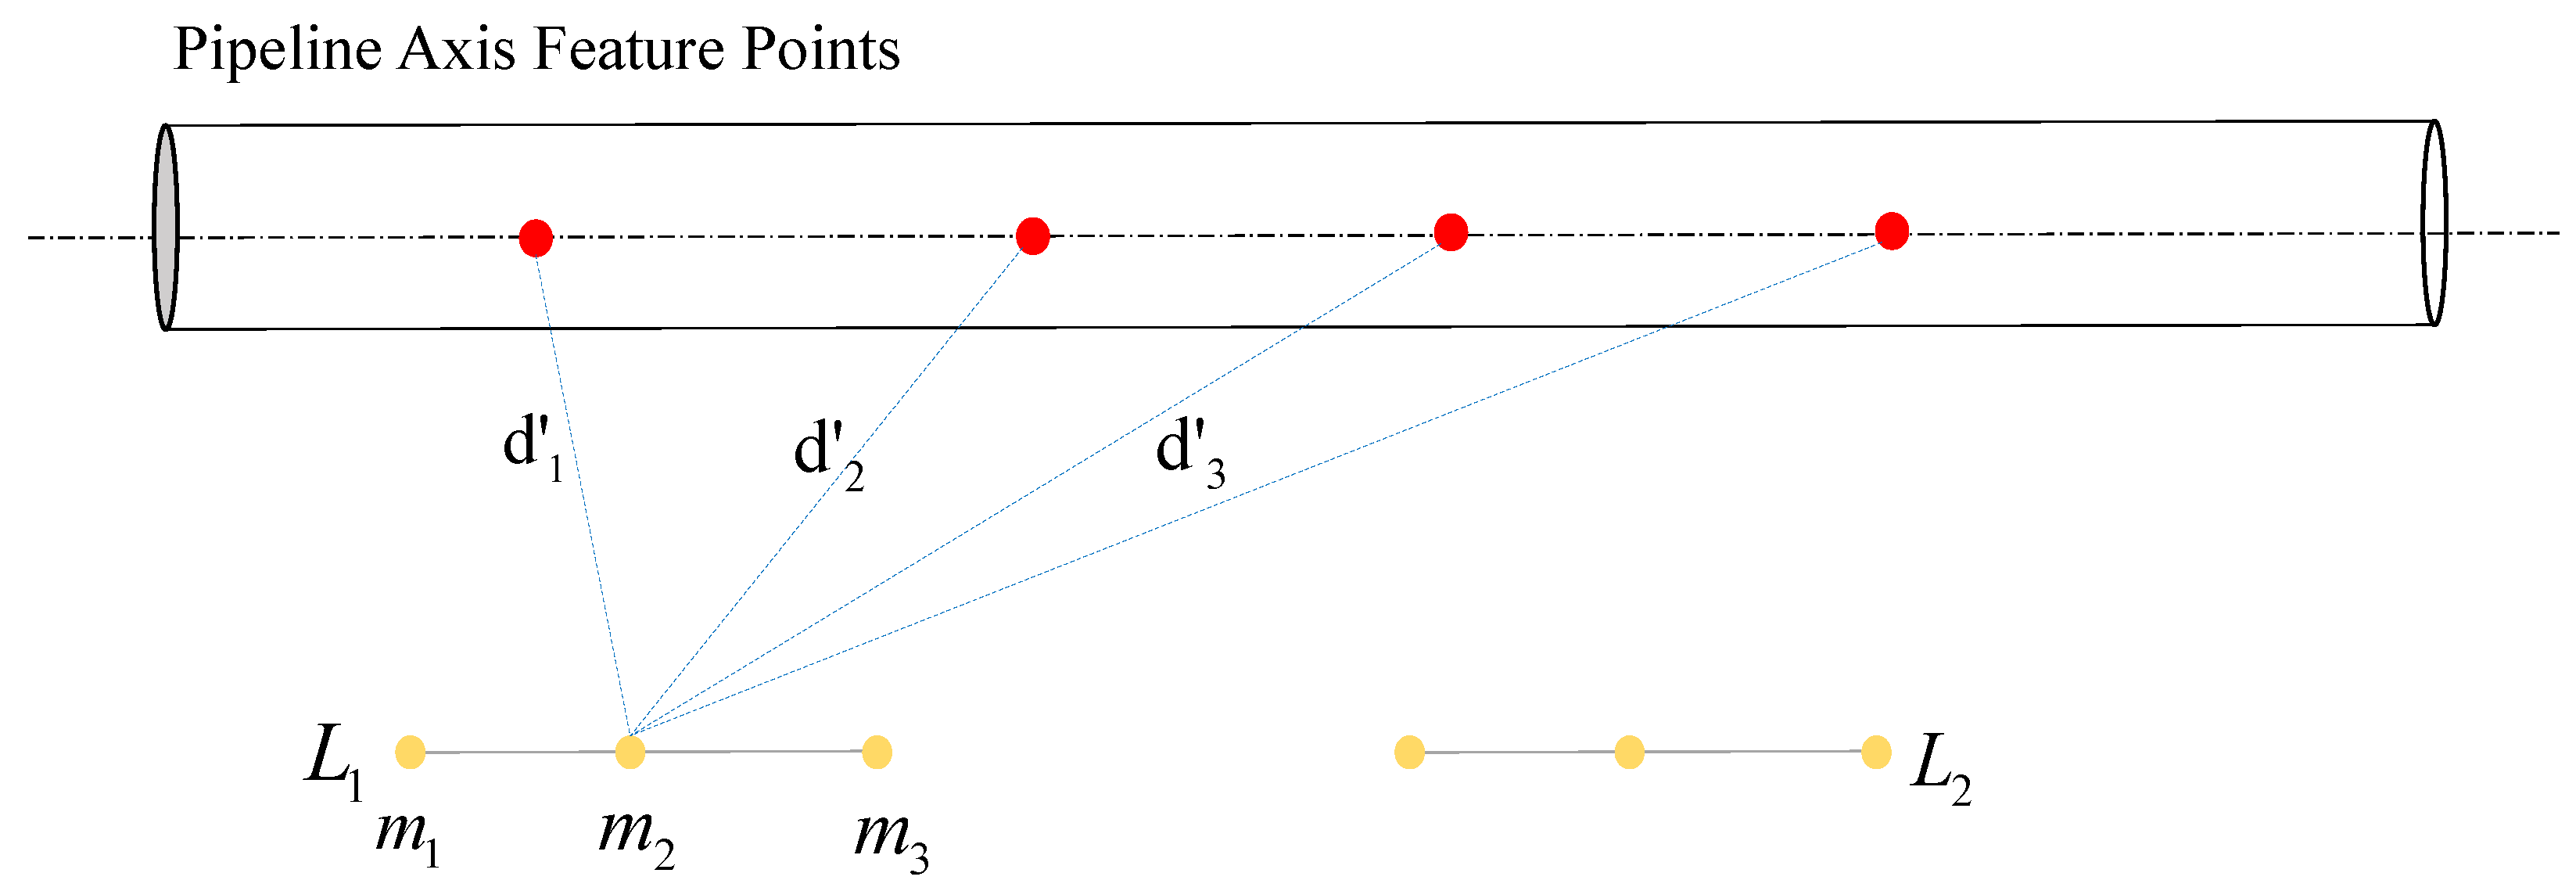
- We introduce a novel 3D point pair feature descriptor, called PL-PPFs, which effectively captures the characteristics of pipelines and engine assembly features in the aircraft pipeline system.
- We propose an effective evaluation strategy, referred to as ambiguity elimination, to select the most suitable combinations of point and line features in PL-PPFs, reducing ambiguities and improving the accuracy of the registration process.
2. Related Work
2.1. Optimization-Based Methods
2.2. Feature-Based Point Matching
2.3. End-to-End Learning
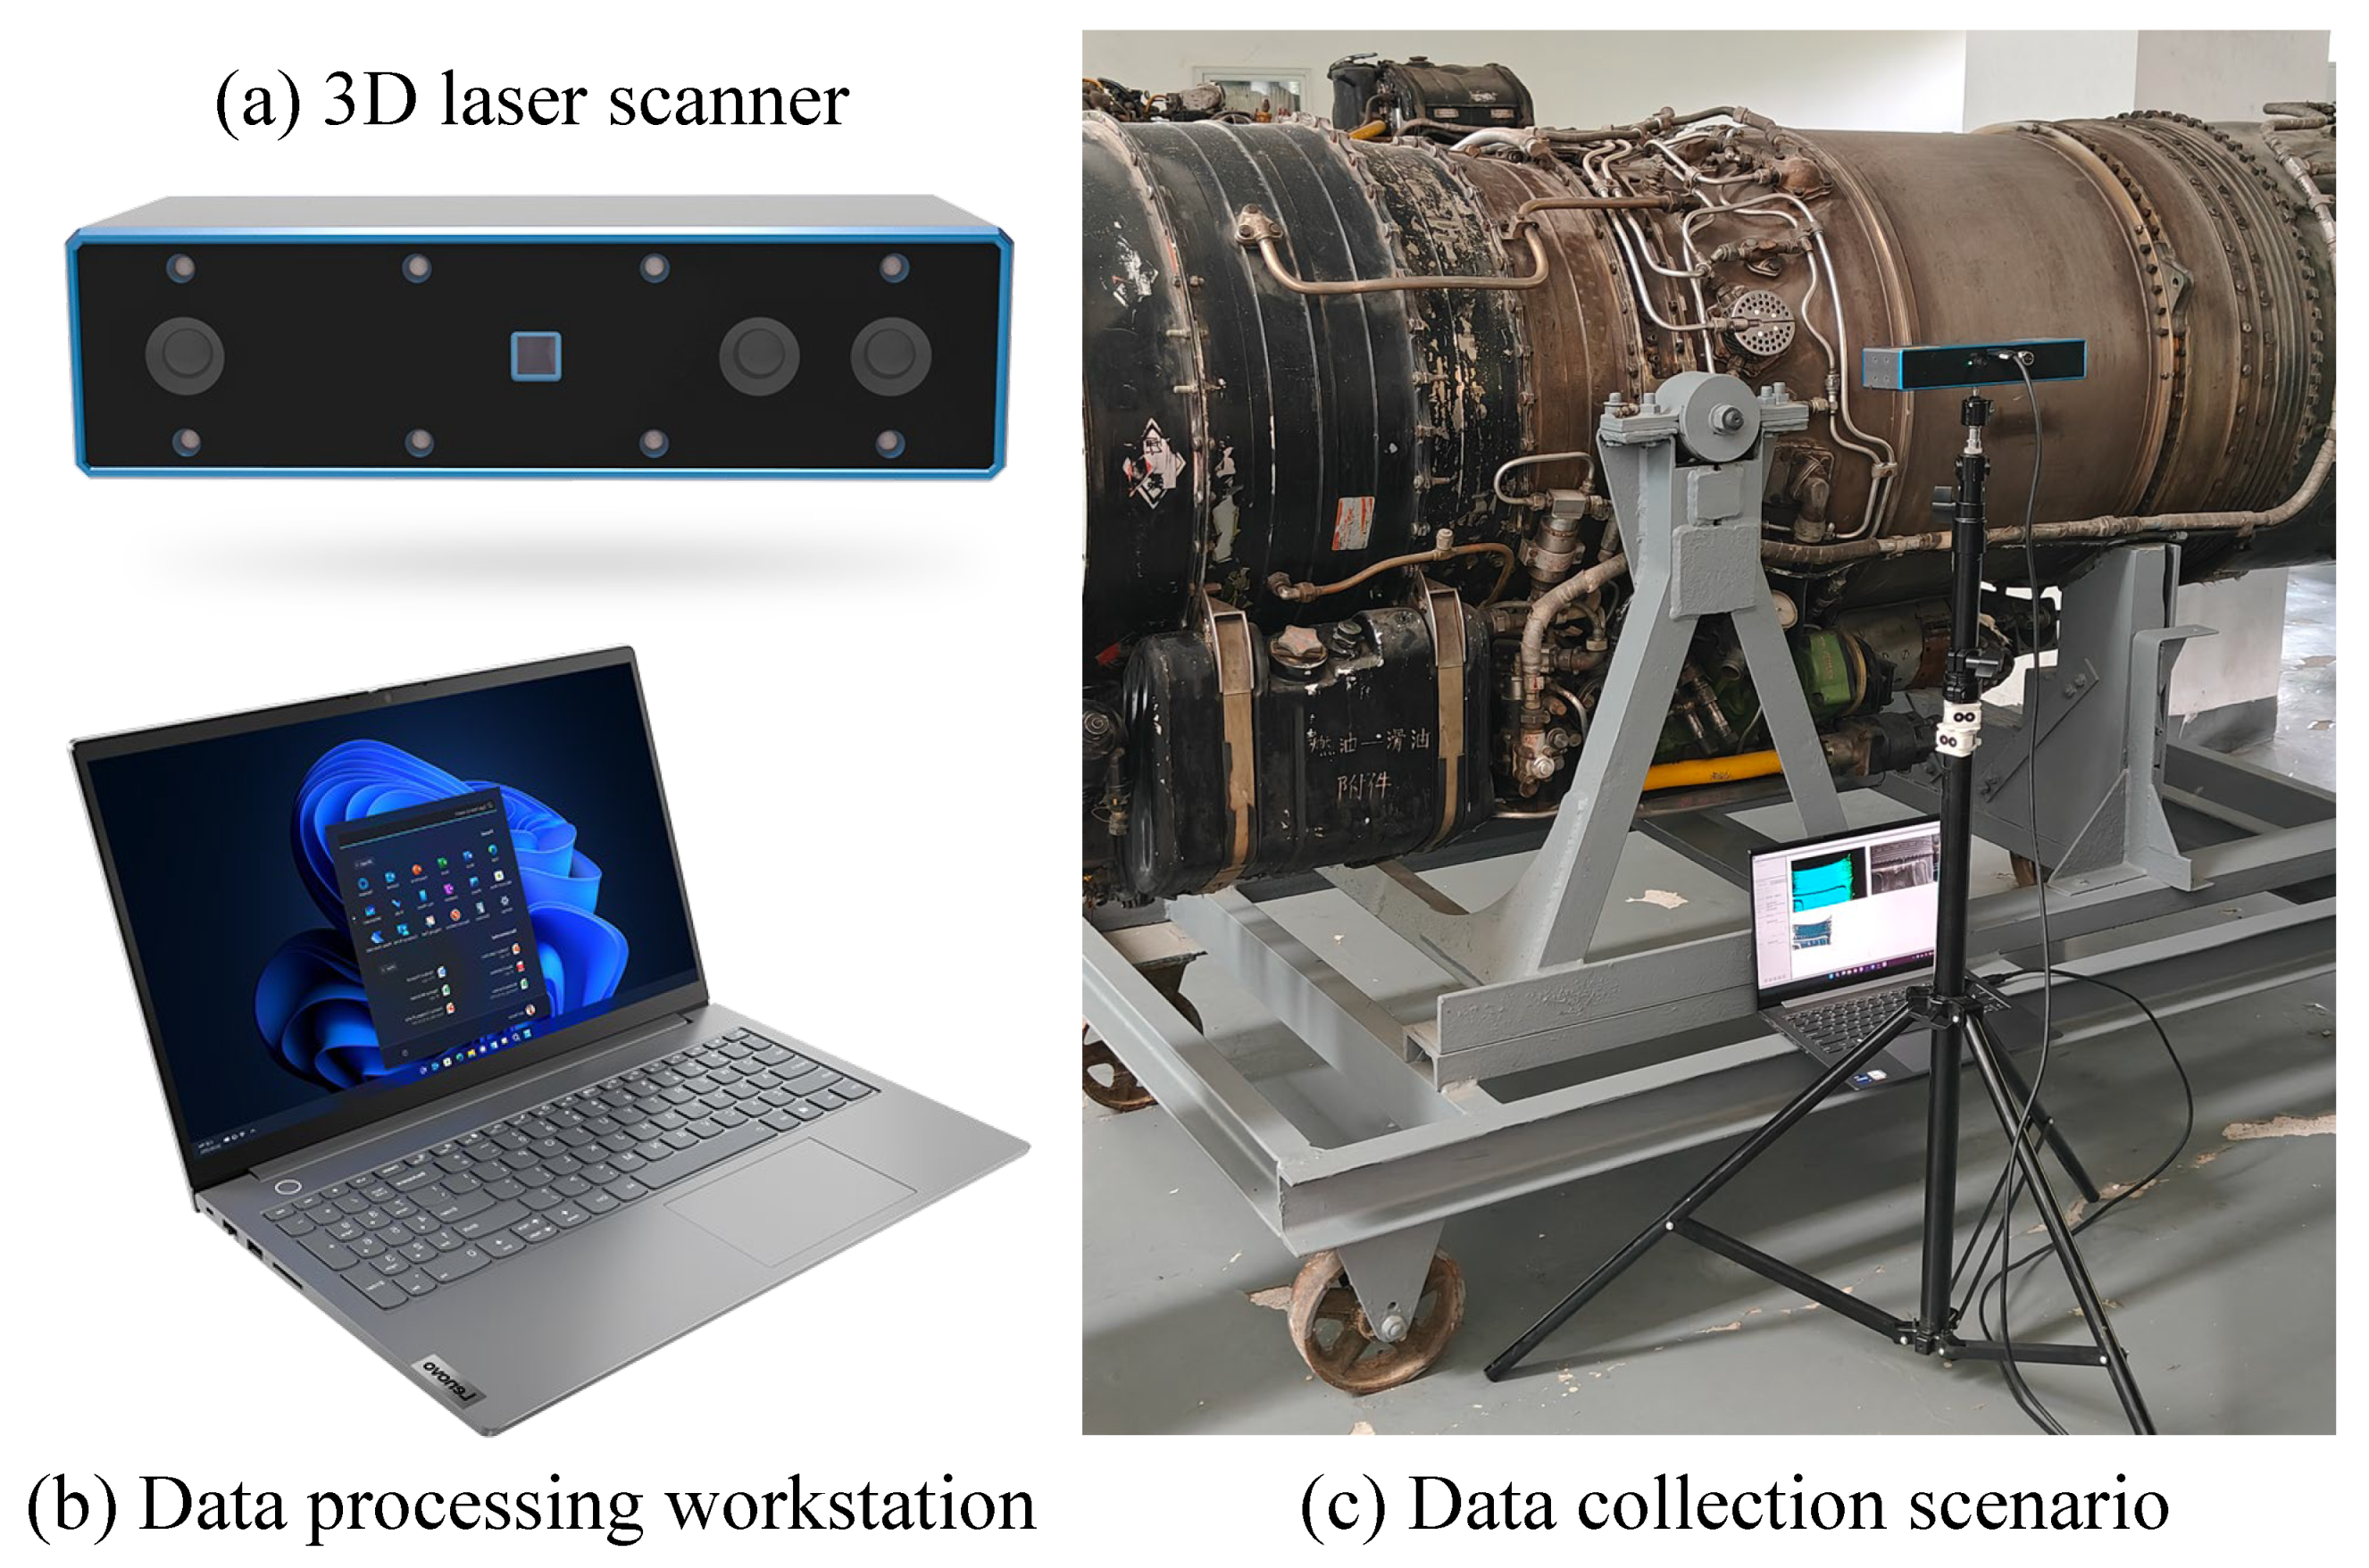
3. Hardware System
4. Method
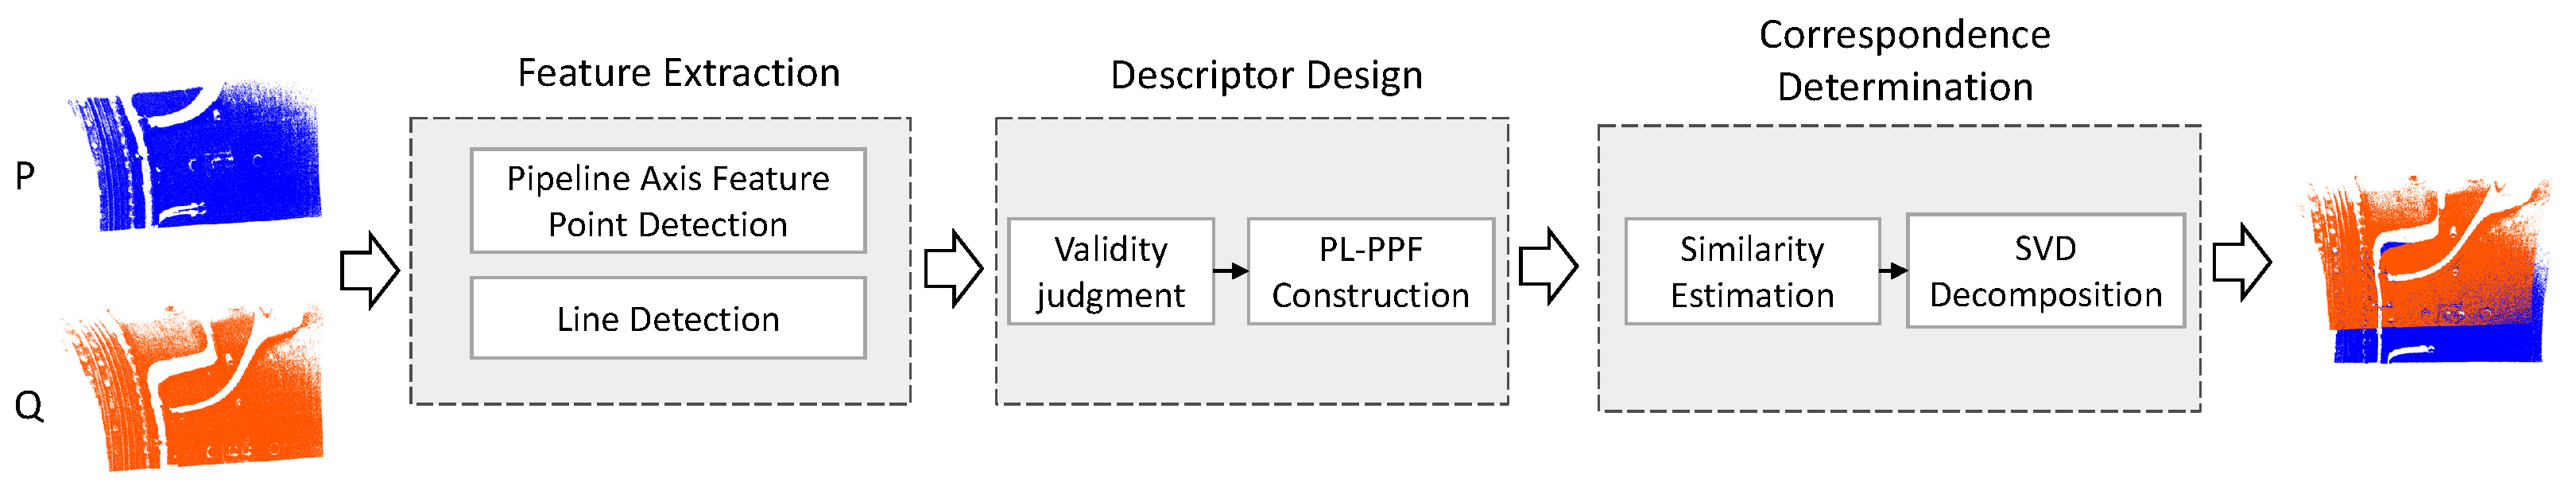
4.1. Overview
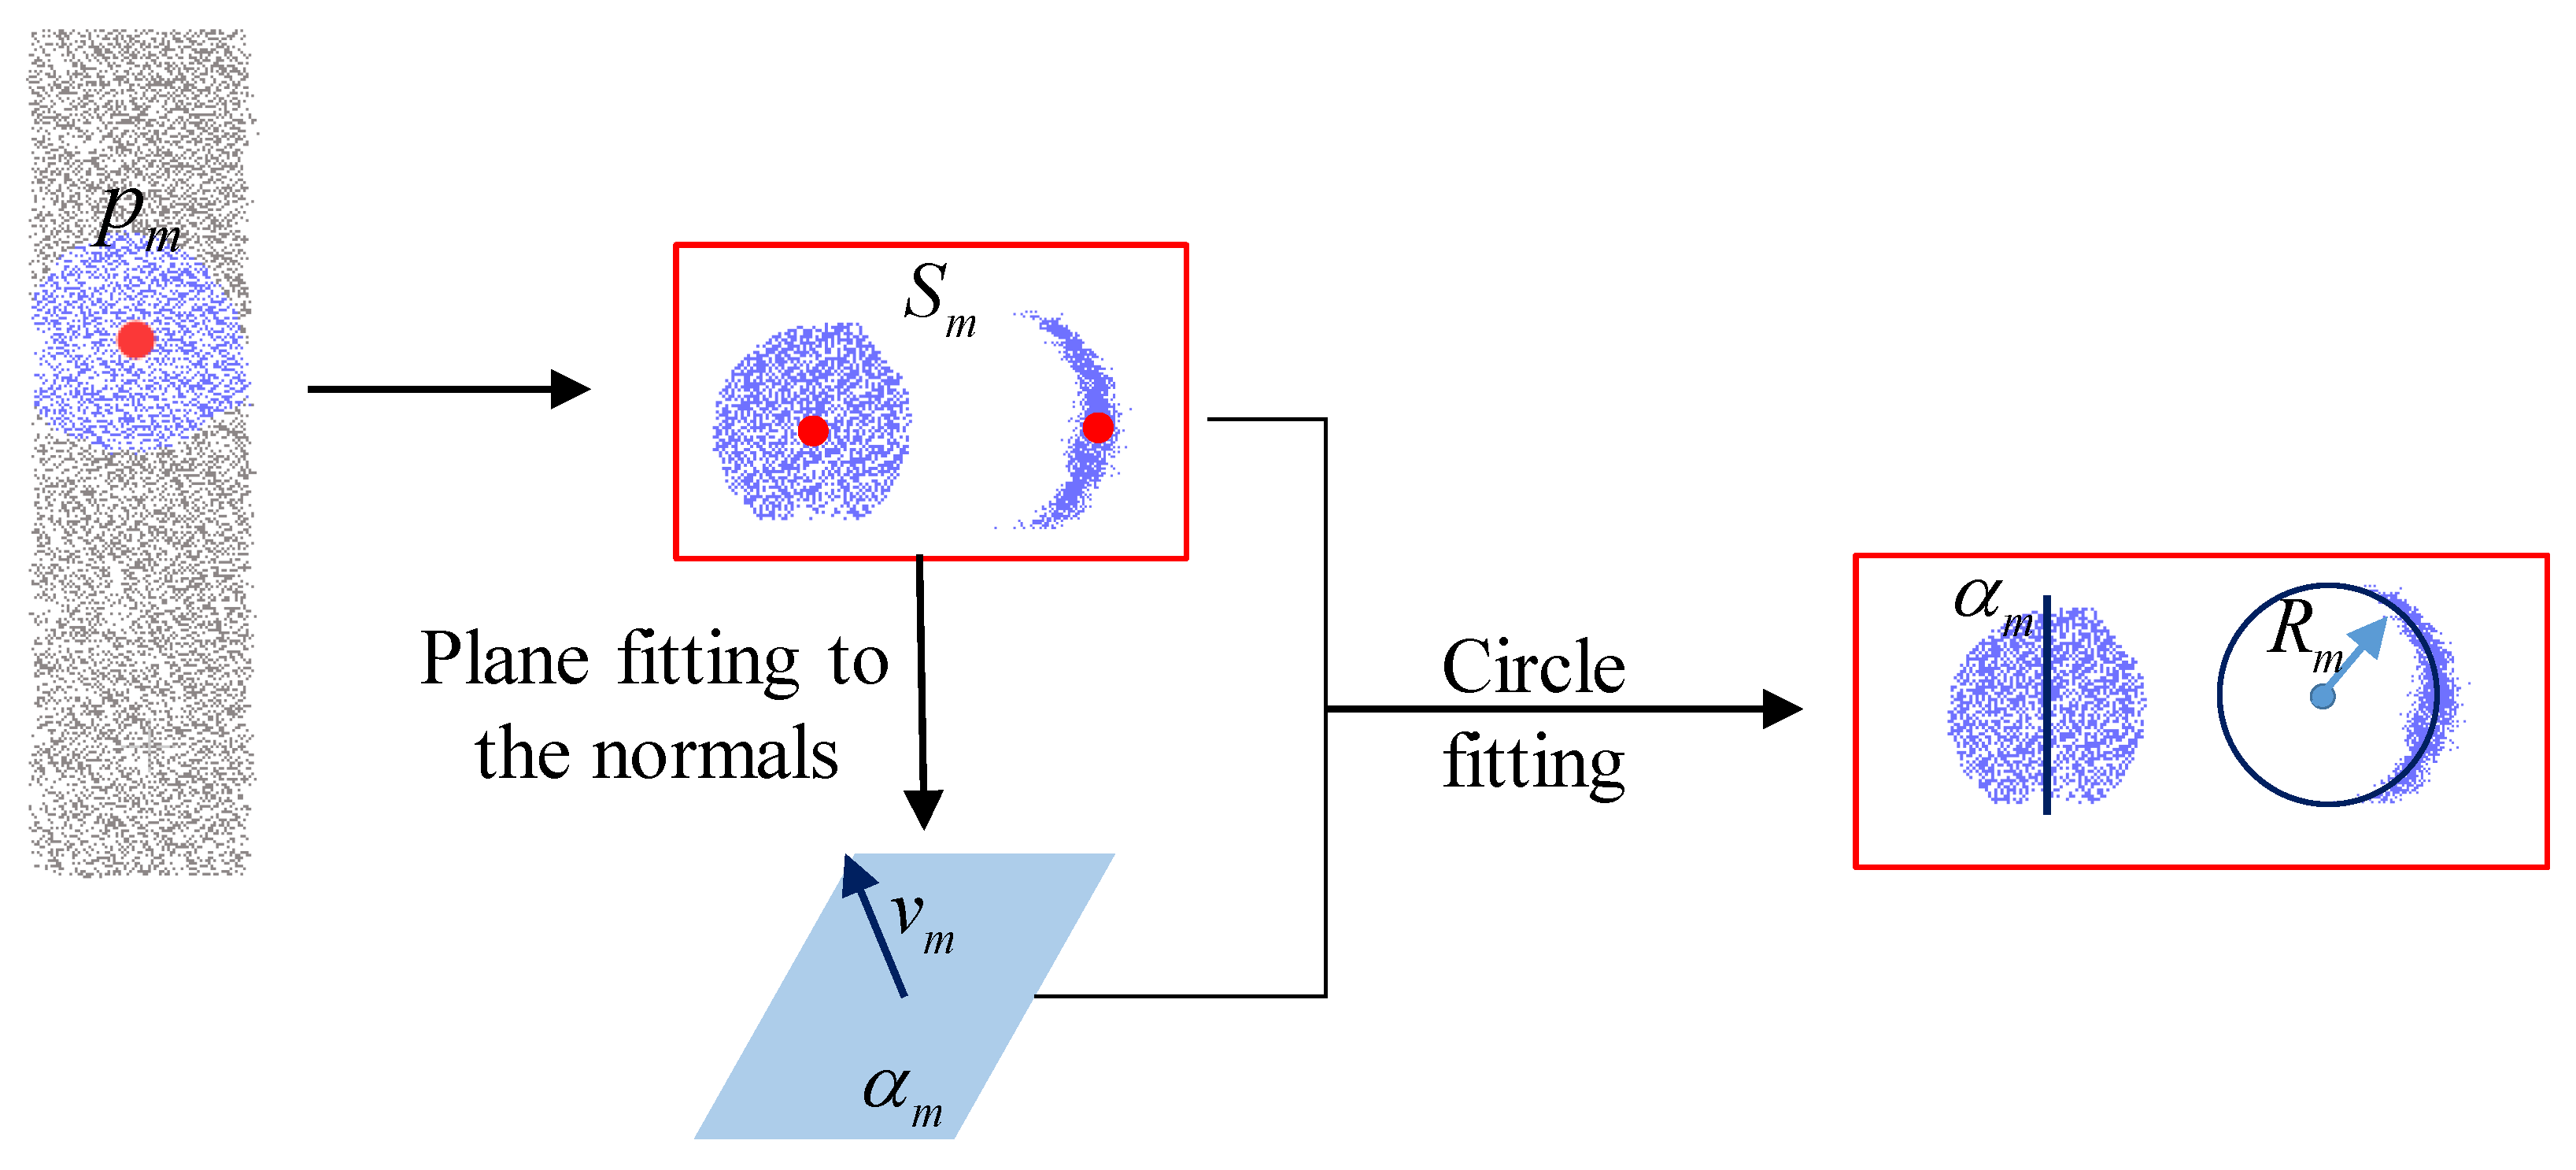
4.2. Feature Extraction
4.3. Descriptor Design
4.4. Correspondence Determination
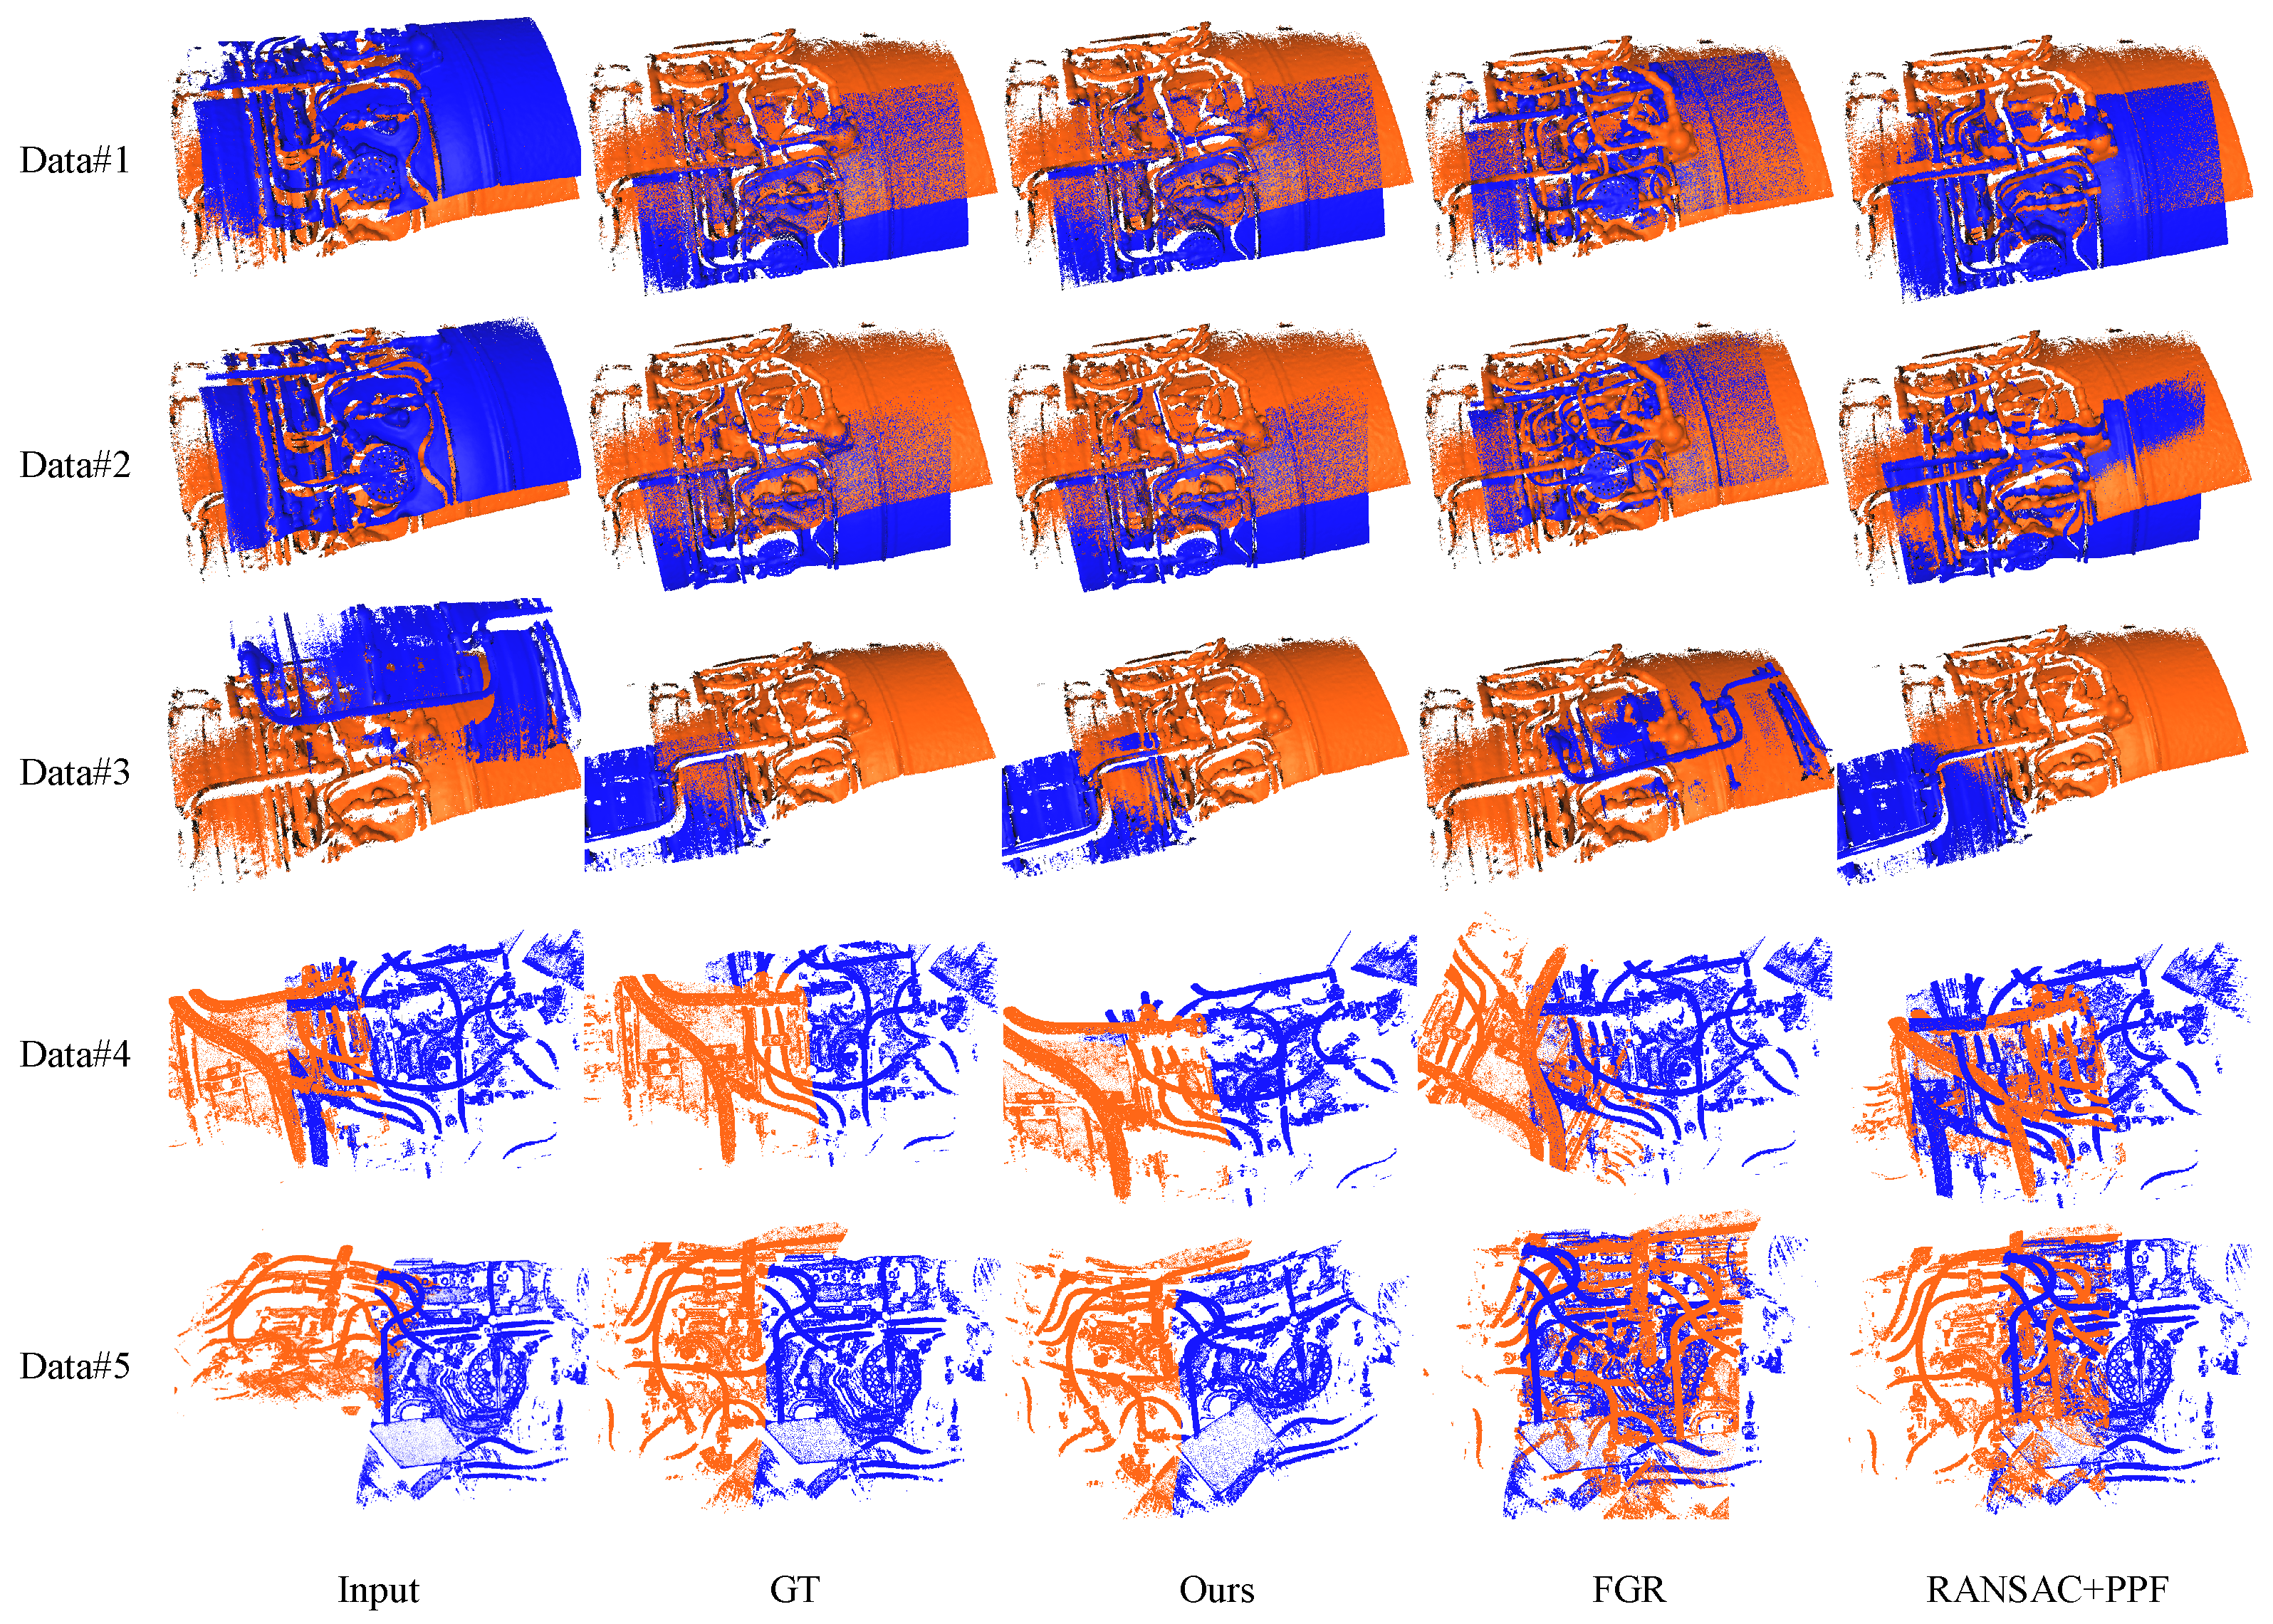
5. Experimental Results and Discussion
5.1. Gas Ducts of Aircraft Engines


| Index | Num(×104) | FGR | RANSAC + PPF | Ours | |||
|---|---|---|---|---|---|---|---|
| RMSE | Time | RMSE | Time | RMSE | Time | ||
| Data#1 | 294 | 20.186 | 1.943 | 18.675 | 52.732 | 0.728 | 4.278 |
| Data#2 | 278 | 16.722 | 1.615 | 17.453 | 43.874 | 0.106 | 4.322 |
| Data#3 | 282 | 43.665 | 1.334 | 48.453 | 48.345 | 1.220 | 5.160 |
| Data#4 | 297 | 51.789 | 1.673 | 43.538 | 49.650 | 0.403 | 4.856 |
| Average | - | 33.0905 | 1.64125 | 32.02975 | 48.65025 | 0.61425 | 4.654 |
5.2. Oil Ducts of Aircraft Engines
| Index | Num(×104) | FGR | RANSAC + PPF | Ours | |||
|---|---|---|---|---|---|---|---|
| RMSE | Time | RMSE | Time | RMSE | Time | ||
| Data#1 | 244 | 18.342 | 1.883 | 12.443 | 45.453 | 0.458 | 6.082 |
| Data#2 | 264 | 21.554 | 1.237 | 18.346 | 51.563 | 0.369 | 3.550 |
| Data#3 | 272 | 25.452 | 1.209 | 34.665 | 44.550 | 1.997 | 4.129 |
| Data#4 | 152 | 22.348 | 0.885 | 15.792 | 37.953 | 0.815 | 3.256 |
| Data#5 | 166 | 19.336 | 0.901 | 35.679 | 40.226 | 0.574 | 3.674 |
| Average | - | 21.406 | 1.223 | 23.385 | 43.887 | 0.843 | 4.138 |
6. Conclusions
Author Contributions
Funding
Data Availability Statement
Conflicts of Interest
References
- Cao, T.; Zhou, L.; Qu, L.; Liu, Y.; Ding, C.; Wu, Q.; Wang, J. Aircraft Pipe Gap Inspection on Raw Point Cloud From a Single View. IEEE Trans. Instrum. Meas. 2022, 71, 5014814. [Google Scholar] [CrossRef]
- Dai, J.; Wei, M.; Xie, Q.; Wang, J. Aircraft seam feature extraction from 3D raw point cloud via hierarchical multi-structure fitting. Comput.-Aided Des. 2021, 130, 102945. [Google Scholar] [CrossRef]
- Ji, Y.; Li, Z.; Liu, L.; Wang, J.; Wu, J. A deformation detection method for aircraft skin on uniform pressure by using speckle image correlation technology. Measurement 2020, 154, 107525. [Google Scholar] [CrossRef]
- Mehrad, V.; Xue, D.; Gu, P. Robust localization to align measured points on the manufactured surface with design surface for freeform surface inspection. Comput.-Aided Des. 2014, 53, 90–103. [Google Scholar] [CrossRef]
- Xie, Q.; Lu, D.; Du, K.; Xu, J.; Dai, J.; Chen, H.; Wang, J. Aircraft skin rivet detection based on 3D point cloud via multiple structures fitting. Comput.-Aided Des. 2020, 120, 102805. [Google Scholar] [CrossRef]
- Xie, Q.; Lu, D.; Huang, A.; Yang, J.; Li, D.; Zhang, Y.; Wang, J. RRCNet: Rivet region classification network for rivet flush measurement based on 3-D point cloud. IEEE Trans. Instrum. Meas. 2020, 70, 5003412. [Google Scholar] [CrossRef]
- Besl, P.J.; McKay, N.D. Method for registration of 3-D shapes. In Proceedings of the Sensor Fusion IV: Control Paradigms and Data Structures, Boston, MA, USA, 12–15 November 1991; SPIE: Bellingham, WA, USA, 1992; Volume 1611, pp. 586–606. [Google Scholar]
- Magnusson, M. The Three-Dimensional Normal-Distributions Transform: An Efficient Representation for Registration, Surface Analysis, and Loop Detection. Ph.D. Thesis, Örebro Universitet, Örebro, Sweden, 2009. [Google Scholar]
- Drost, B.; Ulrich, M.; Navab, N.; Ilic, S. Model globally, match locally: Efficient and robust 3D object recognition. In Proceedings of the 2010 IEEE Computer Society Conference on Computer Vision and Pattern Recognition, San Francisco, CA, USA, 13–18 June 2010; IEEE: New York, NY, USA, 2010; pp. 998–1005. [Google Scholar]
- Wang, Y.; Liu, Y.; Xie, Q.; Wu, Q.; Guo, X.; Yu, Z.; Wang, J. Density-invariant registration of multiple scans for aircraft measurement. IEEE Trans. Instrum. Meas. 2020, 70, 7000715. [Google Scholar] [CrossRef]
- Tam, G.K.; Cheng, Z.Q.; Lai, Y.K.; Langbein, F.C.; Liu, Y.; Marshall, D.; Martin, R.R.; Sun, X.F.; Rosin, P.L. Registration of 3D point clouds and meshes: A survey from rigid to nonrigid. IEEE Trans. Vis. Comput. Graph. 2012, 19, 1199–1217. [Google Scholar] [CrossRef] [PubMed]
- Fischler, M.A.; Bolles, R.C. Random sample consensus: A paradigm for model fitting with applications to image analysis and automated cartography. Commun. ACM 1981, 24, 381–395. [Google Scholar] [CrossRef]
- Torr, P.H.; Zisserman, A. MLESAC: A new robust estimator with application to estimating image geometry. Comput. Vis. Image Underst. 2000, 78, 138–156. [Google Scholar] [CrossRef]
- Chum, O.; Matas, J.; Kittler, J. Locally optimized RANSAC. In Proceedings of the Pattern Recognition: 25th DAGM Symposium, Magdeburg, Germany, 10–12 September 2003; Proceedings 25. Springer: Berlin/Heidelberg, Germany, 2003; pp. 236–243. [Google Scholar]
- Chum, O.; Matas, J. Matching with PROSAC-progressive sample consensus. In Proceedings of the 2005 IEEE Computer Society Conference on Computer Vision and Pattern Recognition (CVPR’05), San Diego, CA, USA, 20–26 June 2005; IEEE: New York, NY, USA, 2005; Volume 1, pp. 220–226. [Google Scholar]
- Torr, P.H.; Nasuto, S.J.; Bishop, J.M. Napsac: High noise, high dimensional robust estimation-it’s in the bag. In Proceedings of the British Machine Vision Conference (BMVC), Cardiff, UK, 2–5 September 2002; Volume 2, p. 3. [Google Scholar]
- Rusu, R.B.; Blodow, N.; Beetz, M. Fast point feature histograms (FPFH) for 3D registration. In Proceedings of the 2009 IEEE International Conference on Robotics and Automation, Kobe, Japan, 12–17 May 2009; IEEE: New York, NY, USA, 2009; pp. 3212–3217. [Google Scholar]
- Tombari, F.; Salti, S.; Di Stefano, L. Unique signatures of histograms for local surface description. In Proceedings of the Computer Vision–ECCV 2010: 11th European Conference on Computer Vision, Heraklion, Crete, Greece, 5–11 September 2010; Proceedings, Part III 11. Springer: Berlin/Heidelberg, Germany, 2010; pp. 356–369. [Google Scholar]
- Rusu, R.B.; Cousins, S. 3d is here: Point cloud library (pcl). In Proceedings of the 2011 IEEE International Conference on Robotics and Automation, Shanghai, China, 9–13 May 2011; IEEE: New York, NY, USA, 2011; pp. 1–4. [Google Scholar]
- Uy, M.A.; Lee, G.H. Pointnetvlad: Deep point cloud based retrieval for large-scale place recognition. In Proceedings of the IEEE Conference on Computer Vision and Pattern Recognition, Salt Lake City, UT, USA, 18–22 June 2018; pp. 4470–4479. [Google Scholar]
- Choy, C.; Dong, W.; Koltun, V. Deep global registration. In Proceedings of the IEEE/CVF Conference on Computer Vision and Pattern Recognition, Seattle, WA, USA, 14–19 June 2020; pp. 2514–2523. [Google Scholar]
- Wang, Y.; Solomon, J.M. Deep closest point: Learning representations for point cloud registration. In Proceedings of the IEEE/CVF International Conference on Computer Vision, Seoul, Republic of Korea, 27 October–2 November 2019; pp. 3523–3532. [Google Scholar]
- Aoki, Y.; Goforth, H.; Srivatsan, R.A.; Lucey, S. Pointnetlk: Robust & efficient point cloud registration using pointnet. In Proceedings of the IEEE/CVF Conference on Computer Vision and Pattern Recognition, Long Beach, California, USA, 15–20 June 2019; pp. 7163–7172. [Google Scholar]
- Yew, Z.J.; Lee, G.H. Rpm-net: Robust point matching using learned features. In Proceedings of the IEEE/CVF Conference on Computer Vision and Pattern Recognition, Seattle, WA, USA, 14–19 June 2020; pp. 11824–11833. [Google Scholar]
- Chen, H.; Wei, Z.; Xu, Y.; Wei, M.; Wang, J. Imlovenet: Misaligned image-supported registration network for low-overlap point cloud pairs. In Proceedings of the ACM SIGGRAPH 2022 Conference Proceedings, Vancouver, BC, Canada, 7–11 August 2022; pp. 1–9. [Google Scholar]
- Lu, X.; Liu, Y.; Li, K. Fast 3D line segment detection from unorganized point cloud. arXiv 2019, arXiv:1901.02532. [Google Scholar]

Disclaimer/Publisher’s Note: The statements, opinions and data contained in all publications are solely those of the individual author(s) and contributor(s) and not of MDPI and/or the editor(s). MDPI and/or the editor(s) disclaim responsibility for any injury to people or property resulting from any ideas, methods, instructions or products referred to in the content. |
© 2024 by the authors. Licensee MDPI, Basel, Switzerland. This article is an open access article distributed under the terms and conditions of the Creative Commons Attribution (CC BY) license (https://creativecommons.org/licenses/by/4.0/).
Share and Cite
Liu, Y.; Wang, Z.; Huang, J.; Zhang, L. Robust Point Cloud Registration for Aircraft Engine Pipeline Systems. Sensors 2024, 24, 3358. https://doi.org/10.3390/s24113358
Liu Y, Wang Z, Huang J, Zhang L. Robust Point Cloud Registration for Aircraft Engine Pipeline Systems. Sensors. 2024; 24(11):3358. https://doi.org/10.3390/s24113358
Chicago/Turabian StyleLiu, Yusong, Zhihai Wang, Jichuan Huang, and Liyan Zhang. 2024. "Robust Point Cloud Registration for Aircraft Engine Pipeline Systems" Sensors 24, no. 11: 3358. https://doi.org/10.3390/s24113358
APA StyleLiu, Y., Wang, Z., Huang, J., & Zhang, L. (2024). Robust Point Cloud Registration for Aircraft Engine Pipeline Systems. Sensors, 24(11), 3358. https://doi.org/10.3390/s24113358