
Operational Deflection Shape Measurements on Bladed Disks with Continuous Scanning Laser Doppler Vibrometry

Abstract
:1. Instruction
2. Theoretical Basis of ODS Reconstruction in CSLDV
3. ODS of Bladed Disc in CSLDV
3.1. Modal Characteristics of Bladed Disk
3.2. Measurement in CSLDV
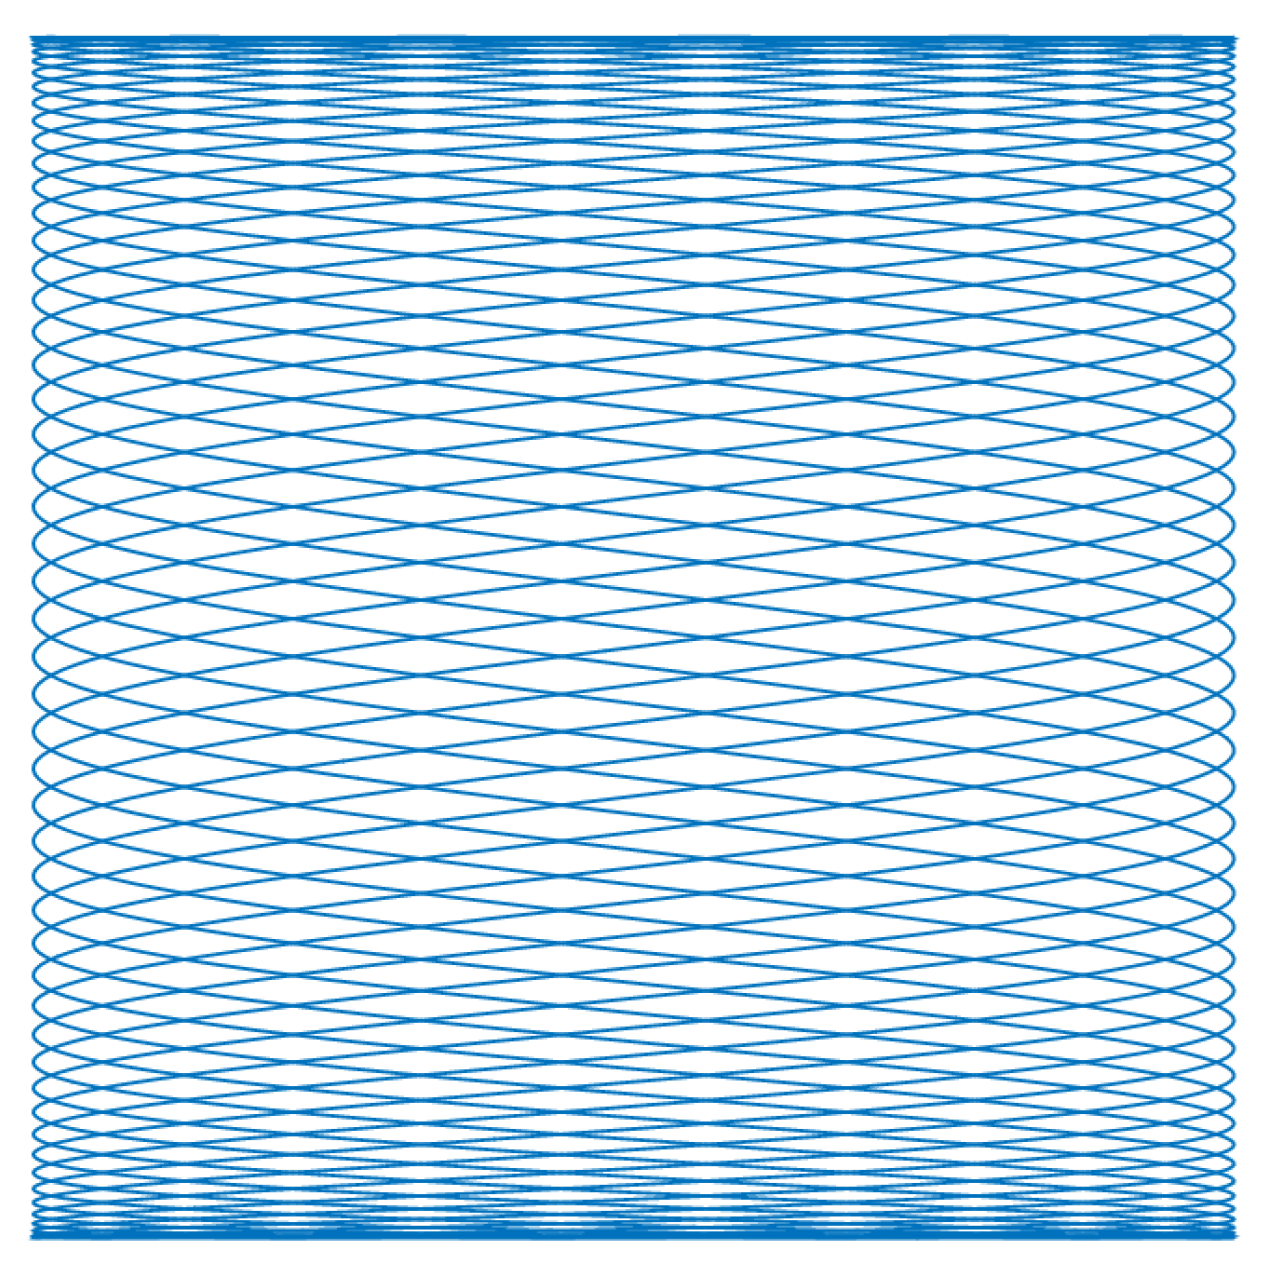
3.2.1. Design of the Continuous Scanning Path
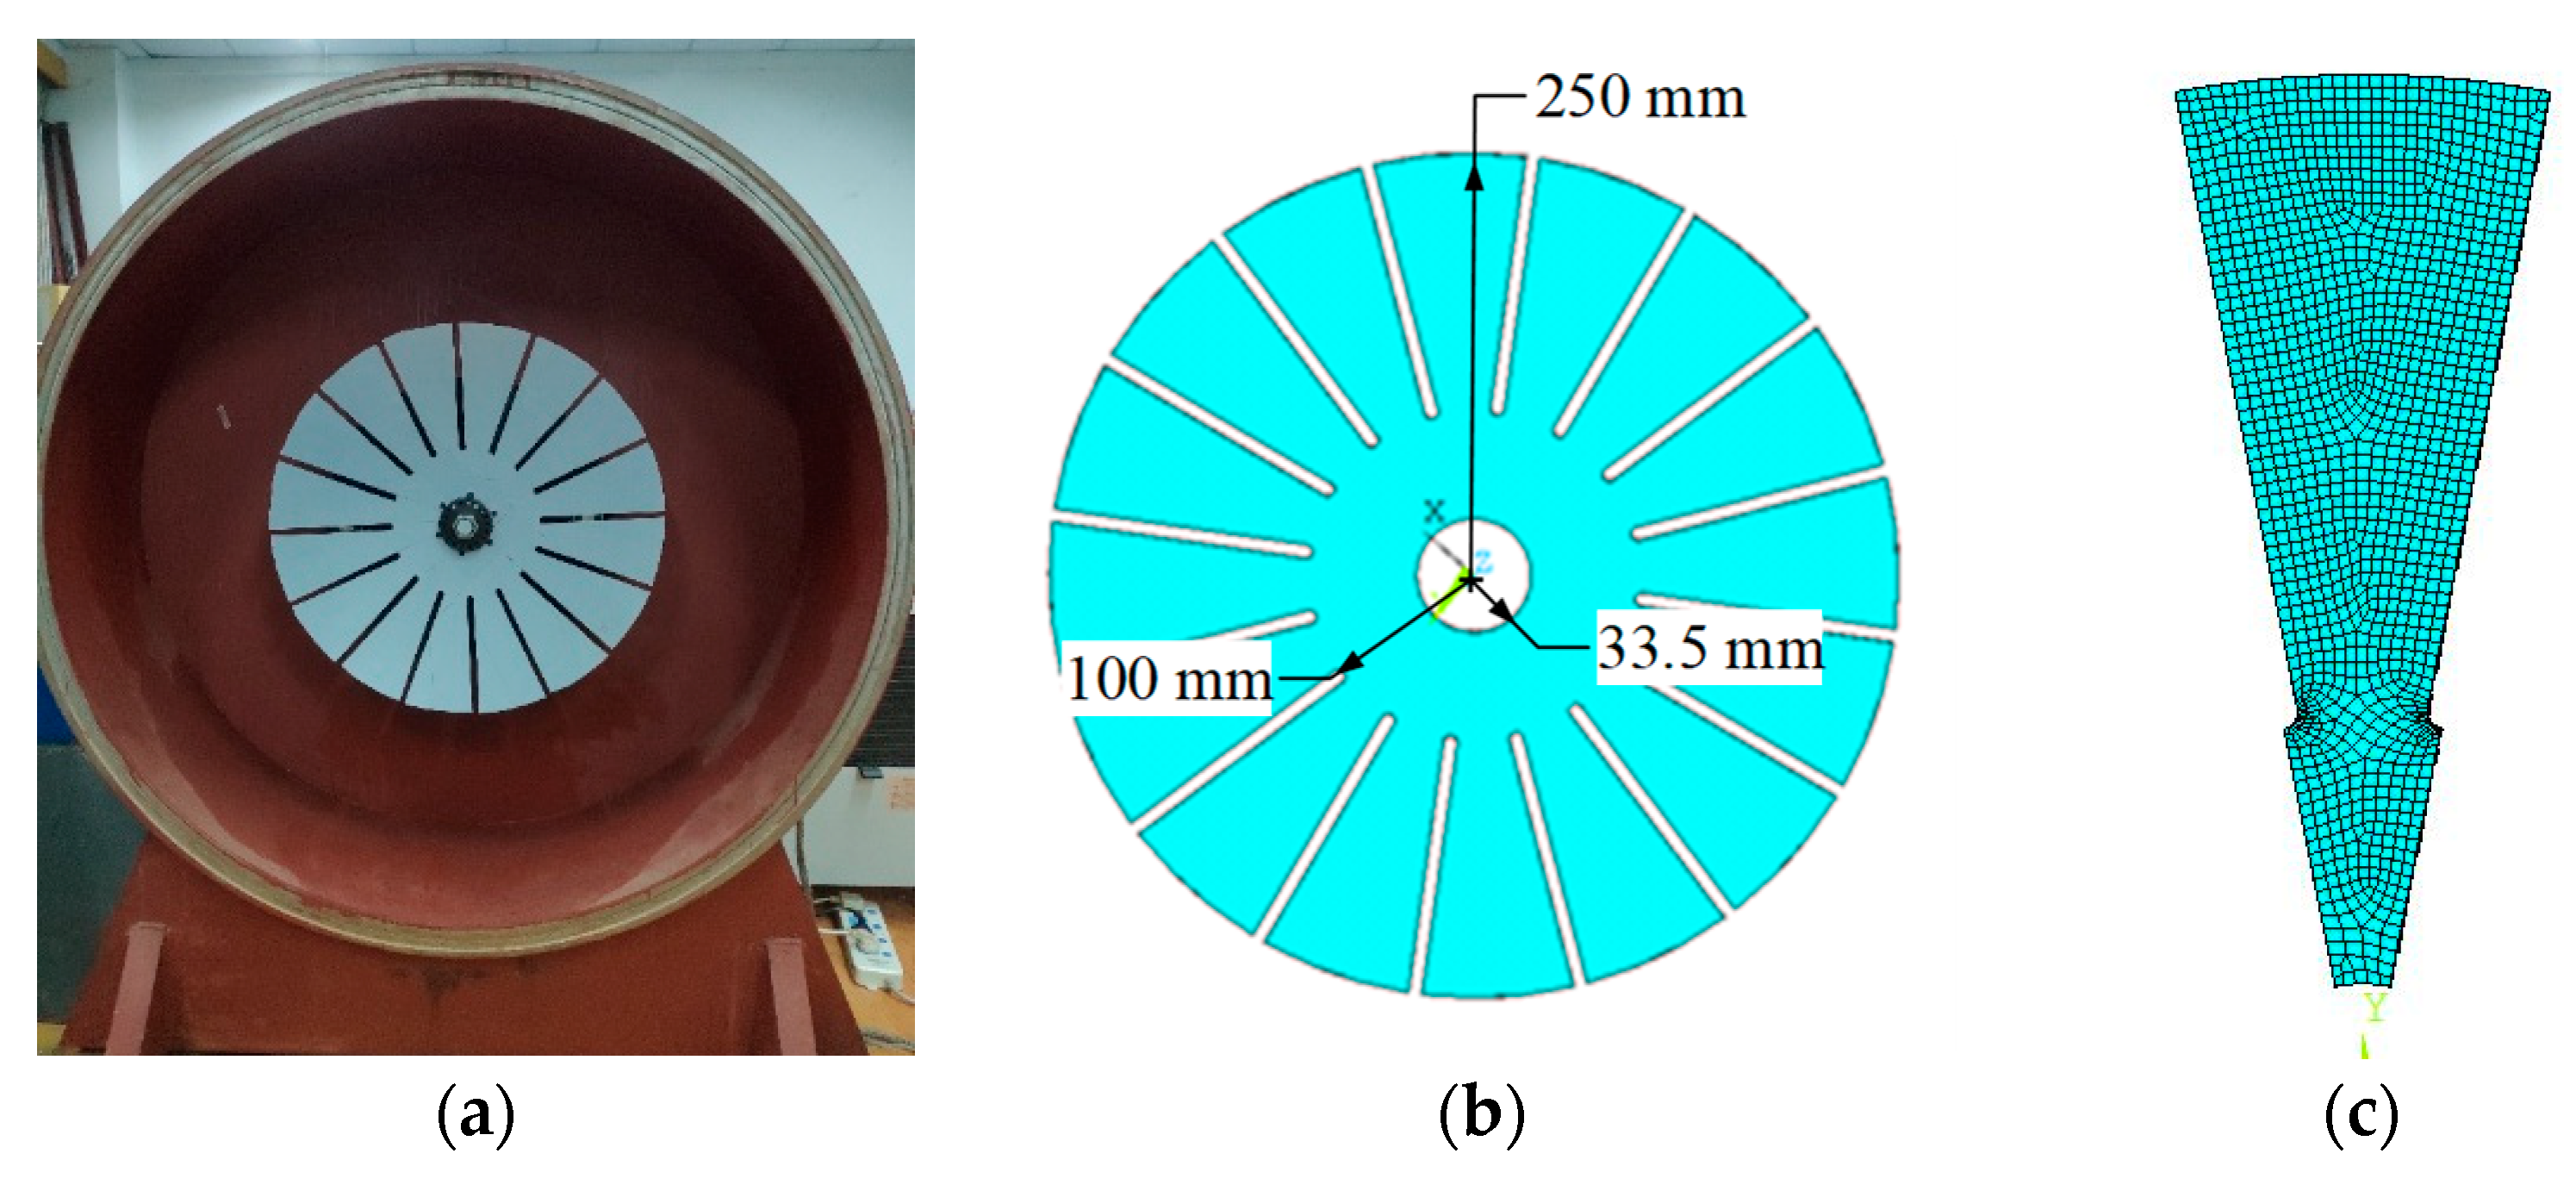
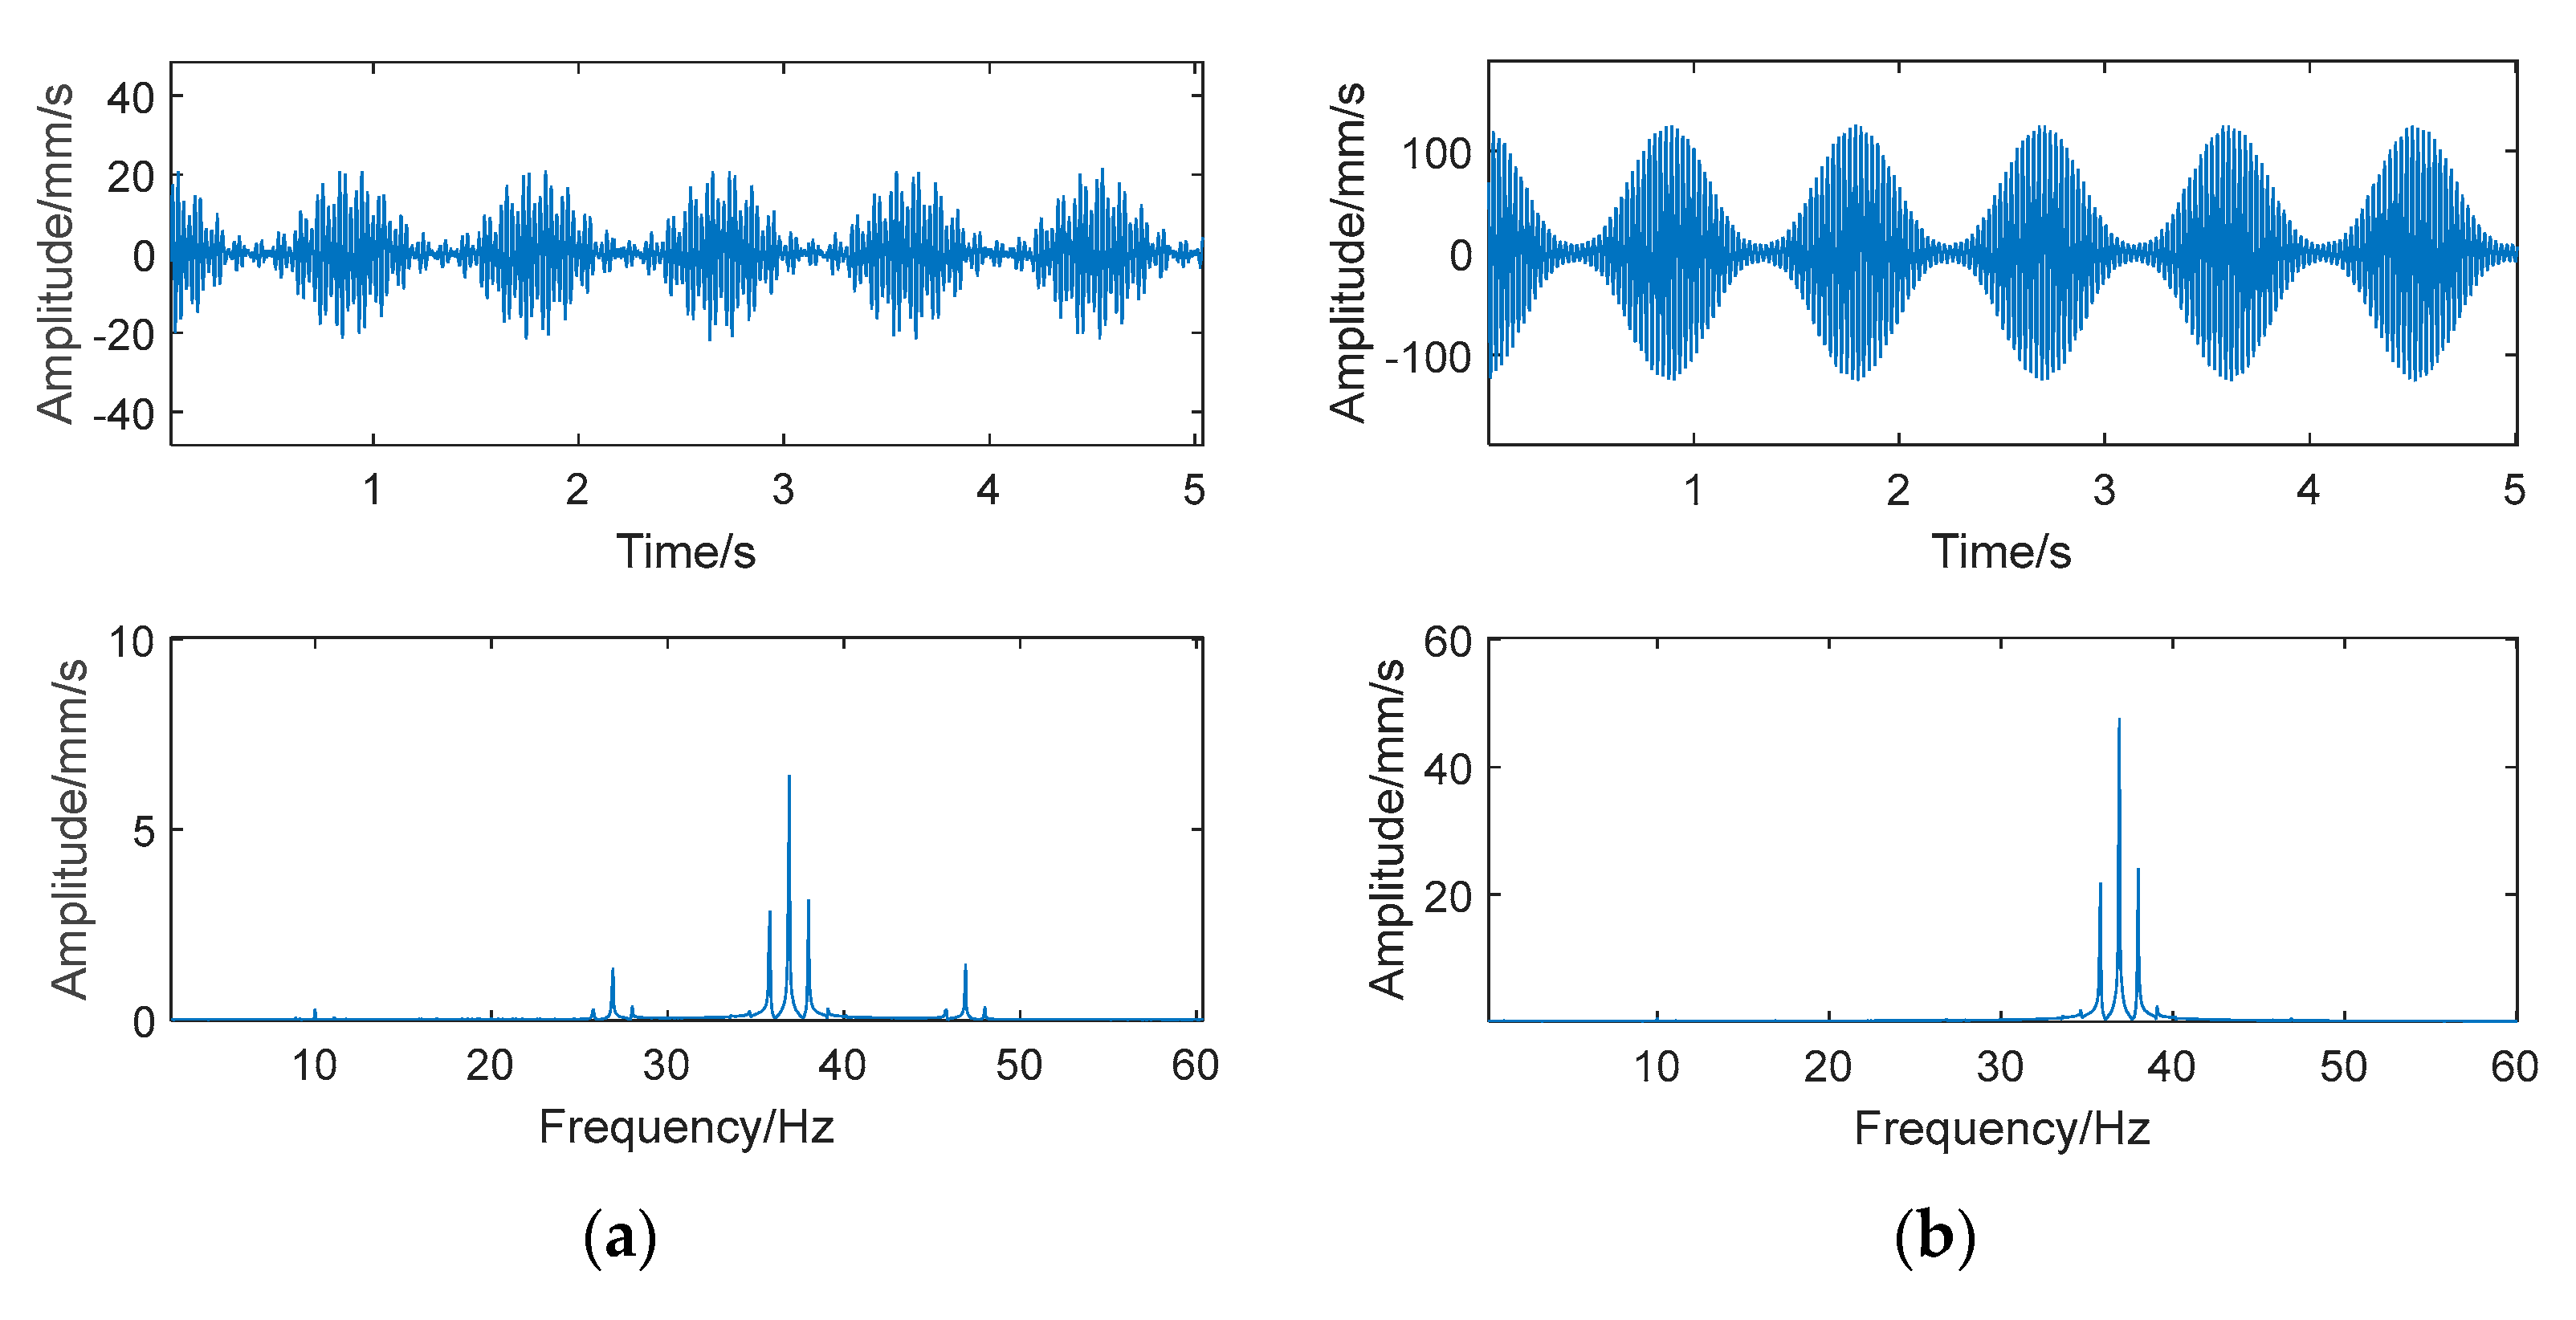
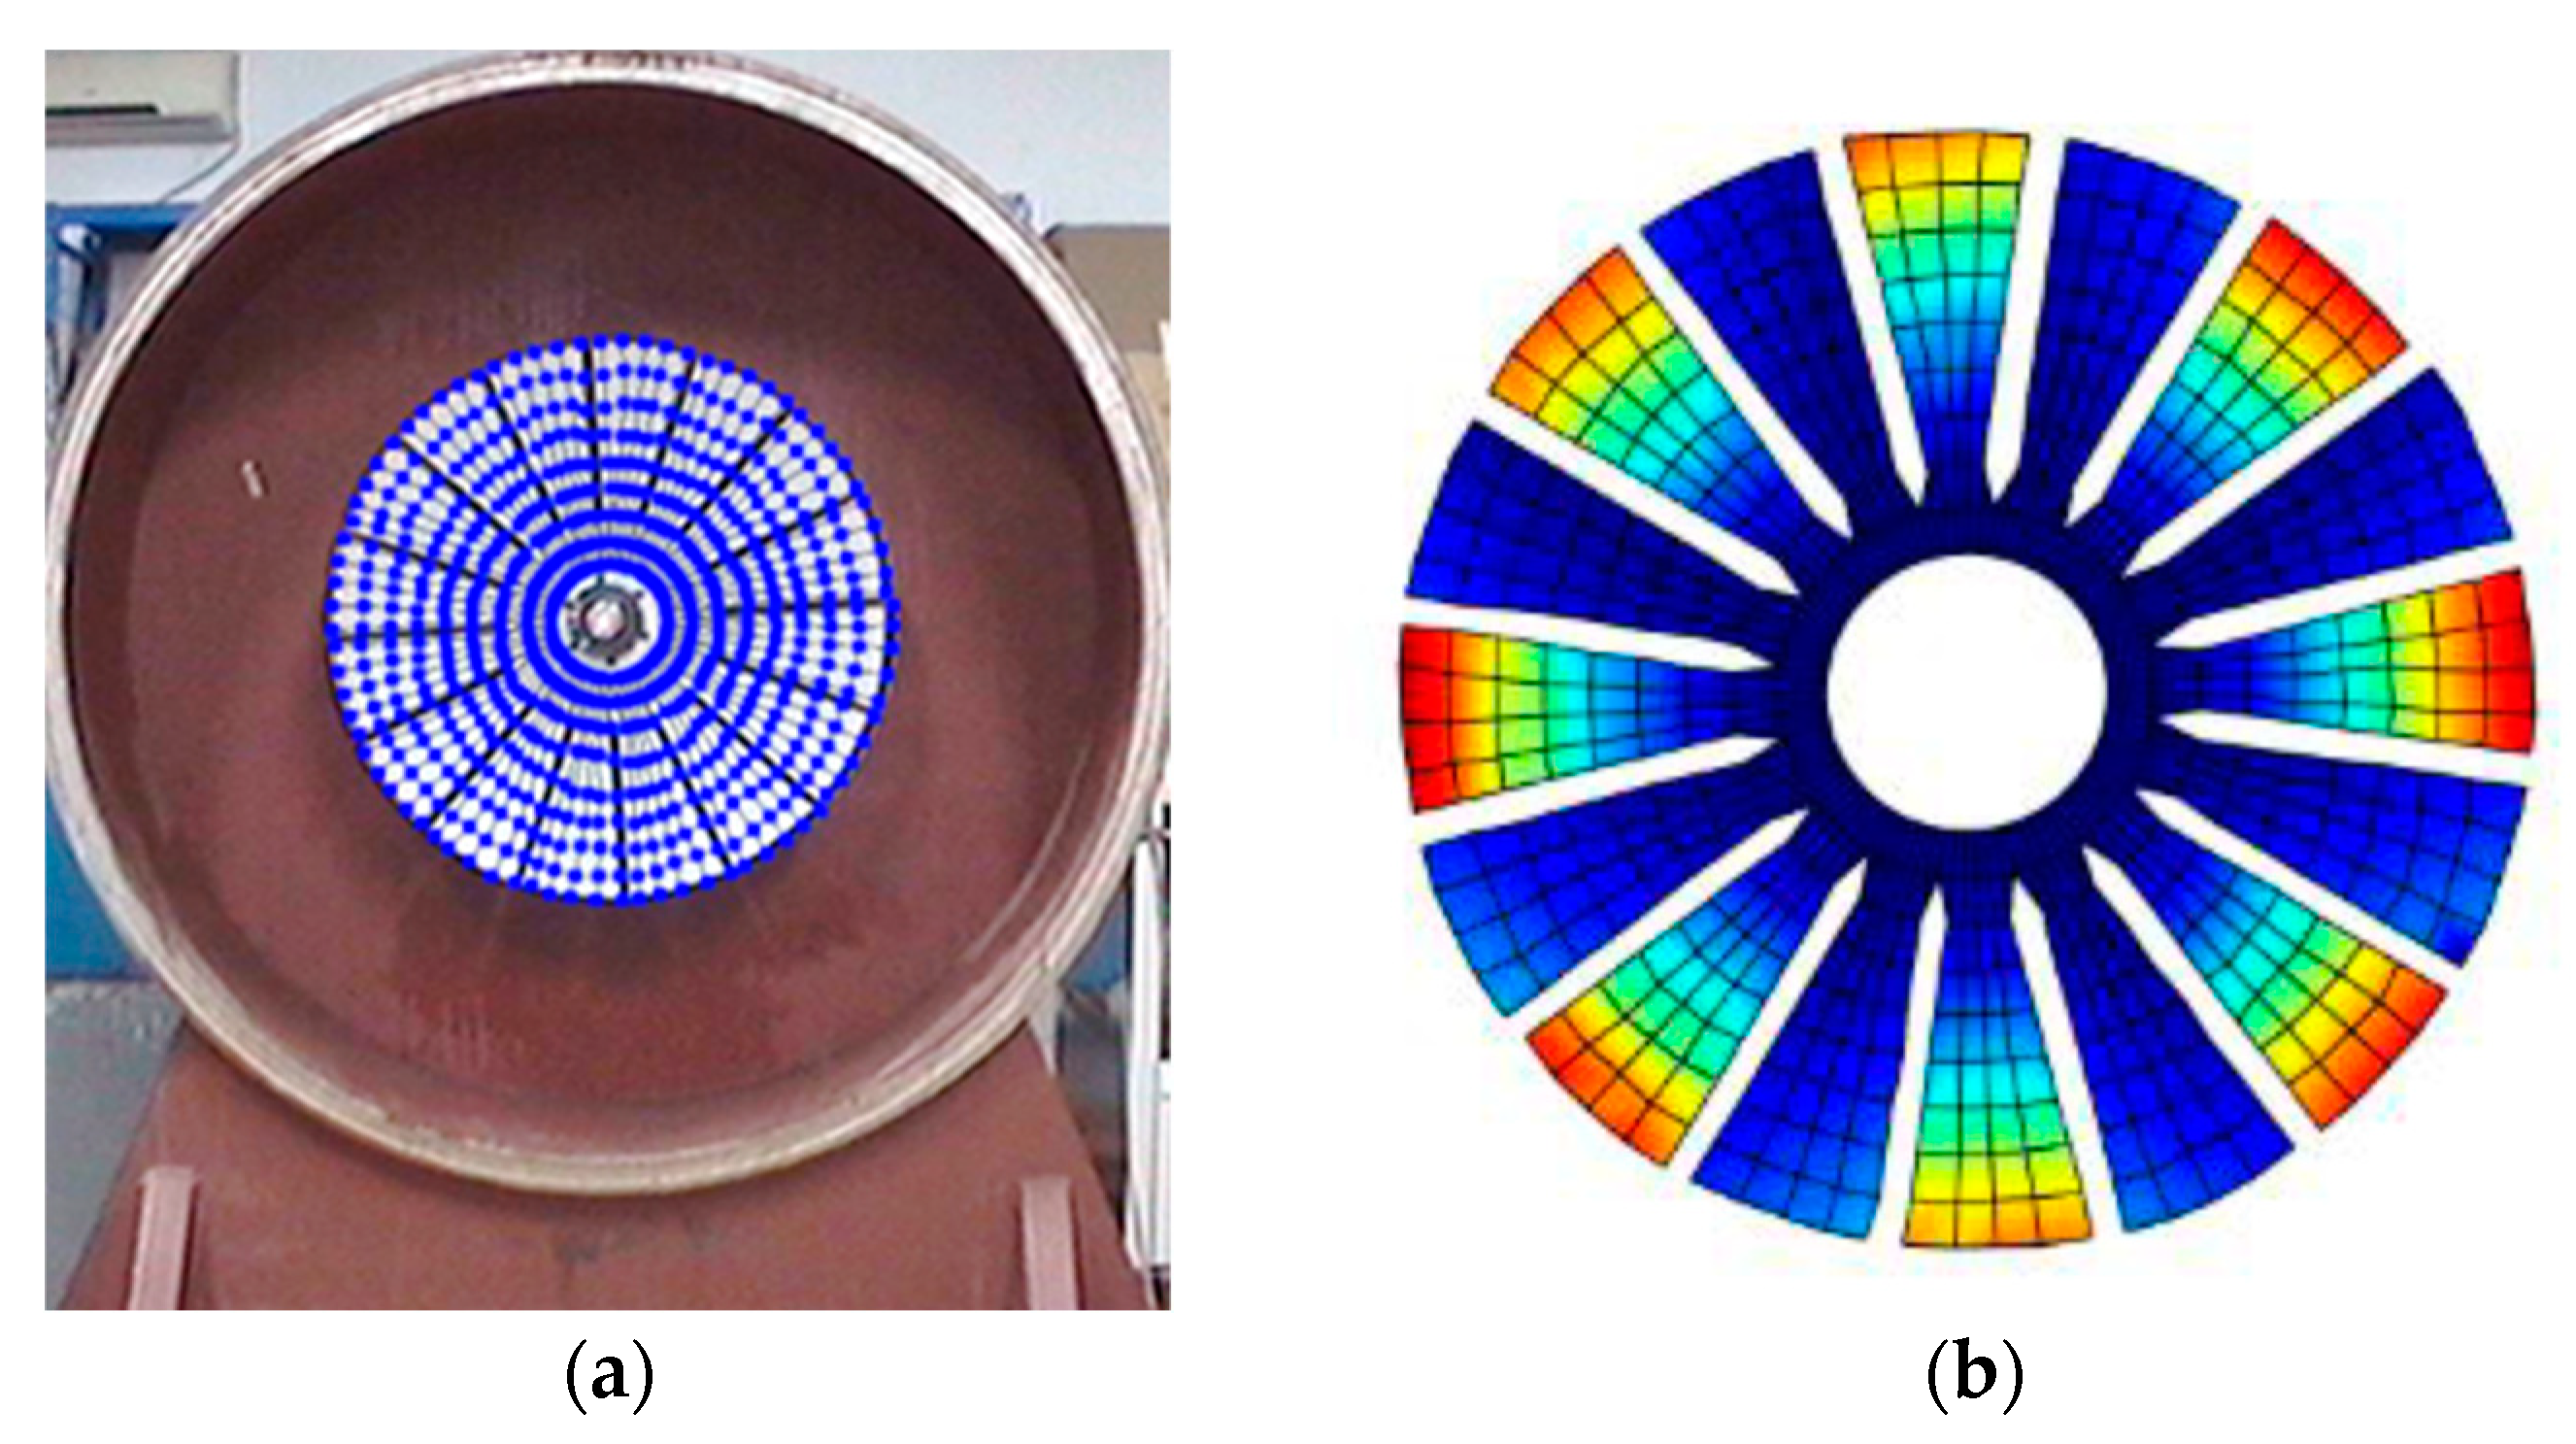
3.2.2. Experimental Test
3.3. Identification of Vibration Phase and ODS Reconstruction of the Whole-Bladed Disk
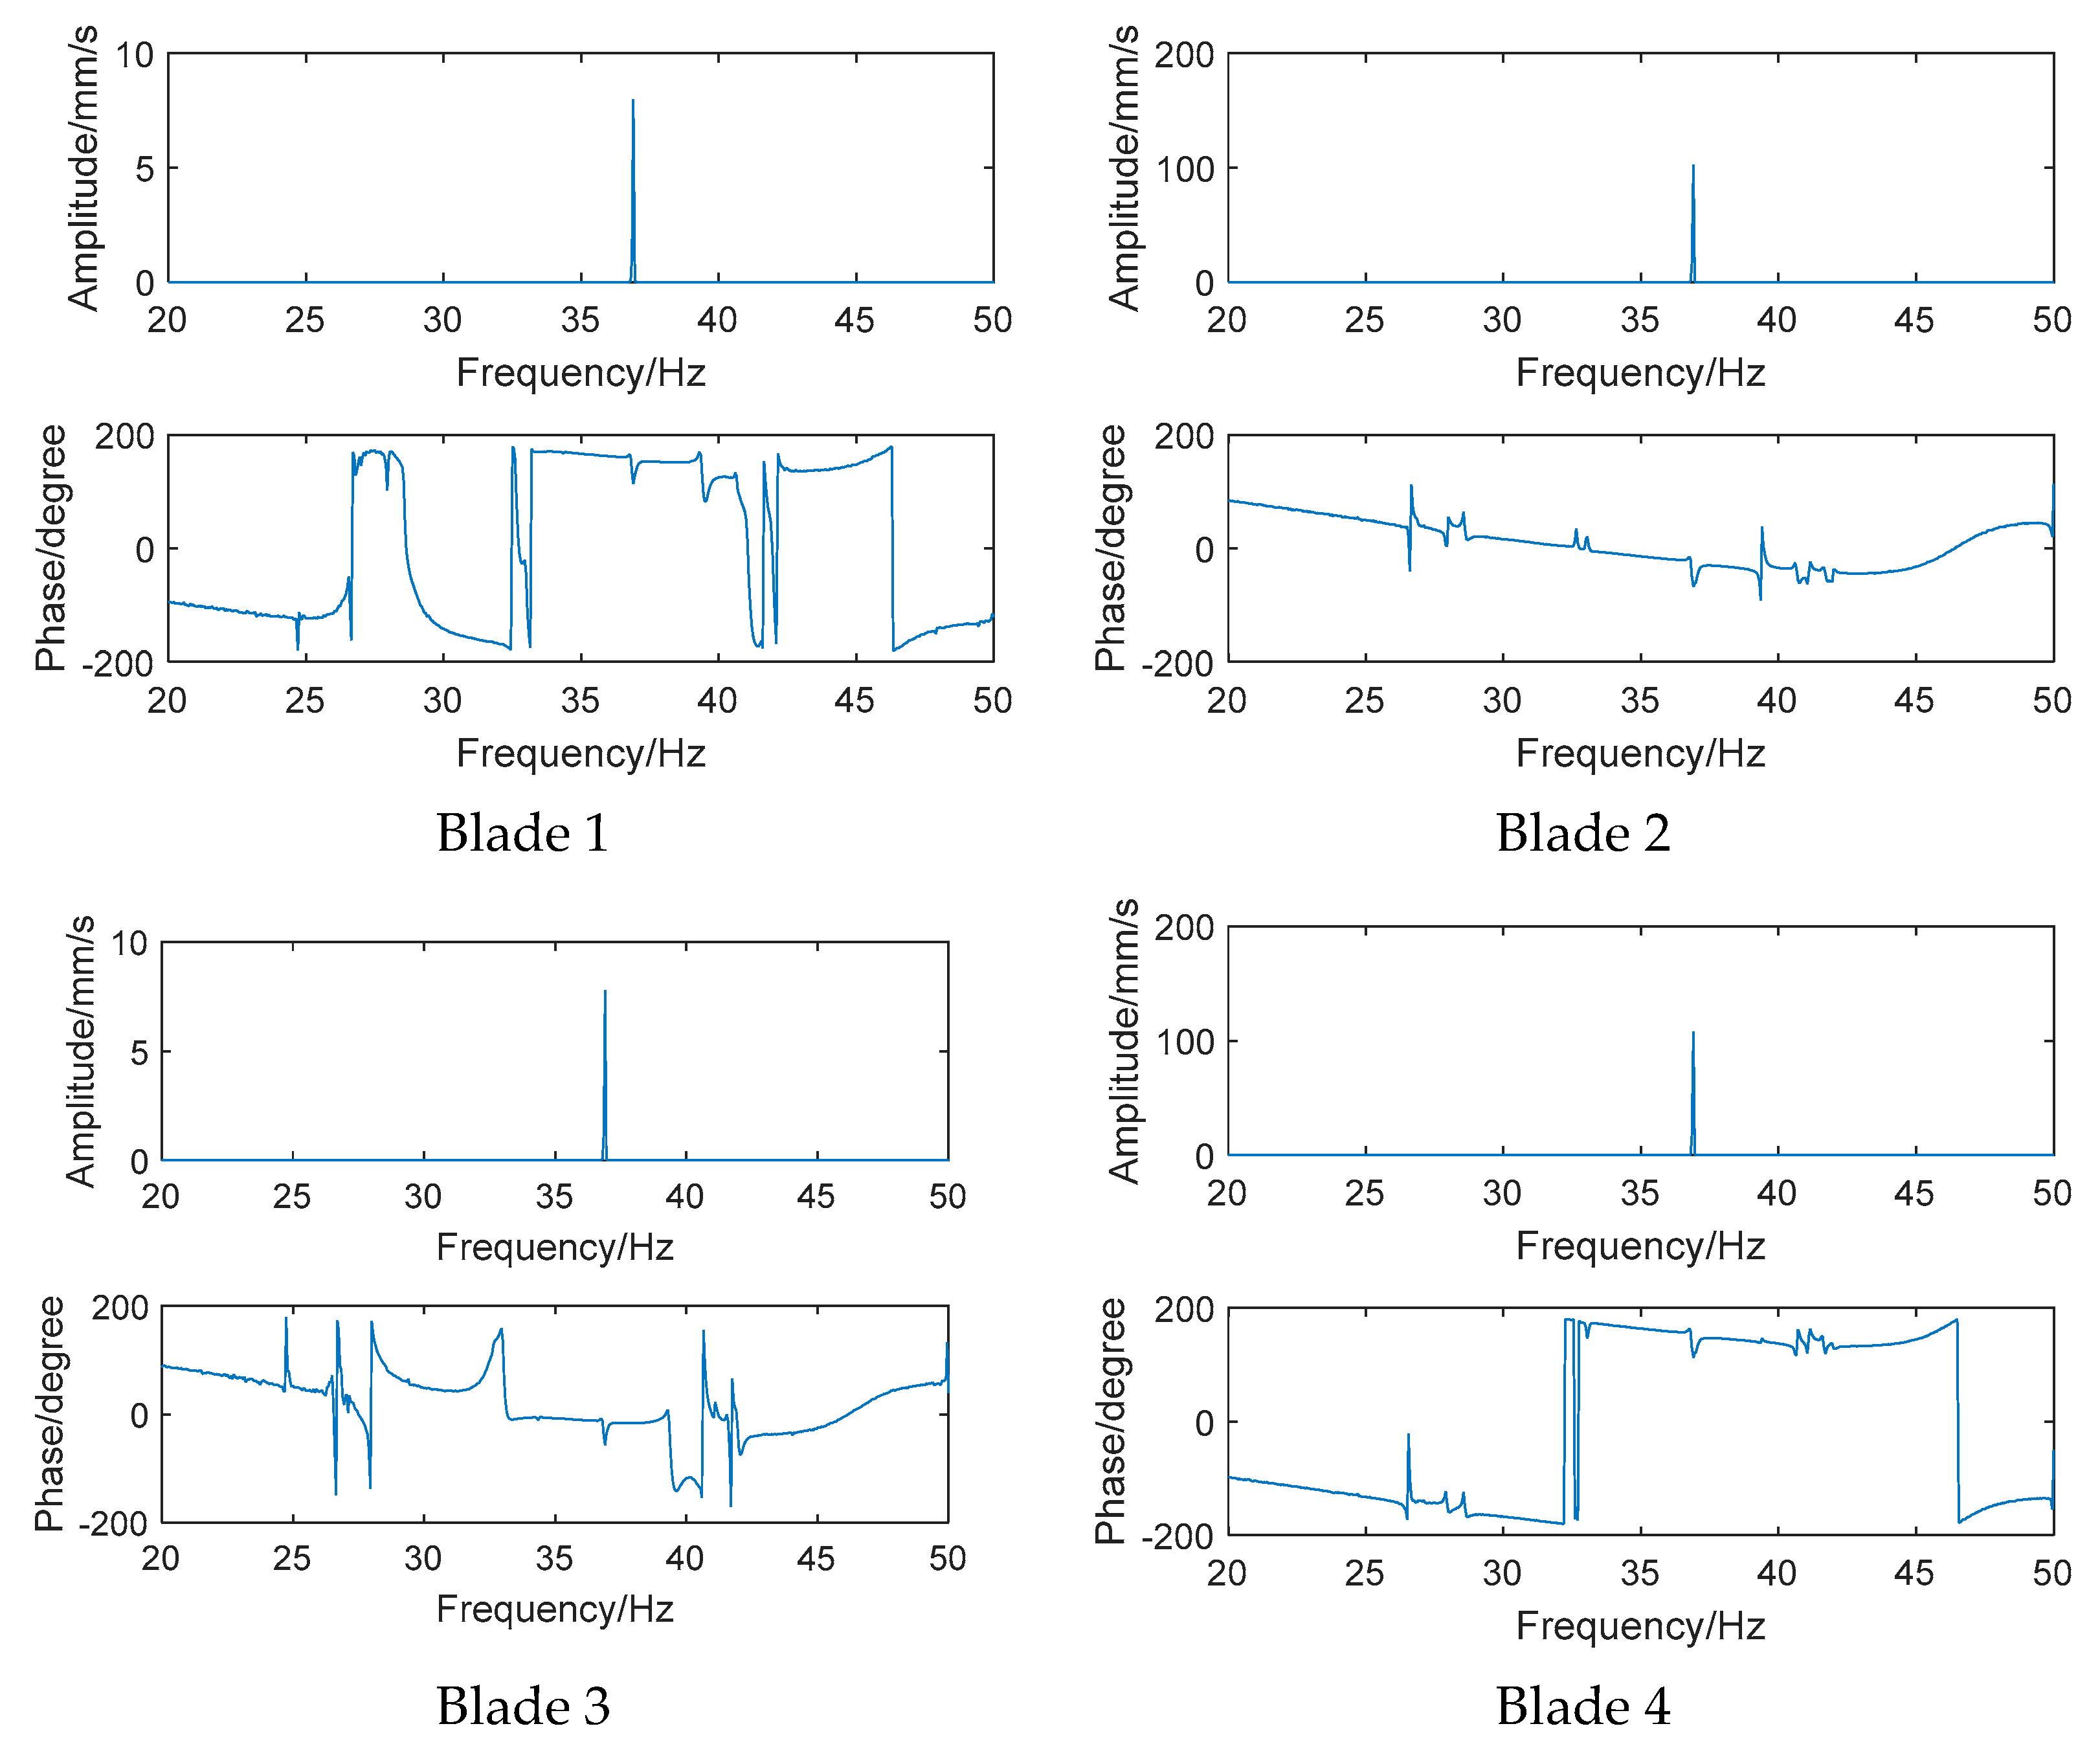
3.3.1. Identification of Vibration Phase Based on FRF
3.3.2. Identification of Vibration Phase Based on ODS FRF
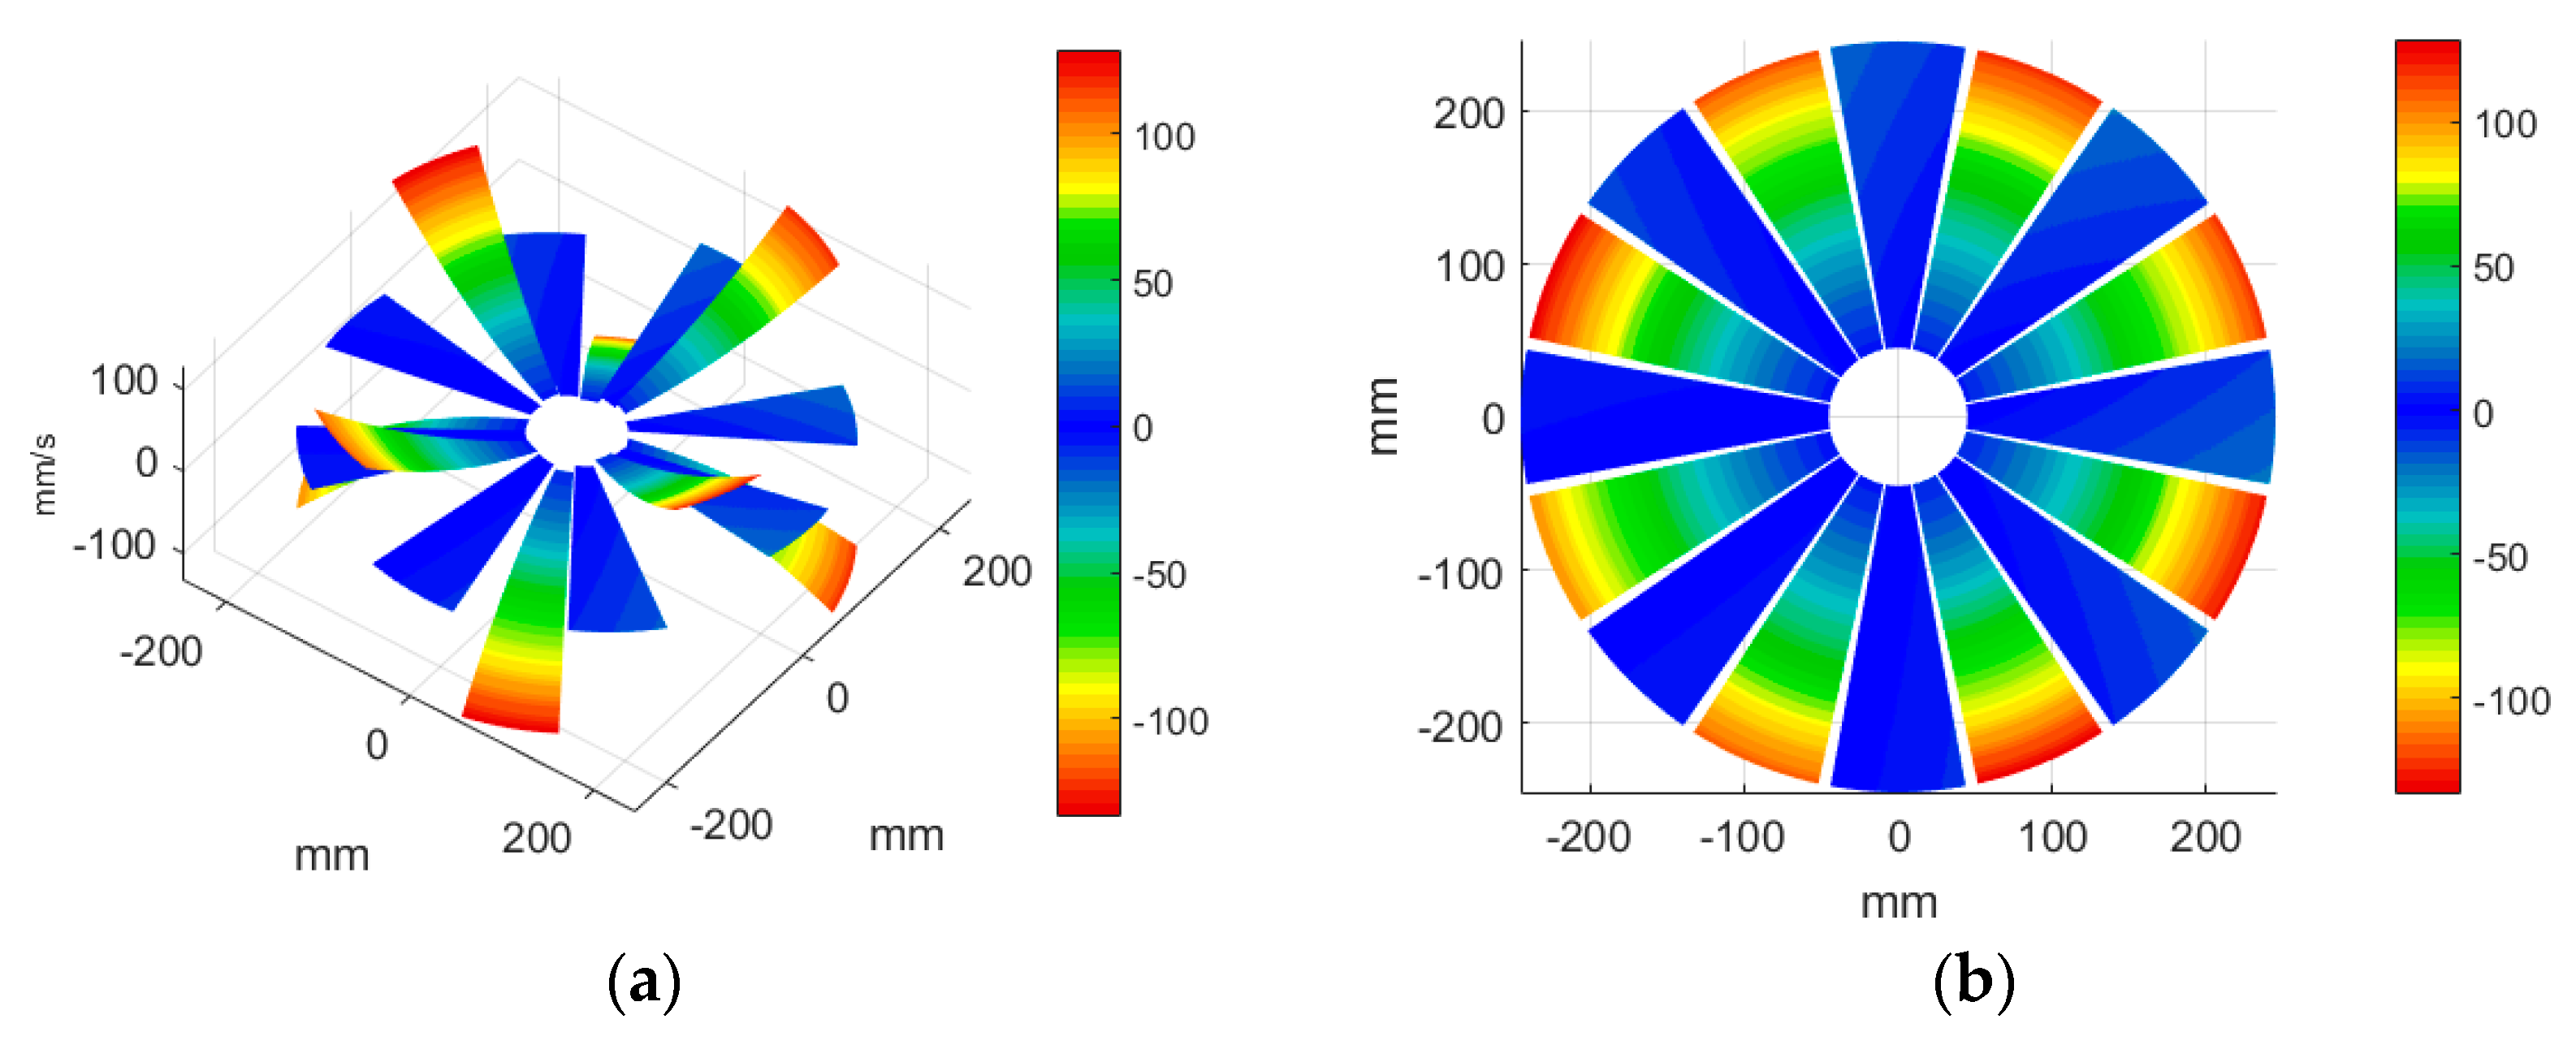
3.3.3. ODS Reconstruction of the Whole-Bladed Disk
4. Conclusions
Author Contributions
Funding
Data Availability Statement
Conflicts of Interest
References
- Chatterjee, A.; Kotambkar, M.S. Modal characteristics of turbine blade packets under lacing wire damage induced mistuning. J. Sound Vib. 2015, 343, 49–70. [Google Scholar] [CrossRef]
- Lu, Y.H.; Mei, Q.; Lei, M.Z.; Yu, J.J. Vibration stress test and dynamical evaluation for high rotational speed compressor. J. Propuls. Technol. 2014, 35, 1398–1403. (In Chinese) [Google Scholar]
- Philippe, J.; Thouverez, F.; Blanc, L.; Gruin, M. Vibratory behavior prediction of mistuned stator vane cluster: An industrial application. Comput. Struct. 2018, 196, 12–23. [Google Scholar] [CrossRef]
- Tang, W.; Epureanu, B.I.; Fillppi, S. Models for blisks with large blends and small mistuning. Mech. Syst. Signal Process. 2017, 87, 161–179. [Google Scholar] [CrossRef]
- Lim, H.S.; Chung, J.; Yoo, H.H. Modal analysis of a rotating multi-packet blade system. J. Sound Vib. 2009, 325, 513–531. [Google Scholar] [CrossRef]
- Witek, L.; Stachowicz, F. Modal analysis of the turbine blade at complex thermomechanical loads. Strength Mater. 2016, 48, 474–480. [Google Scholar] [CrossRef]
- Zhao, Z.B.; He, E.M.; Wang, H.J. Experimental Investigation on Natural Characteristics and Forced Response of Bladed Disks. Appl. Mech. Mater. 2011, 105–107, 34–37. [Google Scholar] [CrossRef]
- Yao, J.; Wang, J.; Li, Q. Improved Modal Localization and Excitation Factors for Understanding Mistuned Bladed Disk Response. J. Propuls. Power 2011, 27, 50–60. [Google Scholar] [CrossRef]
- Liao, H.; Wang, J.; Wang, S.; Li, Q. Experimental investigation of the worst-case mode localization for a mistuned bladed disk assemblies. J. Aerosp. Power 2011, 26, 8. [Google Scholar]
- Kumar, R.R.; Pandey, K.M. Static structural and modal analysis of gas Turbine blade. IOP Conf. Ser. Mater. Sci. Eng. 2017, 225, 012102. [Google Scholar] [CrossRef]
- Hancox, J.; Staples, B.C.; Parker, R.J. The application of scanning laser Doppler vibrometry in aero-engine development. Proc. Inst. Mech. Eng. Part G J. Aerosp. Eng. 2016, 209, 35–42. [Google Scholar] [CrossRef]
- Junge, B. Experiences with scanning laser vibrometry in automotive industries. International Conference on Vibration Measurements by Laser Techniques: Advances and Applications. Int. Soc. Opt. Photonics 1994, 2358, 377–385. [Google Scholar]
- Heinemann, T.; Becker, S. Axial fan blade vibration assessment under inlet cross-flow conditions using laser scanning vibrometry. Appl. Sci. 2017, 7, 862. [Google Scholar] [CrossRef]
- Hu, Y.; Kang, Y.; Yu, K.; Zhu, W.; Zhao, R. Complete operating deflection shapes and model updating for an excited structure in thermal environments via an optimized continuously scanning laser Doppler vibrometer with a two-dimension scan scheme. J. Sound Vib. 2023, 544, 117411. [Google Scholar] [CrossRef]
- Sriram, P.; Craig, J.I.; Hanagud, S. A scanning laser Doppler vibrometer for modal testing. Inst. Math. Its Appl. 1990, 5, 155–167. [Google Scholar]
- Halkon, B.J.; Frizzel, S.R.; Rothberg, S.J. Vibration measurements using continuous scanning laser vibrometry: Velocity sensitivity model experimental validation. Meas. Sci. Technol. 2003, 14, 382–393. [Google Scholar] [CrossRef]
- Stanbridge, A.B.; Martarelli, M.; Ewins, D.J. Measuring area vibration mode shapes with a continuous-scan LDV. Measurement 2004, 35, 181–189. [Google Scholar] [CrossRef]
- Stanbridge, A.B.; Ewins, D.J. Modal testing using a scanning laser Doppler vibrometer. Mech. Syst. Signal Process. 1999, 13, 255–270. [Google Scholar] [CrossRef]
- Yuan, K.; Zhu, W.D. Identification of modal parameters of a model turbine blade with a curved surface under random excitation with a three-dimensional continuously scanning laser Doppler vibrometer system. Measurement 2023, 214, 112759. [Google Scholar] [CrossRef]
- Yuan, K.; Zhu, W.D. A novel general-purpose three-dimensional continuously scanning laser Doppler vibrometer system for full-field vibration measurement of a structure with a curved surface. J. Sound Vib. 2022, 540, 117274. [Google Scholar] [CrossRef]
- Boudreau, A.; Paillard, B.; Rowntree, P. Broadband vibration measurements using a continuously scanning laser vibrometer. Meas. Sci. Technol. 2002, 13, 1574. [Google Scholar]
- Liu, C.; Zang, C.; Zhou, B. Extension of continuous scanning laser Doppler vibrometry measurement for complex structures with curved surfaces. Chin. J. Aeronaut. 2020, 33, 3220–3227. [Google Scholar] [CrossRef]
- Liu, C.H.; Zang, C.P.; Li, F.; Petrov, E.P. High Frequency Modal Testing of the Multiblade Packets Using a Noncontact Measurement and Excitation System. Shock Vib. 2020, 5, 1–12. [Google Scholar] [CrossRef]
- Richardson, M.H. Is it a mode shape, or an operating deflection shape? Sound Vib. 1997, 31, 54–61. [Google Scholar]
- Zhang, Y.L.; Zhang, L.M.; Sun, W.G.; Qiu, F.L. Modal contribution analysis of intercity rails under working conditions based on ODS FRF. Noise Vib. Control 2014, 34, 65–69. (In Chinese) [Google Scholar]


| Order | Frequency/Hz | Nd | Order | Frequency/Hz | Nd |
|---|---|---|---|---|---|
| 1 | 26.74 | 1 | 9 | 38.40 | 4 |
| 2 | 26.74 | 1 | 10 | 41.16 | 5 |
| 3 | 27.10 | 0 | 11 | 41.16 | 5 |
| 4 | 28.51 | 2 | 12 | 42.76 | 6 |
| 5 | 28.51 | 2 | 13 | 42.76 | 6 |
| 6 | 33.89 | 3 | 14 | 43.61 | 7 |
| 7 | 33.89 | 3 | 15 | 43.61 | 7 |
| 8 | 38.40 | 4 | 16 | 43.87 | 8 |
| No. | ODS | No. | ODS |
|---|---|---|---|
| 1 |  | 2 |  |
| 3 |  | 4 | 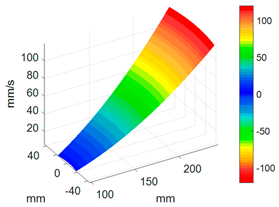 |
| 5 |  | 6 | 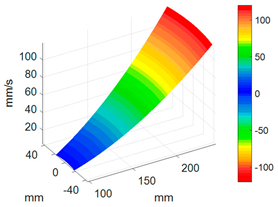 |
| 7 | 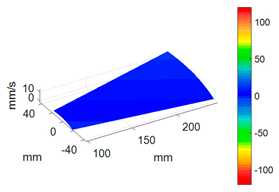 | 8 | 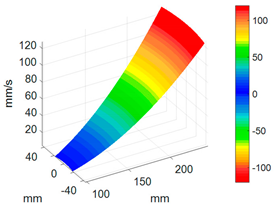 |
| 9 |  | 10 | 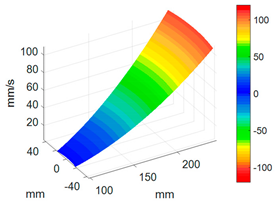 |
| 11 |  | 12 | 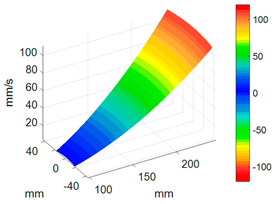 |
| 13 |  | 14 |  |
| 15 |  | 16 |  |
| No. | Phase Angle/° | No. | Phase Angle/° |
|---|---|---|---|
| 1 | 113.63 | 2 | −67.65 |
| 3 | −56.86 | 4 | 112.8 |
| 5 | 149.26 | 6 | −65.49 |
| 7 | 20.83 | 8 | 115.42 |
| 9 | −4.97 | 10 | −65.03 |
| 11 | 152.42 | 12 | 114.58 |
| 13 | −4.96 | 14 | −64.41 |
| 15 | −85.40 | 16 | 114.76 |
| No. of Blade | Phase Angle | No. of Blade | Phase Angle |
|---|---|---|---|
| 1 | −0.60 | 2 | 179.28 |
| 3 | −171.02 | 4 | −0.79 |
| 5 | 36.01 | 6 | 179.24 |
| 7 | −93.00 | 8 | −0.08 |
| 9 | −123.11 | 10 | 179.5 |
| 11 | 35.16 | 12 | −0.71 |
| 13 | −123.26 | 14 | 179.41 |
| 15 | 156.99 | 16 | −0.66 |
Disclaimer/Publisher’s Note: The statements, opinions and data contained in all publications are solely those of the individual author(s) and contributor(s) and not of MDPI and/or the editor(s). MDPI and/or the editor(s) disclaim responsibility for any injury to people or property resulting from any ideas, methods, instructions or products referred to in the content. |
© 2024 by the authors. Licensee MDPI, Basel, Switzerland. This article is an open access article distributed under the terms and conditions of the Creative Commons Attribution (CC BY) license (https://creativecommons.org/licenses/by/4.0/).
Share and Cite
Liu, C.; Xu, T.; Chen, T.; Su, S.; Huang, J.; Li, Y. Operational Deflection Shape Measurements on Bladed Disks with Continuous Scanning Laser Doppler Vibrometry. Sensors 2024, 24, 3413. https://doi.org/10.3390/s24113413
Liu C, Xu T, Chen T, Su S, Huang J, Li Y. Operational Deflection Shape Measurements on Bladed Disks with Continuous Scanning Laser Doppler Vibrometry. Sensors. 2024; 24(11):3413. https://doi.org/10.3390/s24113413
Chicago/Turabian StyleLiu, Cuihong, Tengzhou Xu, Tao Chen, Shi Su, Jie Huang, and Yijin Li. 2024. "Operational Deflection Shape Measurements on Bladed Disks with Continuous Scanning Laser Doppler Vibrometry" Sensors 24, no. 11: 3413. https://doi.org/10.3390/s24113413