
Gait Variability as a Potential Motor Marker of Cerebellar Disease—Relationship between Variability of Stride, Arm Swing and Trunk Movements, and Walking Speed

 , ,
, ,  and
and
Abstract
1. Introduction
2. Methods
2.1. Study Cohorts and Dataset
2.2. Protocol for Gait Assessment
2.3. Statistical Analyses
3. Results
3.1. Patients with Cerebellar Ataxia
3.2. Patients with Essential Tremor
3.3. Healthy Elderly
3.4. Group Comparison per Walking Speed Category
4. Discussion
5. Conclusions
Supplementary Materials
Author Contributions
Funding
Institutional Review Board Statement
Informed Consent Statement
Data Availability Statement
Conflicts of Interest
References
- Globas, C.; du Montcel, S.T.; Baliko, L.; Boesch, S.; Depondt, C.; DiDonato, S.; Durr, A.; Filla, A.; Klockgether, T.; Mariotti, C.; et al. Early Symptoms in Spinocerebellar Ataxia Type 1, 2, 3, and 6. Mov. Disord. 2008, 23, 2232–2238. [Google Scholar] [CrossRef] [PubMed]
- Klockgether, T.; Lüdtke, R.; Kramer, B.; Abele, M.; Bürk, K.; Schöls, L.; Riess, O.; Laccone, F.; Boesch, S.; Lopes-Cendes, I.; et al. The Natural History of Degenerative Ataxia: A Retrospective Study in 466 Patients. Brain 1998, 121 Pt 4, 589–600. [Google Scholar] [CrossRef] [PubMed]
- Ilg, W.; Fleszar, Z.; Schatton, C.; Hengel, H.; Harmuth, F.; Bauer, P.; Timmann, D.; Giese, M.; Schöls, L.; Synofzik, M. Individual Changes in Preclinical Spinocerebellar Ataxia Identified Via Increased Motor Complexity. Mov. Disord. 2016, 31, 1891–1900. [Google Scholar] [CrossRef] [PubMed]
- Suzuki, M.; Hirano, S.; Otte, K.; Schmitz-Hübsch, T.; Izumi, M.; Tamura, M.; Kuroiwa, R.; Sugiyama, A.; Mori, M.; Röhling, H.M.; et al. Digital Motor Biomarkers of Cerebellar Ataxia Using an Rgb-Depth Camera-Based Motion Analysis System. Cerebellum 2023, 23, 1031–1041. [Google Scholar] [CrossRef] [PubMed]
- Cabaraux, P.; Agrawal, S.K.; Cai, H.; Calabro, R.S.; Casali, C.; Damm, L.; Doss, S.; Habas, C.; Horn, A.K.E.; Ilg, W.; et al. Consensus Paper: Ataxic Gait. Cerebellum 2023, 22, 394–430. [Google Scholar] [CrossRef] [PubMed]
- Ilg, W.; Milne, S.; Schmitz-Hübsch, T.; Alcock, L.; Beichert, L.; Bertini, E.; Mohamed Ibrahim, N.; Dawes, H.; Gomez, C.M.; Hanagasi, H.; et al. Quantitative Gait and Balance Outcomes for Ataxia Trials: Consensus Recommendations by the Ataxia Global Initiative Working Group on Digital-Motor Biomarkers. Cerebellum 2023. [Google Scholar] [CrossRef] [PubMed]
- Shah, V.V.; Rodriguez-Labrada, R.; Horak, F.B.; McNames, J.; Casey, H.; Hansson Floyd, K.; El-Gohary, M.; Schmahmann, J.D.; Rosenthal, L.S.; Perlman, S.; et al. Gait Variability in Spinocerebellar Ataxia Assessed Using Wearable Inertial Sensors. Mov. Disord. 2021, 36, 2922–2931. [Google Scholar] [CrossRef] [PubMed]
- Stolze, H.; Klebe, S.; Petersen, G.; Raethjen, J.; Wenzelburger, R.; Witt, K.; Deuschl, G. Typical Features of Cerebellar Ataxic Gait. J. Neurol. Neurosurg. Psychiatry 2002, 73, 310. [Google Scholar] [CrossRef] [PubMed]
- Palliyath, S.; Hallett, M.; Thomas, S.L.; Lebiedowska, M.K. Gait in Patients with Cerebellar Ataxia. Mov. Disord. 1998, 13, 958–964. [Google Scholar] [CrossRef]
- Ilg, W.; Golla, H.; Thier, P.; Giese, M.A. Specific Influences of Cerebellar Dysfunctions on Gait. Brain 2007, 130, 786–798. [Google Scholar] [CrossRef]
- Fasano, A.; Herzog, J.; Raethjen, J.; Rose, F.E.; Muthuraman, M.; Volkmann, J.; Falk, D.; Elble, R.; Deuschl, G. Gait Ataxia in Essential Tremor Is Differentially Modulated by Thalamic Stimulation. Brain 2010, 133, 3635–3648. [Google Scholar] [CrossRef] [PubMed]
- Velázquez-Pérez, L.; Rodriguez-Labrada, R.; González-Garcés, Y.; Arrufat-Pie, E.; Torres-Vega, R.; Medrano-Montero, J.; Ramirez-Bautista, B.; Vazquez-Mojena, Y.; Auburger, G.; Horak, F.; et al. Prodromal Spinocerebellar Ataxia Type 2 Subjects Have Quantifiable Gait and Postural Sway Deficits. Mov. Disord. 2021, 36, 471–480. [Google Scholar] [CrossRef] [PubMed]
- Rochester, L.; Galna, B.; Lord, S.; Mhiripiri, D.; Eglon, G.; Chinnery, P.F. Gait Impairment Precedes Clinical Symptoms in Spinocerebellar Ataxia Type 6. Mov. Disord. 2014, 29, 252–255. [Google Scholar] [CrossRef] [PubMed]
- Ilg, W.; Müller, B.; Faber, J.; van Gaalen, J.; Hengel, H.; Vogt, I.R.; Hennes, G.; van de Warrenburg, B.; Klockgether, T.; Schöls, L.; et al. Digital Gait Biomarkers Allow to Capture 1-Year Longitudinal Change in Spinocerebellar Ataxia Type 3. Mov. Disord. 2022, 37, 2295–2301. [Google Scholar] [CrossRef] [PubMed]
- Thierfelder, A.; Seemann, J.; John, N.; Harmuth, F.; Giese, M.; Schüle, R.; Schöls, L.; Timmann, D.; Synofzik, M.; Ilg, W. Real-Life Turning Movements Capture Subtle Longitudinal and Preataxic Changes in Cerebellar Ataxia. Mov. Disord. 2022, 37, 1047–1058. [Google Scholar] [CrossRef] [PubMed]
- Faber, J.; Berger, M.; Wilke, C.; Hubener-Schmid, J.; Schaprian, T.; Santana, M.M.; Grobe-Einsler, M.; Onder, D.; Koyak, B.; Giunti, P.; et al. Stage-Dependent Biomarker Changes in Spinocerebellar Ataxia Type 3. Ann. Neurol. 2023, 95, 400–406. [Google Scholar] [CrossRef] [PubMed]
- Lord, S.; Galna, B.; Verghese, J.; Coleman, S.; Burn, D.; Rochester, L. Independent Domains of Gait in Older Adults and Associated Motor and Nonmotor Attributes: Validation of a Factor Analysis Approach. J. Gerontol. Ser. A 2012, 68, 820–827. [Google Scholar] [CrossRef] [PubMed]
- Yamagata, S.; Yamaguchi, T.; Shinya, M.; Milosevic, M.; Masani, K. Comparison of Sensitivity among Dynamic Balance Measures During Walking with Different Tasks. R. Soc. Open Sci. 2024, 11, 230883. [Google Scholar] [CrossRef] [PubMed]
- Chien, J.H.; Yentes, J.; Stergiou, N.; Siu, K.C. The Effect of Walking Speed on Gait Variability in Healthy Young, Middle-aged and Elderly Individuals. J. Phys. Act. Nutr. Rehabil. 2015, 2015. Available online: https://www.ncbi.nlm.nih.gov/pmc/articles/PMC4768759/pdf/nihms758112.pdf (accessed on 23 May 2024).
- Schniepp, R.; Wuehr, M.; Neuhaeusser, M.; Kamenova, M.; Dimitriadis, K.; Klopstock, T.; Strupp, M.; Brandt, T.; Jahn, K. Locomotion Speed Determines Gait Variability in Cerebellar Ataxia and Vestibular Failure. Mov. Disord. 2012, 27, 125–131. [Google Scholar] [CrossRef]
- Schniepp, R.; Wuehr, M.; Schlick, C.; Huth, S.; Pradhan, C.; Dieterich, M.; Brandt, T.; Jahn, K. Increased Gait Variability Is Associated with the History of Falls in Patients with Cerebellar Ataxia. J. Neurol. 2014, 261, 213–223. [Google Scholar] [CrossRef]
- Schmitz-Hübsch, T.; Lux, S.; Bauer, P.; Brandt, A.U.; Schlapakow, E.; Greschus, S.; Scheel, M.; Gärtner, H.; Kirlangic, M.E.; Gras, V.; et al. Spinocerebellar Ataxia Type 14: Refining Clinicogenetic Diagnosis in a Rare Adult-Onset Disorder. Ann. Clin. Transl. Neurol. 2021, 8, 774–789. [Google Scholar] [CrossRef] [PubMed]
- Doss, S.; Rinnenthal, J.L.; Schmitz-Hübsch, T.; Brandt, A.U.; Papazoglou, S.; Lux, S.; Maul, S.; Würfel, J.; Endres, M.; Klockgether, T.; et al. Cerebellar Neurochemical Alterations in Spinocerebellar Ataxia Type 14 Appear to Include Glutathione Deficiency. J. Neurol. 2015, 262, 1927–1935. [Google Scholar] [CrossRef] [PubMed]
- Chen, D.-H.; Cimino, P.J.; Ranum, L.P.W.; Zoghbi, H.Y.; Yabe, I.; Schut, L.; Margolis, R.L.; Lipe, H.P.; Feleke, A.; Matsushita, M.; et al. The Clinical and Genetic Spectrum of Spinocerebellar Ataxia 14. Neurology 2005, 64, 1258–1260. [Google Scholar] [CrossRef] [PubMed]
- Brkanac, Z.; Bylenok, L.; Fernandez, M.; Matsushita, M.; Lipe, H.; Wolff, J.; Nochlin, D.; Raskind, W.H.; Bird, T.D. A New Dominant Spinocerebellar Ataxia Linked to Chromosome 19q13.4-qter. Arch. Neurol. 2002, 59, 1291–1295. [Google Scholar] [CrossRef]
- Stolze, H.; Petersen, G.; Raethjen, J.; Wenzelburger, R.; Deuschl, G. The Gait Disorder of Advanced Essential Tremor. Brain 2001, 124, 2278–2286. [Google Scholar] [CrossRef]
- Fasano, A.; Herzog, J.; Raethjen, J.; Rose, F.E.; Volkmann, J.; Falk, D.; Deuschl, G. Lower Limb Joints Kinematics in Essential Tremor and the Effect of Thalamic Stimulation. Gait Posture 2012, 36, 187–193. [Google Scholar] [CrossRef]
- Elshehabi, M.; Del Din, S.; Hobert, M.A.; Warmerdam, E.; Sünkel, U.; Schmitz-Hübsch, T.; Behncke, L.M.; Heinzel, S.; Brockmann, K.; Metzger, F.G.; et al. Walking Parameters of Older Adults from a Lower Back Inertial Measurement Unit, a 6-Year Longitudinal Observational Study. Front. Aging Neurosci. 2022, 14, 789220. [Google Scholar] [CrossRef]
- Schmitz-Hubsch, T.; du Montcel, S.T.; Baliko, L.; Berciano, J.; Boesch, S.; Depondt, C.; Giunti, P.; Globas, C.; Infante, J.; Kang, J.S.; et al. Scale for the Assessment and Rating of Ataxia: Development of a New Clinical Scale. Neurology 2006, 66, 1717–1720. [Google Scholar] [CrossRef]
- Schmitz-Hubsch, T.; Brandt, A.U.; Pfueller, C.; Zange, L.; Seidel, A.; Kuhn, A.A.; Paul, F.; Minnerop, M.; Doss, S. Accuracy and Repeatability of Two Methods of Gait Analysis—Gaitrite Und Mobility Lab—In Subjects with Cerebellar Ataxia. Gait Posture 2016, 48, 194–201. [Google Scholar] [CrossRef]
- Kroneberg, D.; Elshehabi, M.; Meyer, A.-C.; Otte, K.; Doss, S.; Paul, F.; Nussbaum, S.; Berg, D.; Kühn, A.A.; Maetzler, W.; et al. Less Is More—Estimation of the Number of Strides Required to Assess Gait Variability in Spatially Confined Settings. Front. Aging Neurosci. 2019, 10, 435. [Google Scholar] [CrossRef] [PubMed]
- Gaenslen, A.; Wurster, I.; Brockmann, K.; Huber, H.; Godau, J.; Faust, B.; Lerche, S.; Eschweiler, G.W.; Maetzler, W.; Berg, D. Prodromal Features for Parkinson’s Disease--Baseline Data from the Trend Study. Eur. J. Neurol. 2014, 21, 766–772. [Google Scholar] [CrossRef] [PubMed]
- Washabaugh, E.P.; Kalyanaraman, T.; Adamczyk, P.G.; Claflin, E.S.; Krishnan, C. Validity and Repeatability of Inertial Measurement Units for Measuring Gait Parameters. Gait Posture 2017, 55, 87–93. [Google Scholar] [CrossRef] [PubMed]
- Bohannon, R.W. Comfortable and Maximum Walking Speed of Adults Aged 20–79 Years: Reference Values and Determinants. Age Ageing 1997, 26, 15–19. [Google Scholar] [CrossRef] [PubMed]
- Poleur, M.; Ulinici, A.; Daron, A.; Schneider, O.; Farra, F.D.; Demonceau, M.; Annoussamy, M.; Vissière, D.; Eggenspieler, D.; Servais, L. Normative Data on Spontaneous Stride Velocity, Stride Length, and Walking Activity in a Non-Controlled Environment. Orphanet J. Rare Dis. 2021, 16, 318. [Google Scholar] [CrossRef] [PubMed]
- Collins, S.H.; Adamczyk, P.G.; Kuo, A.D. Dynamic Arm Swinging in Human Walking. Proc. Biol. Sci. 2009, 276, 3679–3688. [Google Scholar] [CrossRef] [PubMed]
- Massaad, F.; Levin, O.; Meyns, P.; Drijkoningen, D.; Swinnen, S.P.; Duysens, J. Arm Sway Holds Sway: Locomotor-Like Modulation of Leg Reflexes When Arms Swing in Alternation. Neuroscience 2014, 258, 34–46. [Google Scholar] [CrossRef] [PubMed]
- Sylos-Labini, F.; Ivanenko, Y.P.; Maclellan, M.J.; Cappellini, G.; Poppele, R.E.; Lacquaniti, F. Locomotor-Like Leg Movements Evoked by Rhythmic Arm Movements in Humans. PLoS ONE 2014, 9, e90775. [Google Scholar] [CrossRef] [PubMed]
- Heinrich, I.; Rosenthal, F.; Patra, S.; Schulz, K.-H.; Welsch, G.H.; Vettorazzi, E.; Rosenkranz, S.C.; Stellmann, J.P.; Ramien, C.; Pöttgen, J.; et al. Arm Ergometry to Improve Mobility in Progressive Multiple Sclerosis (AMBOS)—Results of a Pilot Randomized Controlled Trial. Front. Neurol. 2021, 12, 644533. [Google Scholar] [CrossRef]
- Kuo, A.D. The Six Determinants of Gait and the Inverted Pendulum Analogy: A Dynamic Walking Perspective. Hum. Mov. Sci. 2007, 26, 617–656. [Google Scholar] [CrossRef]
- Latt, M.D.; Menz, H.B.; Fung, V.S.; Lord, S.R. Walking Speed, Cadence and Step Length Are Selected to Optimize the Stability of Head and Pelvis Accelerations. Exp. Brain Res. 2008, 184, 201–209. [Google Scholar] [CrossRef]
- Wuehr, M.; Schniepp, R.; Ilmberger, J.; Brandt, T.; Jahn, K. Speed-Dependent Temporospatial Gait Variability and Long-Range Correlations in Cerebellar Ataxia. Gait Posture 2013, 37, 214–218. [Google Scholar] [CrossRef] [PubMed]
- Walter, J.T.; Alviña, K.; Womack, M.D.; Chevez, C.; Khodakhah, K. Decreases in the Precision of Purkinje Cell Pacemaking Cause Cerebellar Dysfunction and Ataxia. Nat. Neurosci. 2006, 9, 389–397. [Google Scholar] [CrossRef]
- Rao, A.K.; Louis, E.D. Timing Control of Gait: A Study of Essential Tremor Patients vs. Age-Matched Controls. Cerebellum Ataxias 2016, 3, 5. [Google Scholar] [CrossRef]
- Collins, S.H.; Kuo, A.D. Two Independent Contributions to Step Variability During over-Ground Human Walking. PLoS ONE 2013, 8, e73597. [Google Scholar] [CrossRef]
- Schmitz-Hübsch, T.; Giunti, P.; Stephenson, D.A.; Globas, C.; Baliko, L.; Saccà, F.; Mariotti, C.; Rakowicz, M.; Szymanski, S.; Infante, J.; et al. Sca Functional Index. Neurology 2008, 71, 486. [Google Scholar] [CrossRef] [PubMed]
- Afonso-Reis, R.; Afonso, I.T.; Nóbrega, C. Current Status of Gene Therapy Research in Polyglutamine Spinocerebellar Ataxias. Int. J. Mol. Sci. 2021, 22, 4249. [Google Scholar] [CrossRef]
- Galna, B.; Lord, S.; Rochester, L. Is Gait Variability Reliable in Older Adults and Parkinson’s Disease? Towards an Optimal Testing Protocol. Gait Posture 2013, 37, 580–585. [Google Scholar] [CrossRef]
- Konig, N.; Singh, N.B.; von Beckerath, J.; Janke, L.; Taylor, W.R. Is Gait Variability Reliable? An Assessment of Spatio-Temporal Parameters of Gait Variability During Continuous Overground Walking. Gait Posture 2014, 39, 615–617. [Google Scholar] [CrossRef]
- Hollman, J.H.; Childs, K.B.; McNeil, M.L.; Mueller, A.C.; Quilter, C.M.; Youdas, J.W. Number of Strides Required for Reliable Measurements of Pace, Rhythm and Variability Parameters of Gait During Normal and Dual Task Walking in Older Individuals. Gait Posture 2010, 32, 23–28. [Google Scholar] [CrossRef]


| (A) | ||||||||||||||||
|---|---|---|---|---|---|---|---|---|---|---|---|---|---|---|---|---|
| Gait Parameter ± STD | SCA | ET | HE | |||||||||||||
| Slow | Comf | Fast | Slow | Comf | Fast | Comf | Fast | |||||||||
| Trunk Horizontal RoM [degrees] | 6.12 | 6.05 | 6.90 | 5.83 | 5.23 | 5.99 | 5.20 | 5.44 | ||||||||
| ± | 2.08 | ± | 1.96 | ± | 1.76 | ± | 2.63 | ± | 2.73 | ± | 2.86 | ± | 2.33 | ± | 2.24 | |
| Trunk Sagittal RoM [degrees] | 4.14 | 4.75 | 5.17 | 3.85 | 4.30 | 4.72 | 4.22 | 4.65 | ||||||||
| ± | 1.27 | ± | 1.35 | ± | 1.01 | ± | 1.05 | ± | 1.28 | ± | 1.62 | ± | 1.42 | ± | 1.59 | |
| Trunk Frontal RoM [degrees] | 9.75 | 8.33 | 7.93 | 7.33 | 6.78 | 6.81 | 8.71 | 8.34 | ||||||||
| ± | 3.51 | ± | 1.99 | ± | 2.63 | ± | 2.55 | ± | 2.12 | ± | 2.21 | ± | 2.77 | ± | 2.74 | |
| Arms RoM [degrees] | 14.69 | 20.59 | 27.15 | 20.15 | 25.94 | 36.32 | 31.99 | 35.24 | ||||||||
| ± | 7.89 | ± | 10.62 | ± | 15.29 | ± | 14.37 | ± | 16.59 | ± | 20.16 | ± | 13.92 | ± | 14.22 | |
| Peak Arm Swing Velocity [degrees/s] | 122.47 | 173.59 | 253.82 | 149.96 | 188.37 | 289.84 | 233.48 | 289.18 | ||||||||
| ± | 56.37 | ± | 65.18 | ± | 100.10 | ± | 58.70 | ± | 69.34 | ± | 101.93 | ± | 75.14 | ± | 82.29 | |
| Stride Velocity [%stature/s] | 45.72 | 65.83 | 79.73 | 61.26 | 75.80 | 87.99 | 83.96 | 95.46 | ||||||||
| ± | 12.30 | ± | 17.03 | ± | 20.46 | ± | 10.35 | ± | 9.13 | ± | 10.65 | ± | 8.48 | ± | 9.78 | |
| Stride Velocity [m/s] | 0.76 | 1.10 | 1.34 | 1.01 | 1.27 | 1.50 | 1.43 | 1.63 | ||||||||
| ± | 0.18 | ± | 0.28 | ± | 0.35 | ± | 0.16 | ± | 0.16 | ± | 0.20 | ± | 0.14 | ± | 0.17 | |
| Stride Length | 59.18 | 70.82 | 73.52 | 77.93 | 82.06 | 84.65 | 85.90 | 87.09 | ||||||||
| [%stature] | ± | 12.58 | ± | 14.37 | ± | 12.61 | ± | 6.17 | ± | 6.31 | ± | 6.96 | ± | 5.21 | ± | 5.32 |
| Stride Length | 0.99 | 1.19 | 1.24 | 1.32 | 1.39 | 1.44 | 1.47 | 1.50 | ||||||||
| [m] | ± | 0.20 | ± | 0.25 | ± | 0.22 | ± | 0.14 | ± | 0.15 | ± | 0.17 | ± | 0.11 | ± | 0.11 |
| (B) | ||||||||||||||||
| CoV Gait Parameter ± STD | SCA | ET | HE | |||||||||||||
| Slow | Comf | Fast | Slow | Comf | Fast | Comf | Fast | |||||||||
| CoV Trunk Horizontal RoM | 0.199 | 0.207 | 0.204 | 0.240 | 0.212 | 0.186 | 0.194 | 0.186 | ||||||||
| ± | 0.066 | ± | 0.069 | ± | 0.085 | ± | 0.068 | ± | 0.076 | ± | 0.075 | ± | 0.062 | ± | 0.066 | |
| CoV Trunk Sagittal RoM | 0.218 | 0.199 | 0.204 | 0.226 | 0.183 | 0.164 | 0.158 | 0.172 | ||||||||
| ± | 0.091 | ± | 0.061 | ± | 0.075 | ± | 0.070 | ± | 0.067 | ± | 0.066 | ± | 0.042 | ± | 0.051 | |
| CoV Trunk Frontal RoM | 0.203 | 0.207 | 0.235 | 0.197 | 0.220 | 0.196 | 0.178 | 0.186 | ||||||||
| ± | 0.046 | ± | 0.042 | ± | 0.113 | ± | 0.070 | ± | 0.111 | ± | 0.088 | ± | 0.059 | ± | 0.063 | |
| CoV Arms RoM | 0.193 | 0.144 | 0.141 | 0.133 | 0.130 | 0.114 | 0.136 | 0.162 | ||||||||
| ± | 0.081 | ± | 0.070 | ± | 0.093 | ± | 0.043 | ± | 0.052 | ± | 0.048 | ± | 0.057 | ± | 0.076 | |
| CoV Peak Arm Swing Velocity | 0.142 | 0.109 | 0.111 | 0.129 | 0.114 | 0.097 | 0.120 | 0.118 | ||||||||
| ± | 0.031 | ± | 0.047 | ± | 0.041 | ± | 0.068 | ± | 0.047 | ± | 0.033 | ± | 0.052 | ± | 0.041 | |
| CoV Stride Velocity | 0.101 | 0.069 | 0.066 | 0.048 | 0.029 | 0.025 | 0.028 | 0.034 | ||||||||
| ± | 0.046 | ± | 0.069 | ± | 0.061 | ± | 0.021 | ± | 0.015 | ± | 0.009 | ± | 0.008 | ± | 0.010 | |
| CoV Stride Length | 0.076 | 0.046 | 0.039 | 0.027 | 0.022 | 0.017 | 0.019 | 0.023 | ||||||||
| ± | 0.034 | ± | 0.037 | ± | 0.032 | ± | 0.008 | ± | 0.008 | ± | 0.006 | ± | 0.006 | ± | 0.007 | |
| (A) | |||||||||
|---|---|---|---|---|---|---|---|---|---|
| Parameter | SCA | ET | HE | ||||||
| R2 | p | Regression Statistics | R2 | p | Regression Statistics | R2 | p | Regression Statistics | |
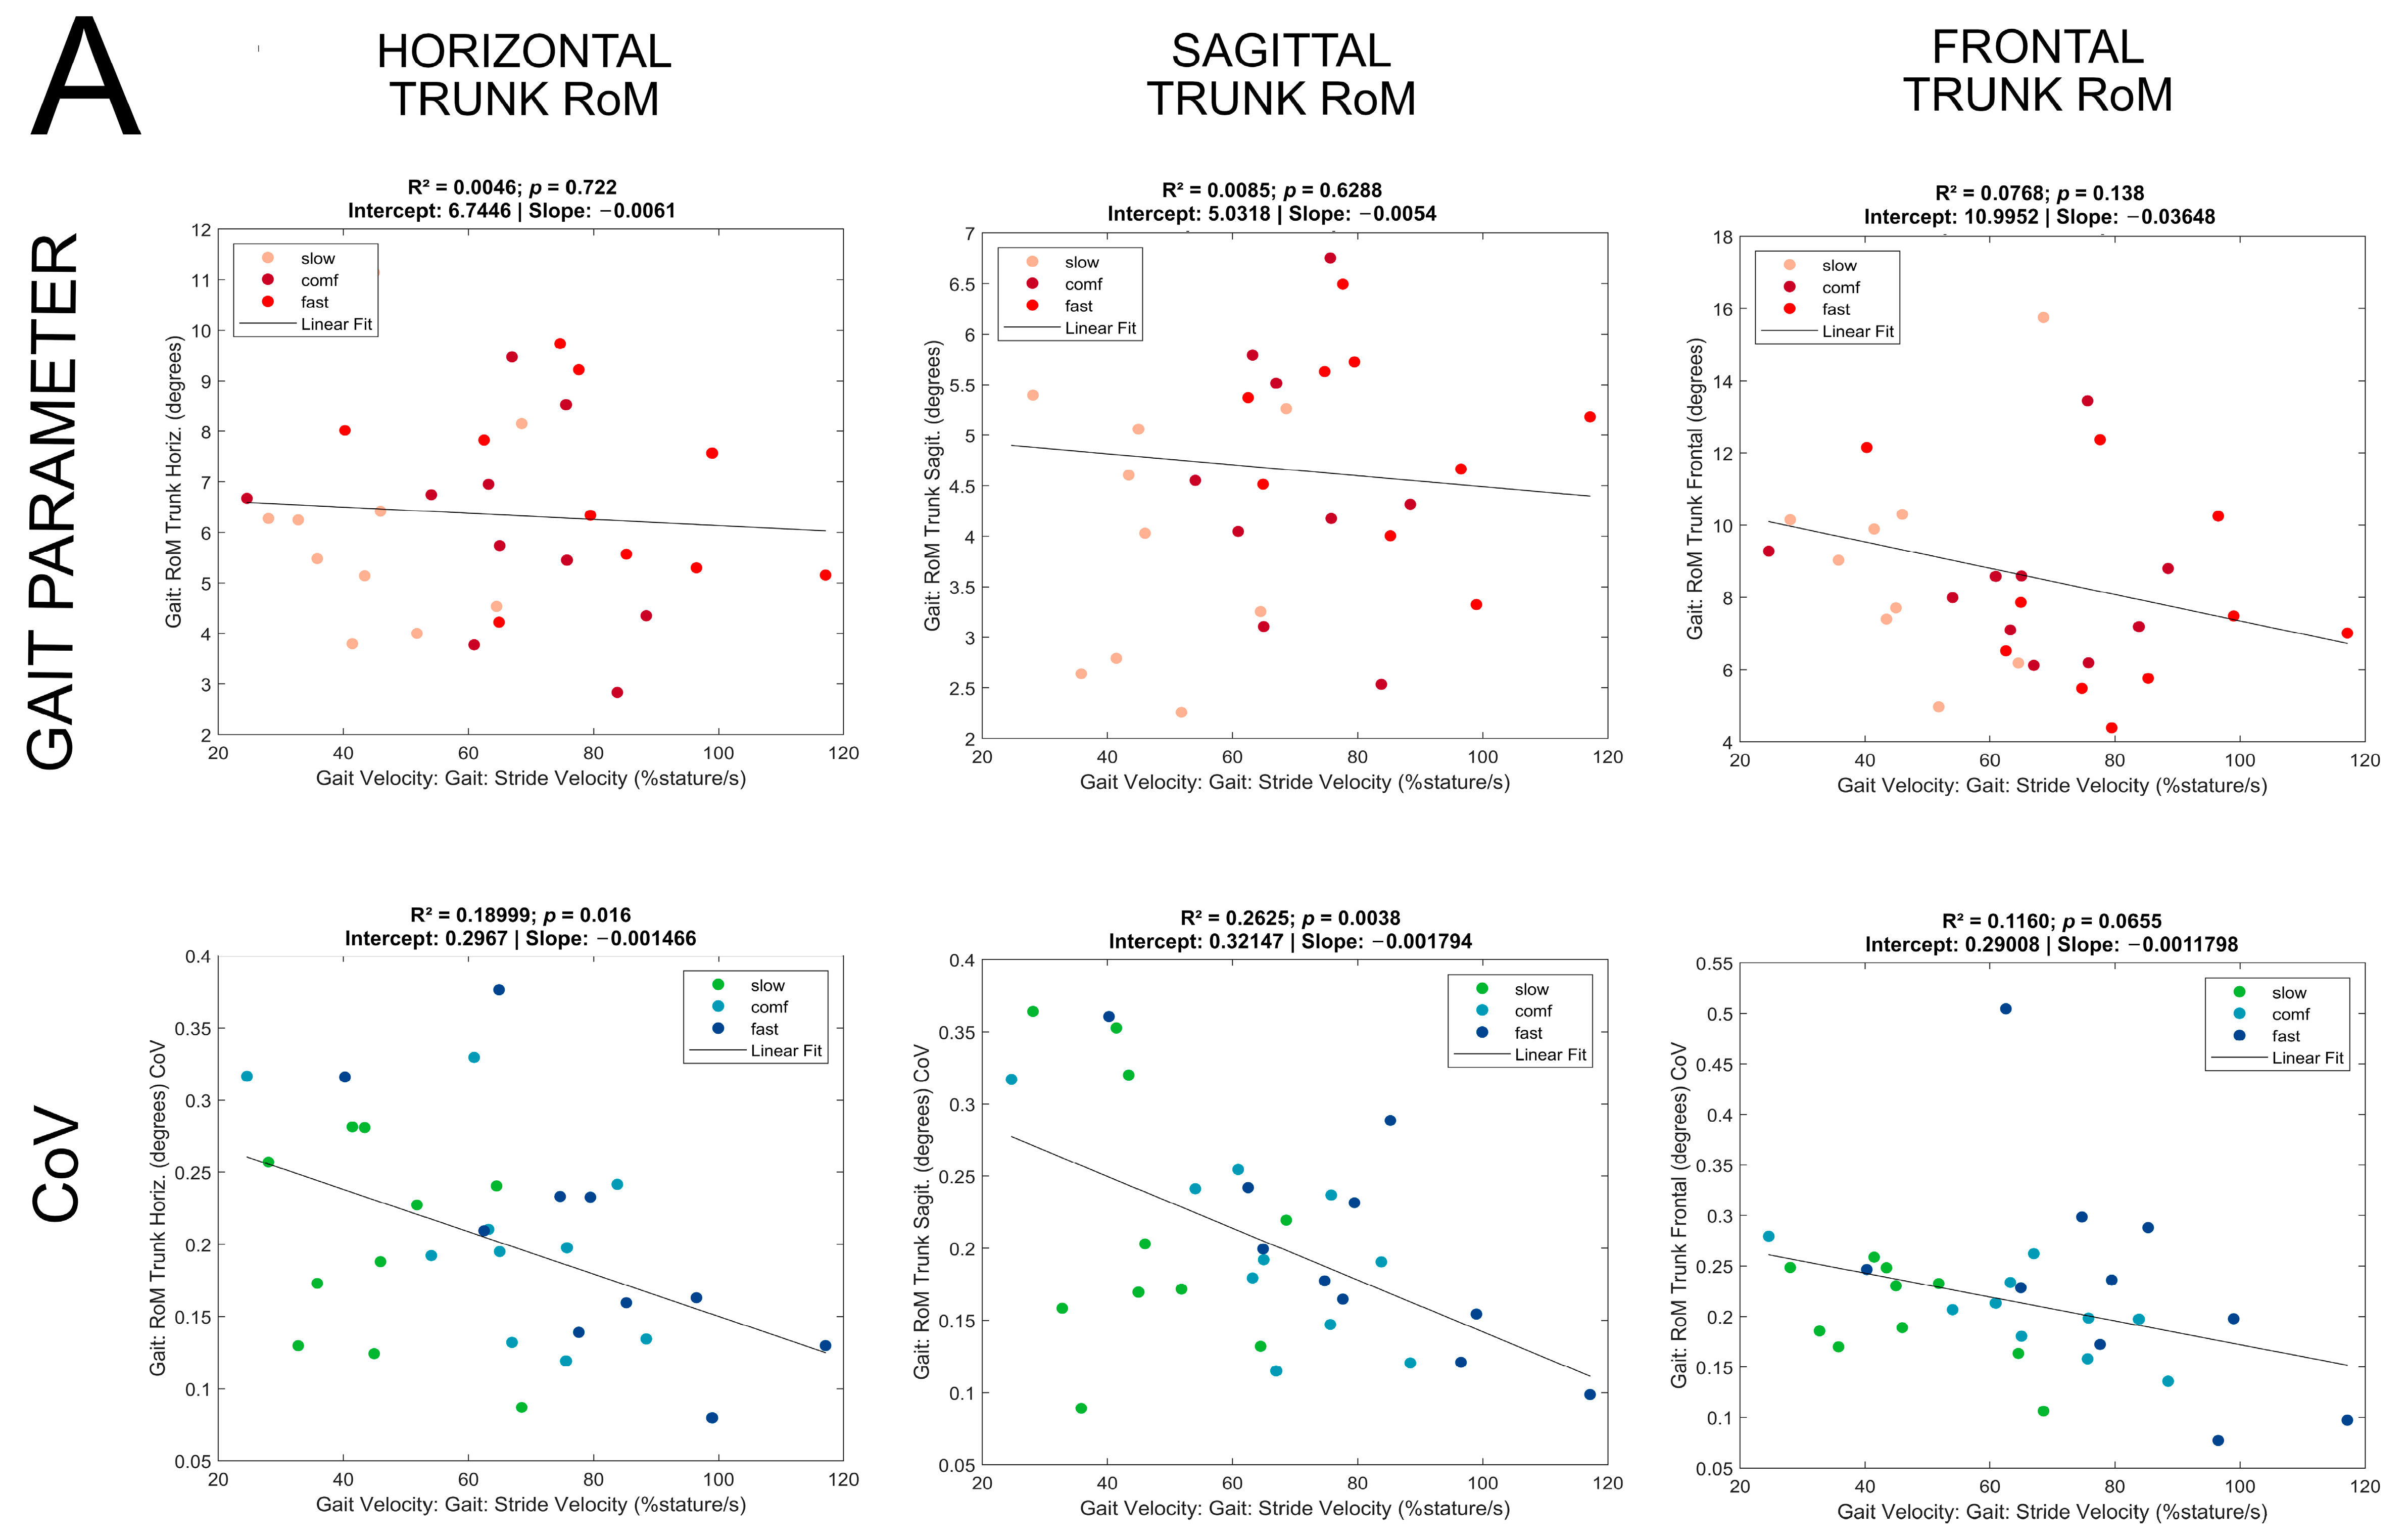
| Trunk Horizontal RoM [degrees] | 0.005 | 0.72 | 0.009 | 0.58 | 0.0006 | 0.78 | |||
| Trunk Sagittal RoM [degrees] | 0.008 | 0.63 | 0.003 | 0.33 | 0.04 | 0.021 | F(1,132) = 5.4 y = 1.9 + 0.028x | ||
| Trunk Frontal RoM [degrees] | 0.08 | 0.14 | 0.01 | 0.49 | 0.003 | 0.62 | |||
| Arms RoM [degrees] | 0.28 | 0.003 | F(1,28) = 10.7 y = 1.32 + 0.30x | 0.36 | 0.0001 | F(1,34) = 19.3 y = −28.6 + 0.75x | 0.08 | 0.0007 | F(1,132) = 12.1 y = −0.41 + 0.38x |
| Peak Arm Swing Velocity [degrees/s] | 0.55 | <0.0001 | F(1,28) = 34.8 y = −18.9 + 3.2x | 0.46 | <0.0001 | F(1,34) = 29.6 y = −129.9 + 4.5x | 0.44 | <0.0001 | F(1,132) = 103 y = −197 + 5.1x |
| Stride Length [%stature] | 0.79 | <0.0001 | F(1,28) = 108 y = 30.0 + 0.59x | 0.57 | <0.0001 | F(1,34) = 45.8 y = 54.6 + 0.36x | 0.39 | <0.0001 | F(1,132) = 83.6 y = 59.2 + 0.30x |
| (B) | |||||||||
| COVs | SCA | ET | HE | ||||||
| R2 | p | Regression Statistics | R2 | p | Regression Statistics | R2 | p | ||
| Trunk Horizontal RoM [degrees] | 0.19 | 0.016 | F(1,28) = 6.6 y = 0.30 − 0.0015x | 0.18 | 0.010 | F(1,34) = 7.4 y = 0.37 − 0.0022x | 0.003 | 0.555 | |
| Trunk Sagittal RoM [degrees] | 0.26 | 0.004 | F(1,28) = 10.0 y = 0.32 − 0.0018x | 0.17 | 0.014 | F(1,34) = 6.8 y = 0.34 − 0.002x | 0.02 | 0.129 | |
| Trunk Frontal RoM [degrees] | 0.12 | 0.065 | 0.005 | 0.69 | 0.001 | 0.71 | |||
| Arms RoM [degrees] | 0.14 | 0.04 | F(1,28) = 4.5 y = 0.25 − 0.0015x | 0.13 | 0.028 | F(1,34) = 5.3 y = 0.22 − 0.0012x | 0.03 | 0.55 | |
| Peak Arm Swing Velocity [degrees/s] | 0.46 | <0.0001 | F(1,28) = 23.9 y = 0.20 − 0.0013x | 0.09 | 0.084 | 0.00001 | 0.86 | ||
| Stride Length [%stature] | 0.64 | <0.0001 | F(1,28) = 50.7 y = 0.14 − 0.0014x | 0.33 | 0.00013 | F(1,34) = 18.6 y = 0.05 − 0.00033x | 0.00001 | 0.99 | |
Disclaimer/Publisher’s Note: The statements, opinions and data contained in all publications are solely those of the individual author(s) and contributor(s) and not of MDPI and/or the editor(s). MDPI and/or the editor(s) disclaim responsibility for any injury to people or property resulting from any ideas, methods, instructions or products referred to in the content. |
© 2024 by the authors. Licensee MDPI, Basel, Switzerland. This article is an open access article distributed under the terms and conditions of the Creative Commons Attribution (CC BY) license (https://creativecommons.org/licenses/by/4.0/).
Share and Cite
Kroneberg, D.; Nümann, A.; Minnerop, M.; Rönnefarth, M.; Endres, M.; Kühn, A.A.; Paul, F.; Doss, S.; Solbrig, S.; Elshehabi, M.; et al. Gait Variability as a Potential Motor Marker of Cerebellar Disease—Relationship between Variability of Stride, Arm Swing and Trunk Movements, and Walking Speed. Sensors 2024, 24, 3476. https://doi.org/10.3390/s24113476
Kroneberg D, Nümann A, Minnerop M, Rönnefarth M, Endres M, Kühn AA, Paul F, Doss S, Solbrig S, Elshehabi M, et al. Gait Variability as a Potential Motor Marker of Cerebellar Disease—Relationship between Variability of Stride, Arm Swing and Trunk Movements, and Walking Speed. Sensors. 2024; 24(11):3476. https://doi.org/10.3390/s24113476
Chicago/Turabian StyleKroneberg, Daniel, Astrid Nümann, Martina Minnerop, Maria Rönnefarth, Matthias Endres, Andrea A. Kühn, Friedemann Paul, Sarah Doss, Susanne Solbrig, Morad Elshehabi, and et al. 2024. "Gait Variability as a Potential Motor Marker of Cerebellar Disease—Relationship between Variability of Stride, Arm Swing and Trunk Movements, and Walking Speed" Sensors 24, no. 11: 3476. https://doi.org/10.3390/s24113476
APA StyleKroneberg, D., Nümann, A., Minnerop, M., Rönnefarth, M., Endres, M., Kühn, A. A., Paul, F., Doss, S., Solbrig, S., Elshehabi, M., Maetzler, W., & Schmitz-Hübsch, T. (2024). Gait Variability as a Potential Motor Marker of Cerebellar Disease—Relationship between Variability of Stride, Arm Swing and Trunk Movements, and Walking Speed. Sensors, 24(11), 3476. https://doi.org/10.3390/s24113476