


OD-YOLO: Robust Small Object Detection Model in Remote Sensing Image with a Novel Multi-Scale Feature Fusion


Abstract
1. Introduction
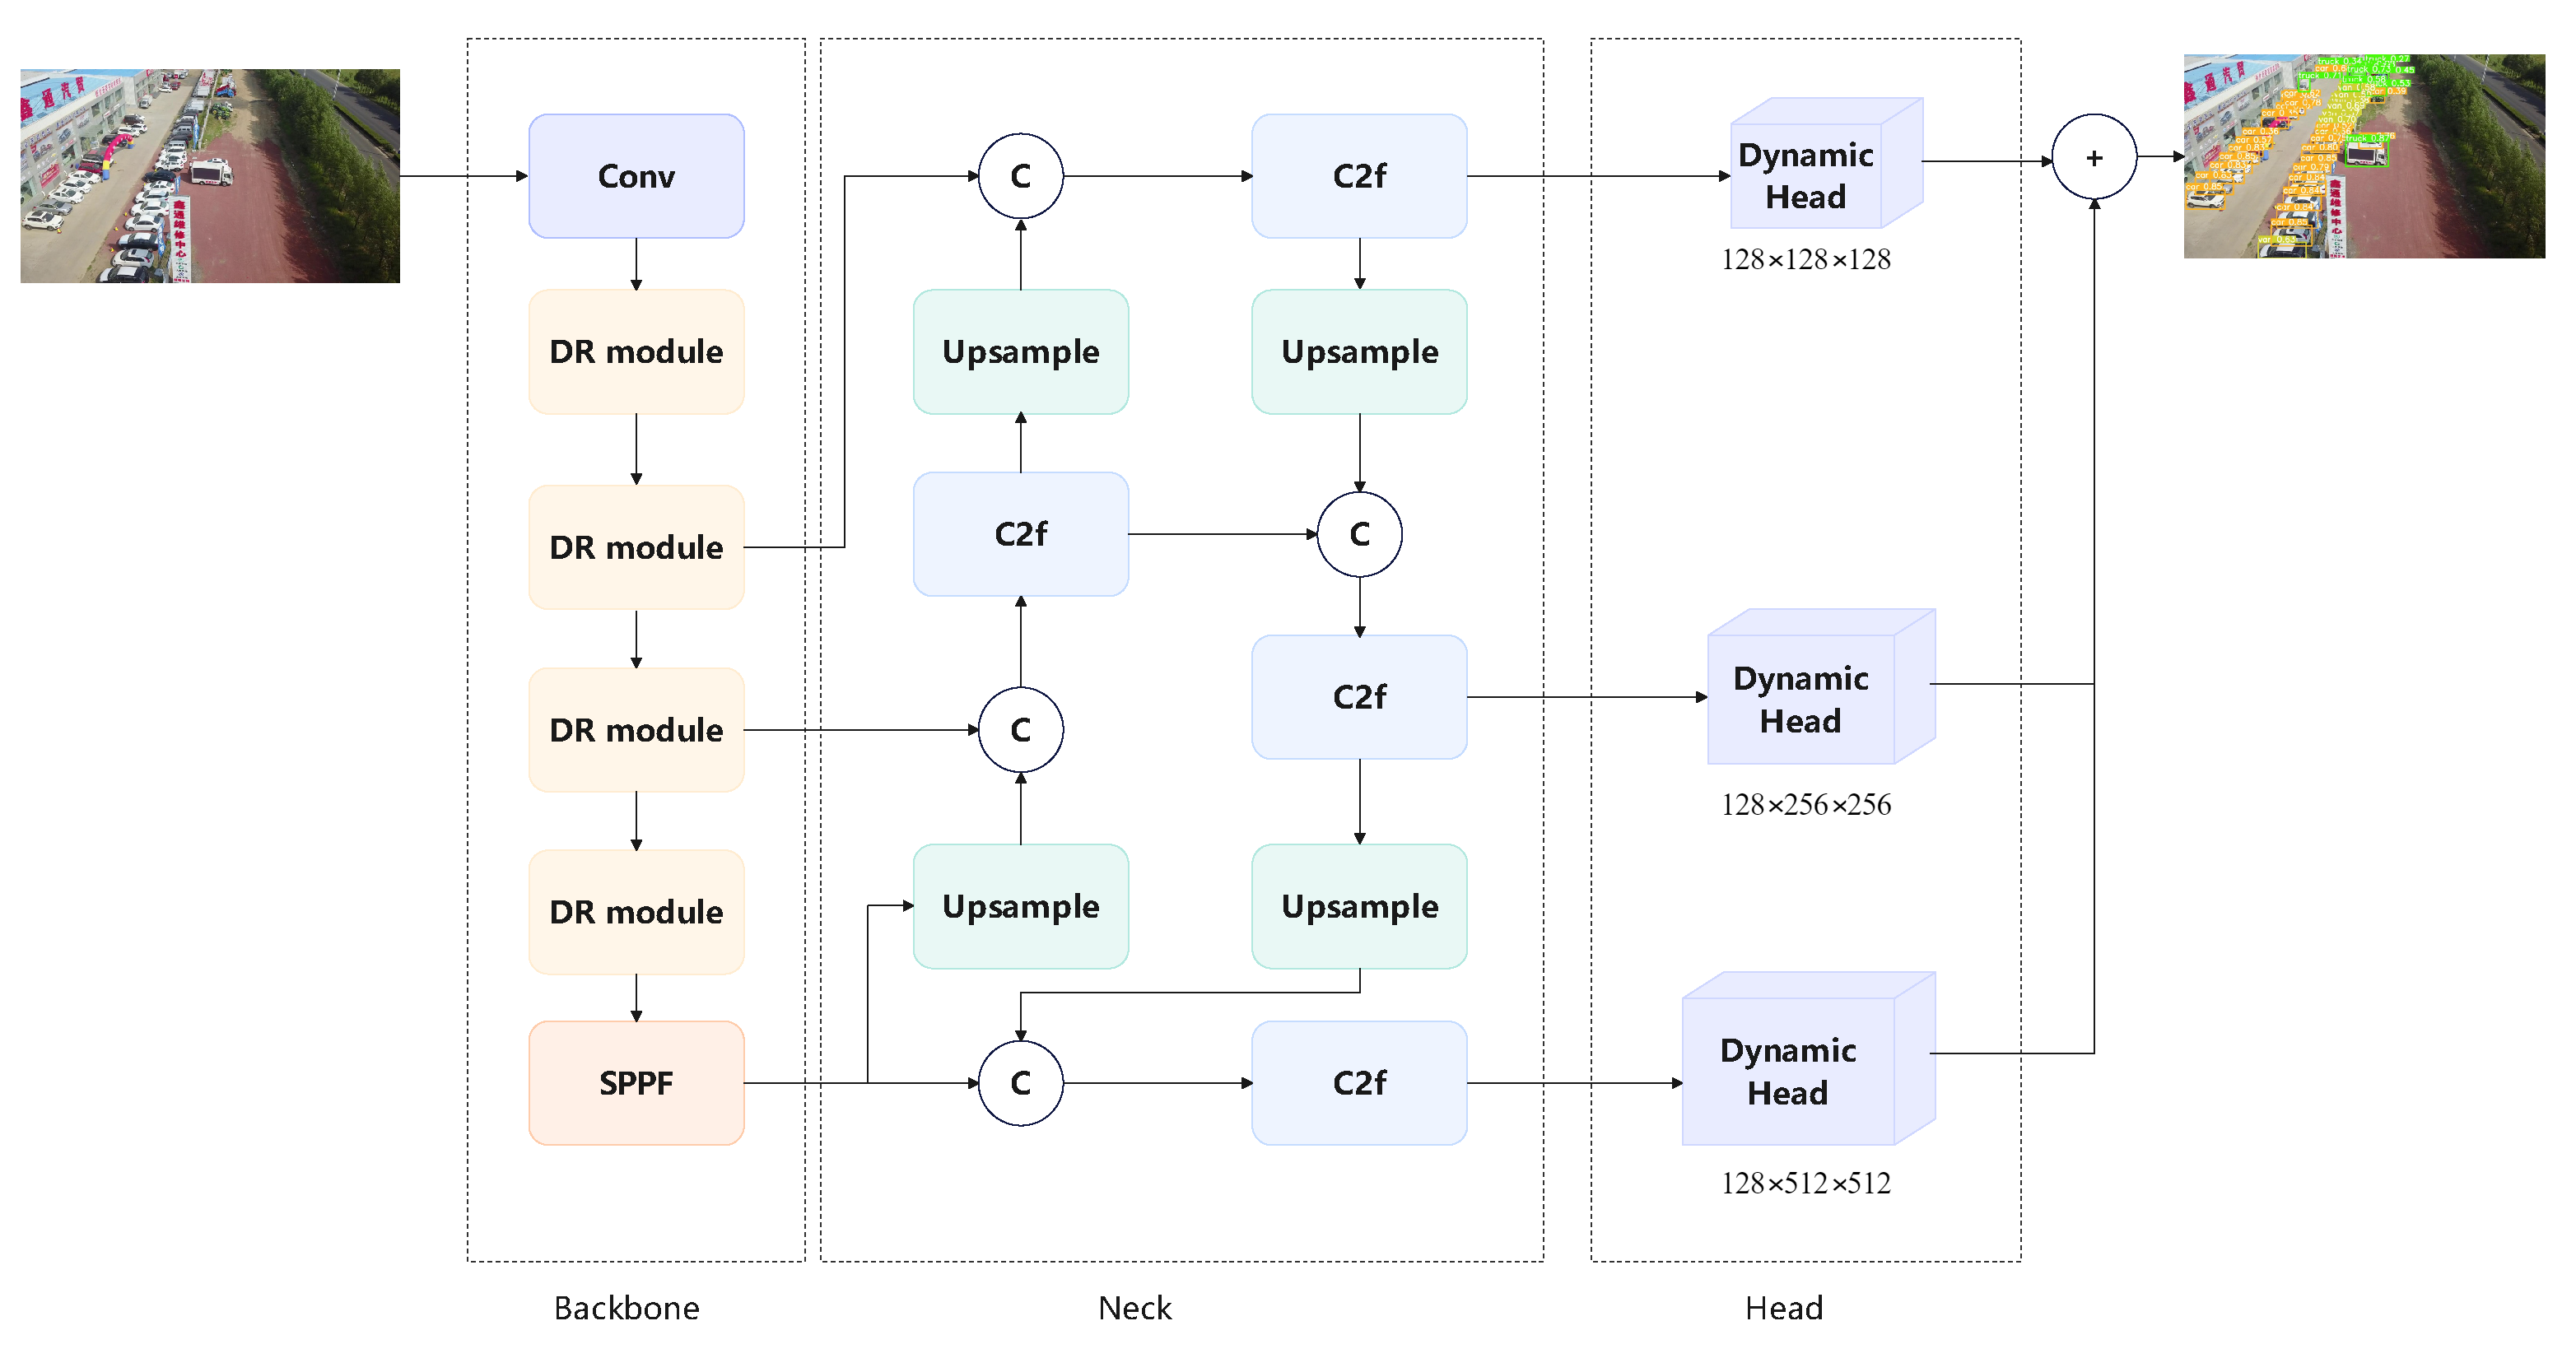
- In this paper, we propose the OD-YOLO framework for target detection in remote sensing scene captured by unmanned aerial vehicles.
- An enhanced feature extraction Detection Refinement module (DRmodule) and OIoU loss function are employed to improve the model’s capacity to gather features from small objects and detect them.
- Experiments with a remote sensing object detection dataset prove that the OD-YOLO effectively boosts the performance in detect objects in remote sensing scenes.
2. Related Work
2.1. YOLO Model
2.2. Remote Sensing Object Detection
2.3. Small Object Detection
3. Proposed Method
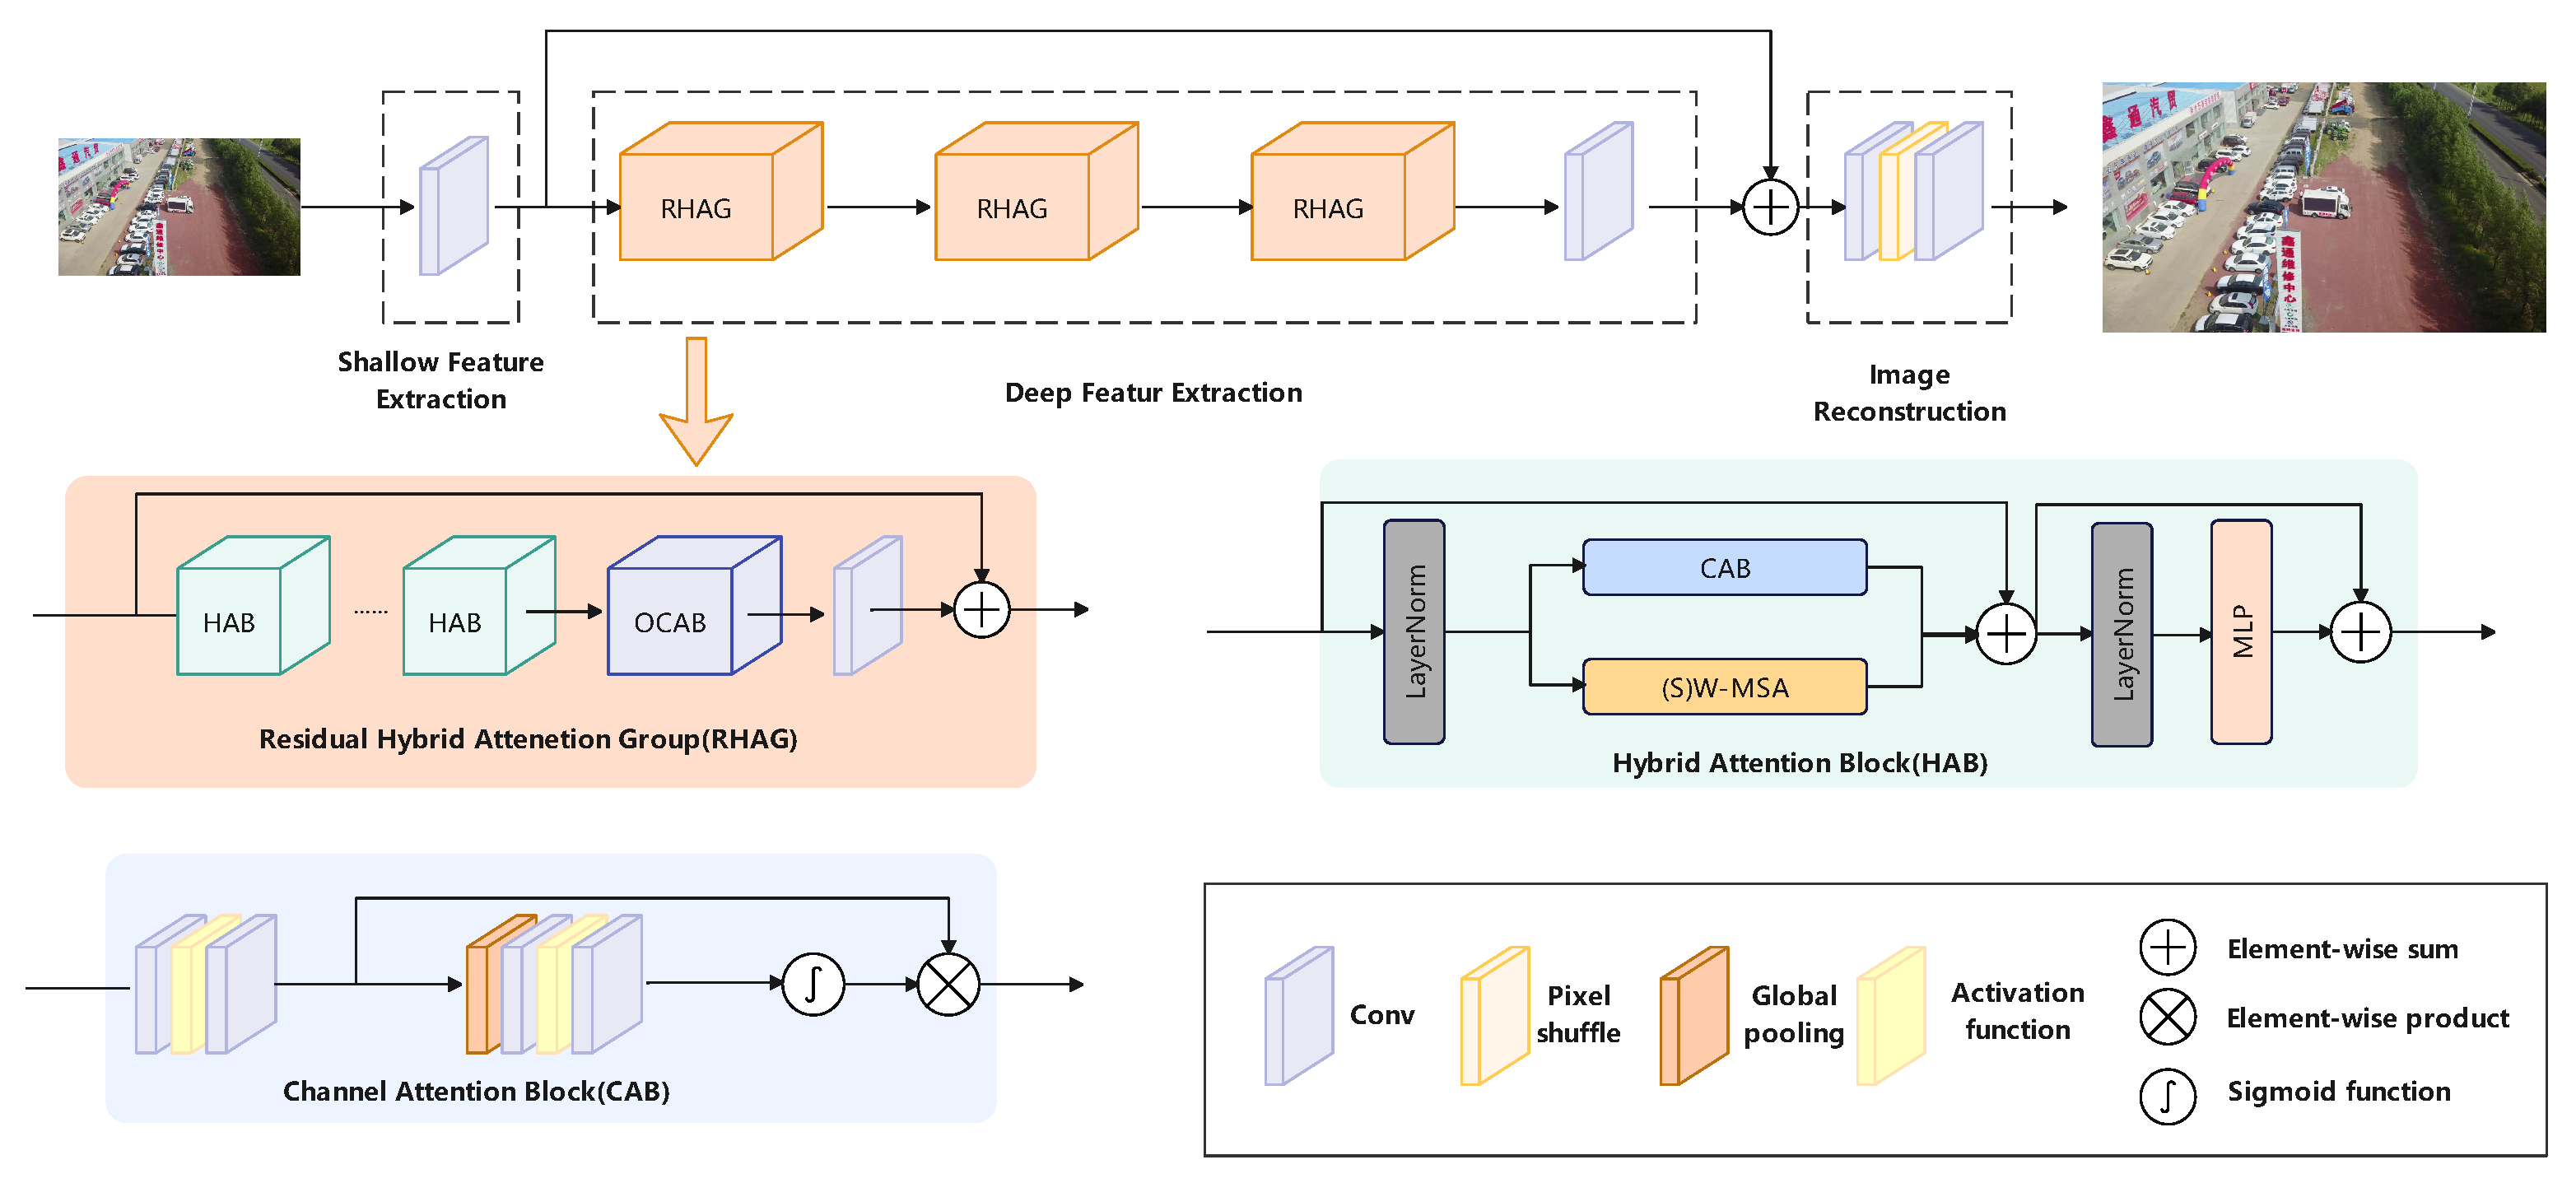
3.1. Detection Refinement Module
3.1.1. Deformable Convolutional Networks
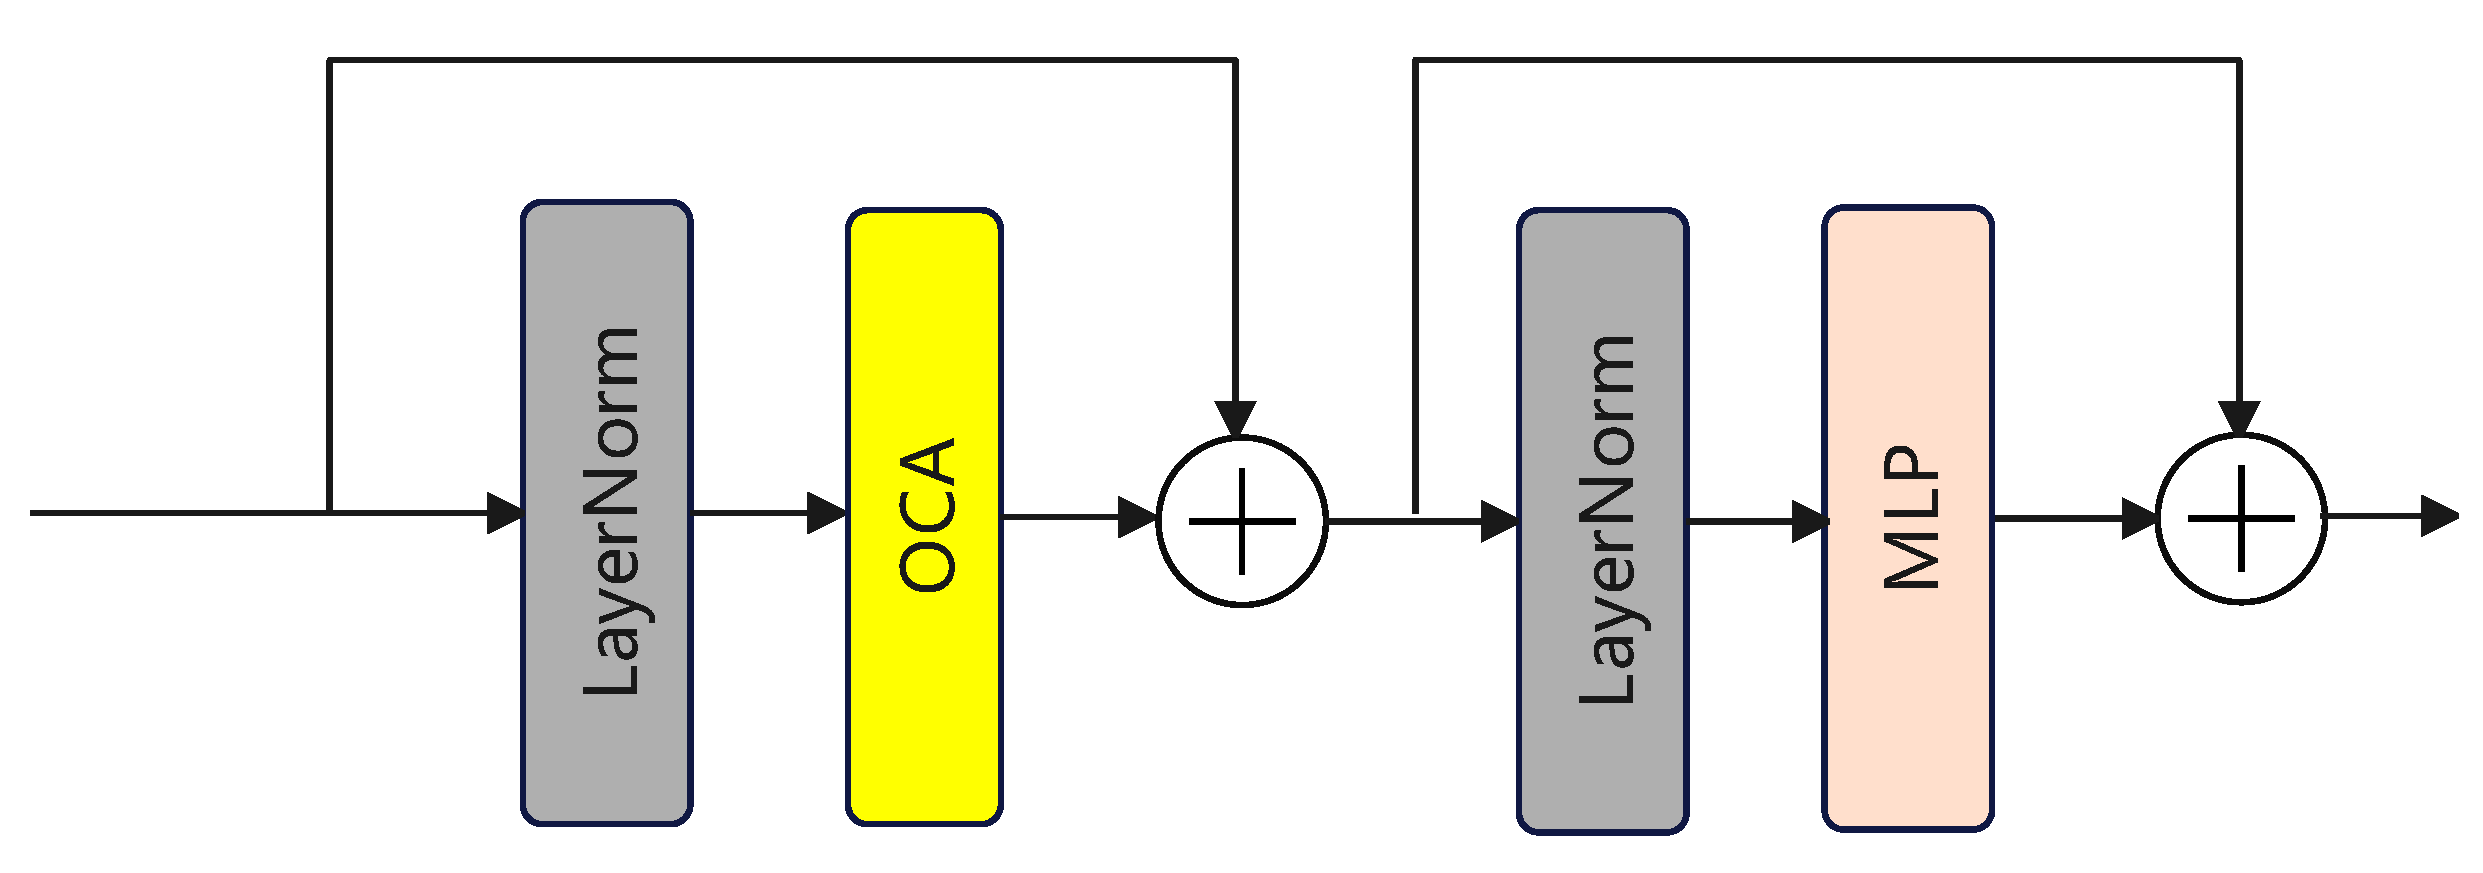
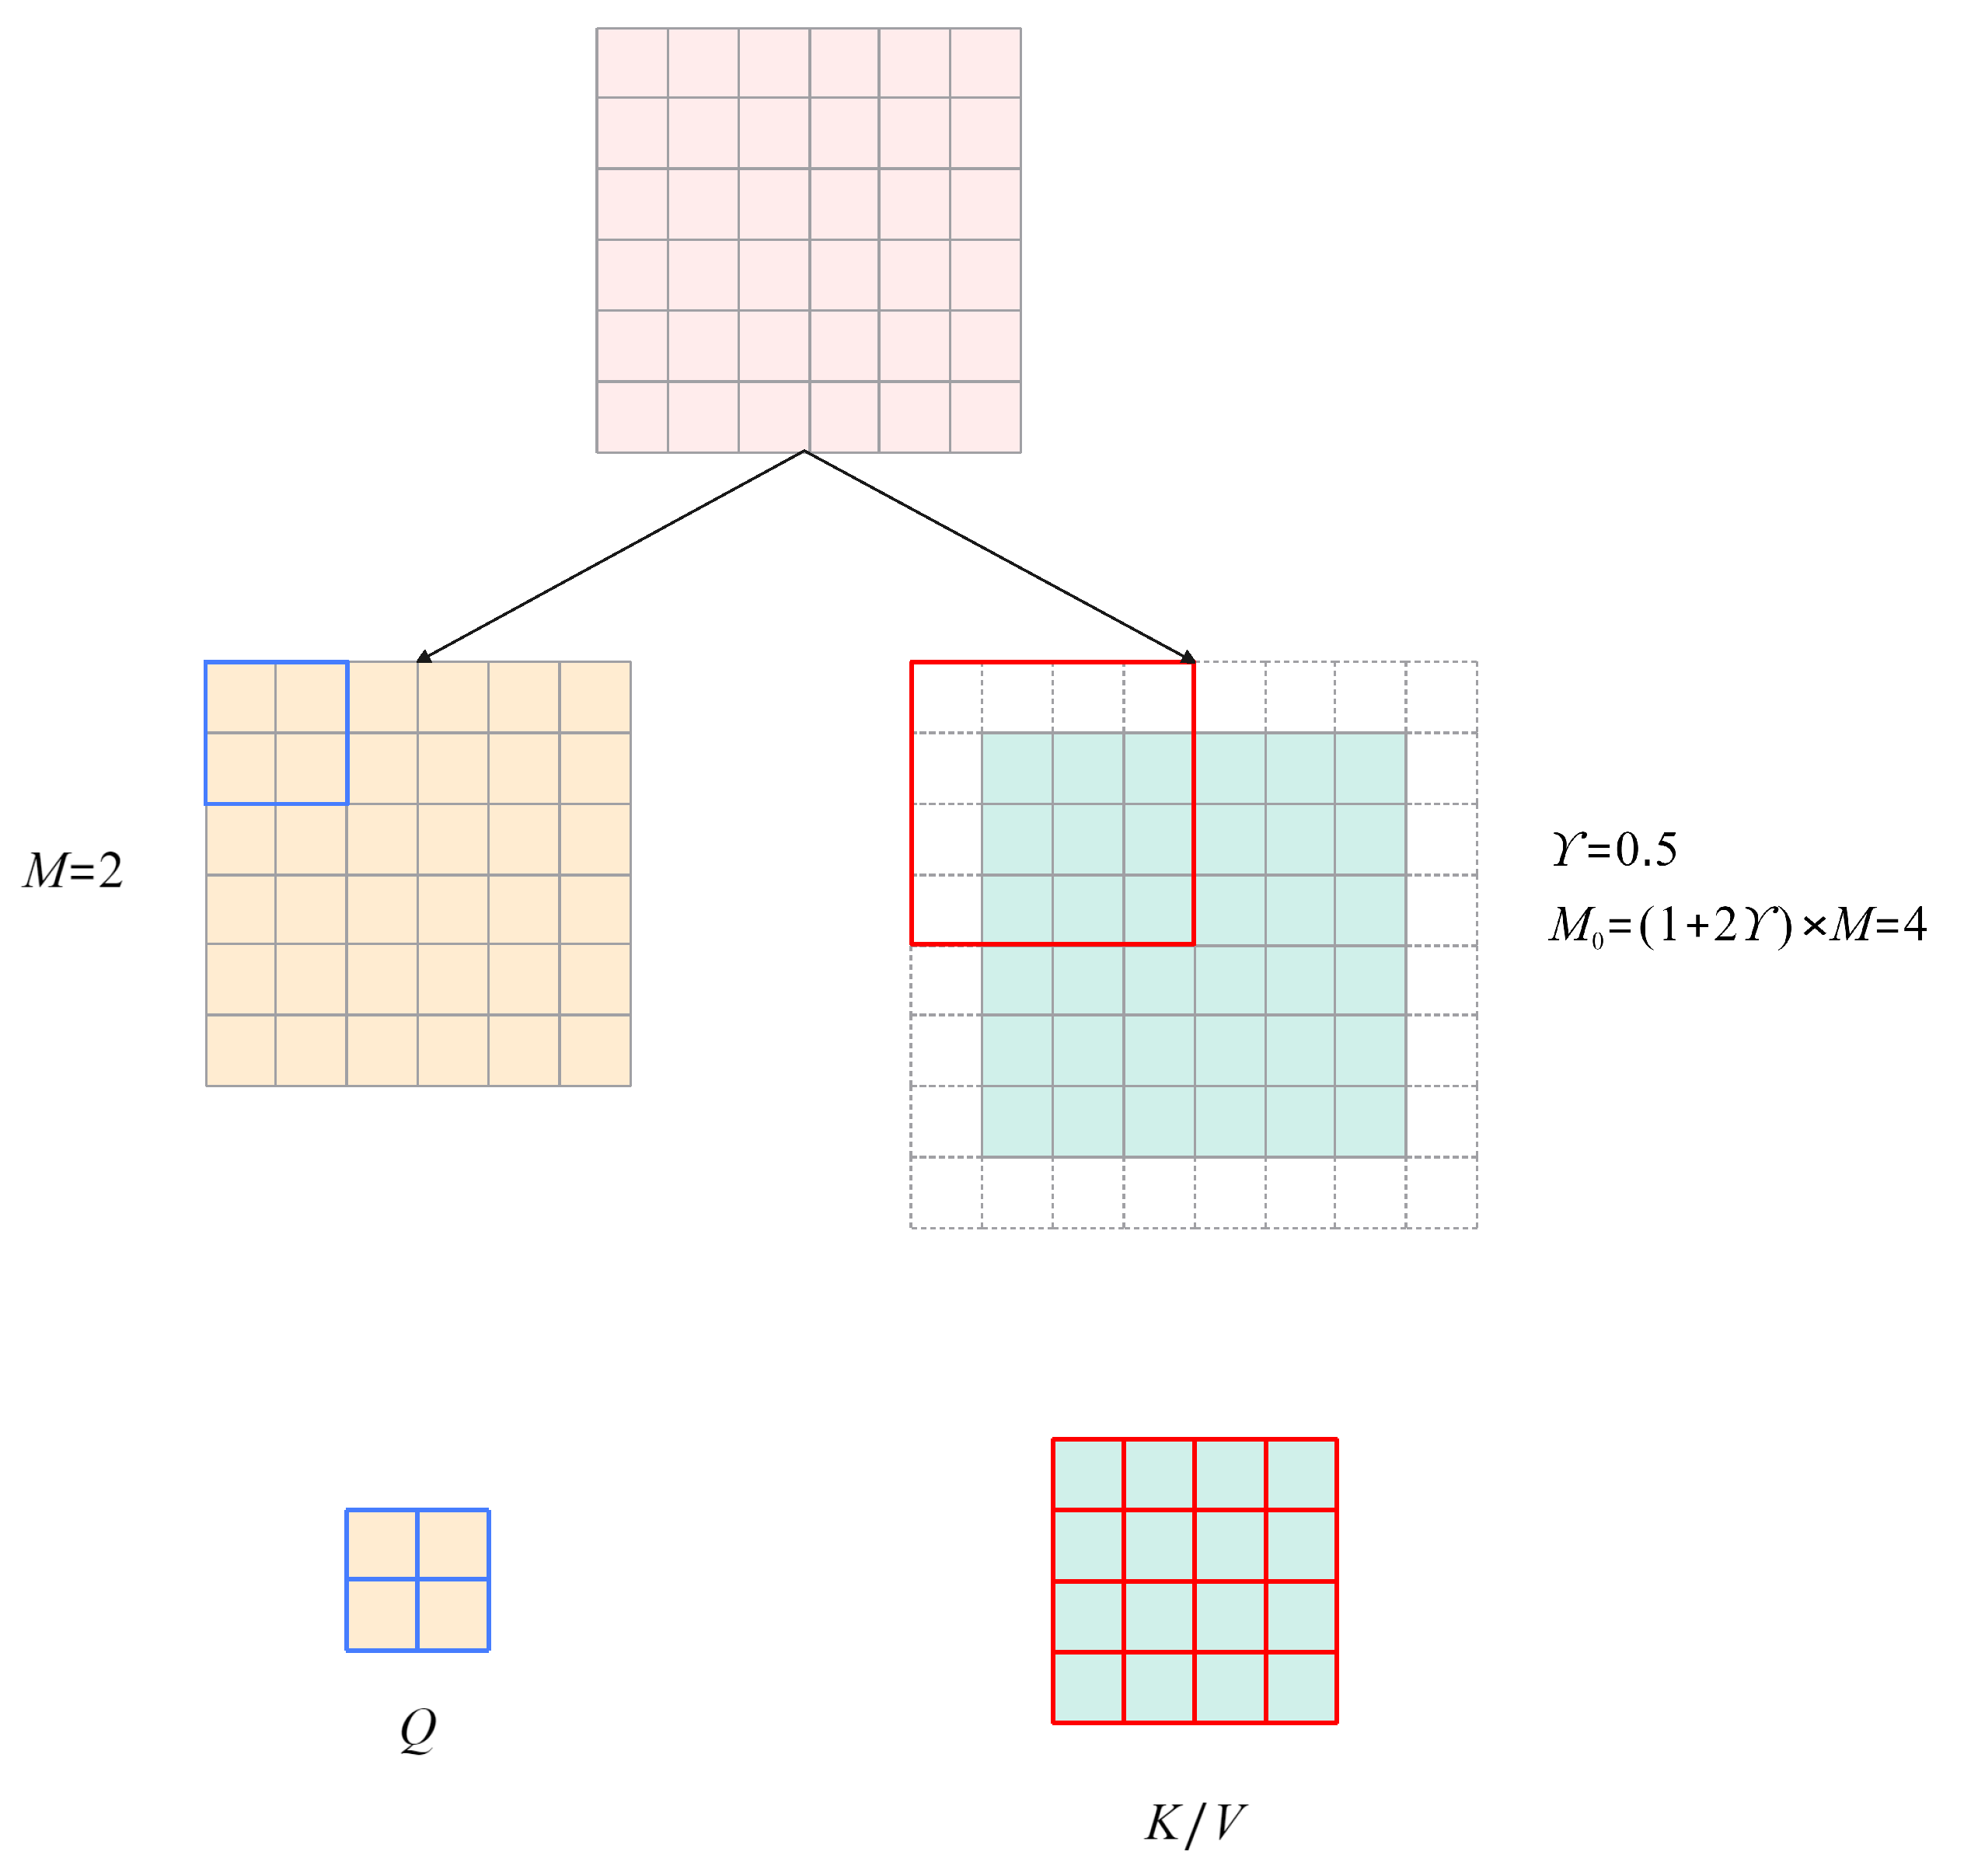
3.1.2. Hybrid Attention Transformer
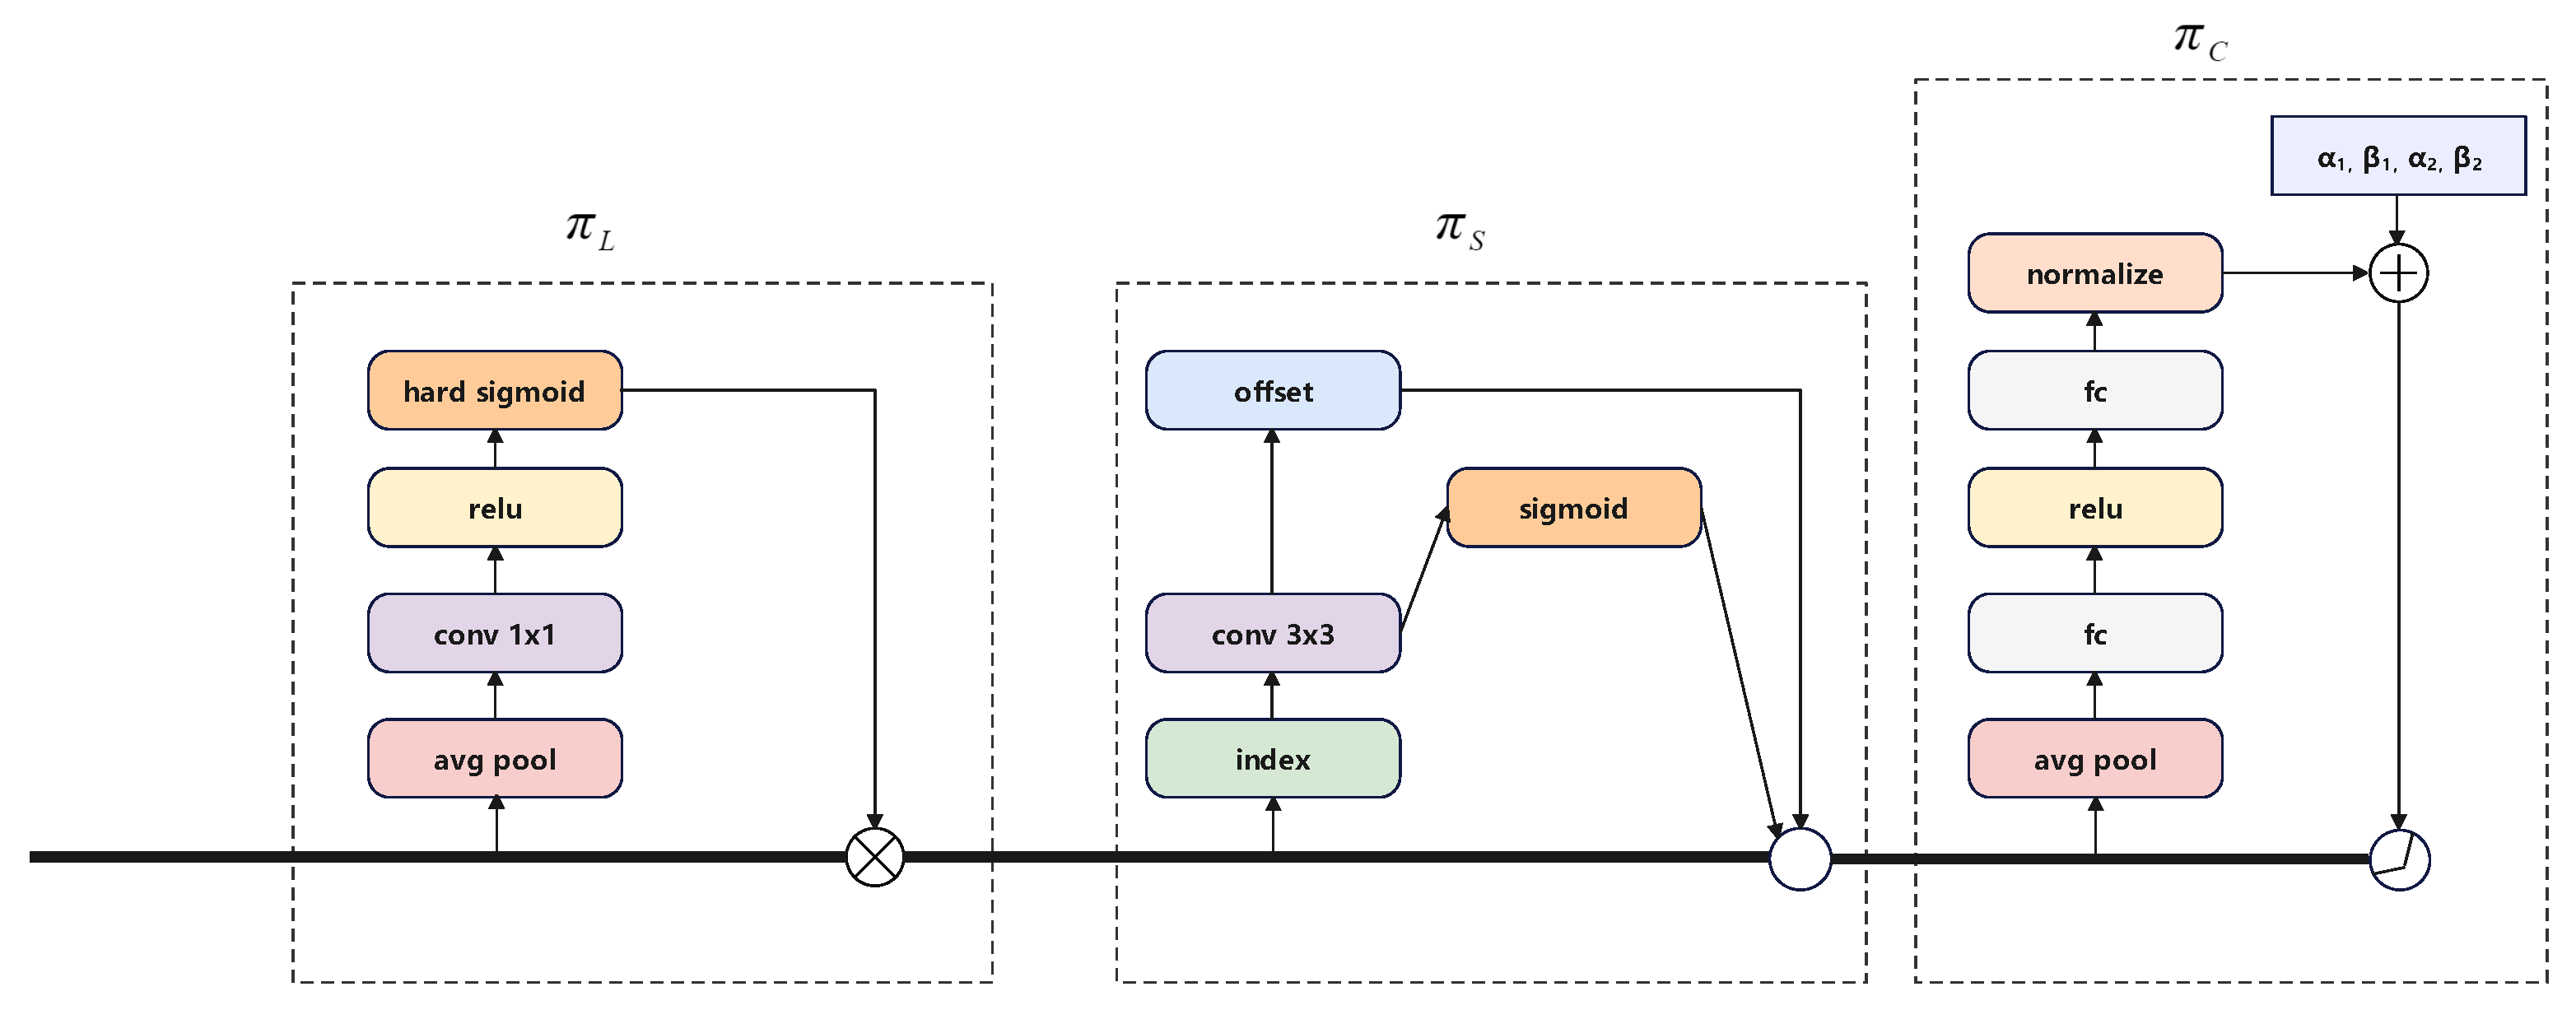
3.2. Dynamic Head
3.3. OIoU Loss Function
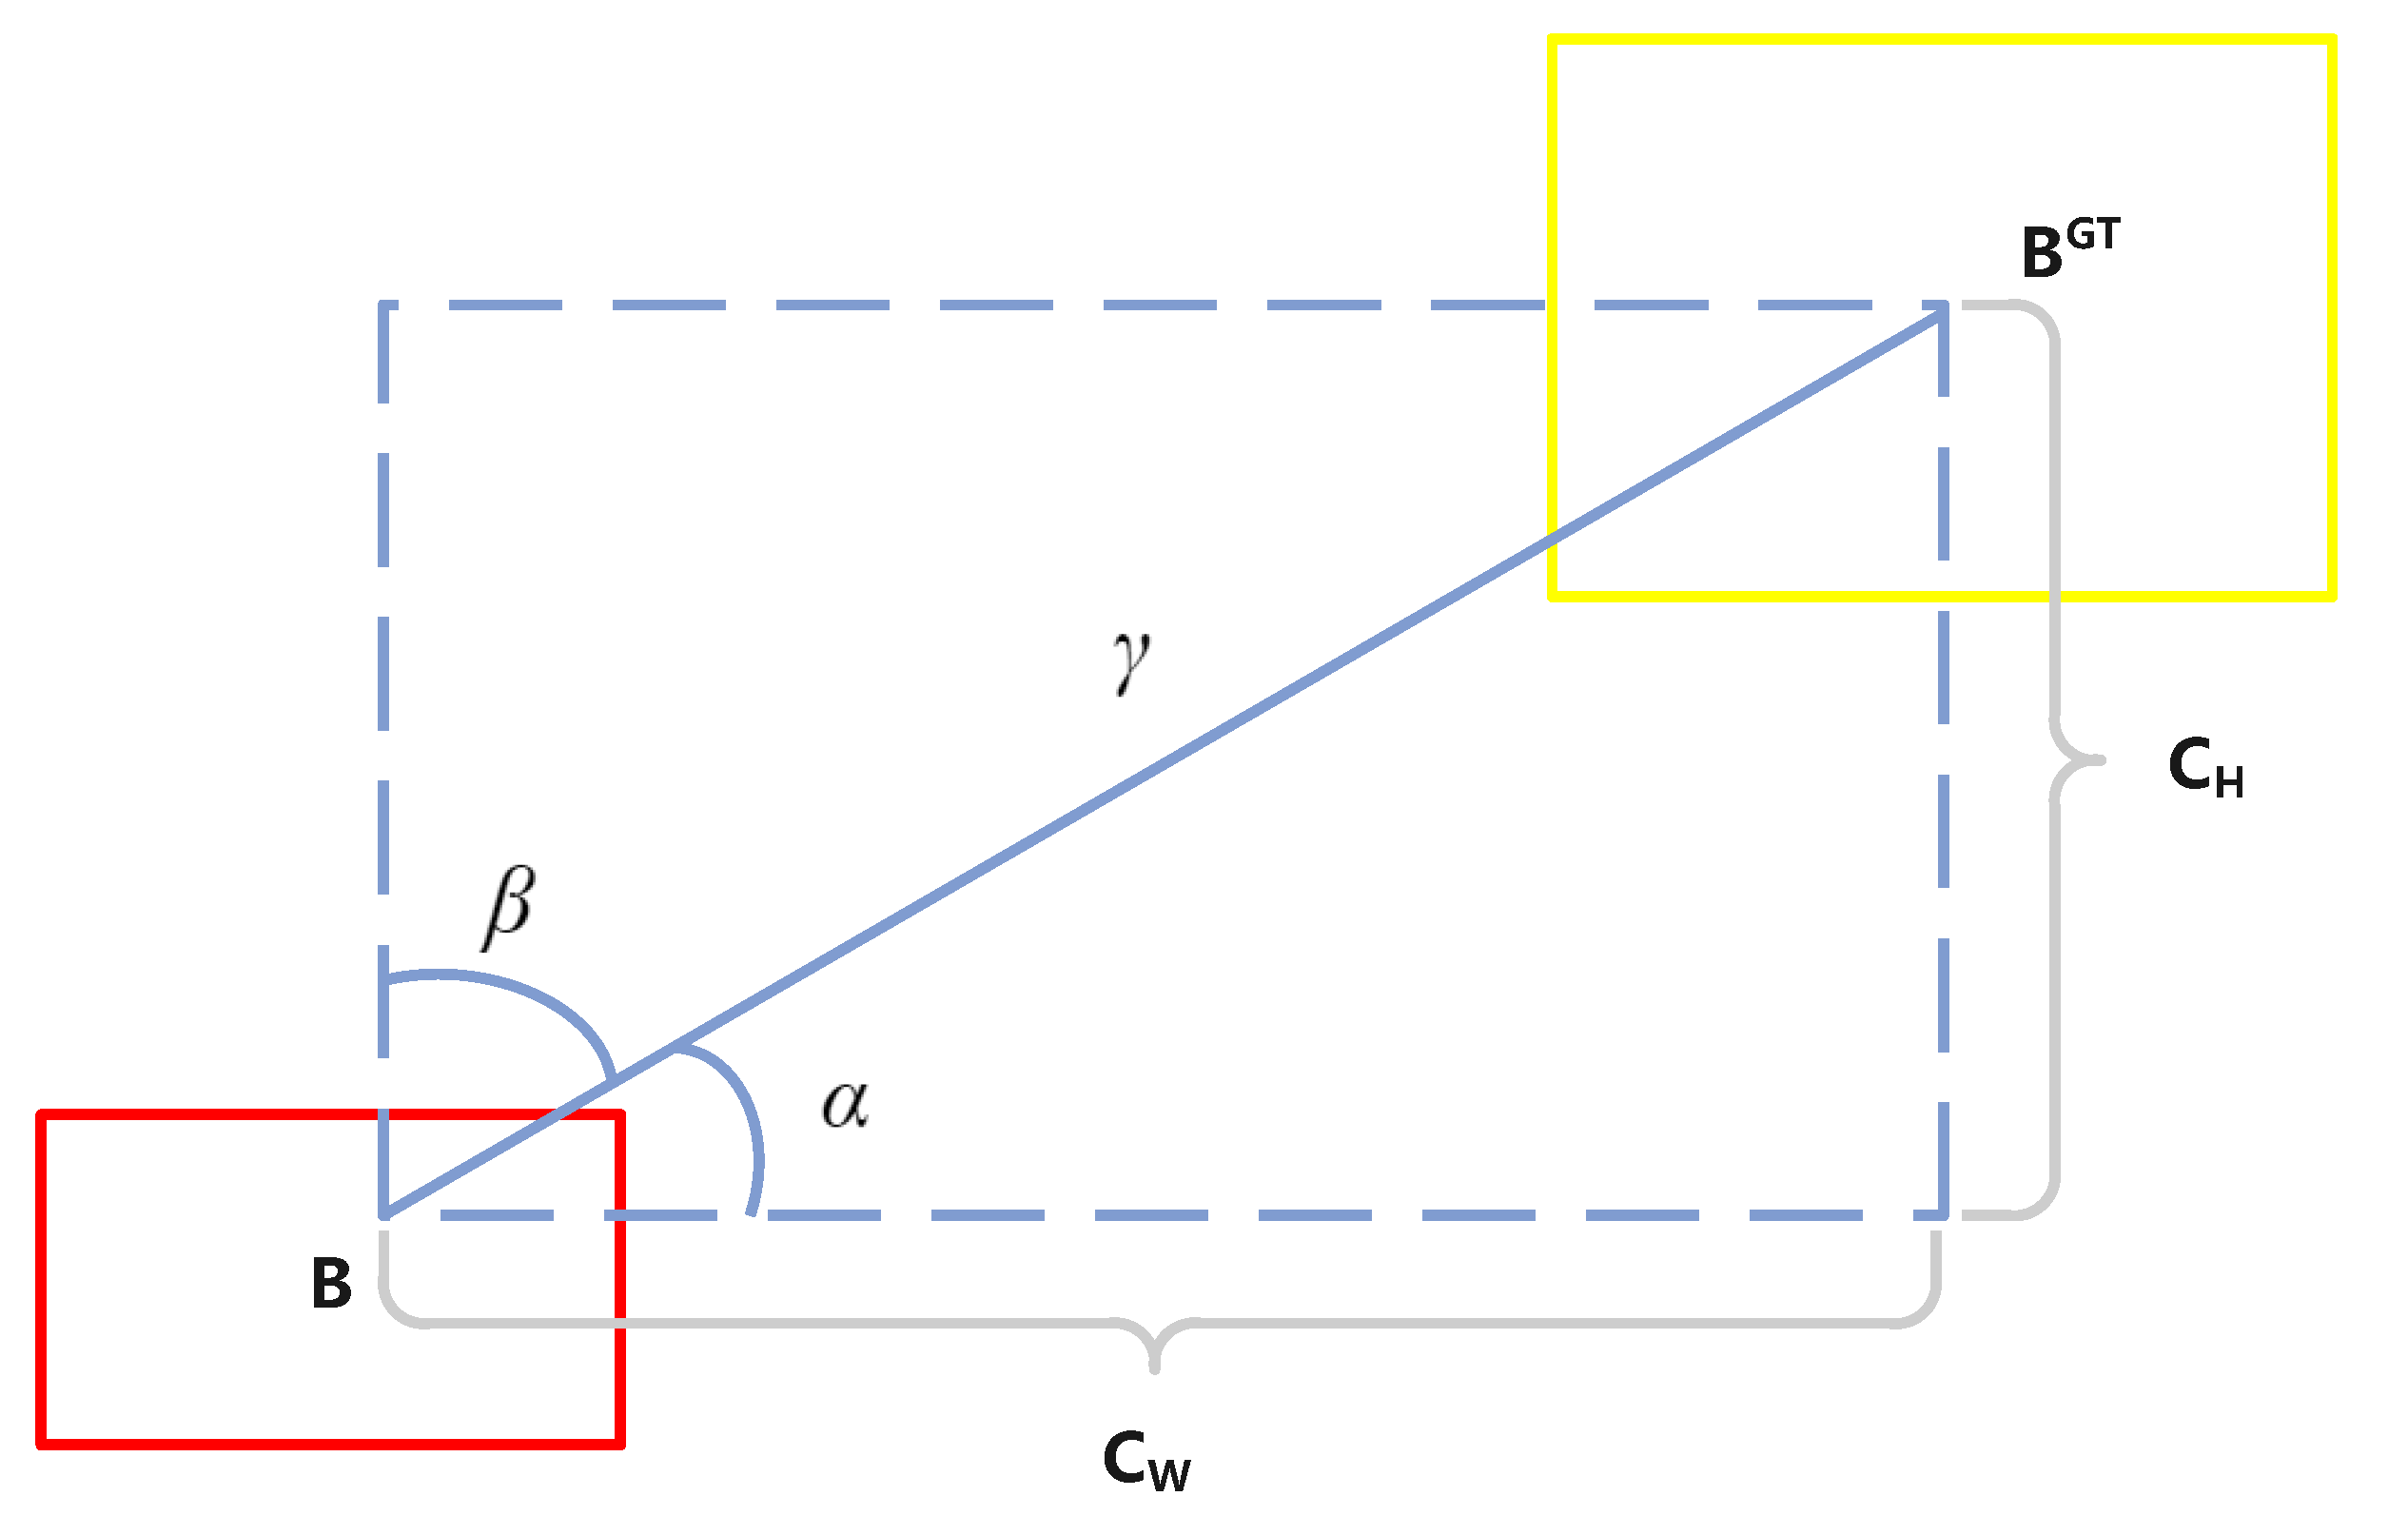
3.3.1. Angle Loss
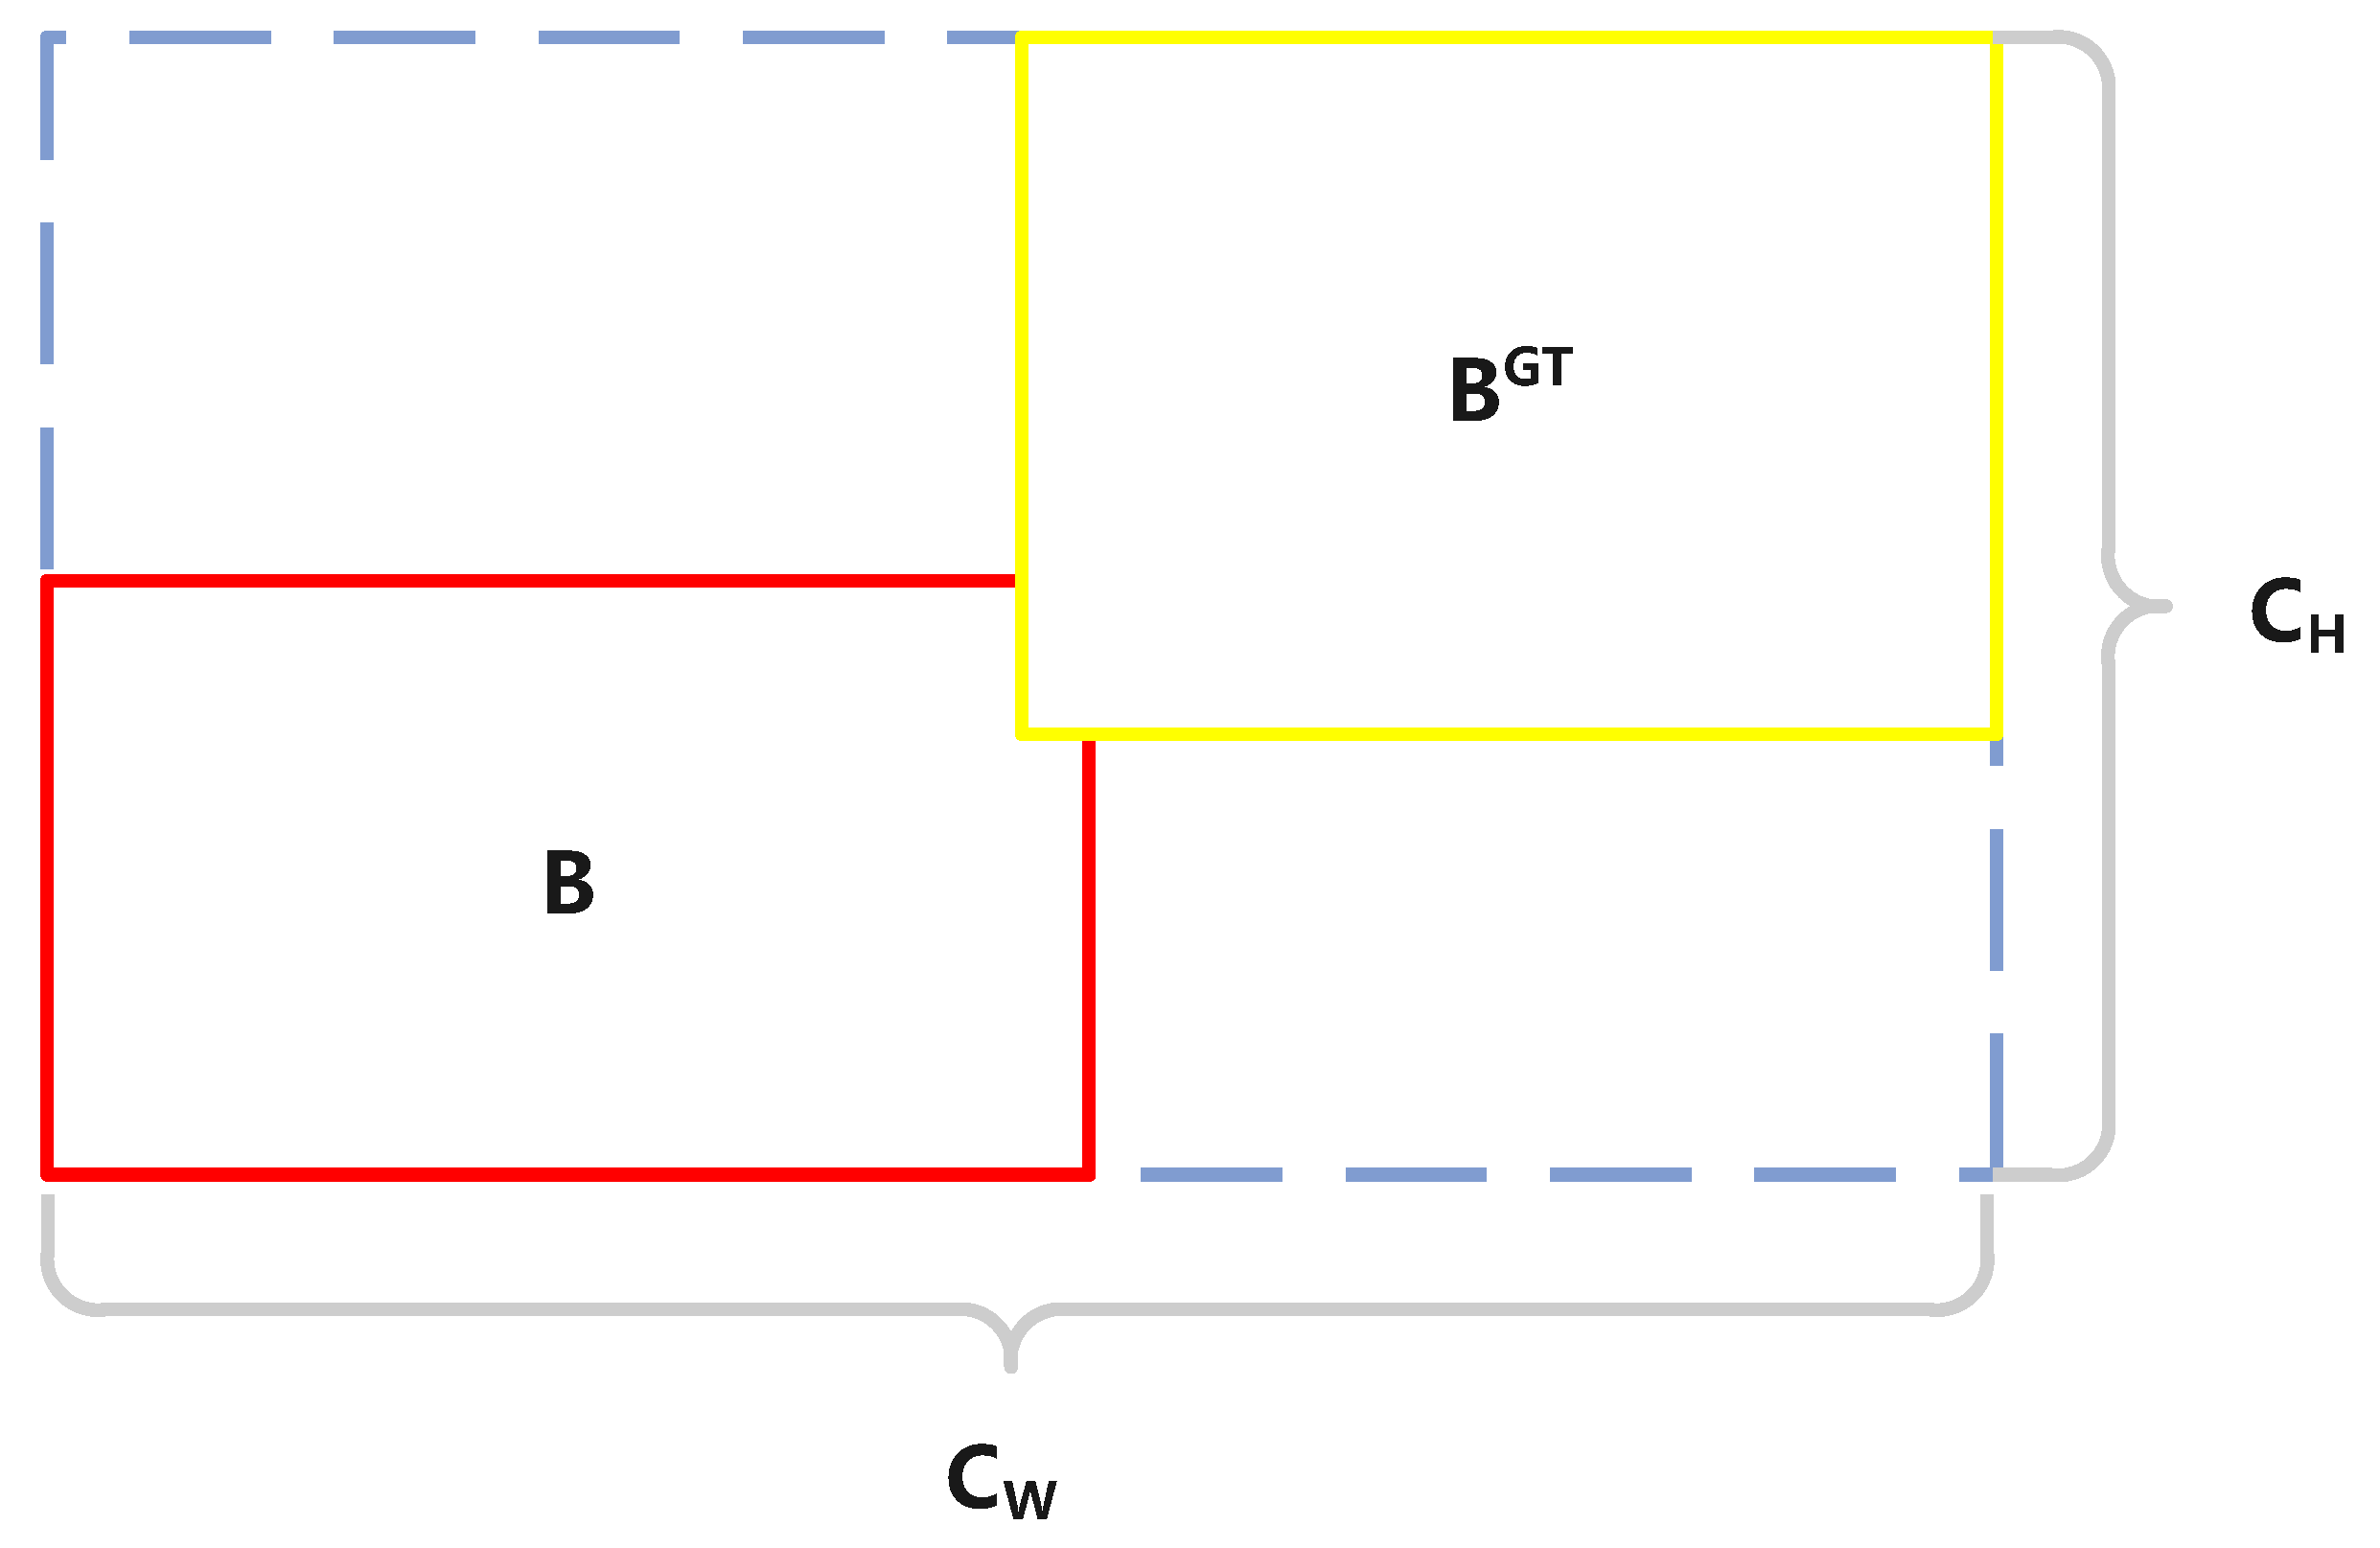
3.3.2. Distance and Shape Loss
3.3.3. OIoU
4. Experiment
4.1. Experiment Details
4.2. Dataset
4.3. Evaluation Metrics
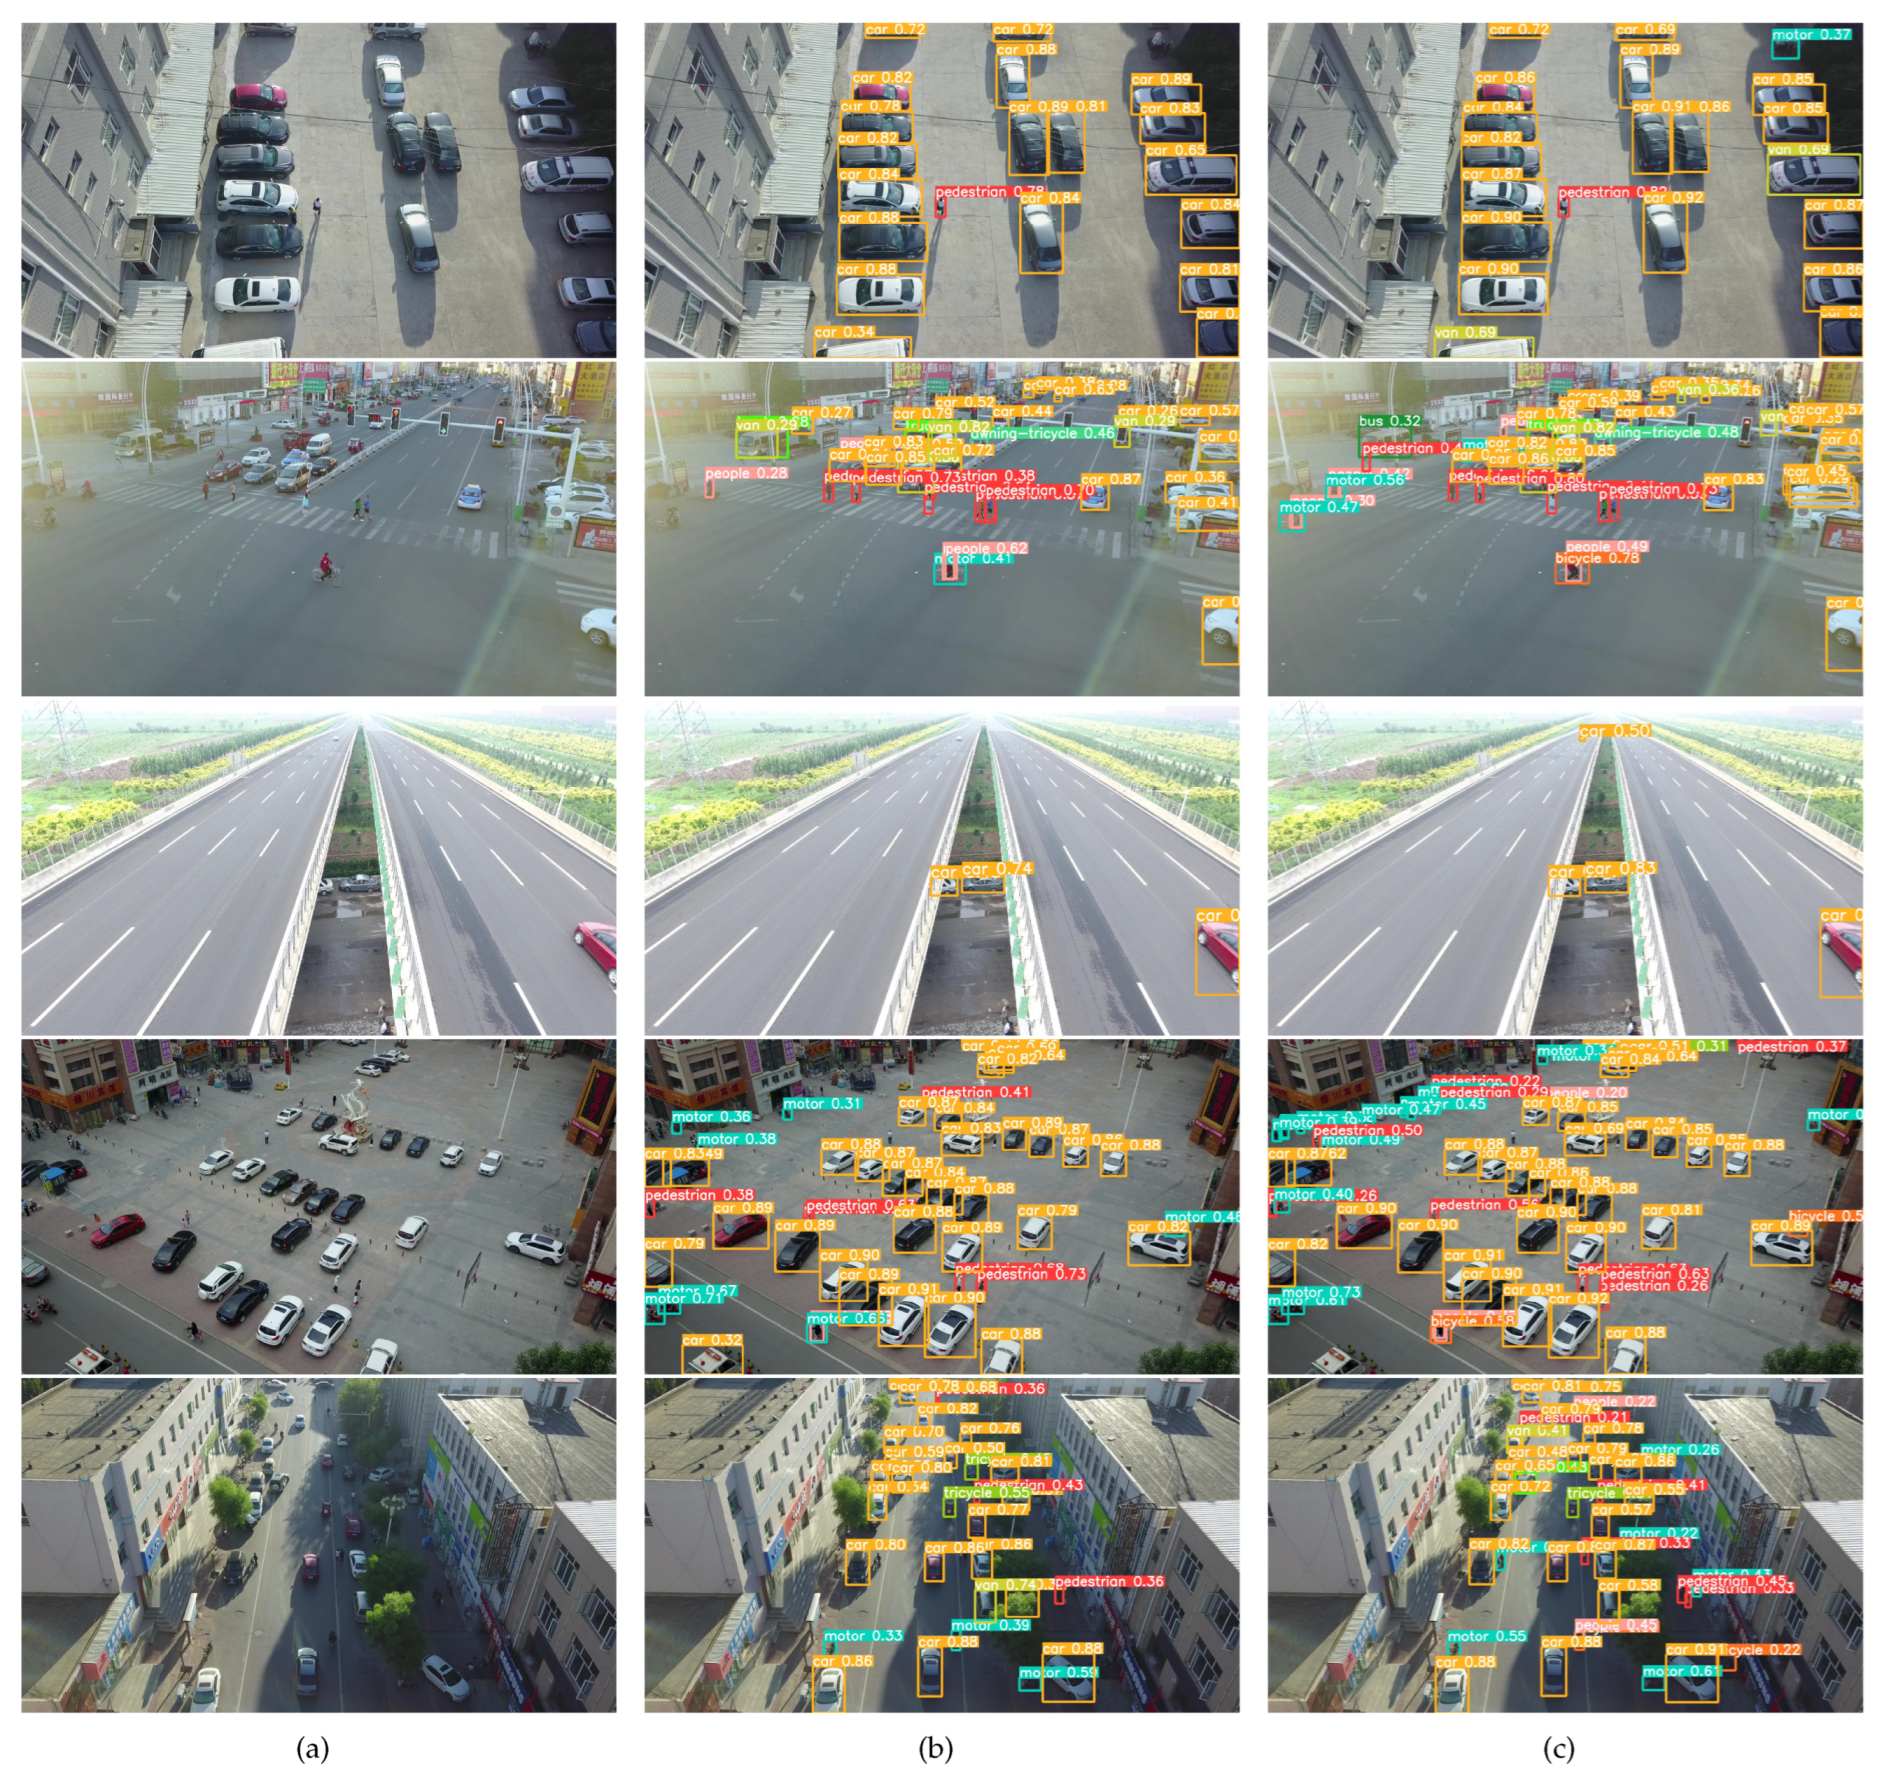
4.4. Experimental Results
4.5. The Result of Ablation Study
5. Discussion
6. Conclusions
Author Contributions
Funding
Data Availability Statement
Conflicts of Interest
References
- Ke, L.; Yuhang, G.; Lei, D.; Zhengyu, L.; Rui, Z.; Zhengbo, F.; Lina, D. Research on Surface Water Monitoring of Poyang Lake Based on Remote Sensing Technologies. In Proceedings of the 2021 IEEE International Geoscience and Remote Sensing Symposium (IGARSS), Brussels, Belgium, 11–16 July 2021; pp. 6836–6839. [Google Scholar]
- Rodrigues, D.M.; Coradi, P.C.; Timm, N.d.S.; Fornari, M.; Grellmann, P.; Amado, T.J.C.; Teodoro, P.E.; Teodoro, L.P.R.; Baio, F.H.R.; Chiomento, J.L.T. Applying Remote Sensing, Sensors, and Computational Techniques to Sustainable Agriculture: From Grain Production to Post-Harvest. Agriculture 2024, 14, 161. [Google Scholar] [CrossRef]
- Zhao, S.; Zeng, R.; Zhang, Z.; Meng, X.; Qi, T.; Long, Z.; Guo, W.; Si, G. Landslide Mapping and Causes of Landslides in the China–Nepal Transportation Corridor Based on Remote Sensing Technology. Remote Sens. 2024, 16, 356. [Google Scholar] [CrossRef]
- Choi, K.; Moon, J.; Jung, H.G.; Suhr, J.K. Real-Time Object Detection and Tracking Based on Embedded Edge Devices for Local Dynamic Map Generation. Electronics 2024, 13, 811. [Google Scholar] [CrossRef]
- Jocher, G.; Chaurasia, A.; Qiu, J. Ultralytics YOLOv8. Available online: https://github.com/ultralytics/ultralytics (accessed on 12 September 2022).
- Redmon, J.; Divvala, S.; Girshick, R.; Farhadi, A. You only look once: Unified, real-time object detection. In Proceedings of the IEEE Conference on Computer Vision and Pattern Recognition, Las Vegas, NV, USA, 18–22 June 2016; pp. 779–788. [Google Scholar]
- Zhukov, A.; Rivero, A.; Benois-Pineau, J.; Zemmari, A.; Mosbah, M. A Hybrid System for Defect Detection on Rail Lines through the Fusion of Object and Context Information. Sensors 2024, 24, 1171. [Google Scholar] [CrossRef] [PubMed]
- Zhao, X.; Xiao, N.; Cai, Z.; Xin, S. YOLOv5-Sewer: Lightweight Sewer Defect Detection Model. Appl. Sci. 2024, 14, 1869. [Google Scholar] [CrossRef]
- Chen, Z.; Tian, R.; Xiong, D.; Yuan, C.; Li, T.; Shi, Y. Multi-Dimensional Information Fusion You Only Look Once Network for Suspicious Object Detection in Millimeter Wave Images. Electronics 2024, 13, 773. [Google Scholar] [CrossRef]
- Ding, K.; Li, X.; Guo, W.; Wu, L. Improved object detection algorithm for drone-captured dataset based on yolov5. In Proceedings of the the 2nd International Conference on Consumer Electronics and Computer Engineering (ICCECE), Guangzhou, China, 14–16 January 2021; pp. 895–899. [Google Scholar]
- Tang, L.; Yun, L.; Chen, Z.; Cheng, F. HRYNet: A Highly Robust YOLO Network for Complex Road Traffic Object Detection. Sensors 2024, 24, 642. [Google Scholar] [CrossRef] [PubMed]
- Wu, K.; Chen, Y.; Lu, Y.; Yang, Z.; Yuan, J.; Zheng, E. SOD-YOLO: A High-Precision Detection of Small Targets on High-Voltage Transmission Lines. Electronics 2024, 13, 1371. [Google Scholar] [CrossRef]
- Yuan, Z.; Tang, X.; Ning, H.; Yang, Z. LW-YOLO: Lightweight Deep Learning Model for Fast and Precise Defect Detection in Printed Circuit Boards. Symmetry 2024, 16, 418. [Google Scholar] [CrossRef]
- Song, Y.; Hong, S.; Hu, C.; He, P.; Tao, L.; Tie, Z.; Ding, C. MEB-YOLO: An Efficient Vehicle Detection Method in Complex Traffic Road Scenes. Comput. Mater. Contin. 2023, 75, 5761–5784. [Google Scholar] [CrossRef]
- Du, X.; Cheng, H.; Ma, Z.; Lu, W.; Wang, M.; Meng, Z.; Jiang, C.; Hong, F. DSW-YOLO: A detection method for ground-planted strawberry fruits under different occlusion levels. Comput. Electron. Agric. 2023, 214, 108304. [Google Scholar] [CrossRef]
- Wan, Y.; Li, J. LGP-YOLO: An efficient convolutional neural network for surface defect detection of light guide plate. Complex Intell. Syst. 2024, 10, 2083–2105. [Google Scholar] [CrossRef]
- Dai, X.; Chen, Y.; Xiao, B.; Chen, D.; Liu, M.; Yuan, L.; Zhang, L. Dynamic head: Unifying object detection heads with attentions. In Proceedings of the IEEE/CVF Conference on Computer Vision and Pattern Recognition, Virtual, 20–25 July 2021; pp. 7373–7382. [Google Scholar]
- Du, Z.; Liang, Y. Object Detection of Remote Sensing Image Based on Multi-Scale Feature Fusion and Attention Mechanism. IEEE Access 2024, 12, 8619–8632. [Google Scholar] [CrossRef]
- Liang, S.; Wu, H.; Zhen, L.; Hua, Q.; Garg, S.; Kaddoum, G.; Hassan, M.M.; Yu, K. Edge YOLO: Real-time intelligent object detection system based on edge-cloud cooperation in autonomous vehicles. IEEE Trans. Intell. Transp. Syst. 2022, 23, 25345–25360. [Google Scholar] [CrossRef]
- Wu, H.; Zhu, Y.; Wang, L. A Dense Small Object Detection Algorithm Based on a Global Normalization Attention Mechanism. Appl. Sci. 2023, 13, 11760. [Google Scholar] [CrossRef]
- Liu, J.; Liu, X.; Chen, Q.; Niu, S. A Traffic Parameter Extraction Model Using Small Vehicle Detection and Tracking in Low-Brightness Aerial Images. Sustainability 2023, 15, 8505. [Google Scholar] [CrossRef]
- Mai, S.; You, Y.; Feng, Y. SGR: An Improved Point-Based Method for Remote Sensing Object Detection via Dual-Domain Alignment Saliency-Guided RepPoints. Remote Sens. 2024, 16, 250. [Google Scholar] [CrossRef]
- Zhang, Z. Drone-YOLO: An Efficient Neural Network Method for Target Detection in Drone Images. Drones 2023, 7, 525. [Google Scholar] [CrossRef]
- Liu, S.; Qi, L.; Qin, H.; Shi, J.; Jia, J. Path aggregation network for instance segmentation. In Proceedings of the IEEE Conference on Computer Vision and Pattern Recognition, Salt Lake City, UT, USA, 18–22 June 2018; pp. 8759–8768. [Google Scholar]
- Ding, X.; Zhang, X.; Ma, N.; Han, J.; Ding, G.; Sun, J. Repvgg: Making vgg-style convnets great again. In Proceedings of the IEEE/CVF Conference on Computer Vision and Pattern Recognition, Virtual, 20–25 July 2021; pp. 13733–13742. [Google Scholar]
- Mo, Y.; Wang, L.; Hong, W.; Chu, C.; Li, P.; Xia, H. Small-Scale Foreign Object Debris Detection Using Deep Learning and Dual Light Modes. Appl. Sci. 2023, 14, 2162. [Google Scholar] [CrossRef]
- Yang, M.; Tong, X.; Chen, H. Detection of Small Lesions on Grape Leaves Based on Improved YOLOv7. Electronics 2024, 13, 464. [Google Scholar] [CrossRef]
- Wang, C.Y.; Bochkovskiy, A.; Liao, H.Y.M. YOLOv7: Trainable bag-of-freebies sets new state-of-the-art for real-time object detectors. In Proceedings of the IEEE/CVF Conference on Computer Vision and Pattern Recognition, Vancouver, BC, Canada, 18–22 June 2023; pp. 7464–7475. [Google Scholar]
- Aibibu, T.; Lan, J.; Zeng, Y.; Lu, W.; Gu, N. An Efficient Rep-Style Gaussian–Wasserstein Network: Improved UAV Infrared Small Object Detection for Urban Road Surveillance and Safety. Remote Sens. 2024, 16, 25. [Google Scholar] [CrossRef]
- Liu, Q.; Liu, Y.; Lin, D. Revolutionizing Target Detection in Intelligent Traffic Systems: YOLOv8-SnakeVision. Electronics 2023, 12, 4970. [Google Scholar] [CrossRef]
- Qi, Y.; He, Y.; Qi, X.; Zhang, Y.; Yang, G. Dynamic snake convolution based on topological geometric constraints for tubular structure segmentation. In Proceedings of the IEEE/CVF Conference on Computer Vision and Pattern Recognition, Vancouver, BC, Canada, 18–22 June 2023; pp. 6070–6079. [Google Scholar]
- Tong, Z.; Chen, Y.; Xu, Z.; Yu, R. Wise-IoU: Bounding Box Regression Loss with Dynamic Focusing Mechanism. arXiv 2023, arXiv:2301.10051. [Google Scholar]
- Wang, W.; Chen, Y.; Wang, D.; Tie, Z.; Tao, L.; Ke, W. Joint attribute soft-sharing and contextual local: A multi-level features learning network for person re-identification. Vis. Comput. 2023, 40, 2251–2264. [Google Scholar] [CrossRef]
- Lin, T.Y.; Dollár, P.; Girshick, R.; He, K.; Hariharan, B.; Belongie, S. Feature pyramid networks for object detection. In Proceedings of the IEEE Conference on Computer Vision and Pattern Recognition, Honolulu, HI, USA, 21–26 July 2017; pp. 2117–2125. [Google Scholar]
- Wang, K.; Liew, J.H.; Zou, Y.; Zhou, D.; Feng, J. Panet: Few-shot image semantic segmentation with prototype alignment. In Proceedings of the IEEE/CVF International Conference on Computer Vision, Los Angeles, CA, USA, 21–26 June 2019; pp. 9197–9206. [Google Scholar]
- Dai, J.; Qi, H.; Xiong, Y.; Li, Y.; Zhang, G.; Hu, H.; Wei, Y. Deformable convolutional networks. In Proceedings of the IEEE Conference on Computer Vision and Pattern Recognition, Honolulu, HI, USA, 21–26 July 2017; pp. 764–773. [Google Scholar]
- Zhu, X.; Hu, H.; Lin, S.; Dai, J. Deformable convnets v2: More deformable, better results. In Proceedings of the IEEE/CVF International Conference on Computer Vision, Los Angeles, CA, USA, 21–26 June 2019; pp. 9308–9316. [Google Scholar]
- Chen, X.; Wang, X.; Zhou, J.; Qiao, Y.; Dong, C. Activating more pixels in image super-resolution transformer. In Proceedings of the IEEE/CVF Conference on Computer Vision and Pattern Recognition, Vancouver, BC, Canada, 18–22 June 2023; pp. 22367–22377. [Google Scholar]
- Shi, W.; Caballero, J.; Huszár, F.; Totz, J.; Aitken, A.P.; Bishop, R.; Rueckert, D.; Wang, Z. Real-time single image and video super-resolution using an efficient sub-pixel convolutional neural network. In Proceedings of the IEEE Conference on Computer Vision and Pattern Recognition, Las Vegas, NV, USA, 18–22 June 2016; pp. 1874–1883. [Google Scholar]
- Liu, Z.; Lin, Y.; Cao, Y.; Hu, H.; Wei, Y.; Zhang, Z.; Lin, S.; Guo, B. Swin transformer: Hierarchical vision transformer using shifted windows. In Proceedings of the IEEE/CVF Conference on Computer Vision and Pattern Recognition, Virtual, 20–25 July 2021; pp. 10012–10022. [Google Scholar]
- Woo, S.; Park, J.; Lee, J.Y.; Kweon, I.S. Cbam: Convolutional block attention module. In Proceedings of the European Conference on Computer Vision (ECCV), Munich, Germany, 8–14 September 2018; pp. 3–19. [Google Scholar]
- Vaswani, A.; Shazeer, N.; Parmar, N.; Uszkoreit, J.; Jones, L.; Gomez, A.N.; Kaiser, Ł.; Polosukhin, I. Attention is all you need. In Advances in Neural Information Processing Systems, Proceedings of the 31st Annual Conference on Neural Information Processing Systems (NIPS 2017), Long Beach, CA, USA, 4–9 December 2017; Curran Associates, Inc.: Red Hook, NY, USA, 2017; Volume 30, p. 30. [Google Scholar]
- Ren, S.; He, K.; Girshick, R.; Sun, J. Faster R-CNN: Towards real-time object detection with region proposal networks. IEEE Trans. Pattern Anal. Mach. Intell. 2016, 39, 1137–1149. [Google Scholar] [CrossRef] [PubMed]
- Bochkovskiy, A.; Wang, C.Y.; Liao, H.Y.M. YOLOv4: Optimal Speed and Accuracy of Object Detection. arXiv 2020, arXiv:2004.10934. [Google Scholar]
- Zhu, P.; Wen, L.; Du, D.; Bian, X.; Fan, H.; Hu, Q.; Ling, H. Detection and tracking meet drones challenge. IEEE Trans. Pattern Anal. Mach. Intell. 2021, 44, 7380–7399. [Google Scholar] [CrossRef]
- Sakaridis, C.; Dai, D.; Van Gool, L. Semantic foggy scene understanding with synthetic data. Int. J. Comput. Vis. 2018, 126, 973–992. [Google Scholar] [CrossRef]
- Liu, H.; Sun, F.; Gu, J.; Deng, L. SF-YOLOv5: A Lightweight Small Object Detection Algorithm Based on Improved Feature Fusion Mode. Sensors 2022, 22, 5871. [Google Scholar] [CrossRef]
- Cai, Z.; Vasconcelos, N.; Ling, H. Cascade r-cnn: Delving into high quality object detection. In Proceedings of the IEEE Conference on Computer Vision and Pattern Recognition, Salt Lake City, UT, USA, 18–22 June 2018; pp. 6154–6162. [Google Scholar]
- Zhang, S.; Wen, L.; Bian, X.; Lei, Z.; Li, S.Z. Single-shot refinement neural network for object detection. In Proceedings of the IEEE Conference on Computer Vision and Pattern Recognition, Salt Lake City, UT, USA, 18–22 June 2018; pp. 4203–4212. [Google Scholar]
- Guo, X. A novel Multi to Single Module for small object detection. arXiv 2023, arXiv:2303.14977. [Google Scholar]
- Selvaraju, R.R.; Cogswell, M.; Das, A.; Vedantam, R.; Parikh, D.; Batra, D. Grad-cam: Visual explanations from deep networks via gradient-based localization. In Proceedings of the IEEE International Conference on Computer Vision, Venice, Italy, 22–29 October 2019; pp. 618–626. [Google Scholar]
- Zheng, Z.; Wang, P.; Ren, D.; Liu, W.; Ye, R.; Hu, Q.; Zuo, W. Enhancing geometric factors in model learning and inference for object detection and instance segmentation. IEEE Trans. Cybern. 2021, 52, 8574–8586. [Google Scholar] [CrossRef] [PubMed]
- Zheng, Z.; Wang, P.; Liu, W.; Li, J.; Ye, R.; Ren, D. Distance-IoU loss: Faster and better learning for bounding box regression. In Proceedings of the AAAI Conference on Artificial Intelligence, New York, NY, USA, 7–12 February 2020; pp. 12993–13000. [Google Scholar]
- Zhang, Y.F.; Ren, W.; Zhang, Z.; Jia, Z.; Wang, L.; Tan, T. Focal and efficient IOU loss for accurate bounding box regression. Neurocomputing 2022, 506, 146–157. [Google Scholar] [CrossRef]
- Rezatofighi, H.; Tsoi, N.; Gwak, J.; Sadeghian, A.; Reid, I.; Savarese, S. Generalized Intersection Over Union: A Metric and a Loss for Bounding Box Regression. In Proceedings of the IEEE/CVF International Conference on Computer Vision, Los Angeles, CA, USA, 21–26 June 2019; pp. 658–666. [Google Scholar]
- Li, W.; Liu, X.; Yuan, Y. SIGMA: Semantic-complete Graph Matching for Domain Adaptive Object Detection. In Proceedings of the IEEE/CVF Conference on Computer Vision and Pattern Recognition, New Orleans, LA, USA, 19–20 June 2022; pp. 5291–5300. [Google Scholar]
- Qiao, L.; Zhao, Y.; Li, Z.; Qiu, X.; Wu, J.; Zhang, C. Defrcn: Decoupled faster r-cnn for few-shot object detection. In Proceedings of the IEEE/CVF Conference on Computer Vision and Pattern Recognition, Virtual, 20–25 July 2021; pp. 8681–8690. [Google Scholar]
- Krishna, O.; Ohashi, H.; Sinha, S. MILA: Memory-Based Instance-Level Adaptation for Cross-Domain Object Detection. arXiv 2023, arXiv:2309.01086. [Google Scholar]
- Han, K.; Wang, Y.; Tian, Q.; Guo, J.; Xu, C.; Xu, C. Ghostnet: More features from cheap operations. In Proceedings of the IEEE/CVF Conference on Computer Vision and Pattern Recognition, Seattle, WA, USA, 18–22 June 2020; pp. 1580–1589. [Google Scholar]
- Zheng, M.; Qi, G.; Zhu, Z.; Li, Y.; Wei, H.; Liu, Y. Image dehazing by an artificial image fusion method based on adaptive structure decomposition. IEEE Sens. J. 2020, 20, 8062–8072. [Google Scholar] [CrossRef]


| Model | AP | mAP50 | mAP75 |
|---|---|---|---|
| YOLOv8n | 17.6% | 30.9% | 17.2% |
| YOLOv5n [47] | 14.2% | 25.1% | 13.4% |
| YOLOv5s [47] | 15.00% | 26.6% | 14.2% |
| Cascade-RCNN [48] | 16.1% | 31.9% | 15.0% |
| RefineDet [49] | 14.9% | 28.8% | 14.1% |
| M2S [50] | 16.1% | 29.7% | 14.2% |
| Ours | 21.8% | 36.1% | 21.6% |
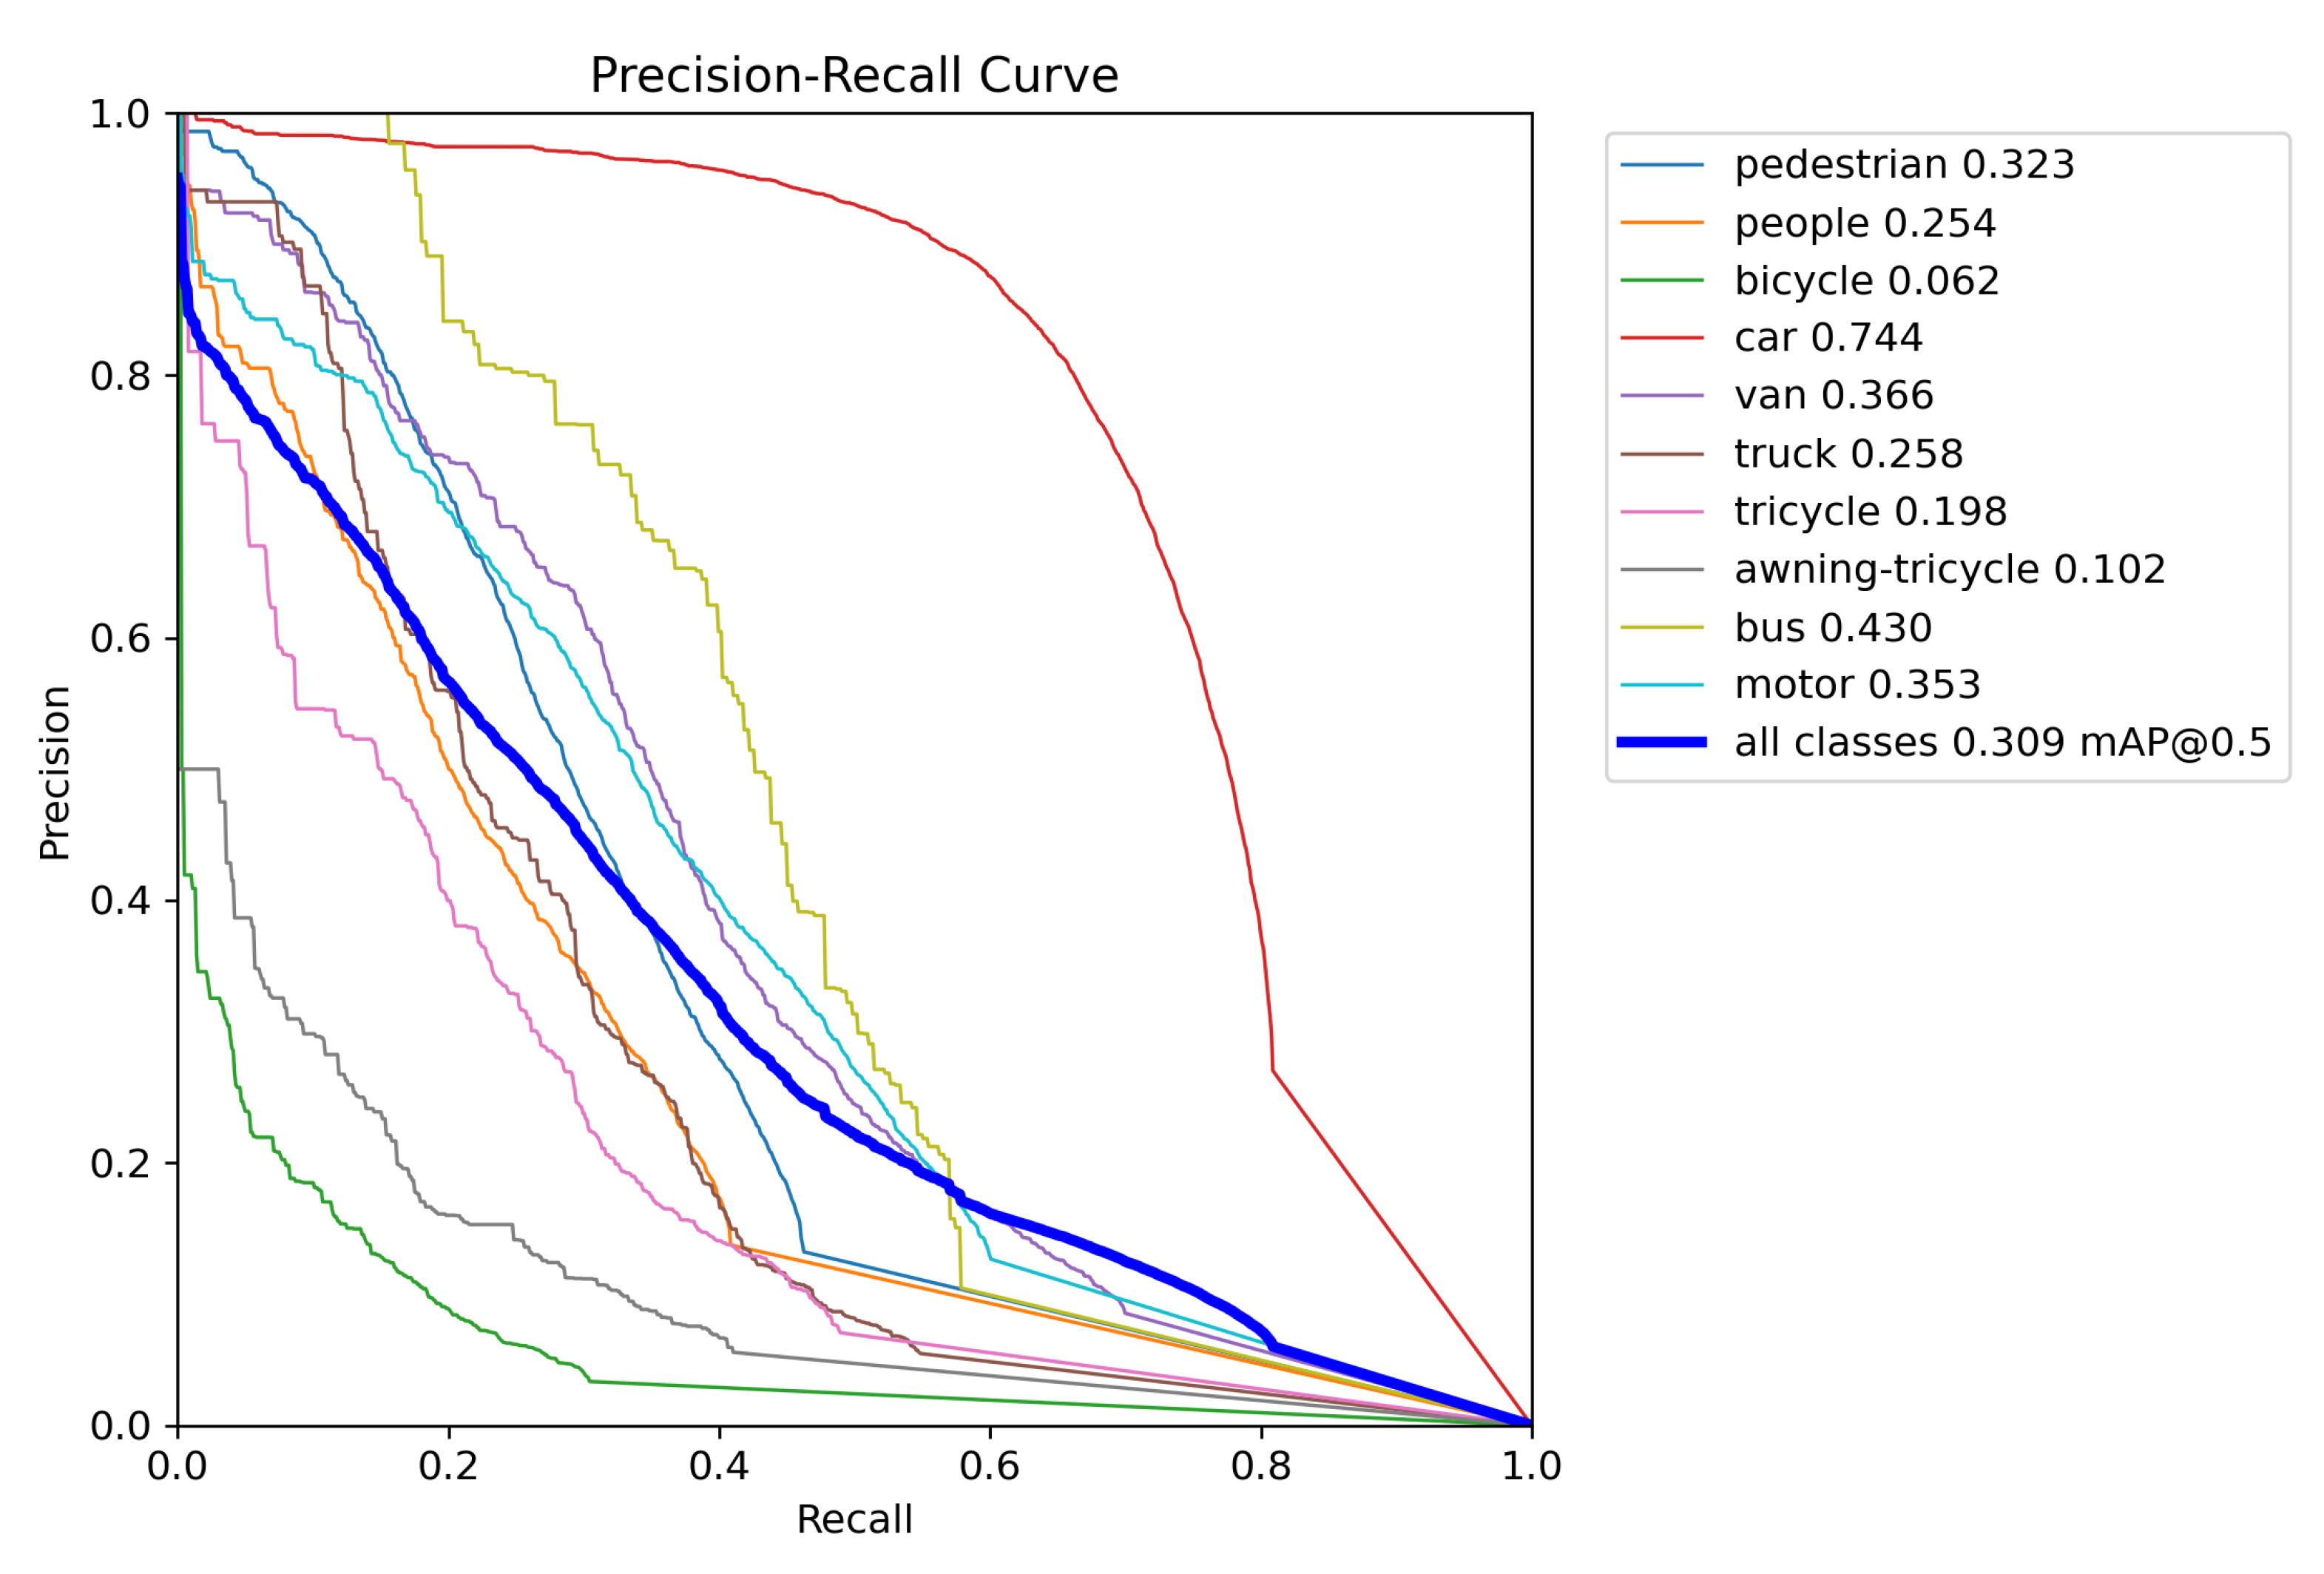
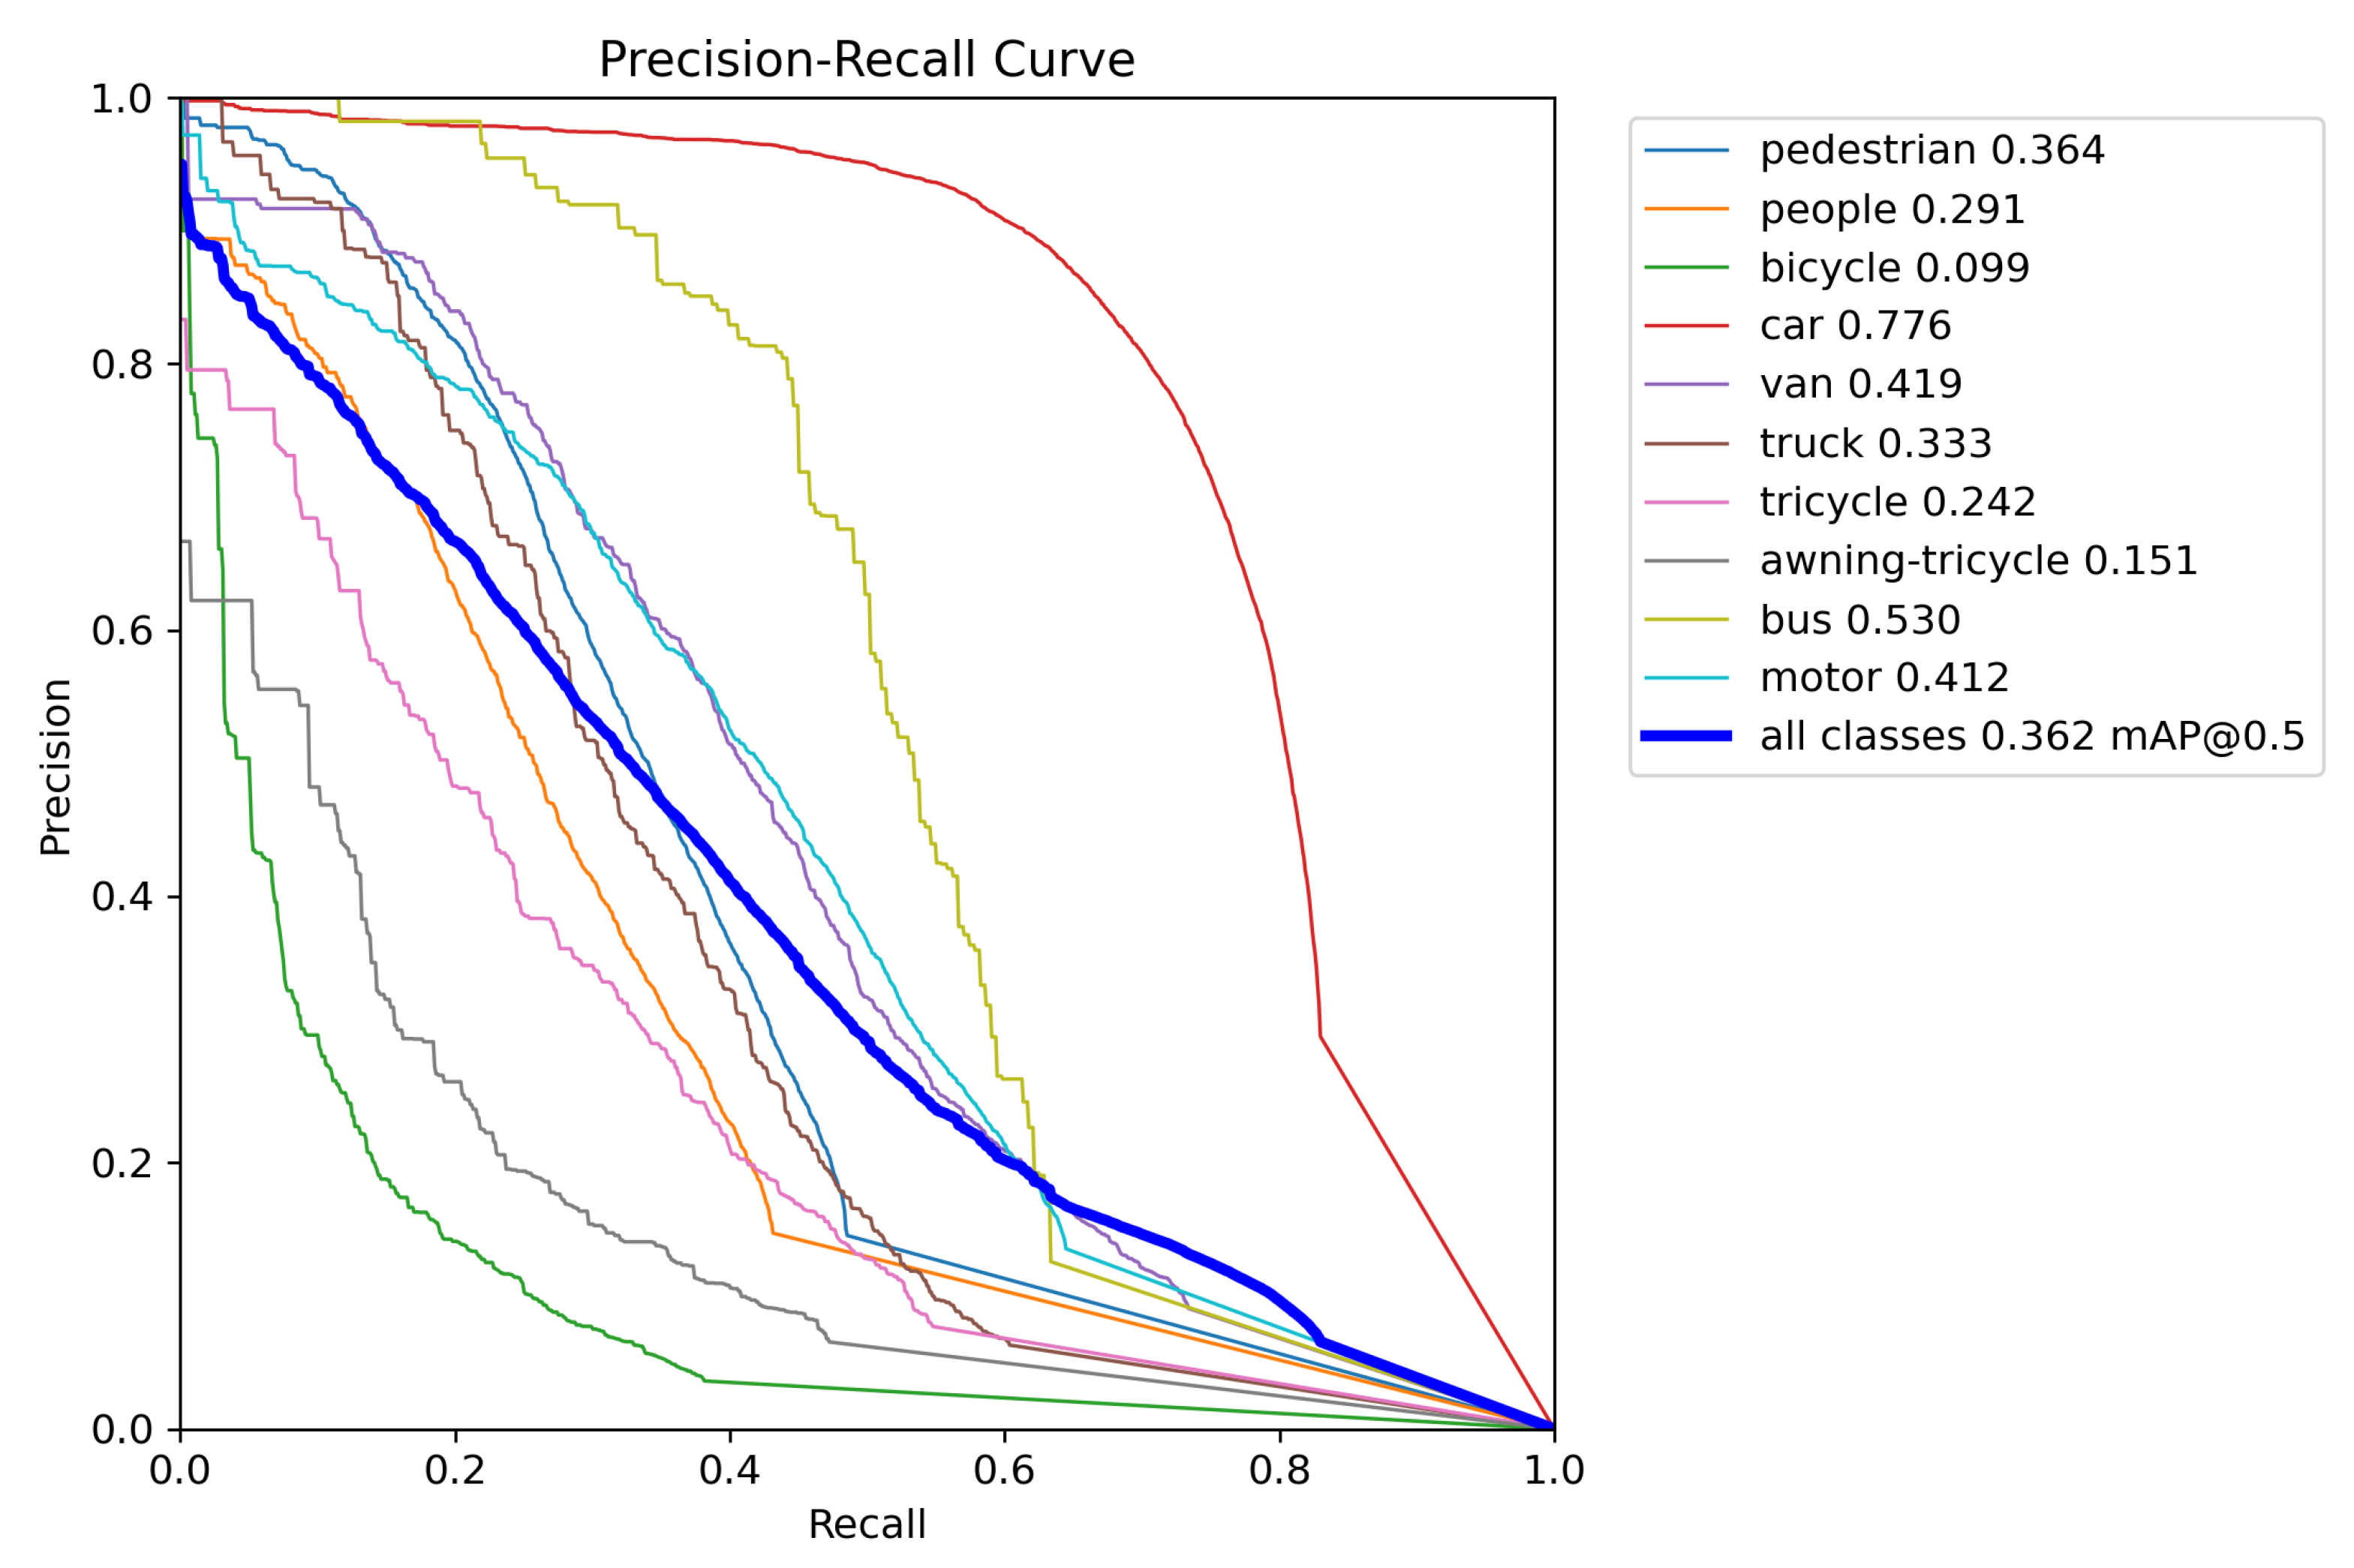
| Class | YOLOv8n | OD-YOLO | ||||
|---|---|---|---|---|---|---|
| AP | mAP50 | mAP75 | AP | mAP50 | mAP75 | |
| pedestrian | 0.135 | 0.323 | 0.0899 | 0.163 | 0.364 | 0.121 |
| people | 0.086 | 0.254 | 0.036 | 0.109 | 0.291 | 0.0538 |
| bicycle | 0.024 | 0.0615 | 0.015 | 0.041 | 0.0995 | 0.0266 |
| car | 0.508 | 0.744 | 0.563 | 0.546 | 0.776 | 0.607 |
| van | 0.251 | 0.366 | 0.286 | 0.297 | 0.419 | 0.339 |
| truck | 0.163 | 0.258 | 0.17 | 0.22 | 0.333 | 0.243 |
| tricycle | 0.107 | 0.198 | 0.106 | 0.134 | 0.242 | 0.212 |
| awning-tricycle | 0.0625 | 0.102 | 0.0653 | 0.0958 | 0.151 | 0.106 |
| bus | 0.282 | 0.43 | 0.309 | 0.374 | 0.53 | 0.431 |
| motor | 0.142 | 0.353 | 0.0841 | 0.176 | 0.412 | 0.115 |
| Loss Function | AP | mAP50 | mAP75 |
|---|---|---|---|
| CIoU [52] | 17.6% | 30.9% | 17.2% |
| DIoU [53] | 17.7% | 31.1% | 17.6% |
| EIoU [54] | 17.2% | 30.2% | 17.0% |
| GIoU [55] | 17.0% | 30.0% | 16.8% |
| WIoU [32] | 17.3% | 30.5% | 17.2% |
| OIoU | 18.4% | 31.8% | 18.2% |
| Model | Person | Rider | Car | Truck | Bus | Train | Motorcycle | Bicycle | mAP |
|---|---|---|---|---|---|---|---|---|---|
| YOLOv8n | 45.2% | 65.4% | 60.2% | 35.1% | 53.4% | 26.6% | 30.4% | 55.2% | 47.7% |
| YOLOv5n | 42.9% | 61% | 58.6% | 28.0% | 52.8% | 19.5% | 39.9% | 50.9% | 44.2% |
| SIGMA [56] | 44% | 43.9% | 60.3% | 31.6% | 50.4% | 51.5% | 31.7% | 40.6% | 44.2% |
| DeFRCN [57] | 34.3% | 41.4% | 47.3% | 24.3% | 32.9% | 17.3% | 26.6% | 38.4% | 32.8% |
| MILA [58] | 45.6% | 52.8% | 64.8% | 34.7% | 61.4% | 54.1% | 39.7% | 51.5% | 50.6% |
| Ours | 47.5% | 67.3% | 63.2% | 42.8% | 56.5% | 49.6% | 41.9% | 56.5% | 53.2% |
| Model | AP | mAP50 | mAP75 | GFLOPs | FPS |
|---|---|---|---|---|---|
| YOLOv8n | 17.6% | 30.9% | 17.2% | 8.9 | 256.4 |
| +DRmodule | 18.2% | 32.2% | 18.1% | 10.4 | 214.3 |
| +Dynamic Head | 21.2% | 35.3% | 21.1% | 12.6 | 134.3 |
| +OIoU | 21.8% | 36.1% | 21.6% | 12.6 | 134.3 |
Disclaimer/Publisher’s Note: The statements, opinions and data contained in all publications are solely those of the individual author(s) and contributor(s) and not of MDPI and/or the editor(s). MDPI and/or the editor(s) disclaim responsibility for any injury to people or property resulting from any ideas, methods, instructions or products referred to in the content. |
© 2024 by the authors. Licensee MDPI, Basel, Switzerland. This article is an open access article distributed under the terms and conditions of the Creative Commons Attribution (CC BY) license (https://creativecommons.org/licenses/by/4.0/).
Share and Cite
Bu, Y.; Ye, H.; Tie, Z.; Chen, Y.; Zhang, D. OD-YOLO: Robust Small Object Detection Model in Remote Sensing Image with a Novel Multi-Scale Feature Fusion. Sensors 2024, 24, 3596. https://doi.org/10.3390/s24113596
Bu Y, Ye H, Tie Z, Chen Y, Zhang D. OD-YOLO: Robust Small Object Detection Model in Remote Sensing Image with a Novel Multi-Scale Feature Fusion. Sensors. 2024; 24(11):3596. https://doi.org/10.3390/s24113596
Chicago/Turabian StyleBu, Yangcheng, Hairong Ye, Zhixin Tie, Yanbing Chen, and Dingming Zhang. 2024. "OD-YOLO: Robust Small Object Detection Model in Remote Sensing Image with a Novel Multi-Scale Feature Fusion" Sensors 24, no. 11: 3596. https://doi.org/10.3390/s24113596
APA StyleBu, Y., Ye, H., Tie, Z., Chen, Y., & Zhang, D. (2024). OD-YOLO: Robust Small Object Detection Model in Remote Sensing Image with a Novel Multi-Scale Feature Fusion. Sensors, 24(11), 3596. https://doi.org/10.3390/s24113596