
Validity and Reliability of the Orthelligent Pro Sensor for Measuring Single-Leg Vertical Jump Height in Healthy Athletic Adults

Abstract
:1. Introduction
2. Materials and Methods
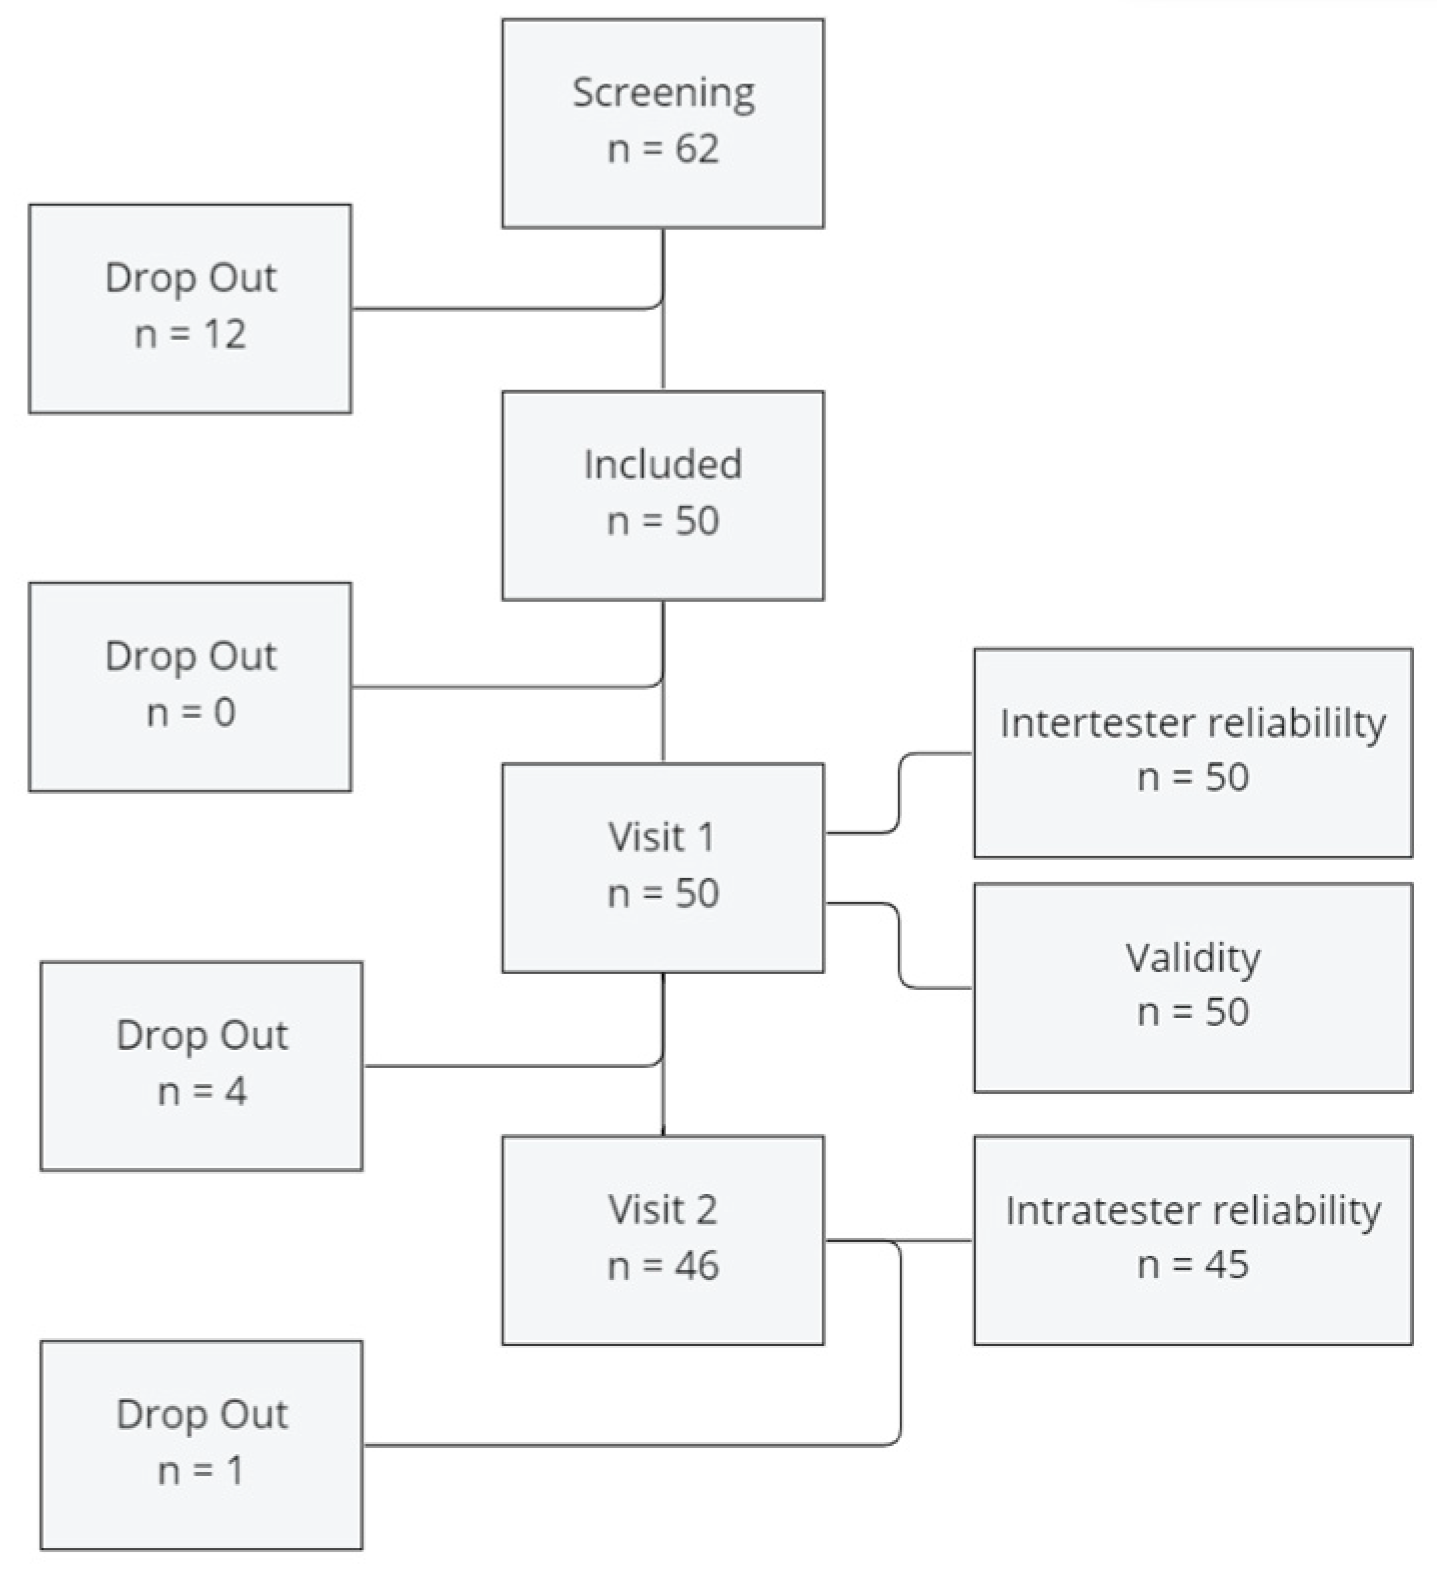
2.1. Participants and Recruitment
2.2. Measuring Instruments
2.2.1. Orthelligent Pro
2.2.2. Force Plate
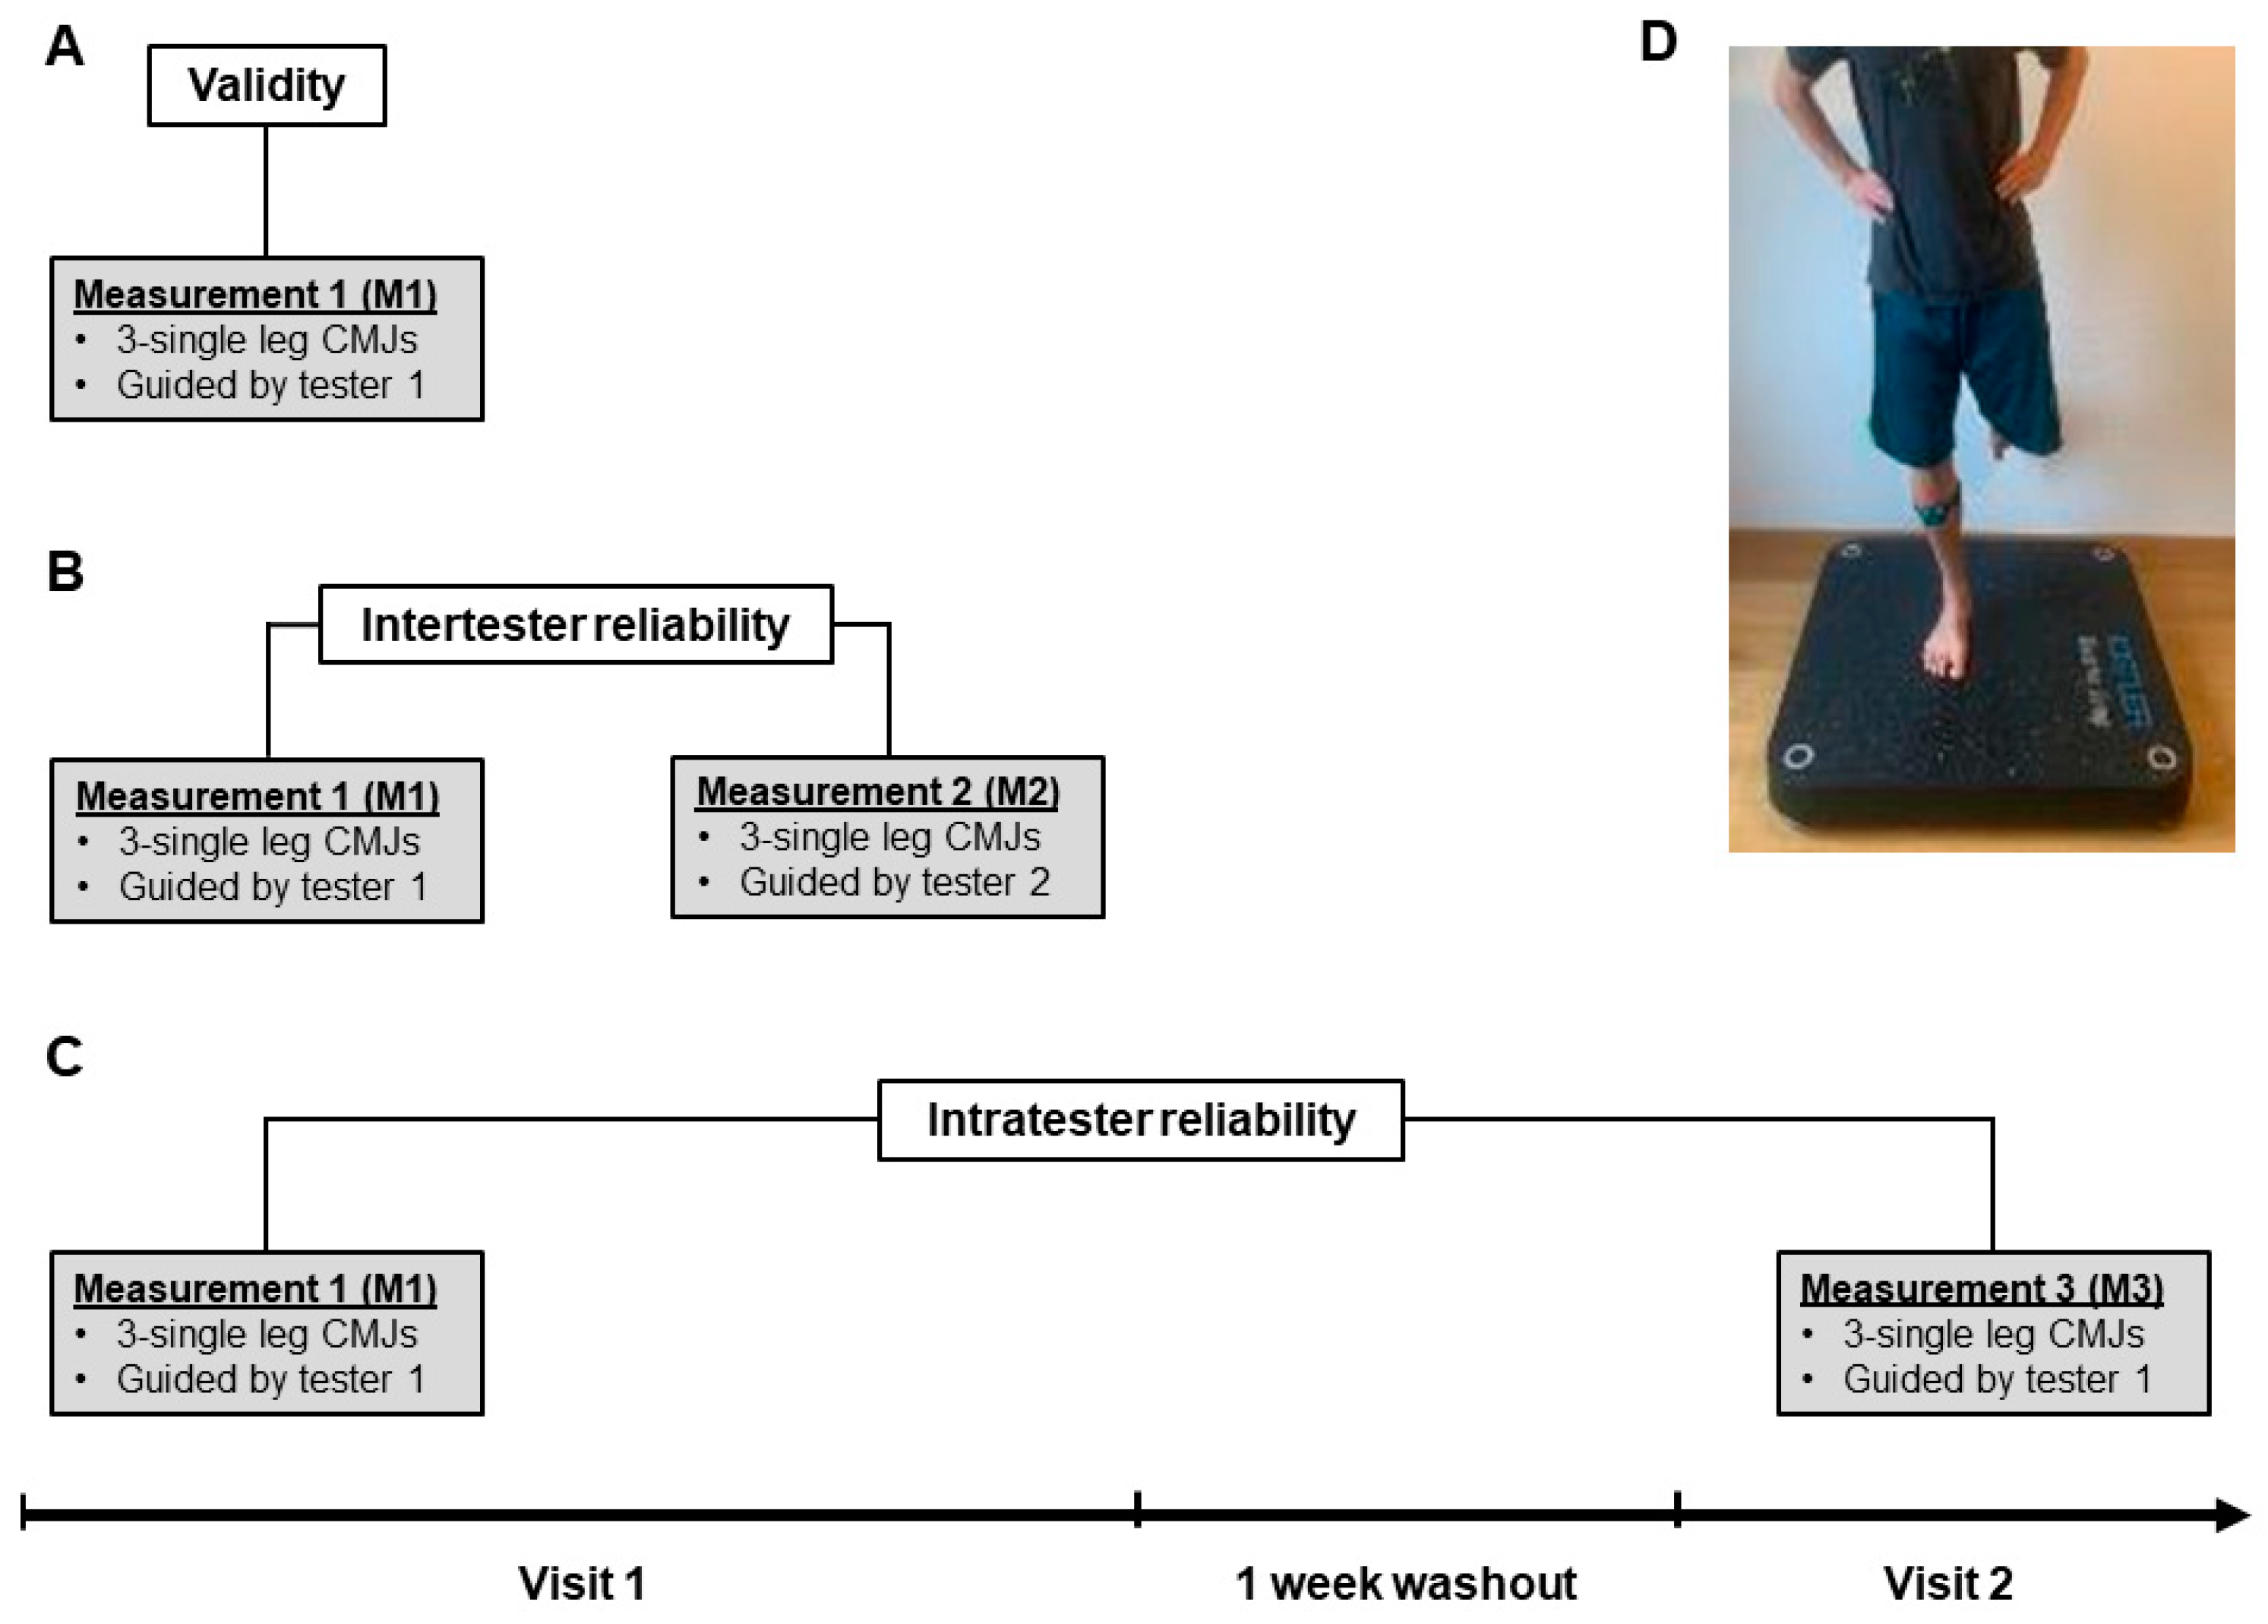
2.3. Procedures
2.4. Single-Leg CMJ
2.5. Data Collection
2.6. Data Analysis and Evaluation
3. Results
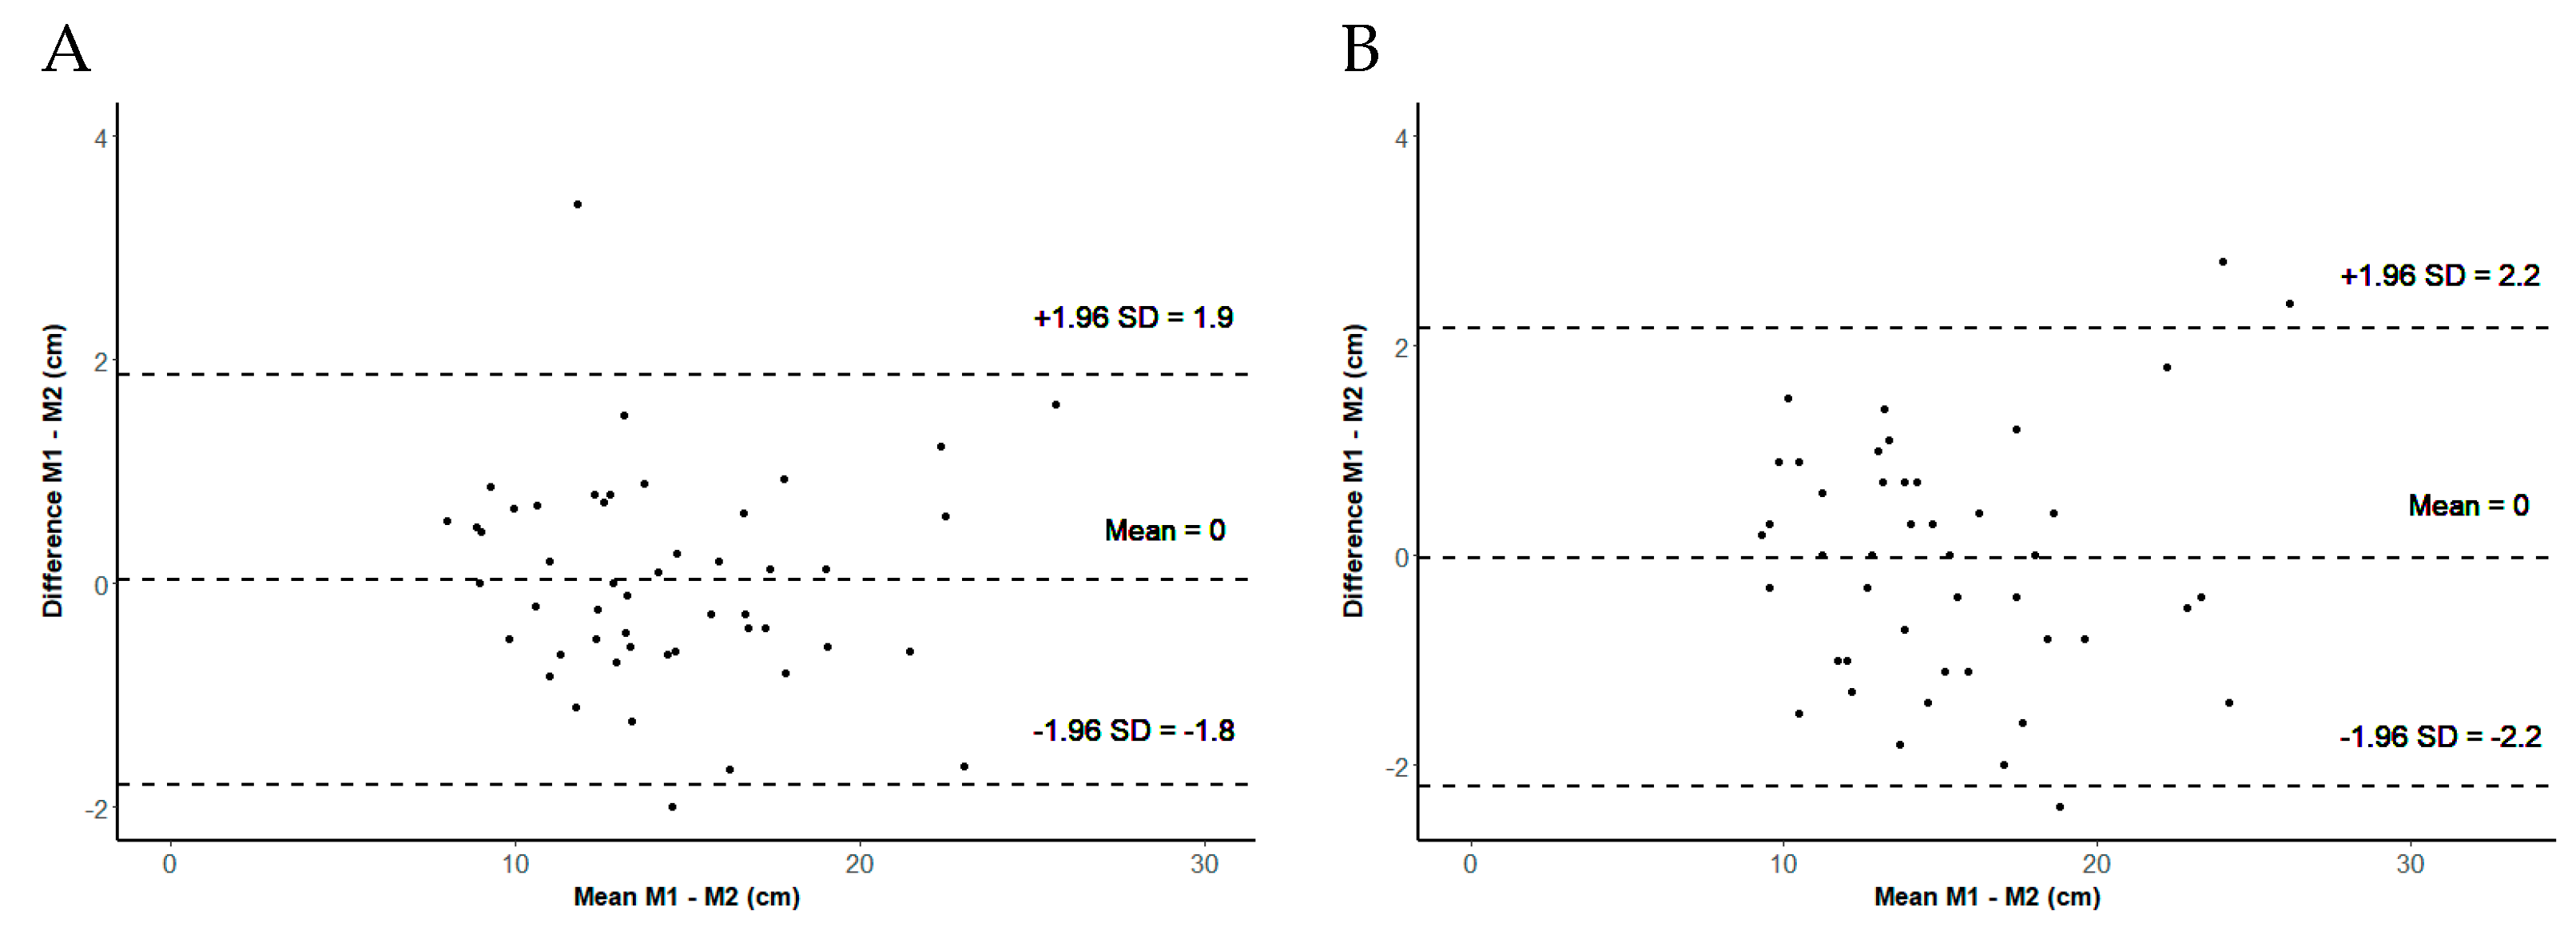
3.1. Intertester Reliability
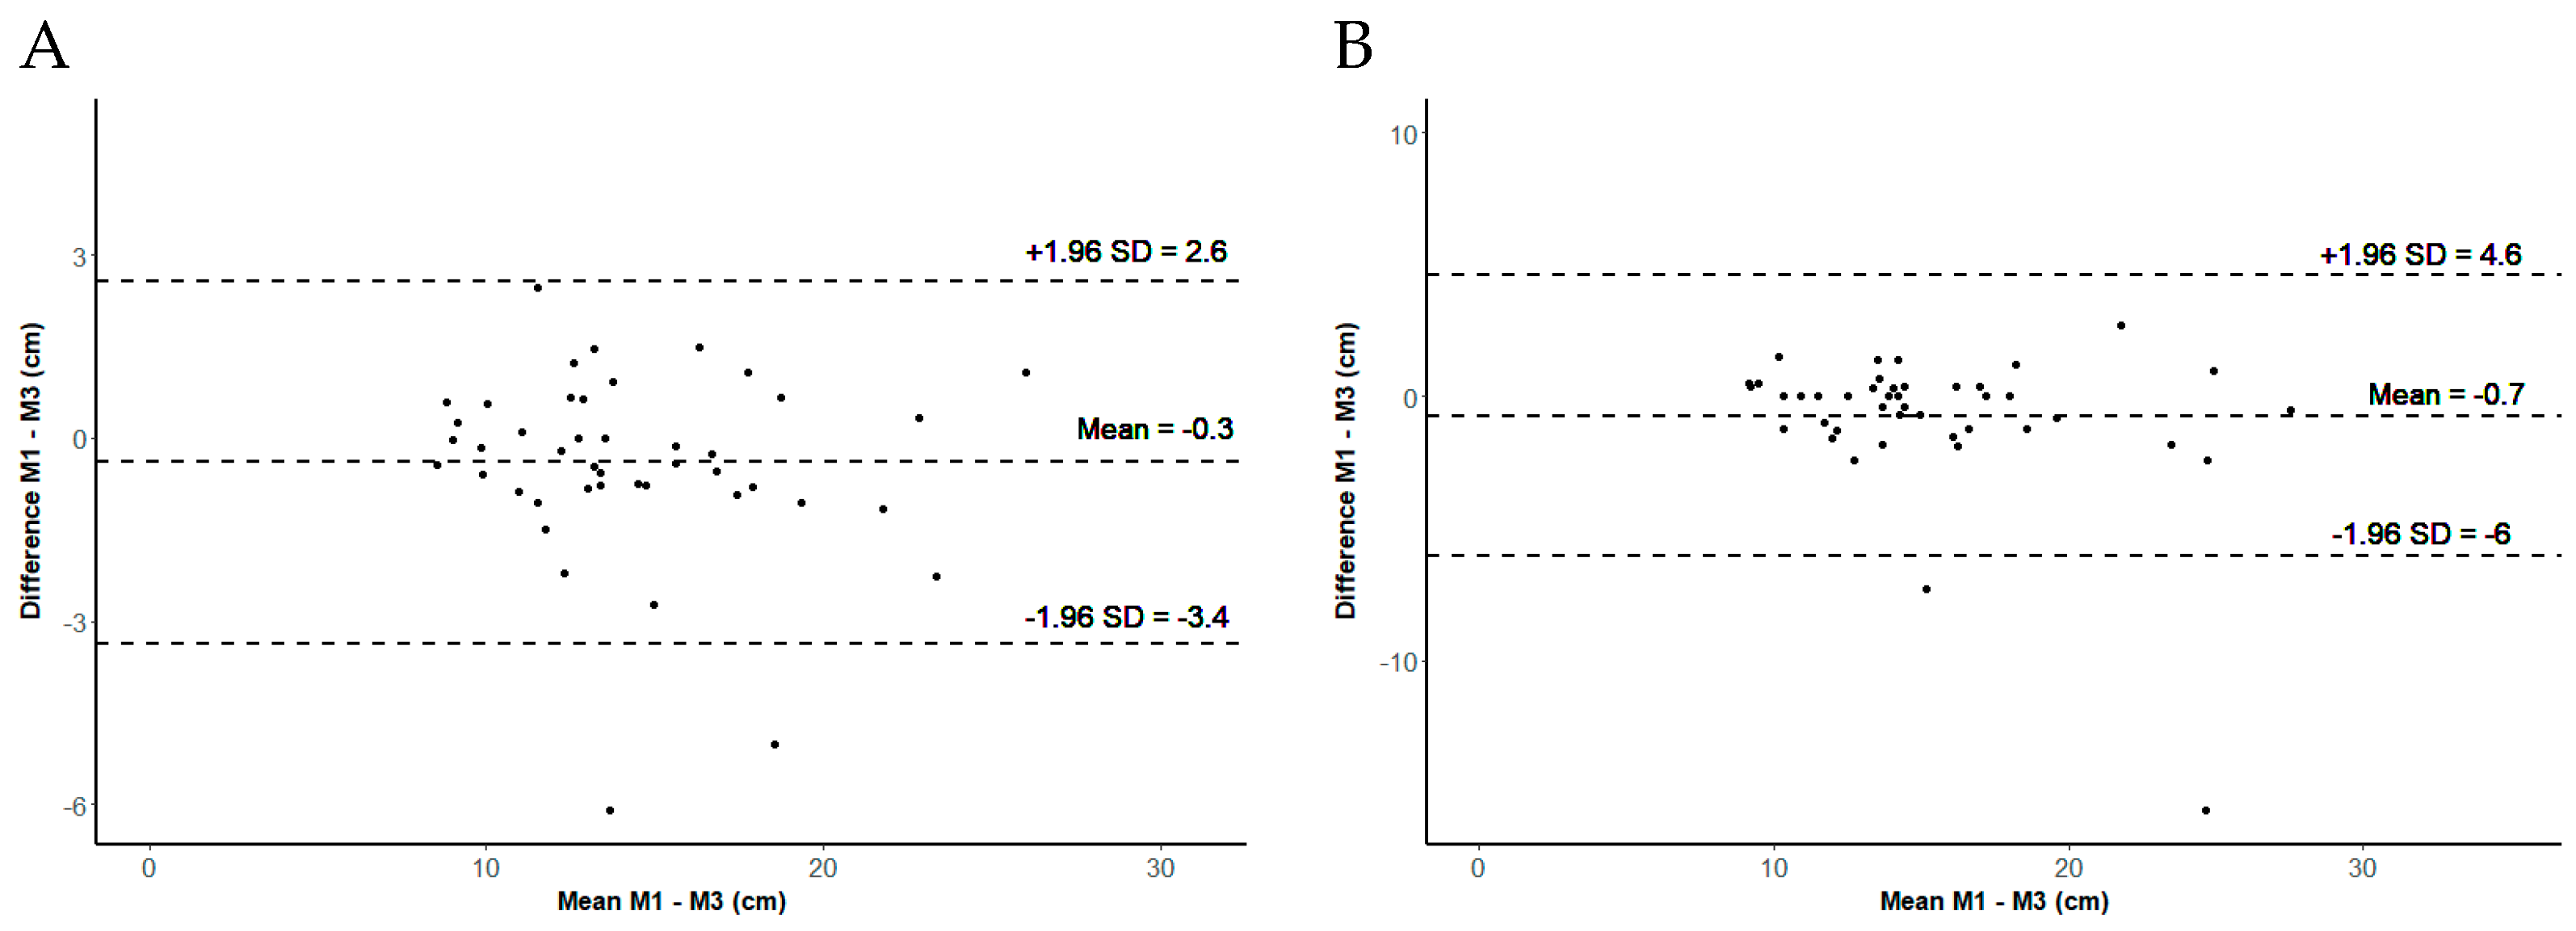
3.2. Intratester Reliability
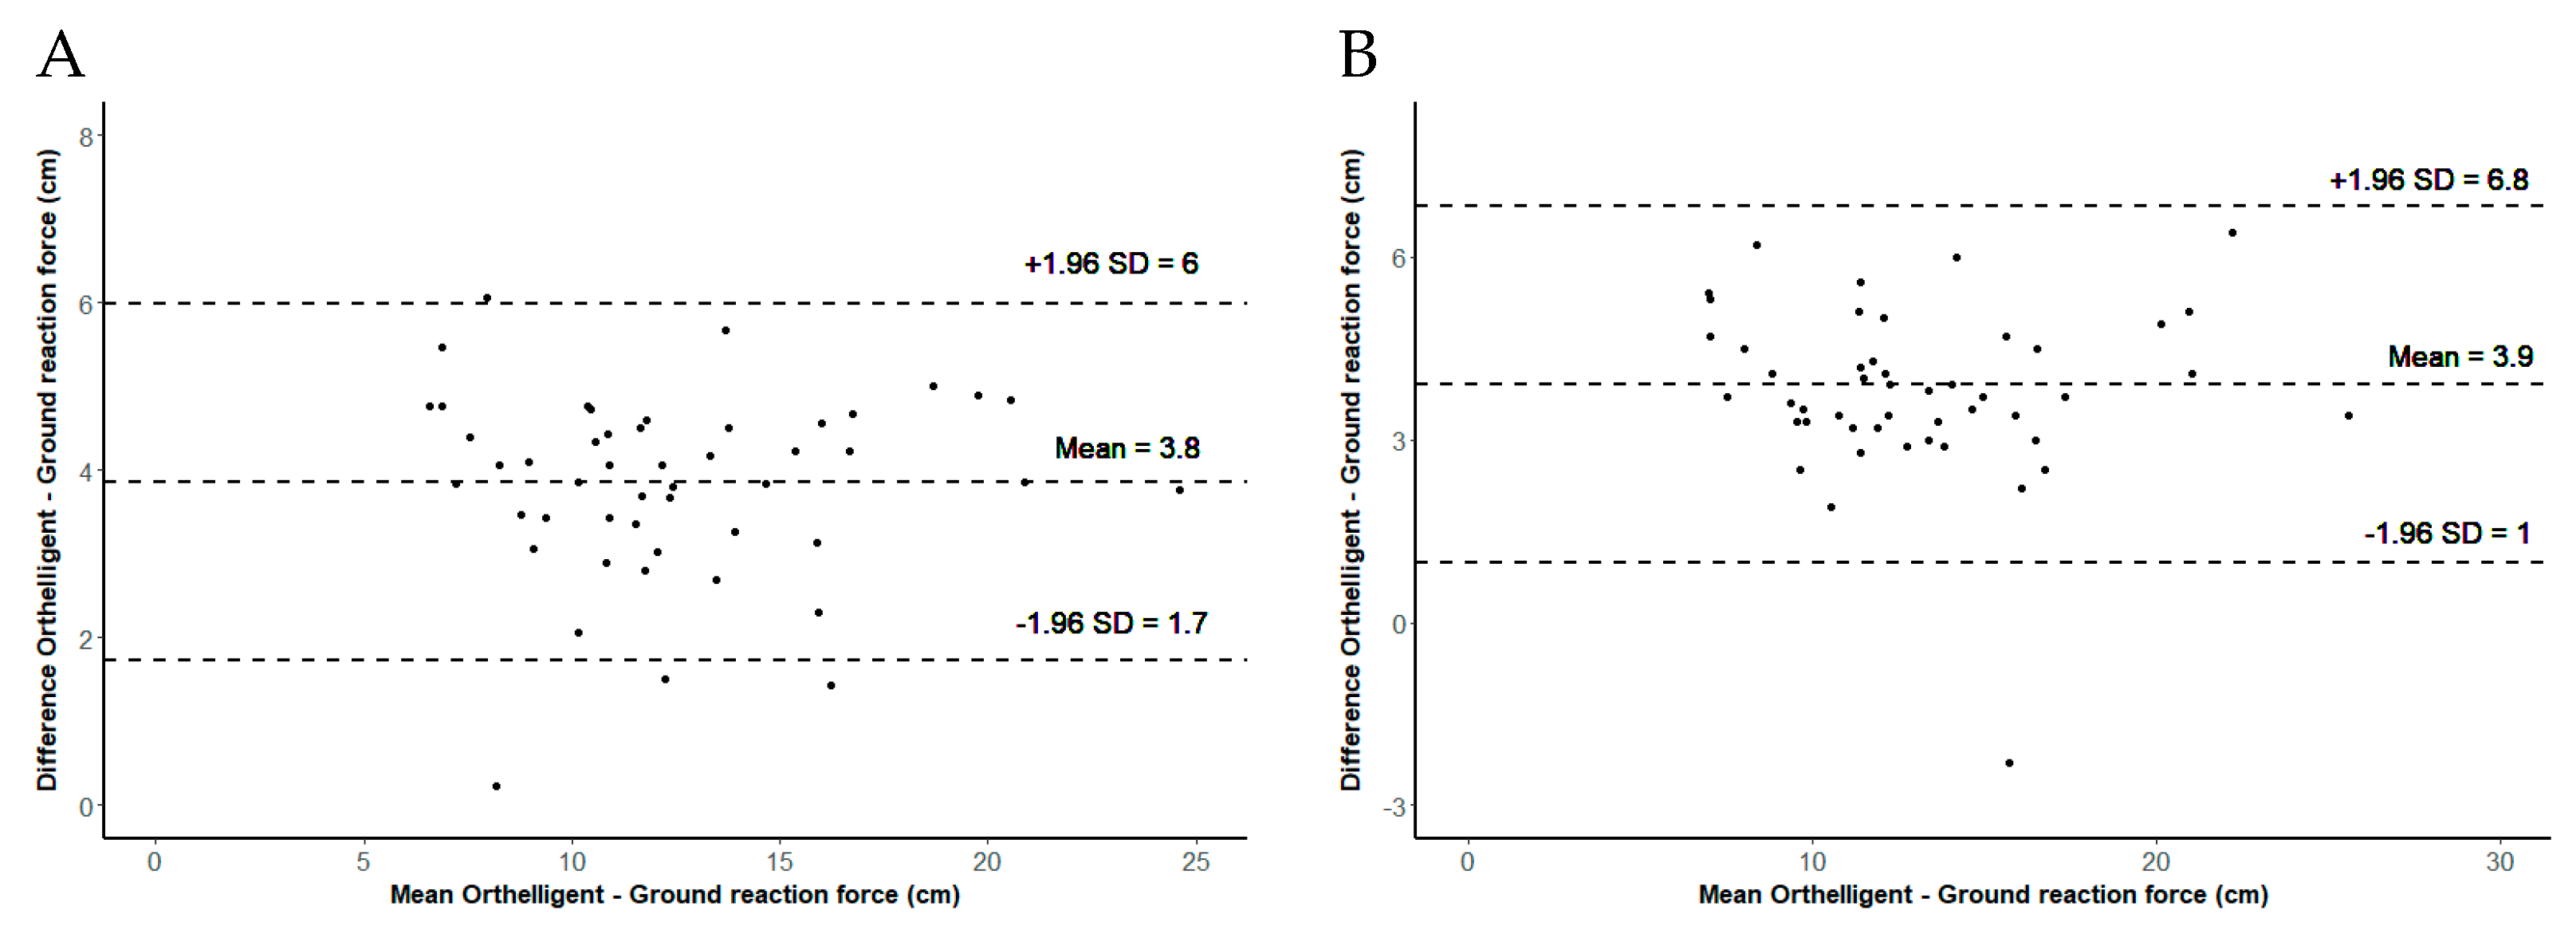
3.3. Validity of the Orthelligent Pro Sensor
4. Discussion
5. Conclusions
Author Contributions
Funding
Institutional Review Board Statement
Informed Consent Statement
Data Availability Statement
Conflicts of Interest
References
- Montalvo, S.; Gonzalez, M.P.; Dietze-Hermosa, M.S.; Eggleston, J.D.; Dorgo, S. Common Vertical Jump and Reactive Strength Index Measuring Devices: A Validity and Reliability Analysis. J. Strength Cond. Res. 2021, 35, 1234–1243. [Google Scholar] [CrossRef]
- Bloch, H.; Klein, C.; Luig, P.; Riepenhof, H. Return-to-Competition. Trauma Und Berufskrankh. 2017, 19, 26–34. [Google Scholar] [CrossRef]
- Steidl-Müller, L.; Hildebrandt, C.; Müller, E.; Fink, C.; Raschner, C. Limb symmetry index in competitive alpine ski racers: Reference values and injury risk identification according to age-related performance levels. J. Sport Health Sci. 2018, 7, 405–415. [Google Scholar] [CrossRef] [PubMed]
- Eagles, A.N.; Sayers, M.G.L.; Bousson, M.; Lovell, D.I. Current Methodologies and Implications of Phase Identification of the Vertical Jump: A Systematic Review and Meta-analysis. Sports Med. 2015, 45, 1311–1323. [Google Scholar] [CrossRef]
- Taylor, J.B.; Ford, K.R.; Nguyen, A.D.; Shultz, S.J. Biomechanical Comparison of Single- and Double-Leg Jump Landings in the Sagittal and Frontal Plane. Orthop. J. Sports Med. 2016, 4, 2325967116655158. [Google Scholar] [CrossRef] [PubMed]
- Gokeler, A.; Welling, W.; Benjaminse, A.; Lemmink, K.; Seil, R.; Zaffagnini, S. A critical analysis of limb symmetry indices of hop tests in athletes after anterior cruciate ligament reconstruction: A case control study. Orthop. Traumatol. Surg. Res. 2017, 103, 947–951. [Google Scholar] [CrossRef]
- Lee, D.W.; Yang, S.J.; Cho, S.I.; Lee, J.H.; Kim, J.G. Single-leg vertical jump test as a functional test after anterior cruciate ligament reconstruction. Knee 2018, 25, 1016–1026. [Google Scholar] [CrossRef] [PubMed]
- Xu, J.; Turner, A.; Comfort, P.; Harry, J.R.; McMahon, J.J.; Chavda, S.; Bishop, C. A Systematic Review of the Different Calculation Methods for Measuring Jump Height During the Countermovement and Drop Jump Tests. Sports Med. 2023, 53, 1055–1072. [Google Scholar] [CrossRef] [PubMed]
- Schwameder, H.; Wunsch, T. Biomechanik des Springens und Sprunganalyse. In Bewegung, Training, Leistung und Gesundheit: Handbuch Sport und Sportwissenschaft; Güllich, A., Krüger, M., Eds.; Springer: Berlin/Heidelberg, Germany, 2020; pp. 1–10. [Google Scholar]
- Rago, V.; Brito, J.; Figueiredo, P.; Carvalho, T.; Fernandes, T.; Fonseca, P.; Rebelo, A. Countermovement Jump Analysis Using Different Portable Devices: Implications for Field Testing. Sports 2018, 6, 91. [Google Scholar] [CrossRef] [PubMed]
- Stanton, R.; Wintour, S.A.; Kean, C.O. Validity and intra-rater reliability of MyJump app on iPhone 6s in jump performance. J. Sci. Med. Sport 2017, 20, 518–523. [Google Scholar] [CrossRef]
- Vieira, A.; Blazevich, A.J.; da Costa, A.S.; Tufano, J.J.; Bottaro, M. Validity and Test-retest Reliability of the Jumpo App for Jump Performance Measurement. Int. J. Exerc. Sci. 2021, 14, 677–686. [Google Scholar]
- Yingling, V.R.; Castro, D.A.; Duong, J.T.; Malpartida, F.J.; Usher, J.R.; Jenny, O. The reliability of vertical jump tests between the Vertec and My Jump phone application. PeerJ 2018, 6, e4669. [Google Scholar] [CrossRef] [PubMed]
- Brooks, E.R.; Benson, A.C.; Bruce, L.M. Novel Technologies Found to be Valid and Reliable for the Measurement of Vertical Jump Height with Jump-and-Reach Testing. J. Strength Cond. Res. 2018, 32, 2838–2845. Available online: https://journals.lww.com/nsca-jscr/Fulltext/2018/10000/Novel_Technologies_Found_to_be_Valid_and_Reliable.18.aspx (accessed on 8 November 2021). [CrossRef] [PubMed]
- OPED. Orthelligent Pro. Available online: https://oped.de/produkte/orthelligent-pro (accessed on 1 March 2021).
- Cosmin. COSMIN Study Design Checklist for Patient-Reported Outcome Measurement Instruments. Available online: https://www.cosmin.nl/wp-content/uploads/COSMIN-study-designing-checklist_final.pdf# (accessed on 21 December 2021).
- Kistler. Leistungsdiagnostik-System Quattro Jump. Available online: https://www.kistler.com/CH/de/cp/leistungsdiagnostik-system-quattro-jump-9290dd/P0000691 (accessed on 12 April 2024).
- Hébert-Losier, K.; Beaven, C. The MARS® for Squat, Countermovement and Standing Long Jump Performance Analyses: Are Measures Reproducible? J. Strength Cond. Res./Natl. Strength Cond. Assoc. 2013, 28, 1849–1857. [Google Scholar] [CrossRef] [PubMed]
- Bland, J.M.; Altman, D.G. Agreement between methods of measurement with multiple observations per individual. J. Biopharm. Stat. 2007, 17, 571–582. [Google Scholar] [CrossRef]
- Fleiss, J.L. Design and Analysis of Clinical Experiments; Wiley: Hoboken, NJ, USA, 2011. [Google Scholar]
- Vet, H.C.W.D. Measurement in Medicine: A Practical Guide (Practical Guides to Biostatistics and Epidemiology); Cambridge University Press: Cambridge, UK, 2011. [Google Scholar]
- Munro, B.H. Statistical Methods for Health Care Research (No. Bd. 1); Lippincott Williams & Wilkins: Philadelphia, PA, USA, 2005. [Google Scholar]
- Balsalobre-Fernández, C.; Glaister, M.; Lockey, R.A. The validity and reliability of an iPhone app for measuring vertical jump performance. J. Sports Sci. 2015, 33, 1574–1579. [Google Scholar] [CrossRef] [PubMed]
- Attia, A.; Dhahbi, W.; Chaouachi, A.; Padulo, J.; Wong, D.P.; Chamari, K. Measurement errors when estimating the vertical jump height with flight time using photocell devices: The example of Optojump. Biol. Sport 2017, 34, 63–70. [Google Scholar] [CrossRef]
- De Winter, A.F.; Heemskerk, M.A.; Terwee, C.B.; Jans, M.P.; Devillé, W.; Van Schaardenburg, D.J.; Scholten, R.J.; Bouter, L.M. Inter-observer reproducibility of measurements of range of motion in patients with shoulder pain using a digital inclinometer. BMC Musculoskelet Disord. 2004, 5, 18. [Google Scholar] [CrossRef] [PubMed]
- Pfister, P.B.; de Bruin, E.D.; Sterkele, I.; Maurer, B.; de Bie, R.A.; Knols, R.H. Manual muscle testing and hand-held dynamometry in people with inflammatory myopathy: An intra- and interrater reliability and validity study. PLoS ONE 2018, 13, e0194531. [Google Scholar] [CrossRef] [PubMed]

| Measurement 1 (n = 50) | Measurement 2 (n = 50) | Measurement 3 (n = 45) | |
|---|---|---|---|
| Male/Female | 15/35 | 15/35 | 13/32 |
| Age in years | 33.3 ± 8.6 | 33.3 ± 8.6 | 33.1 ± 8.5 |
| Size in meters | 1.69 ± 0.09 | 1.69 ± 0.09 | 1.7 ± 0.09 |
| Weight in kilograms | 68.8 ± 13.8 | 68.8 ± 13.8 | 69 ± 13.3 |
| M1 (cm) Mean ± SD | M2 (cm) Mean ± SD | ICC (95% CI) | SEM (cm) (SEM %) | SDC (cm) (SDC %) | |
|---|---|---|---|---|---|
| Mean (3 jumps) | 14.5 ± 4.1 | 14.5 ± 4.1 | 0.99 (0.98 to 0.99) | 0.46 (3) | 1.28 (9) |
| Max (3 jumps) | 15.3 ± 4.4 | 15.3 ± 4.3 | 0.97 (0.94 to 0.98) | 0.80 (5) | 2.21 (14) |
| M1 (cm) Mean ± SD | M3 (cm) Mean ± SD | ICC (95% CI) | SEM (cm) (SEM %) | SDC (cm) (SDC %) | |
|---|---|---|---|---|---|
| Mean (3 jumps) | 14.2 ± 4.0 | 14.6 ± 4.6 | 0.96 (0.93 to 0.98) | 1.47 (10) | 4.08 (28) |
| Max (3 jumps) | 15.0 ± 4.3 | 15.7 ± 5.1 | 0.82 (0.70 to 0.90) | 2.60 (16) | 7.21 (45) |
| Orthelligent (cm) Mean ± SD | Force Plate (cm) Mean ± SD | Pearson (r) (95% CI) | Mean Difference (cm) (95% CI) | p Value (t-Test) | |
|---|---|---|---|---|---|
| Mean (3 jumps) | 14.5 ± 4.1 | 10.7 ± 4.1 | 0.96 (0.94 to 0.98) | 3.84 (3.54 to 4.15) | <0.001 |
| Max (3 jumps) | 15.3 ± 4.4 | 11.4 ± 4.3 | 0.94 (0.90 to 0.97) | 3.91 (3.48 to 4.33) | <0.001 |
Disclaimer/Publisher’s Note: The statements, opinions and data contained in all publications are solely those of the individual author(s) and contributor(s) and not of MDPI and/or the editor(s). MDPI and/or the editor(s) disclaim responsibility for any injury to people or property resulting from any ideas, methods, instructions or products referred to in the content. |
© 2024 by the authors. Licensee MDPI, Basel, Switzerland. This article is an open access article distributed under the terms and conditions of the Creative Commons Attribution (CC BY) license (https://creativecommons.org/licenses/by/4.0/).
Share and Cite
Pasquale, C.; Baschung Pfister, P.; Kuhn, M.; Stöggl, T. Validity and Reliability of the Orthelligent Pro Sensor for Measuring Single-Leg Vertical Jump Height in Healthy Athletic Adults. Sensors 2024, 24, 3699. https://doi.org/10.3390/s24123699
Pasquale C, Baschung Pfister P, Kuhn M, Stöggl T. Validity and Reliability of the Orthelligent Pro Sensor for Measuring Single-Leg Vertical Jump Height in Healthy Athletic Adults. Sensors. 2024; 24(12):3699. https://doi.org/10.3390/s24123699
Chicago/Turabian StylePasquale, Caterina, Pierrette Baschung Pfister, Manuel Kuhn, and Thomas Stöggl. 2024. "Validity and Reliability of the Orthelligent Pro Sensor for Measuring Single-Leg Vertical Jump Height in Healthy Athletic Adults" Sensors 24, no. 12: 3699. https://doi.org/10.3390/s24123699