
Synchronous Fluorescence as a Sensor of Trace Amounts of Polycyclic Aromatic Hydrocarbons

Abstract
:
1. Introduction
2. Materials and Methods
2.1. Materials
2.2. Methods
3. Results and Discussion
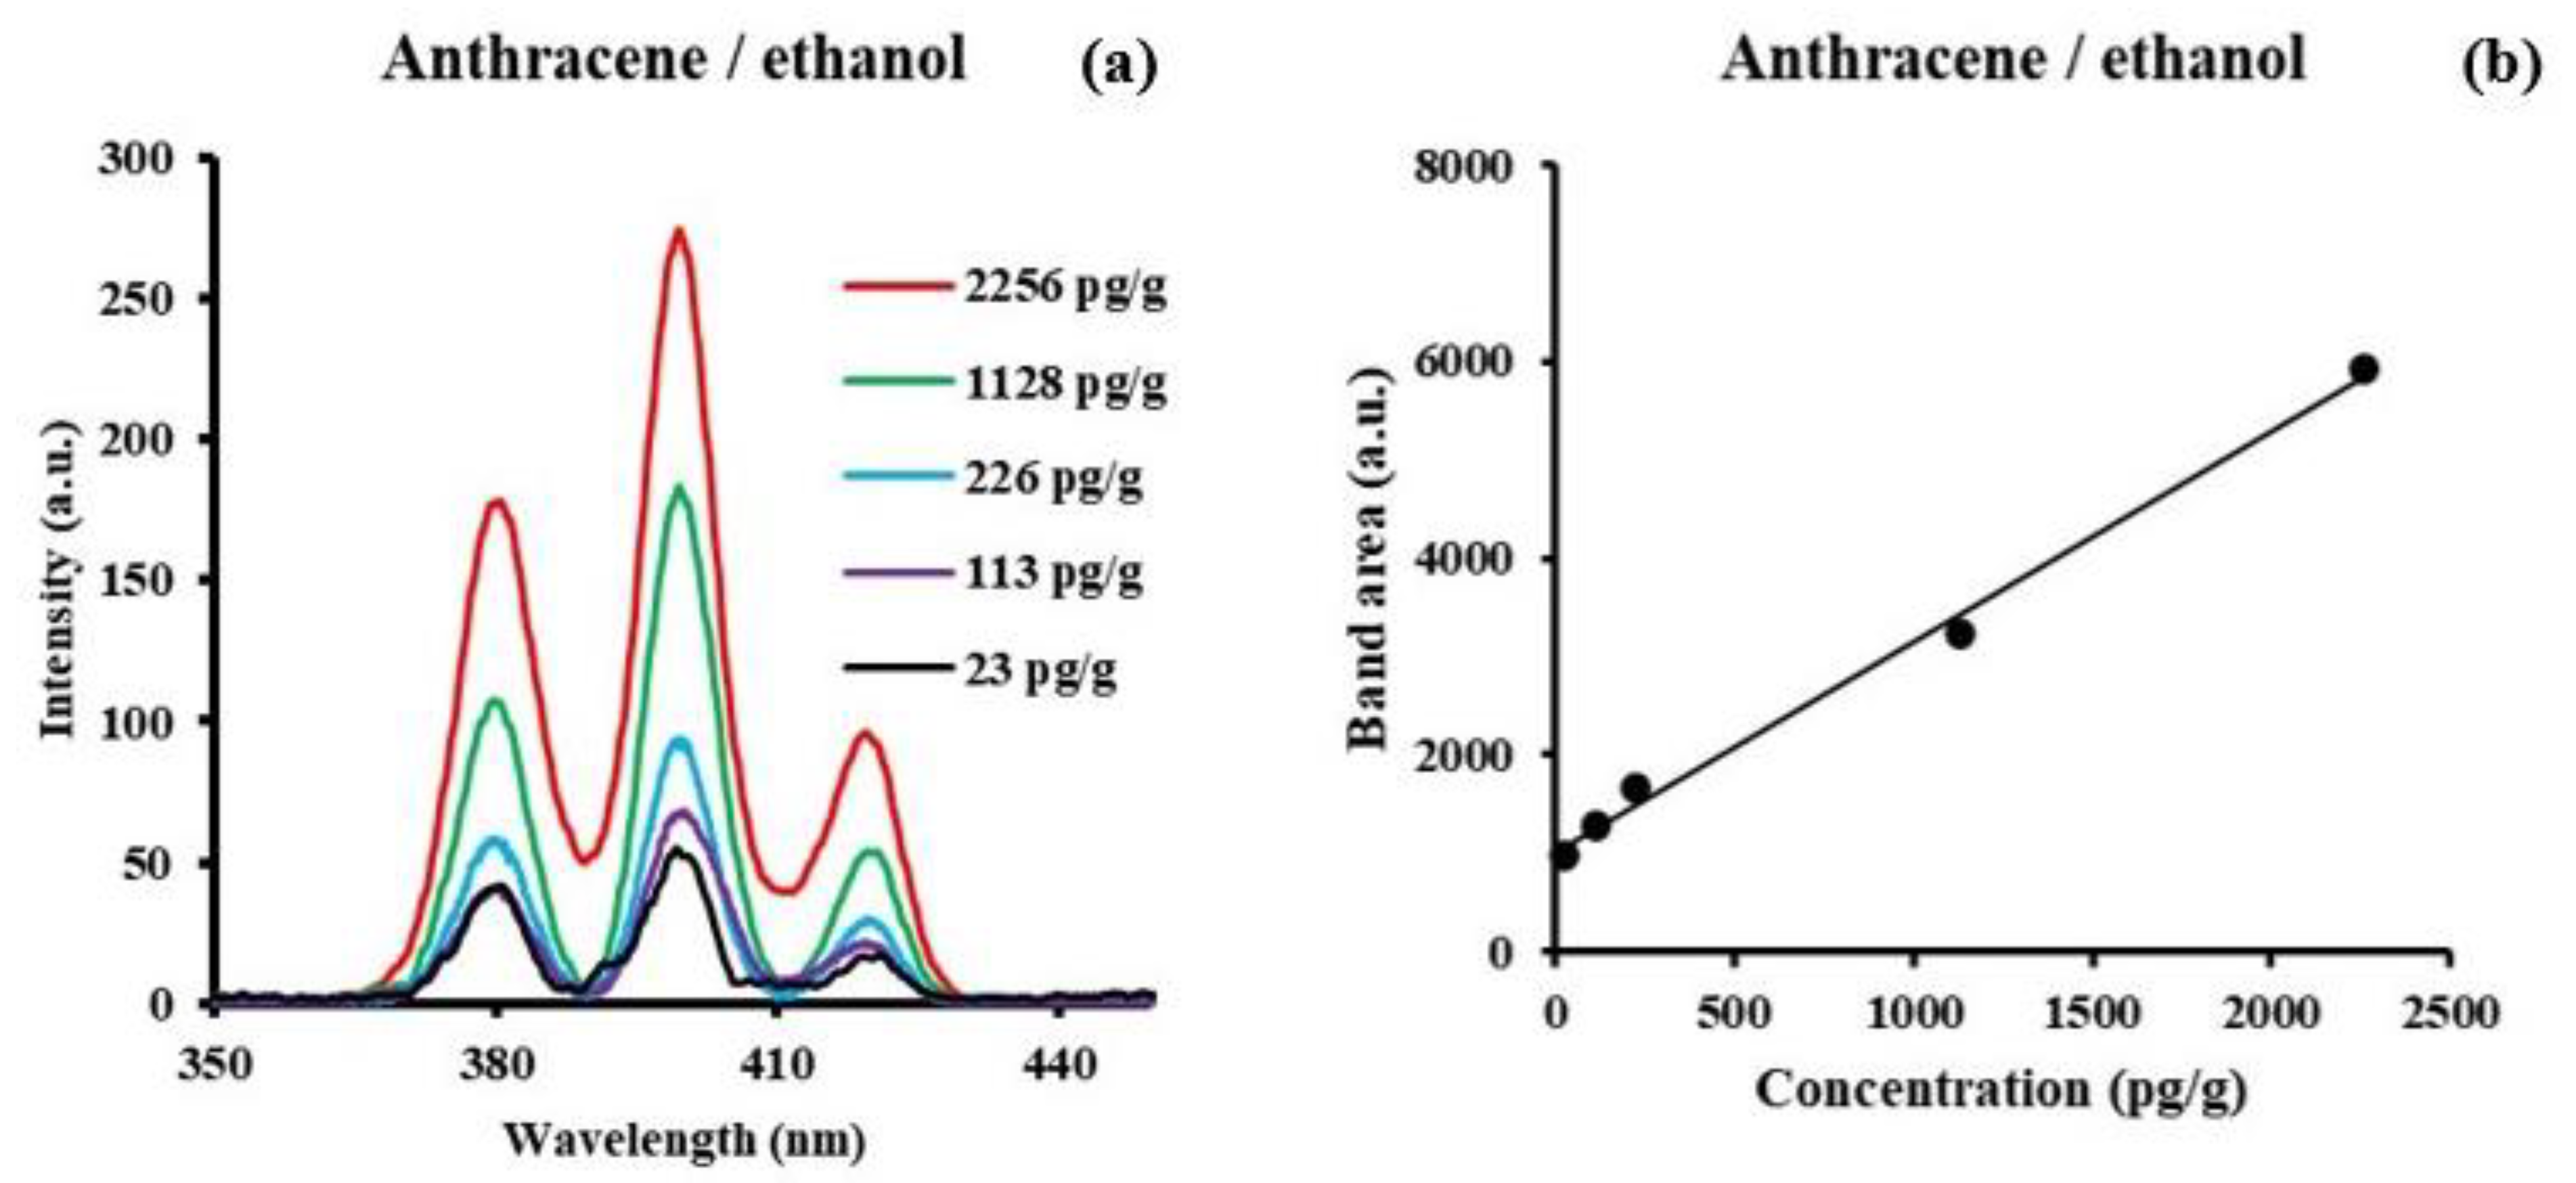
3.1. Anthracene
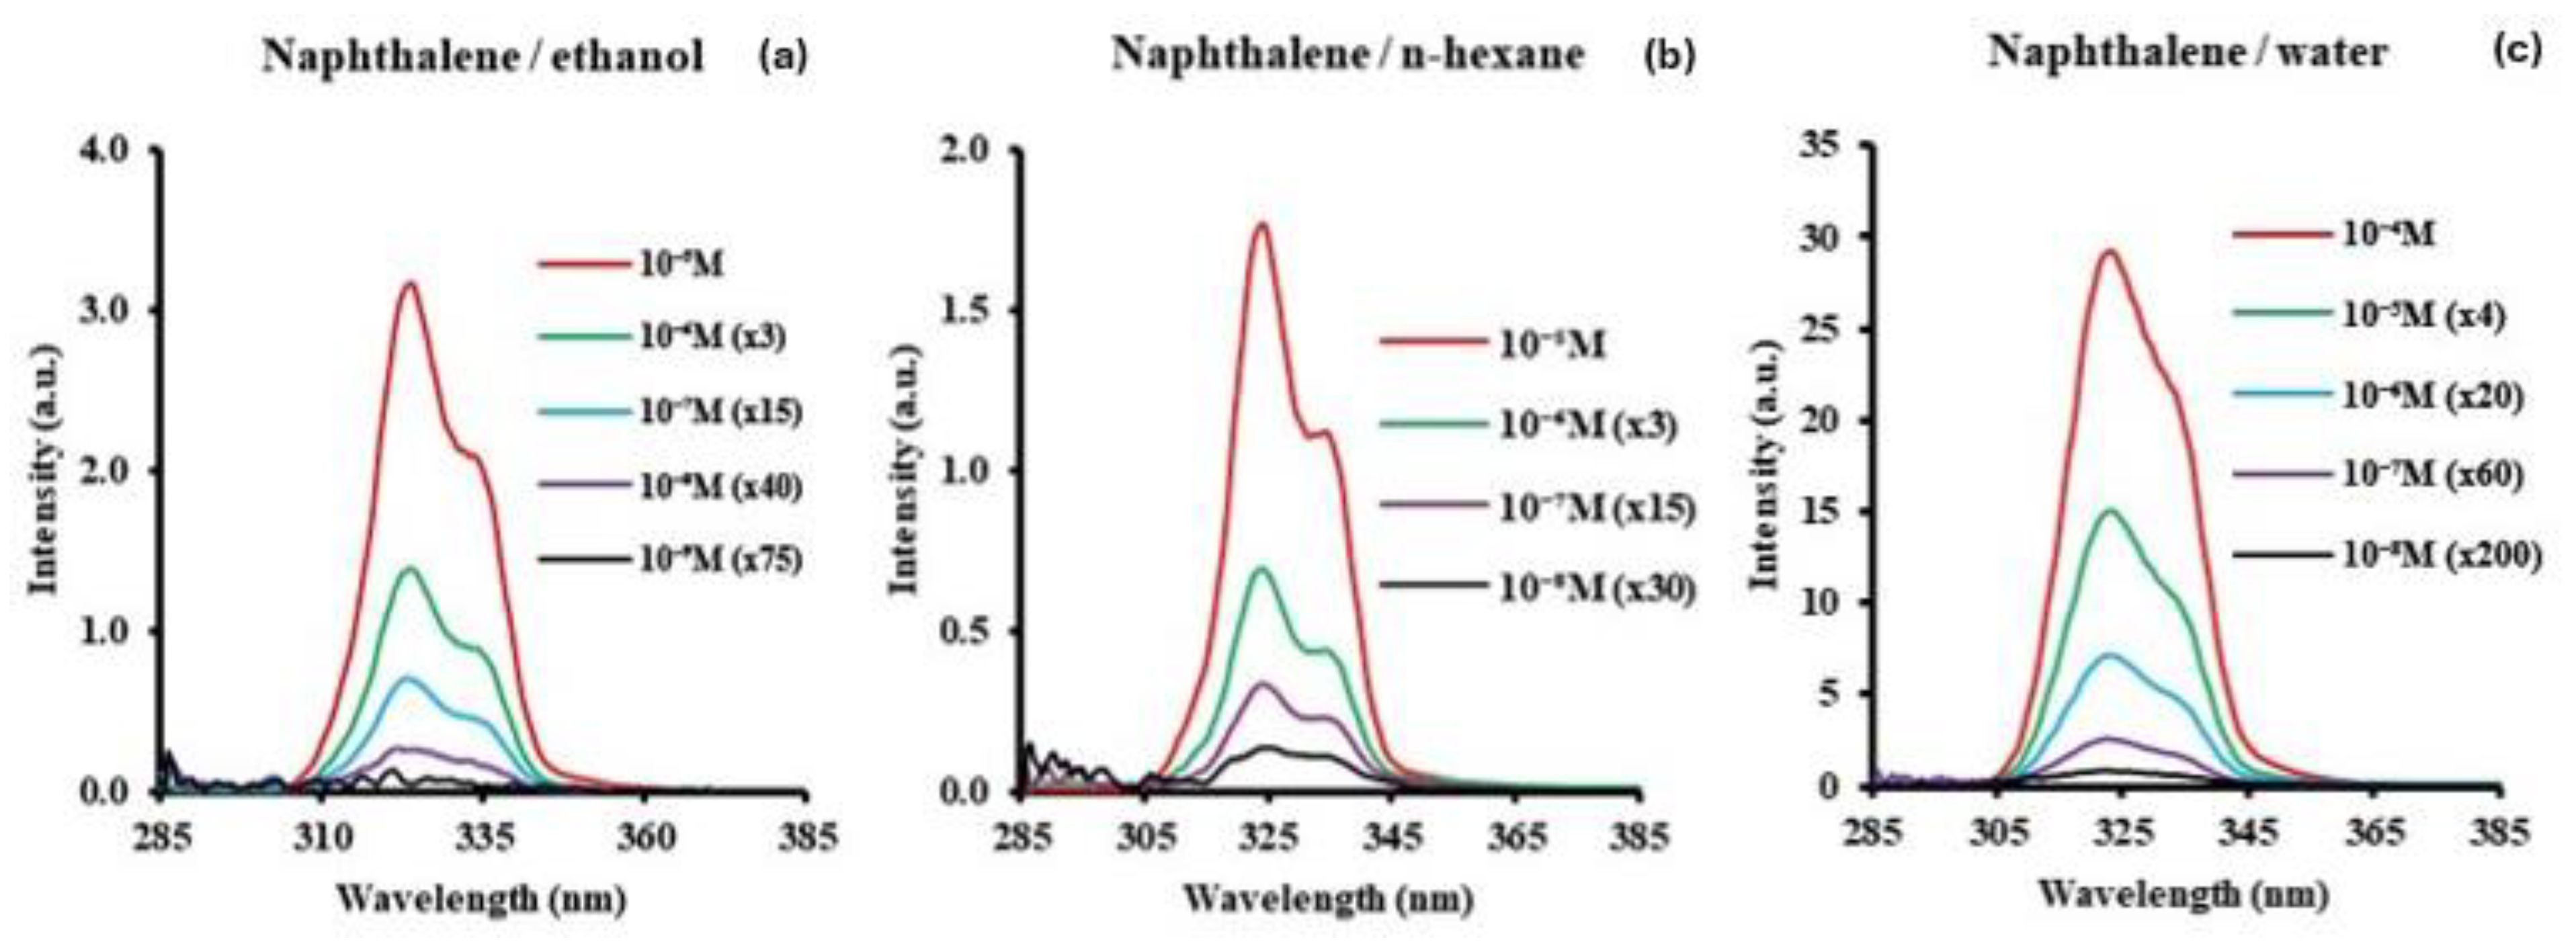
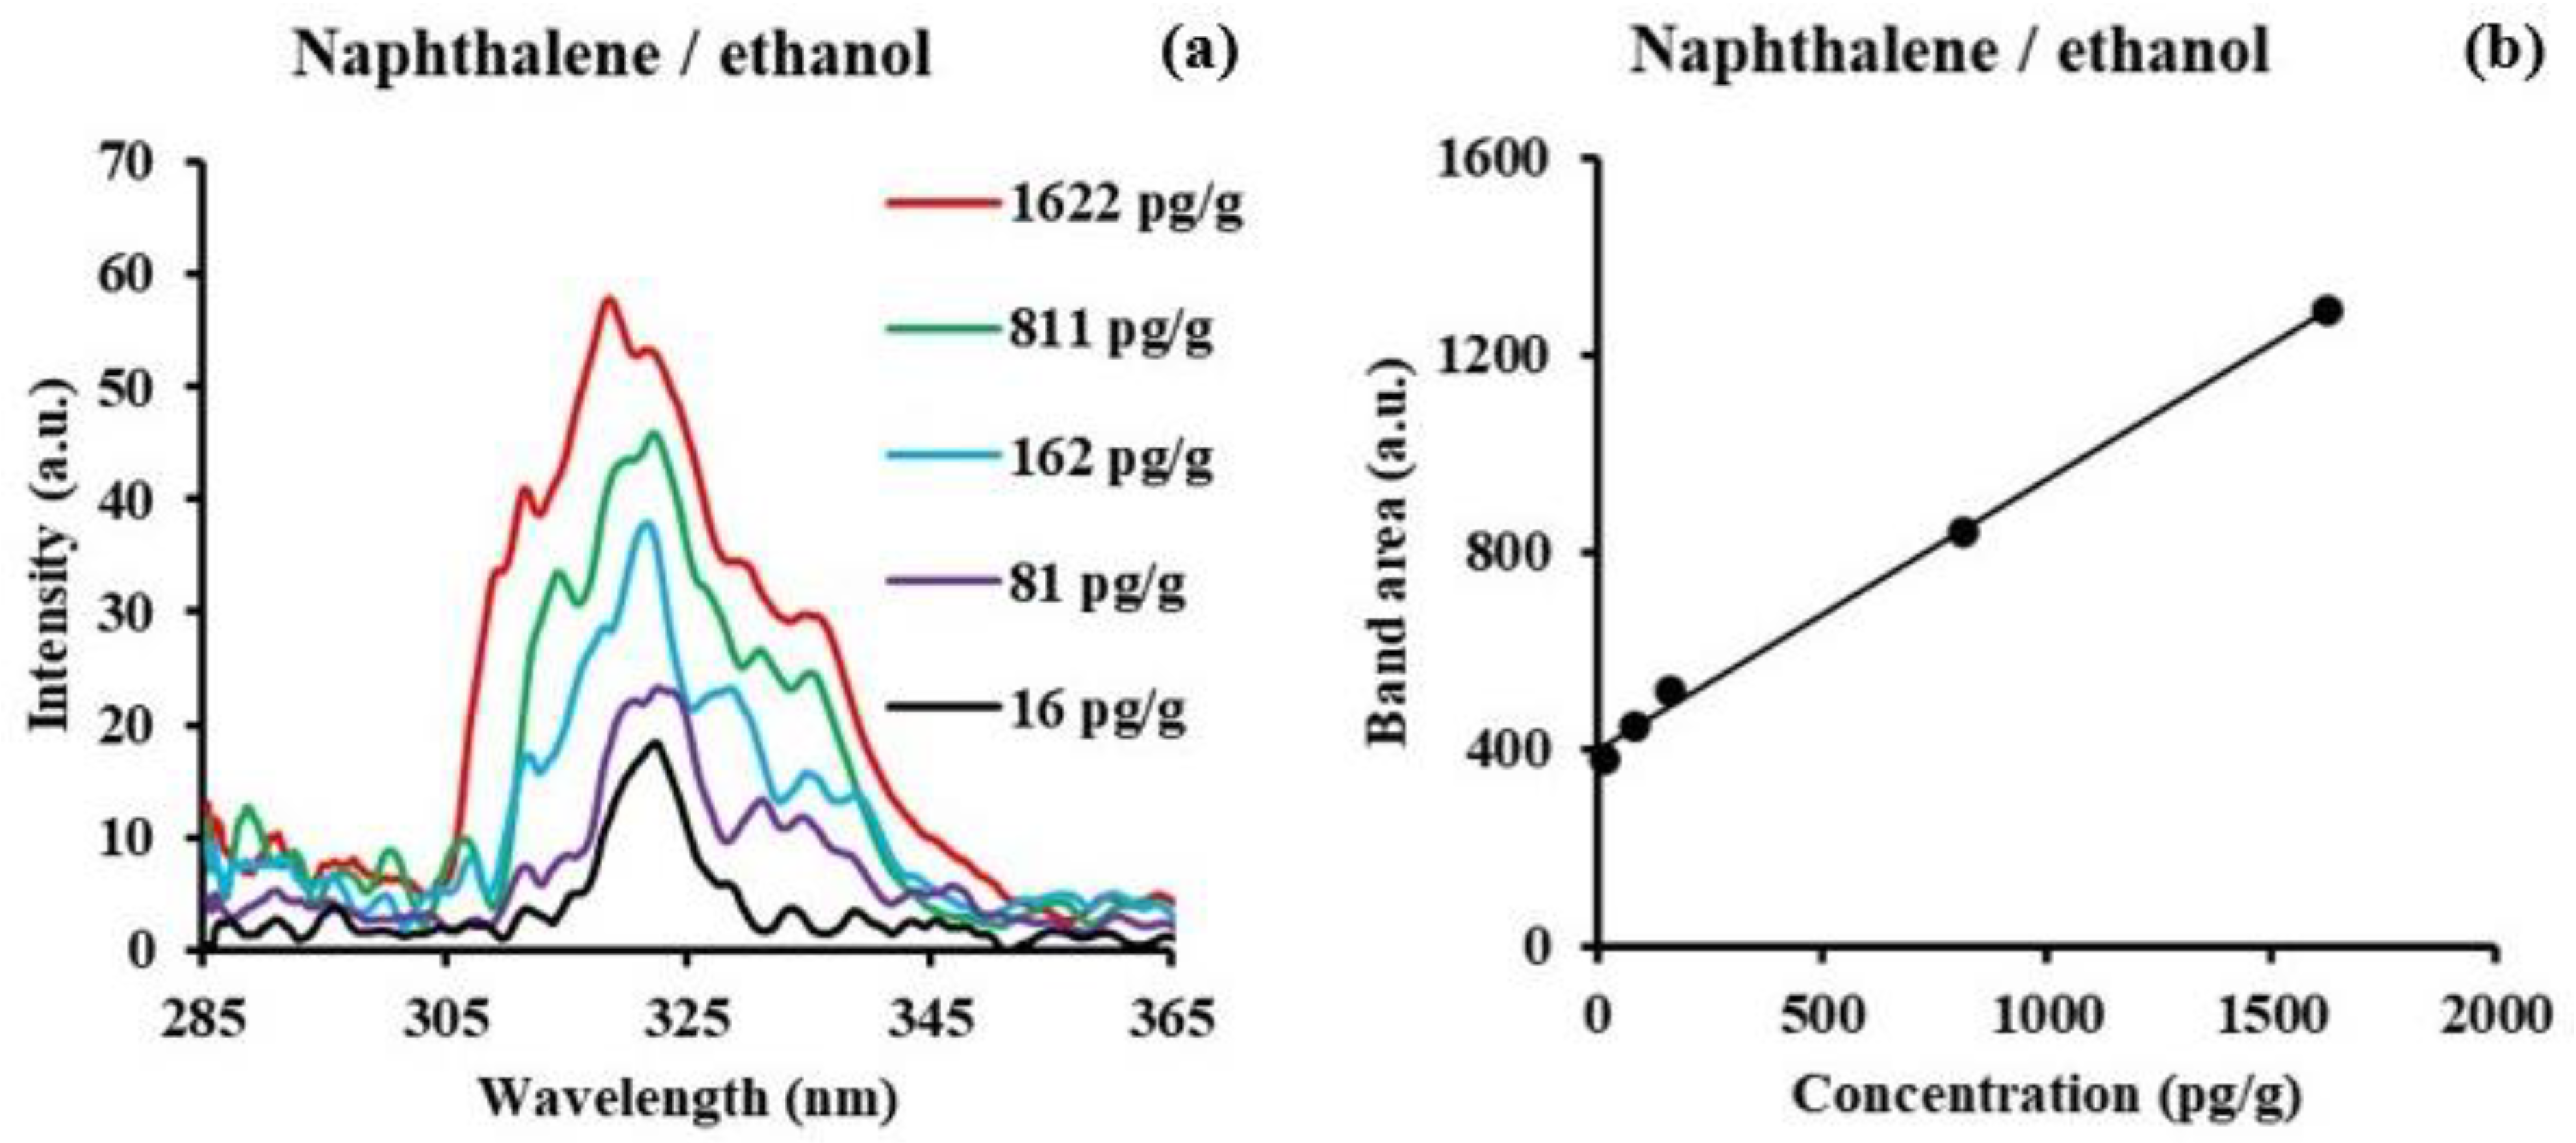
3.2. Naphthalene
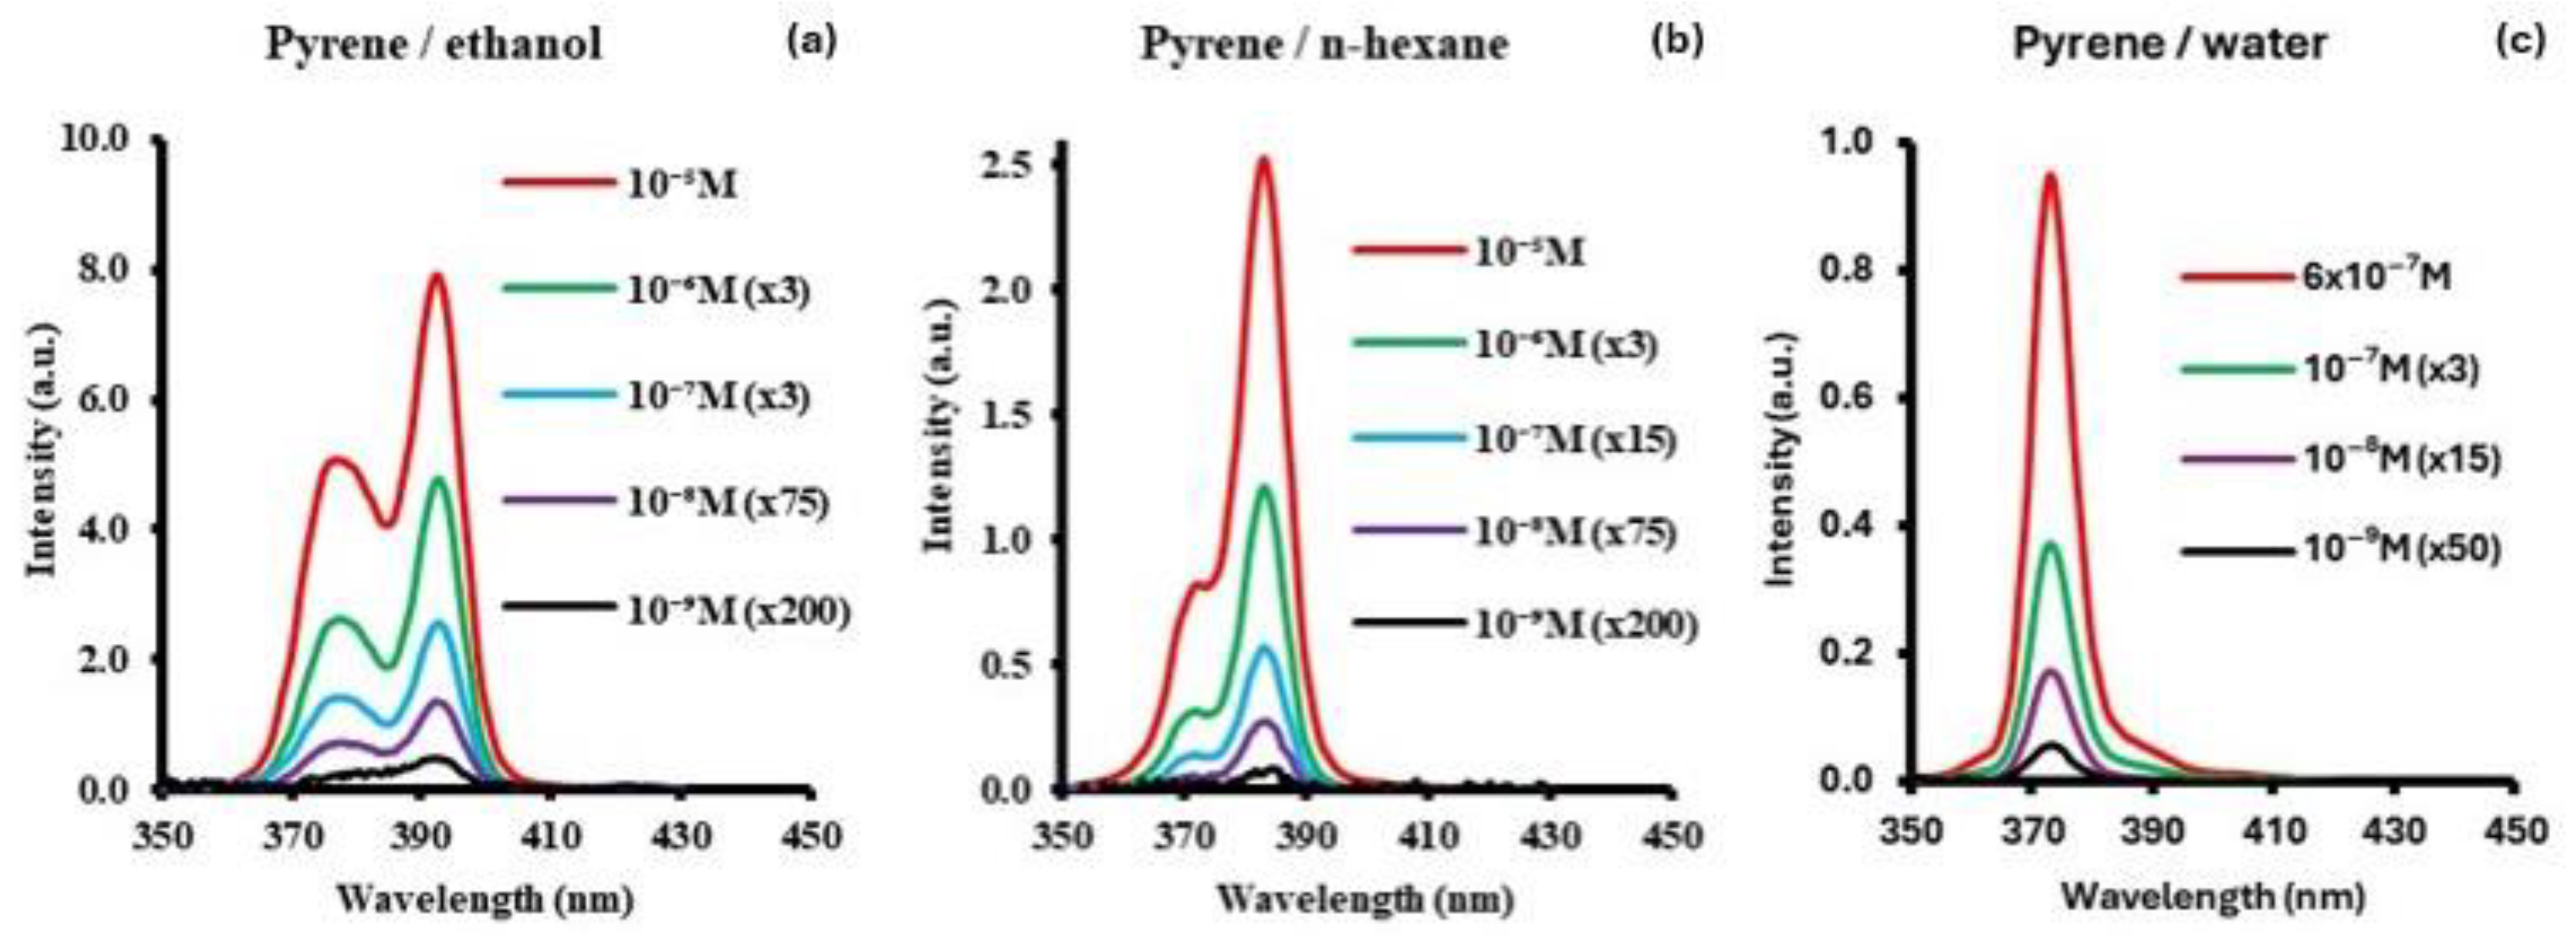
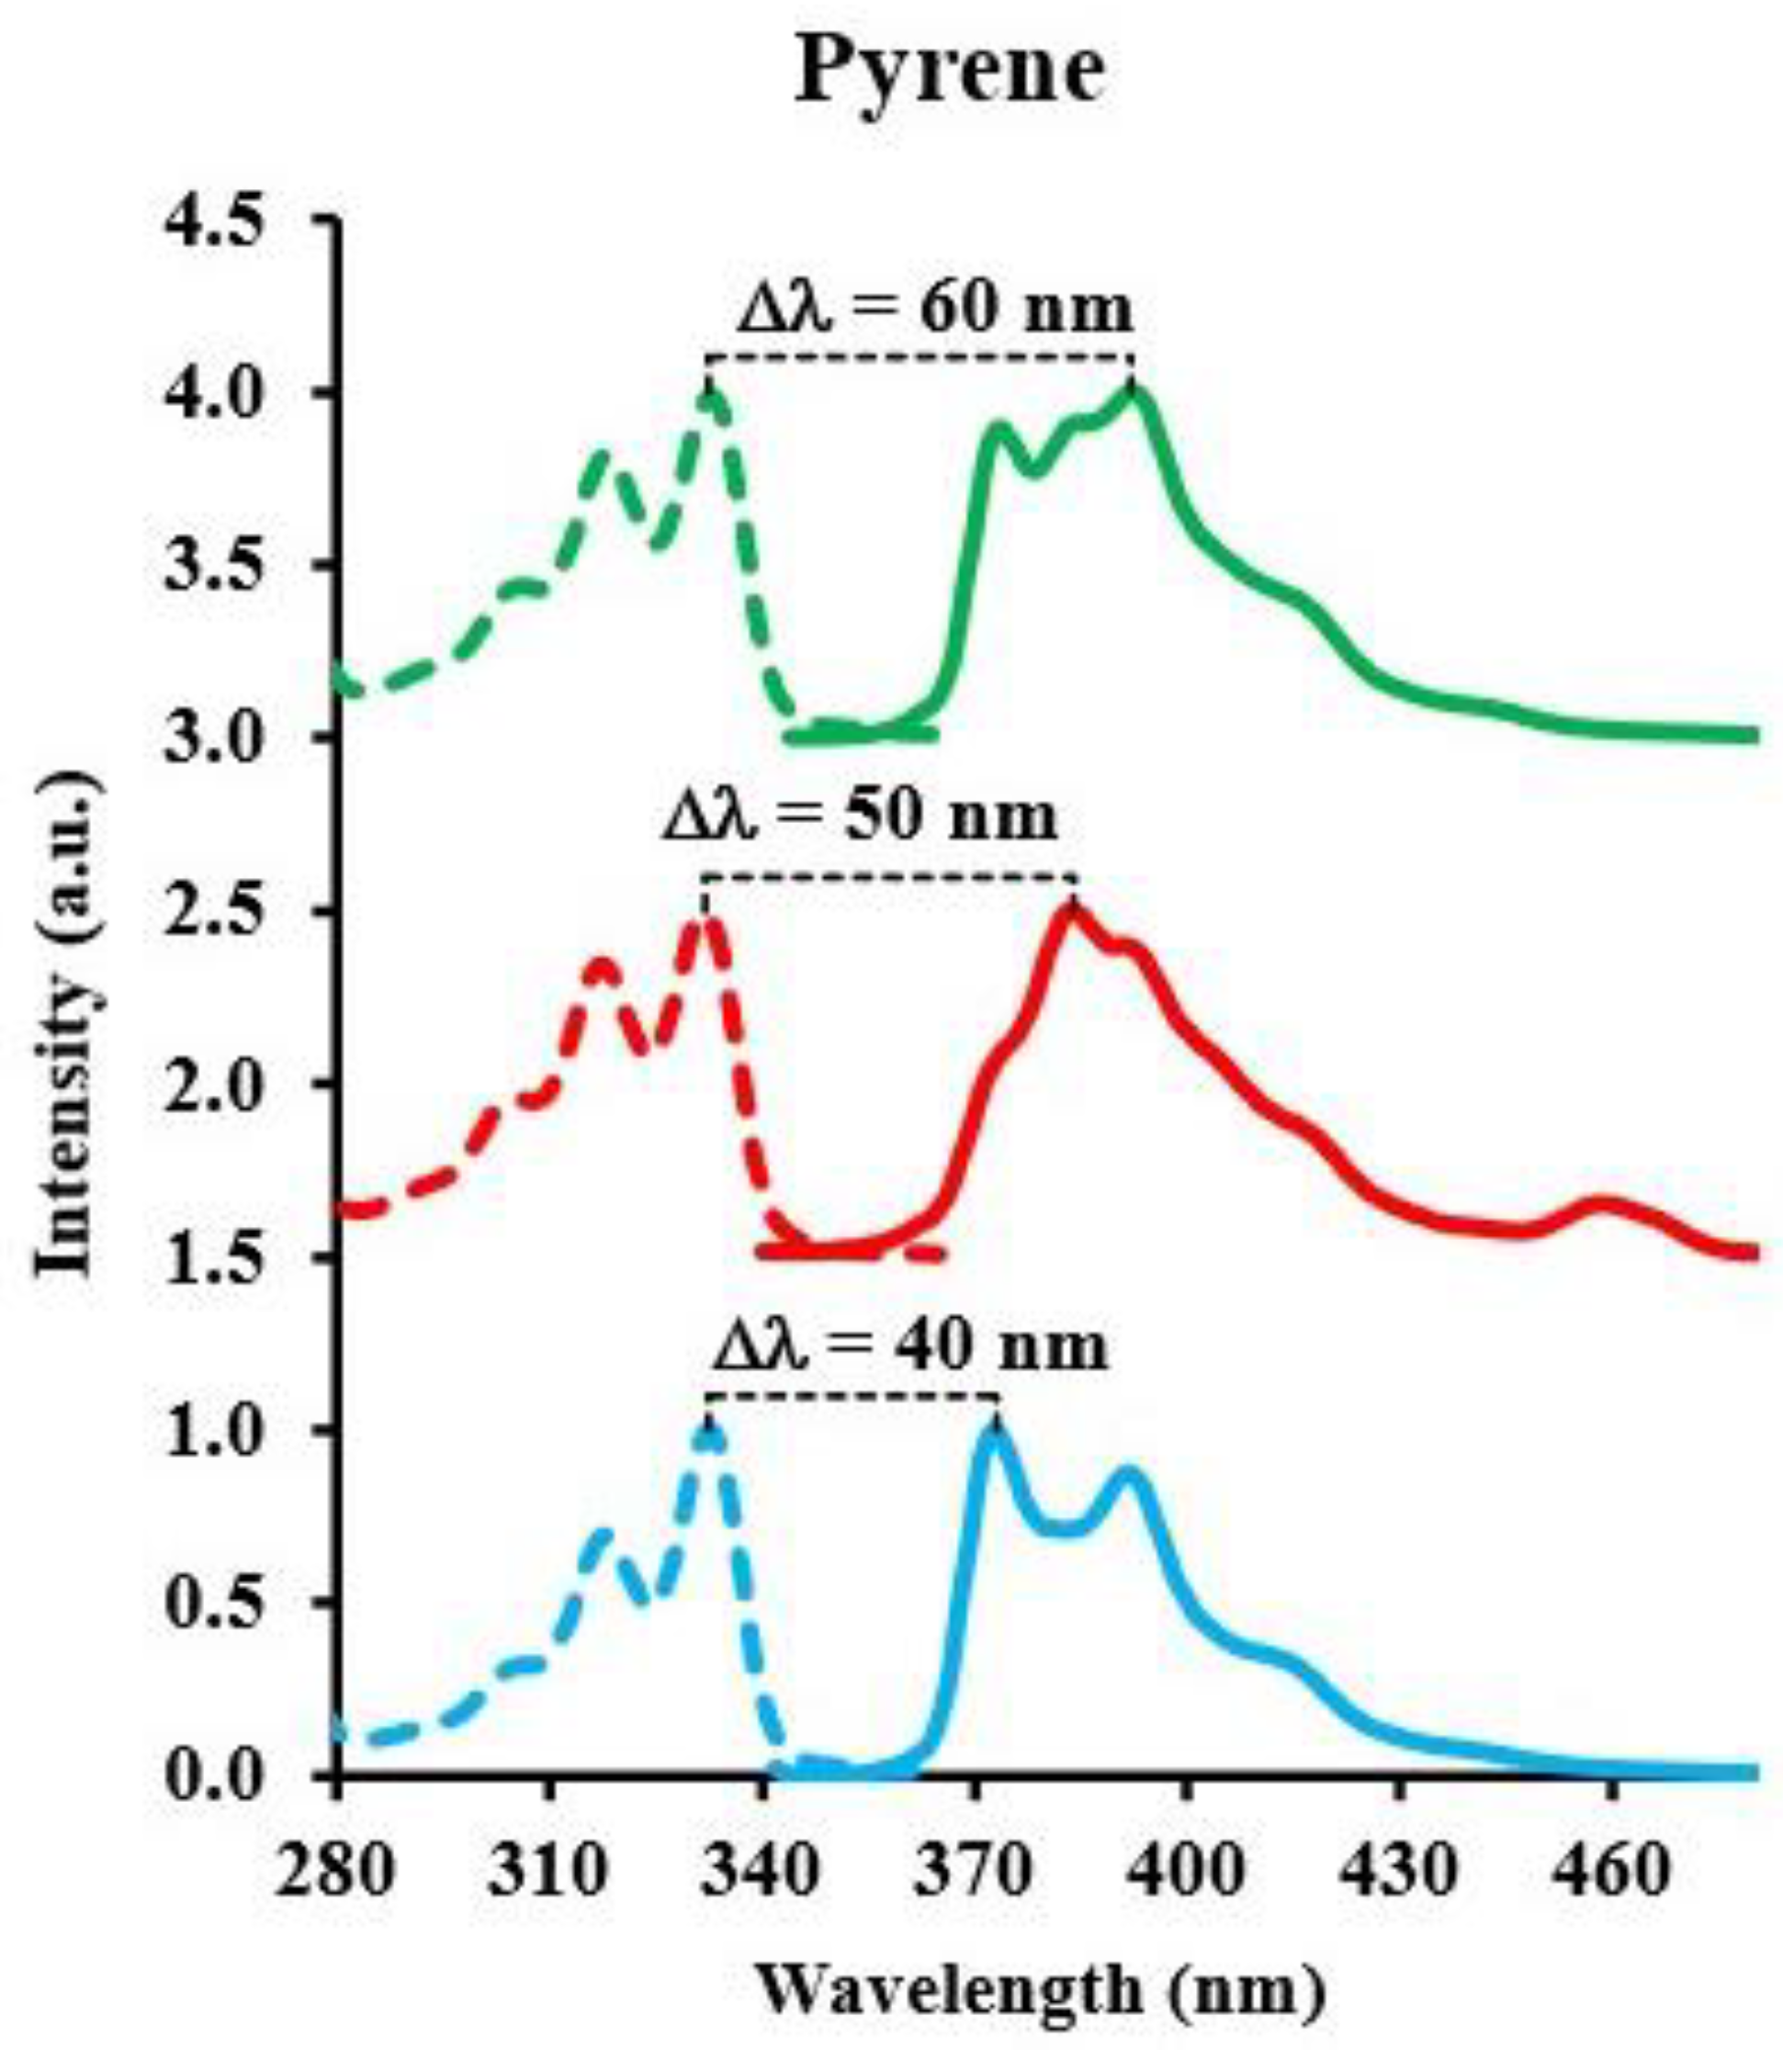
3.3. Pyrene
4. Improvements in Synchronous Detection
5. Conclusions
Author Contributions
Funding
Institutional Review Board Statement
Informed Consent Statement
Data Availability Statement
Acknowledgments
Conflicts of Interest
References
- Lloyd, J.B.F.; Evett, I.W. Prediction of Peak Wavelengths and Intensities in Synchronously Excited Fluorescence Emission Spectra. Anal. Chem. 1977, 49, 1710–1715. [Google Scholar] [CrossRef]
- Lloyd, J.B.F. The Nature and Evidential Value of the Luminescence of Automobile Engine Oils and Related Materials: Part II. Aggregate Luminescence. J. Forensic Sci. Soc. 1971, 11, 153–170. [Google Scholar] [CrossRef] [PubMed]
- Sunuwar, S.; Manzanares, C.E. Excitation, Emission, and Synchronous Fluorescence for Astrochemical Applications: Experiments and Computer Simulations of Synchronous Spectra of Polycyclic Aromatic Hydrocarbons and Their Mixtures. Icarus 2021, 370, 114689. [Google Scholar] [CrossRef]
- Lloyd, J.B.F. The Nature and Evidential Value of the Luminescence of Automobile Engine Oils and Related Materials: Part III. Separated Luminescence. J. Forensic Sci. Soc. 1971, 11, 235–253. [Google Scholar] [CrossRef] [PubMed]
- Vo-Dinh, T.; Gammage, R.B.; Hawthorne, A.R.; Thorngate, J.H. Synchronous Spectroscopy for Analysis of Polynuclear Aromatic Compounds. Environ. Sci. Technol. 1978, 12, 1297–1302. [Google Scholar] [CrossRef] [PubMed]
- Salama, F.; Galazutdinov, G.A.; Krełowski, J.; Allamandola, L.J.; Musaev, F.A. Polycyclic Aromatic Hydrocarbons and the Diffuse Interstellar Bands: A Survey. Astrophys. J. 1999, 526, 265–273. [Google Scholar] [CrossRef] [PubMed]
- McCarthy, M.C.; McGuire, B.A. Aromatics and Cyclic Molecules in Molecular Clouds: A New Dimension of Interstellar Organic Chemistry. J. Phys. Chem. A 2021, 125, 3231–3243. [Google Scholar] [CrossRef] [PubMed]
- Allamandola, L.J.; Tielens, A.; Barker, J.R. Interstellar Polycyclic Aromatic Hydrocarbons-The Infrared Emission Bands, the Excitation/Emission Mechanism, and the Astrophysical Implications. Astrophys. J. Suppl. Ser. 1989, 71, 733–775. [Google Scholar] [CrossRef]
- Clemett, S.J.; Maechling, C.R.; Zare, R.N.; Swan, P.D.; Walker, R.M. Identification of Complex Aromatic Molecules in Individual Interplanetary Dust Particles. Science 1993, 262, 721–725. [Google Scholar] [CrossRef]
- Remusat, L.; Robert, F.; Derenne, S. The Insoluble Organic Matter in Carbonaceous Chondrites: Chemical Structure, Isotopic Composition and Origin. Comptes Rendus Geosci. 2007, 339, 895–906. [Google Scholar] [CrossRef]
- López-Puertas, M.; Dinelli, B.M.; Adriani, A.; Funke, B.; García-Comas, M.; Moriconi, M.L.; D’Aversa, E.; Boersma, C.; Allamandola, L.J. Large Abundances of Polycyclic Aromatic Hydrocarbons in Titan’s Upper Atmosphere. Astrophys. J. 2013, 770, 132. [Google Scholar] [CrossRef]
- Lebonnois, S. Benzene and Aerosol Production in Titan and Jupiter’s Atmospheres: A Sensitivity Study. Planet. Space Sci. 2005, 53, 486–497. [Google Scholar] [CrossRef]
- Millan, M.; Szopa, C.; Buch, A.; Coll, P.; Glavin, D.P.; Freissinet, C.; Navarro-Gonzalez, R.; François, P.; Coscia, D.; Bonnet, J.Y.; et al. In Situ Analysis of Martian Regolith with the SAM Experiment during the First Mars Year of the MSL Mission: Identification of Organic Molecules by Gas Chromatography from Laboratory Measurements. Planet. Space Sci. 2016, 129, 88–102. [Google Scholar] [CrossRef]
- Freissinet, C.; Glavin, D.P.; Mahaffy, P.R.; Miller, K.E.; Eigenbrode, J.L.; Summons, R.E.; Brunner, A.E.; Buch, A.; Szopa, C.; Archer, P.D.; et al. Organic Molecules in the Sheepbed Mudstone, Gale Crater, Mars: Detection of Organics in Martian Sample. J. Geophys. Res. Planets 2015, 120, 495–514. [Google Scholar] [CrossRef] [PubMed]
- Biemann, K.; Oro, J.; Toulmin, P., III; Orgel, L.E.; Nier, A.O.; Anderson, D.M.; Simmonds, P.G.; Flory, D.; Diaz, A.V.; Rushneck, D.R. Search for Organic and Volatile Inorganic Compounds in Two Surface Samples from the Chryse Planitia Region of Mars. Science 1976, 194, 72–76. [Google Scholar] [CrossRef] [PubMed]
- Biemann, K.; Oro, J.; Toulmin III, P.; Orgel, L.E.; Nier, A.O.; Anderson, D.M.; Simmonds, P.G.; Flory, D.; Diaz, A.V.; Rushneck, D.R. The Search for Organic Substances and Inorganic Volatile Compounds in the Surface of Mars. J. Geophys. Res. 1977, 82, 4641–4658. [Google Scholar] [CrossRef]
- Clemett, S.J.; Sandford, S.A.; Nakamura-Messenger, K.; Hoerz, F.; McKay, D.S. Complex Aromatic Hydrocarbons in Stardust Samples Collected from Comet 81P/Wild 2. Meteorit. Planet. Sci. 2010, 45, 701–722. [Google Scholar] [CrossRef]
- Becker, L.; Glavin, D.P.; Bada, J.L. Polycyclic Aromatic Hydrocarbons (PAHs) in Antarctic Martian Meteorites, Carbonaceous Chondrites, and Polar Ice. Geochim. Cosmochim. Acta 1997, 61, 475–481. [Google Scholar] [CrossRef] [PubMed]
- Basile, B.P.; Middleditch, B.S.; Oró, J. Polycyclic Aromatic Hydrocarbons in the Murchison Meteorite. Org. Geochem. 1984, 5, 211–216. [Google Scholar] [CrossRef]
- Stephan, T.; Jessberger, E.K.; Heiss, C.H.; Rost, D. TOF-SIMS Analysis of Polycyclic Aromatic Hydrocarbons in Allan Hills 84001. Meteorit. Planet. Sci. 2003, 38, 109–116. [Google Scholar] [CrossRef]
- Aponte, J.C.; Dworkin, J.P.; Glavin, D.P.; Elsila, J.E.; Parker, E.T.; McLain, H.L.; Naraoka, H.; Okazaki, R.; Takano, Y.; Tachibana, S.; et al. PAHs, Hydrocarbons, and Dimethylsulfides in Asteroid Ryugu Samples A0106 and C0107 and the Orgueil (CI1) Meteorite. Earth Planets Space 2023, 75, 28. [Google Scholar] [CrossRef]
- Hollis, J.R. A Deep-Ultraviolet Raman and Fluorescence Spectral Library of 62 Minerals for the SHERLOC Instrument Onboard Mars 2020. Planet. Space Sci. 2021, 20, 105356. [Google Scholar] [CrossRef]
- Bhartia, R.; Beegle, L.W.; DeFlores, L.; Abbey, W.; Hollis, J.R.; Uckert, K.; Monacelli, B.; Edgett, K.S.; Kennedy, M.R.; Sylvia, M.; et al. SHERLOC: Scanning habitable environments with raman & luminescence for organics & chemicals. In Proceedings of the 2015 IEEE Aerospace Conference, Big Sky, MT, USA, 7 March 2015; pp. 1–11. [Google Scholar] [CrossRef]
- Kaiser, R.I.; Hansen, N. An Aromatic Universe—A Physical Chemistry Perspective. J. Phys. Chem. A 2021, 125, 3826–3840. [Google Scholar] [CrossRef] [PubMed]
- Clairemidi, J.; Moreels, G.; Mousis, O.; Bréchignac, P. Identification of Anthracene in Comet 1P/Halley. Astron. Astrophys. 2008, 492, 245–250. [Google Scholar] [CrossRef]
- Mulas, G.; Malloci, G.; Joblin, C.; Toublanc, D. Estimated IR and Phosphorescence Emission Fluxes for Specific Polycyclic Aromatic Hydrocarbons in the Red Rectangle. Astron. Astrophys. 2006, 446, 537–549. [Google Scholar] [CrossRef]
- Krełowski, J.; Galazutdinov, G.A.; Musaev, F.A.; Nirski, J. Identification of the naphthalene cation in space? Mon. Not. R. Astron. Soc. 2001, 328, 810–814. [Google Scholar] [CrossRef]
- Clairemidi, J.; Bréchignac, P.; Moreels, G.; Pautet, D. Tentative Identification of Pyrene as a Polycyclic Aromatic Molecule in UV Spectra of Comet P/Halley: An Emission from 368 to 384 nm. Planet. Space Sci. 2004, 52, 761–772. [Google Scholar] [CrossRef]
- Zhen, J.; Chen, T.; Tielens, A.G. Laboratory Photochemistry of Pyrene Clusters: An Efficient Way to Form Large PAHs. Astrophys. J. 2018, 863, 128. [Google Scholar] [CrossRef]
- Davies, J.K.; Roush, T.L.; Cruikshank, D.P.; Bartholomew, M.J.; Geballe, T.R.; Owen, T.; de Bergh, C. The Detection of Water Ice in Comet Hale-Bopp. Icarus 1997, 127, 238–245. [Google Scholar] [CrossRef]
- Simonia, I. Frozen Hydrocarbon Particles of Cometary Halos as Carriers of Unidentified Emissions. J. Astrophys. Astron. 2005, 26, 421–427. [Google Scholar] [CrossRef]
- Simonia, I. On the Possible Luminescence Nature of Unidentified Cometary Emissions. Astrophys. Space Sci. 2007, 312, 27–33. [Google Scholar] [CrossRef]
- Simonia, I.A. On the Nature of Unidentified Cometary Emission Lines. Sol. Syst. Res. 2007, 41, 129–131. [Google Scholar] [CrossRef]
- Biver, N.; Bockelee-Morvan, D.; Moreno, R.; Crovisier, J.; Colom, P.; Dariusz, C.L.; Sandqvist, A.; Boissier, J.; Despois, D.; Milam, S.N. Ethyl alcohol and sugar in comet C/2014 Q2 (Lovejoy). Sci. Adv. 2015, 1, e1500863. [Google Scholar] [CrossRef] [PubMed]
- Jia, X.; Kivelson, M.G.; Kurana, K.; Kurt, W.S. Evidence of a Plume on Europa from Galileo Magnetic and Plasma Wave Signatures. Nat. Astron. 2018, 2, 459–464. [Google Scholar] [CrossRef]
- Hendrix, A.R.; House, C.H. Low Effective Ultraviolet Exposure Ages for Organics at the Surface of Enceladus. Commun. Earth Environ. 2023, 4, 485. [Google Scholar] [CrossRef]
- Arnold, N.S.; Butcher, F.E.G.; Conway, S.J.; Gallagher, C.; Balme, M.R. Surface topographic impact of subglacial water beneath the south polar ice cap of Mars. Nat. Astron. 2022, 6, 1256–1262. [Google Scholar] [CrossRef]
- Mastrogiuseppe, M.; Poggiali, V.; Hayes, A.G.; Lunine, J.I.; Seu, R.; Mitri, G.; Lorenz, R.D. Deep and methane-rich lakes on Titan. Nat. Astron. 2019, 3, 535–542. [Google Scholar] [CrossRef]
- Richardson, J.H.; Ando, M.E. Sub-Part-per-Trillion Detection of Polycyclic Aromatic Hydrocarbons by Laser Induced Molecular Fluorescence. Anal. Chem. 1977, 49, 955–959. [Google Scholar] [CrossRef] [PubMed]
- Schwarz, F.P.; Wasik, S.P. Fluorescence Measurements of Benzene, Naphthalene, Anthracene, Pyrene, Fluoranthene, and Benzo[e]Pyrene in Water. Anal. Chem. 1976, 48, 524–528. [Google Scholar] [CrossRef]
- Mataga, N.; Kaifu, Y.; Koizumi, M. Solvent Effects upon Fluorescence Spectra and the Dipole Moments of Excited Molecules. Bull. Chem. Soc. Jpn. 1956, 29, 465–470. [Google Scholar] [CrossRef]
- Glushko, V.; Thaler, M.S.R.; Karp, C.D. Pyrene Fluorescence Fine Structure as a Polarity Probe of Hydrophobic Regions: Behavior in Model Solvents. Arch. Biochem. Biophys. 1981, 210, 33–34. [Google Scholar] [CrossRef] [PubMed]
- Wise, S.A.; Hilpert, L.R.; Byrd, G.D.; May, W.E. Comparison of liquid chromatography with fluorescence detection and gas chromatography/mass spectrometry for the determination of polycyclic aromatic hydrocarbons in environmental samples. Polycycl. Aromat. Compd. 1990, 1, 81–98. [Google Scholar] [CrossRef]


| Molecule | Solvent | Concent. Range/M | SF Peak (nm) | Δλ/nm | LOD/ng/g | LOQ/ng/g |
|---|---|---|---|---|---|---|
| Anthracene | Ethanol | 10−8–10−10 | 399.4 | 44 | 0.25 | 0.76 |
| Hexane | 10−7–10−9 | 398.0 | 44 | 0.11 | 0.33 | |
| Water | 10−7–10−9 | 402.7 | 44 | 0.29 | 0.88 | |
| Naphthalene | Ethanol | 10−8–10−10 | 324.0 | 50 | 0.14 | 0.42 |
| Hexane | 10−6–10−8 | 324.0 | 50 | 4.42 | 13.39 | |
| Water | 10−6–10−8 | 323.0 | 50 | 3.52 | 10.65 | |
| Pyrene | Ethanol | 10−8–10−10 | 392.5 | 60 | 0.018 | 0.055 |
| Hexane | 10−7–10−9 | 383.0 | 50 | 0.44 | 1.33 | |
| Water | 10−7–10−9 | 373.0 | 40 | 0.54 | 1.62 |
Disclaimer/Publisher’s Note: The statements, opinions and data contained in all publications are solely those of the individual author(s) and contributor(s) and not of MDPI and/or the editor(s). MDPI and/or the editor(s) disclaim responsibility for any injury to people or property resulting from any ideas, methods, instructions or products referred to in the content. |
© 2024 by the authors. Licensee MDPI, Basel, Switzerland. This article is an open access article distributed under the terms and conditions of the Creative Commons Attribution (CC BY) license (https://creativecommons.org/licenses/by/4.0/).
Share and Cite
Sunuwar, S.; Haddad, A.; Acheson, A.; Manzanares, C.E. Synchronous Fluorescence as a Sensor of Trace Amounts of Polycyclic Aromatic Hydrocarbons. Sensors 2024, 24, 3800. https://doi.org/10.3390/s24123800
Sunuwar S, Haddad A, Acheson A, Manzanares CE. Synchronous Fluorescence as a Sensor of Trace Amounts of Polycyclic Aromatic Hydrocarbons. Sensors. 2024; 24(12):3800. https://doi.org/10.3390/s24123800
Chicago/Turabian StyleSunuwar, Suresh, Andrew Haddad, Ashlyn Acheson, and Carlos E. Manzanares. 2024. "Synchronous Fluorescence as a Sensor of Trace Amounts of Polycyclic Aromatic Hydrocarbons" Sensors 24, no. 12: 3800. https://doi.org/10.3390/s24123800