
Optimizing Occupant Comfort in a Room Using the Predictive Control Model as a Thermal Control Strategy †
 ,
,  , , , and
Abstract
:1. Introduction
2. Methods for Calculating the Comfort Index
2.1. Thermal Comfort Indices: FANGER and Van Zuilen Indices
2.1.1. Van Zuilen Model
- Cz—constant considered to have the value −9.2 in the cold period and −10.6 in the warm period;
- ti—indoor temperature [°C];
- tmr—average radiation temperature of the room [°C];
- xi—humidity of indoor air [gr/kg dry air];
- vi—speed of indoor air currents [m/s].
2.1.2. Fanger’s Model
- M—energy metabolism [W/m2]
- W—external activity [W/m2]
- ta—indoor air temperature [°C]
- tr—average radiation temperature [°C]
- var—relative velocity of air in relation to the human body [m/s]
- pa—partial water vapor pressure [Pa]
- lcl—thermal resistance of clothing level [ m2 K/W]
- fcl—the ratio between the clothed body surface area and the exposed body surface area
- hc—convection heat transfer coefficient [W/m2 °C]
- tcl—surface temperature of clothing [°C]
hc = 12.1 × √(var) for 2.38 × (tcl − ta)0.25 < 12.1 × √var
fcl = 1.05 + 0.645 × Icl for Icl > 0.078 m2 × C/W
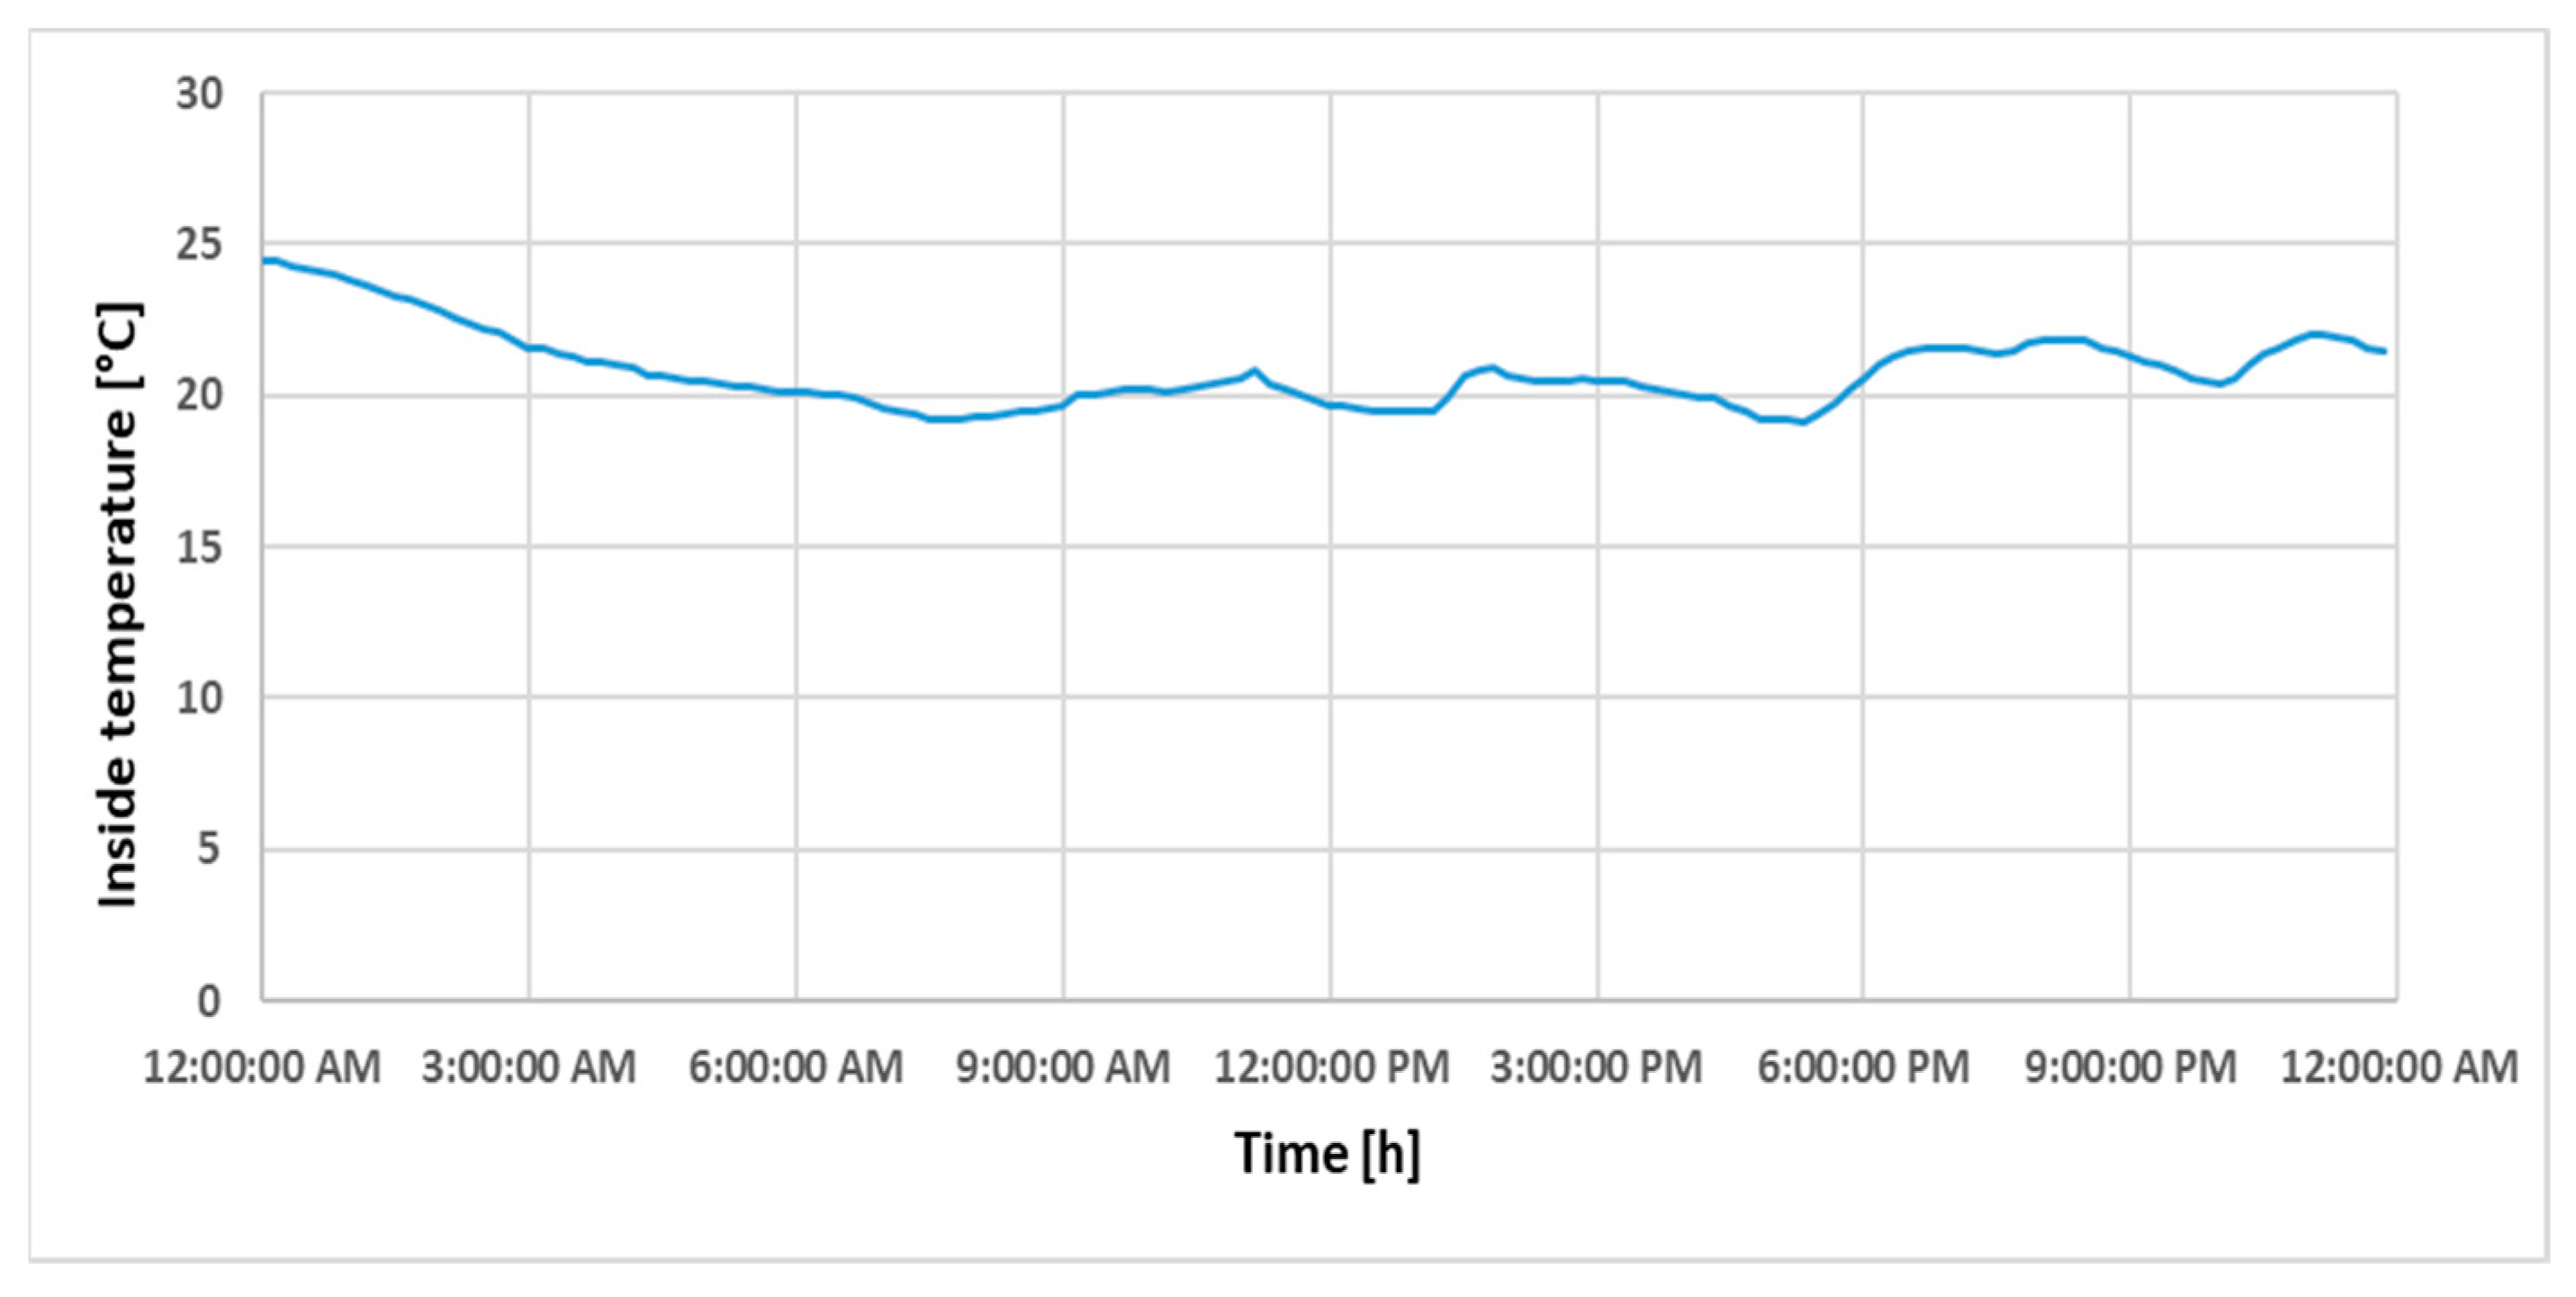
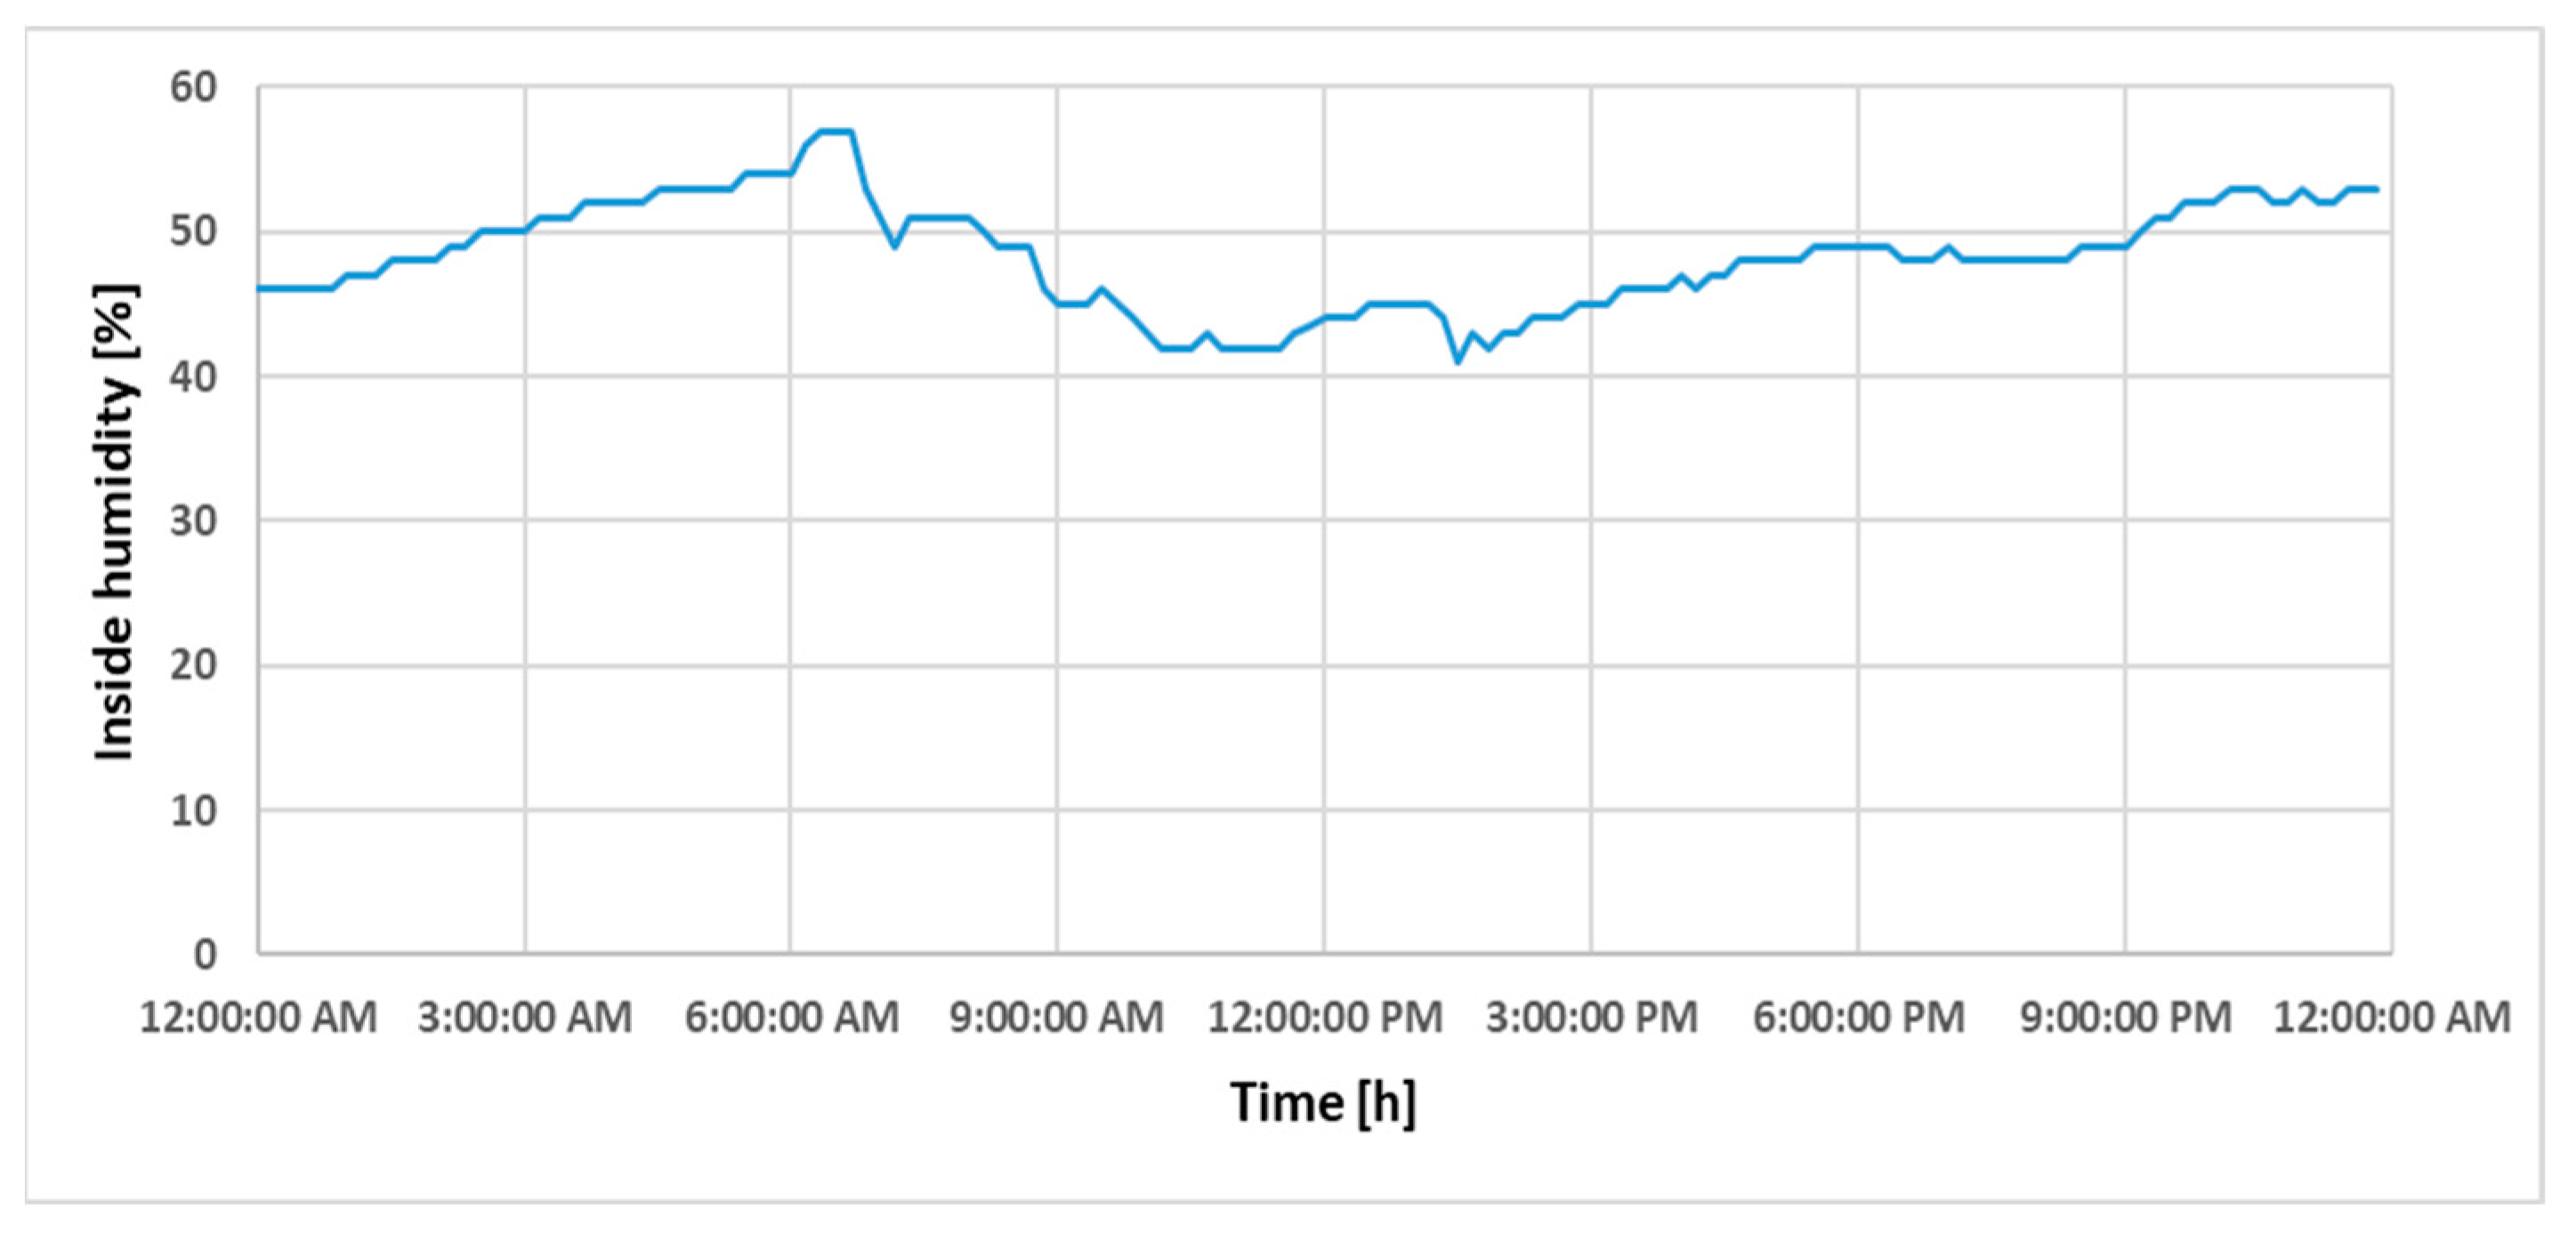
2.2. Data Used
3. Methodology
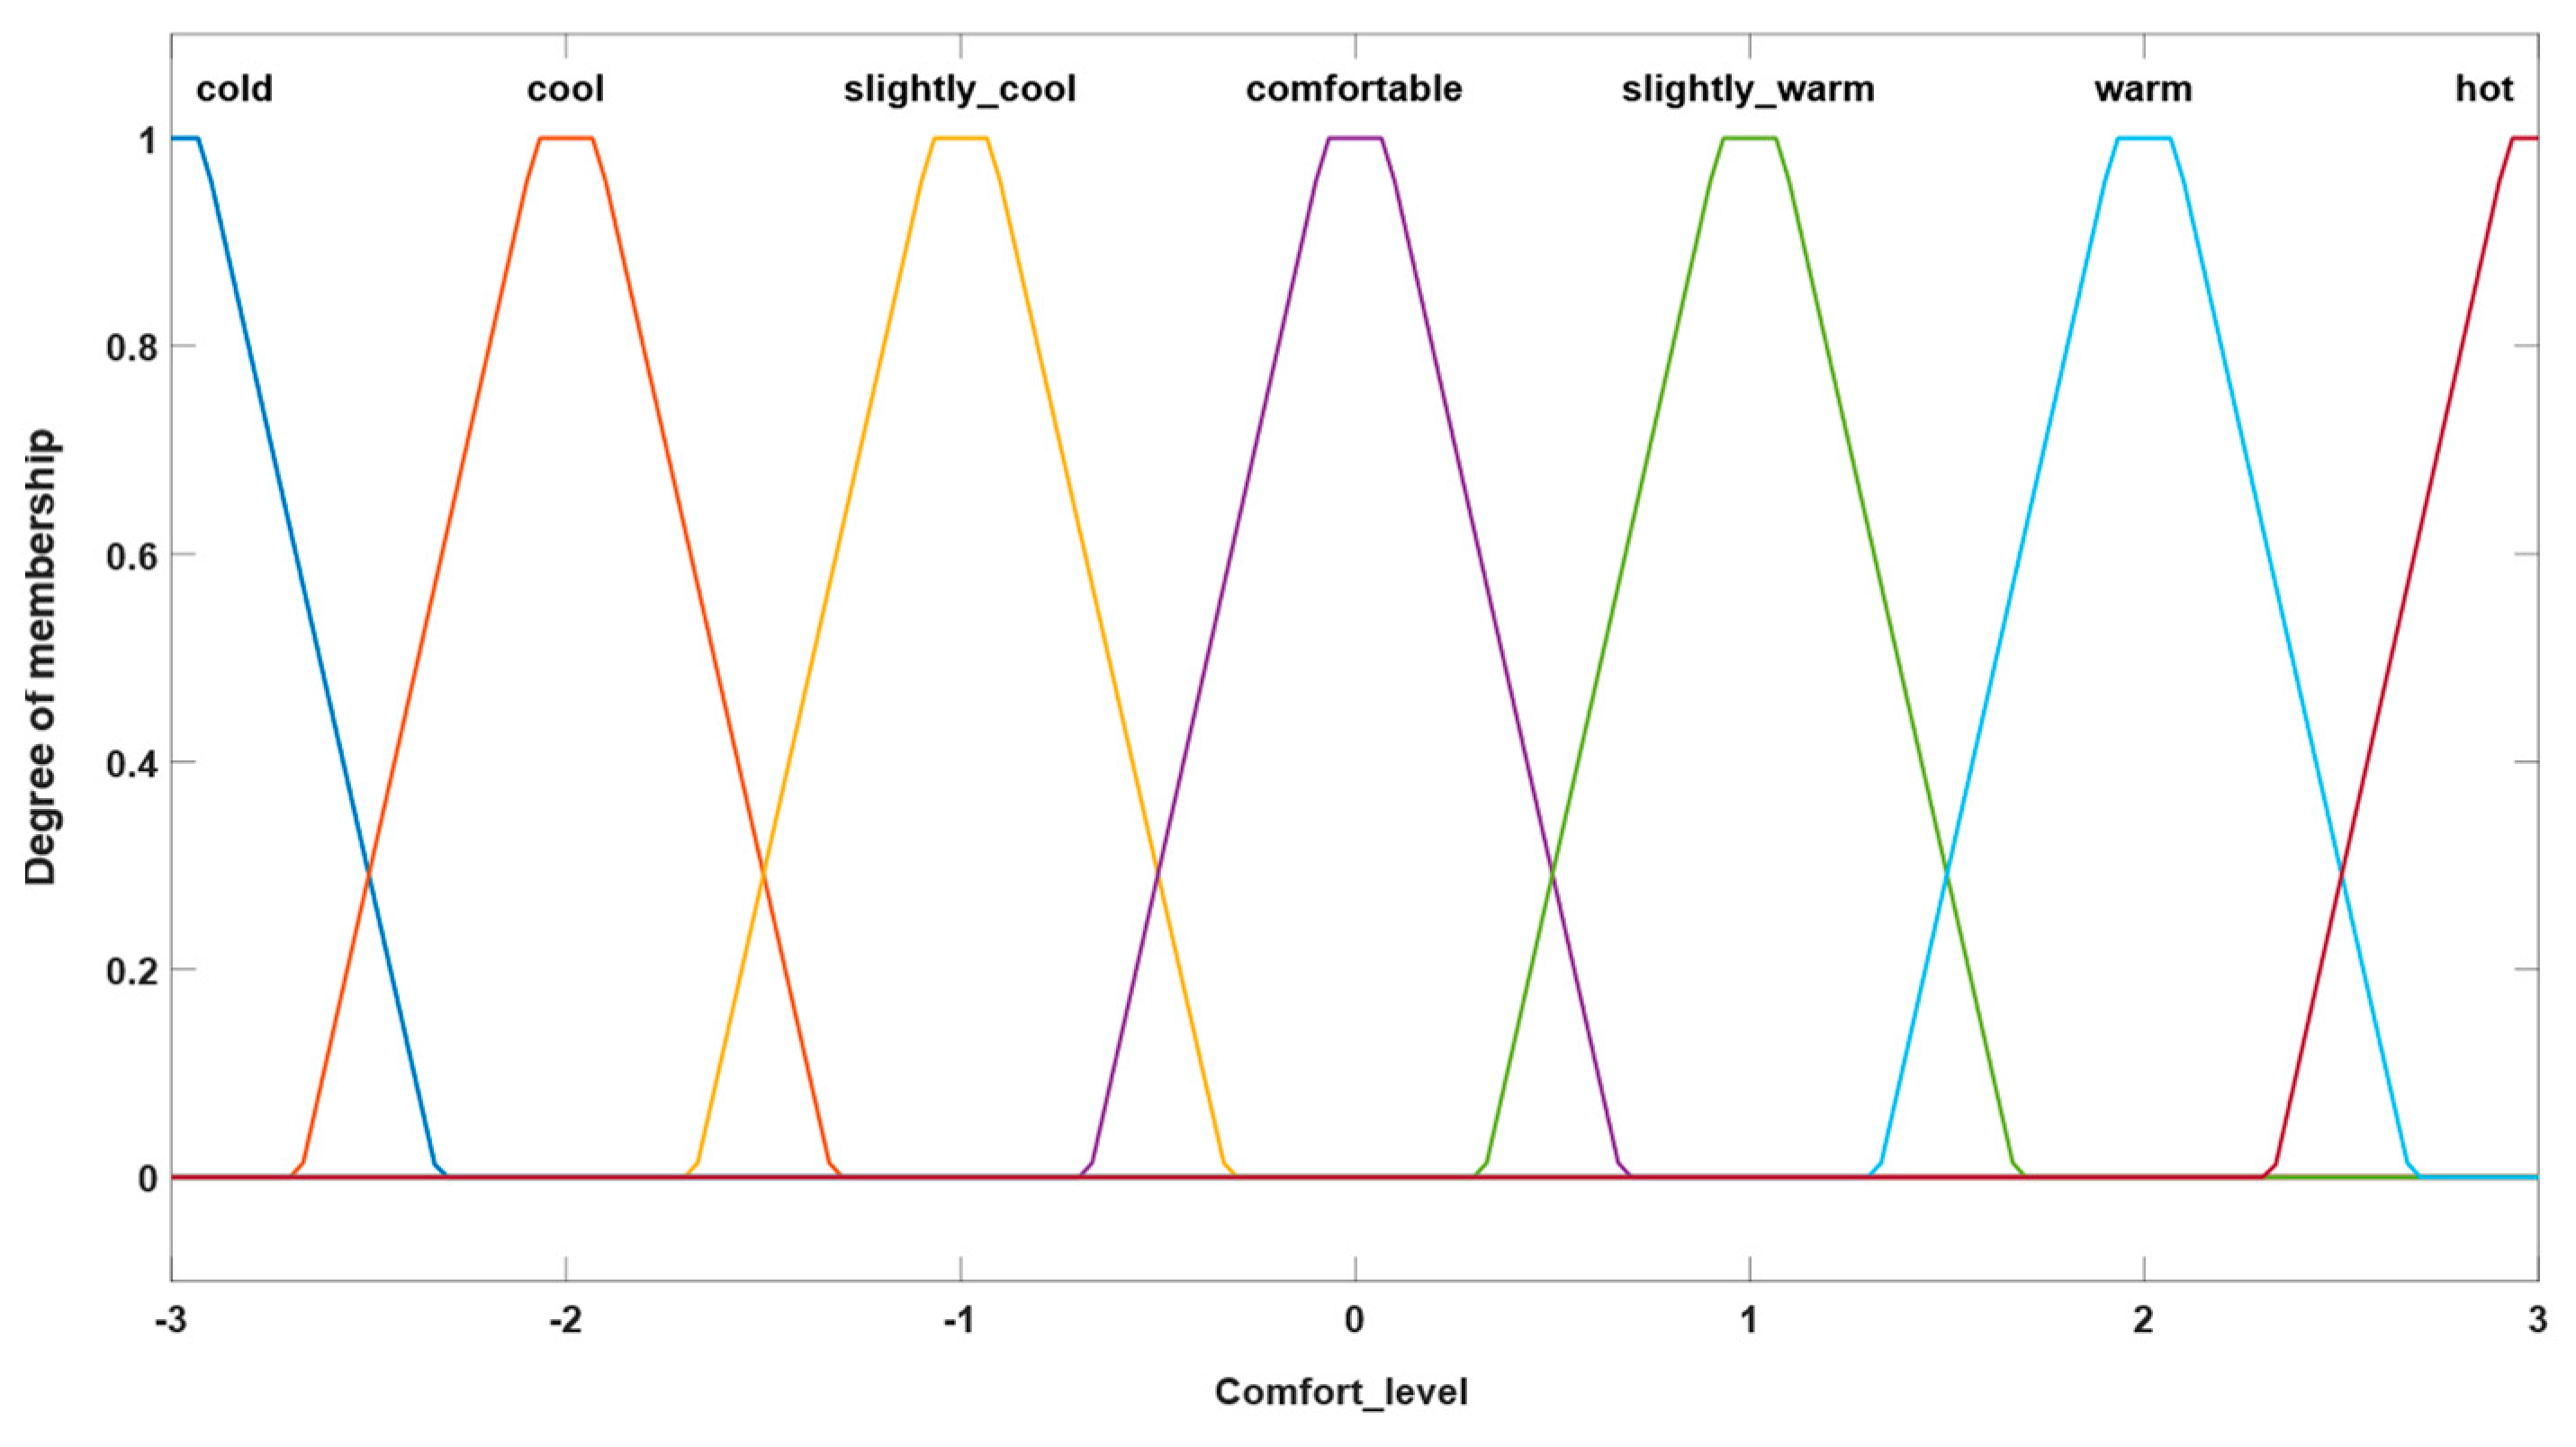
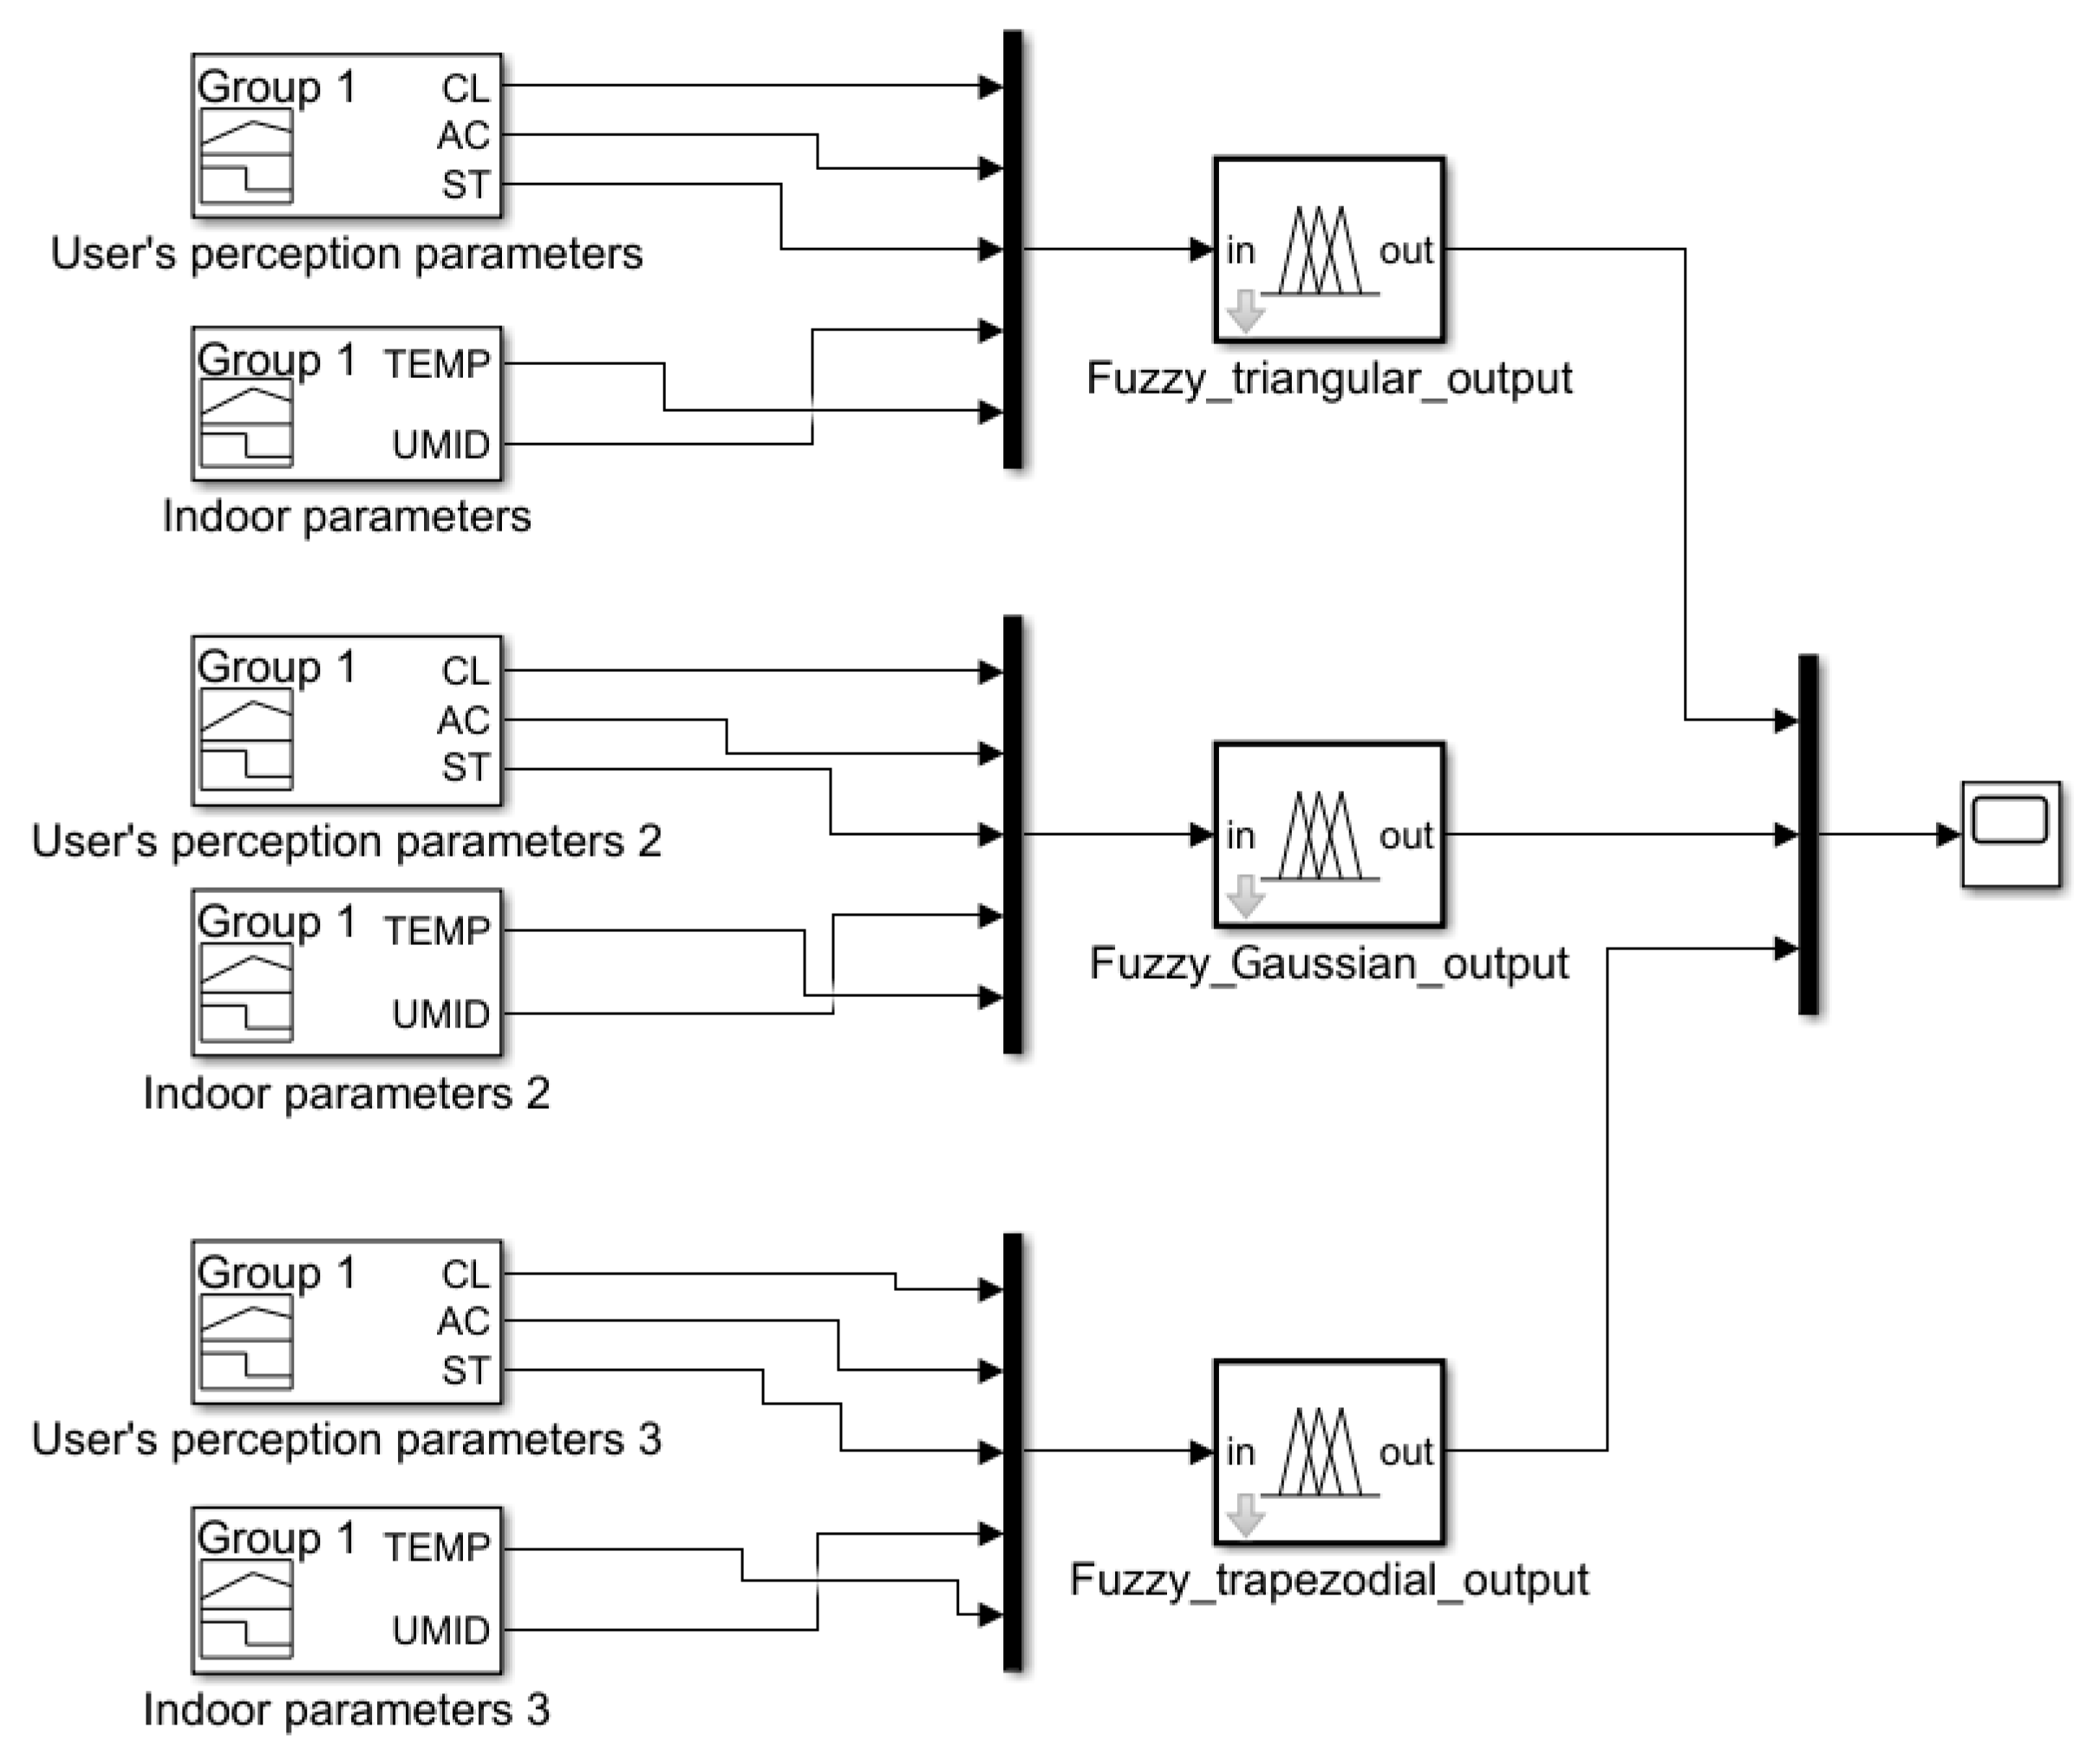
3.1. Fuzzy System Parameterization
3.1.1. Version 1
3.1.2. Version 2
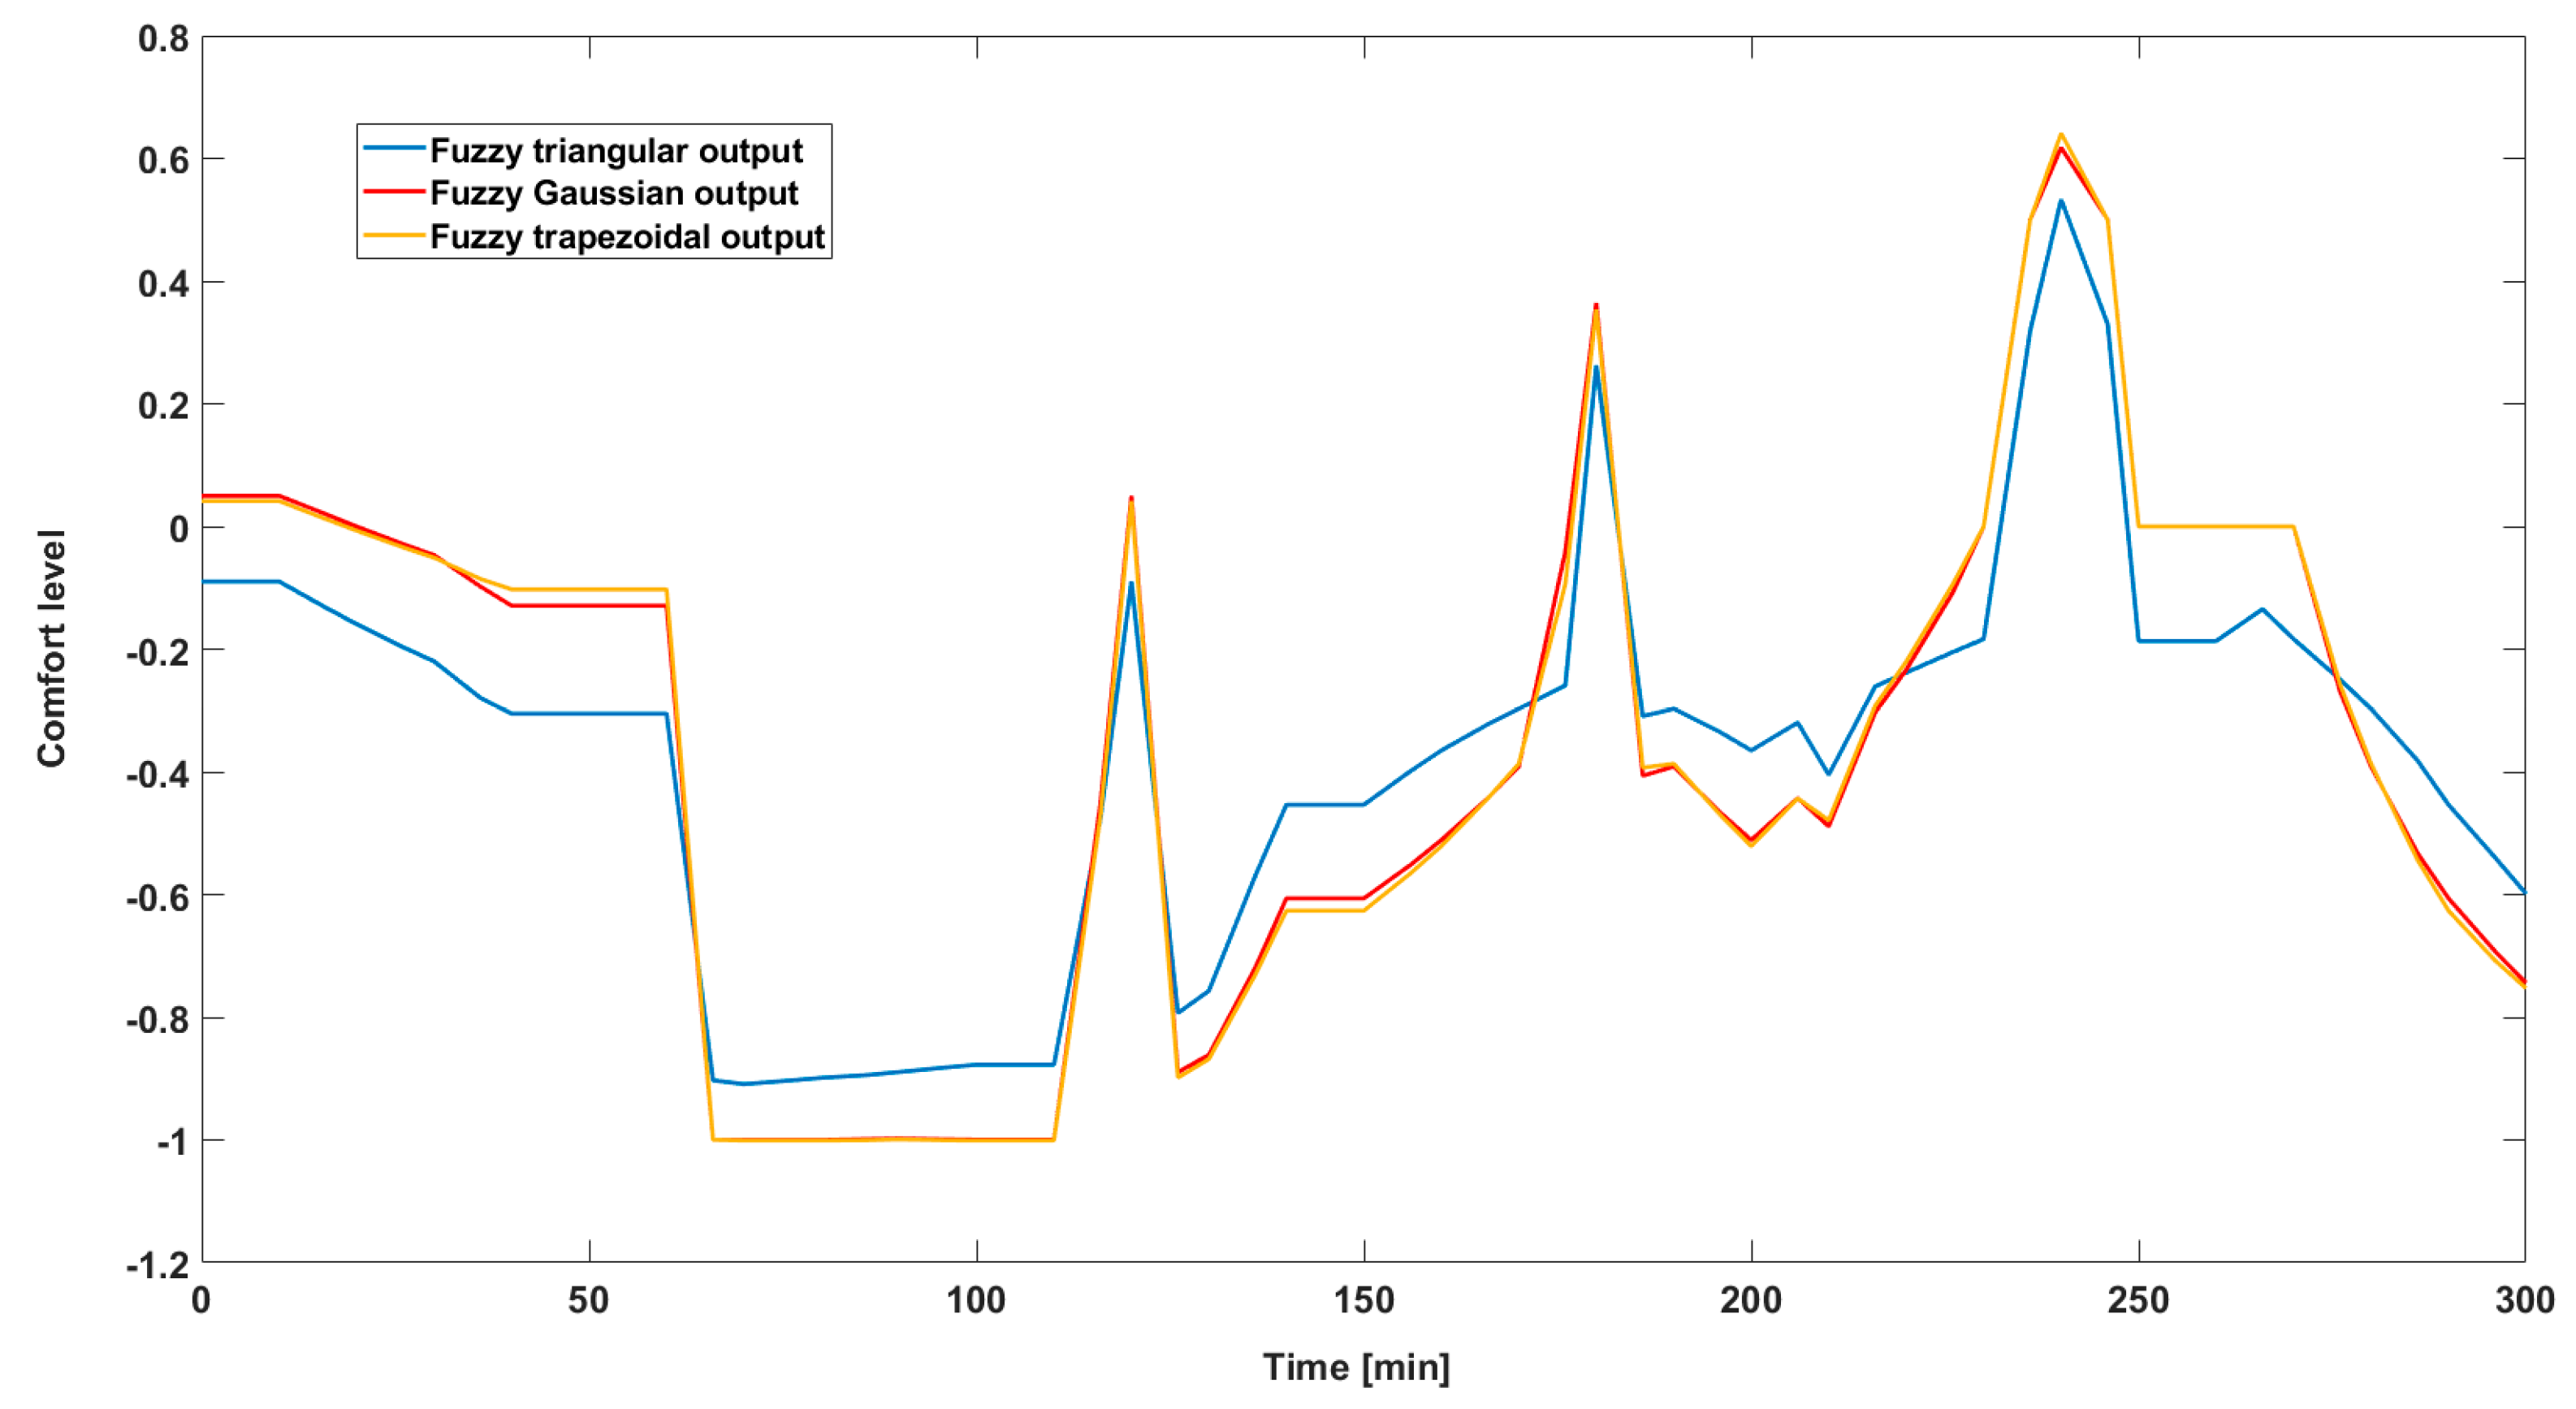
3.2. Results Obtained
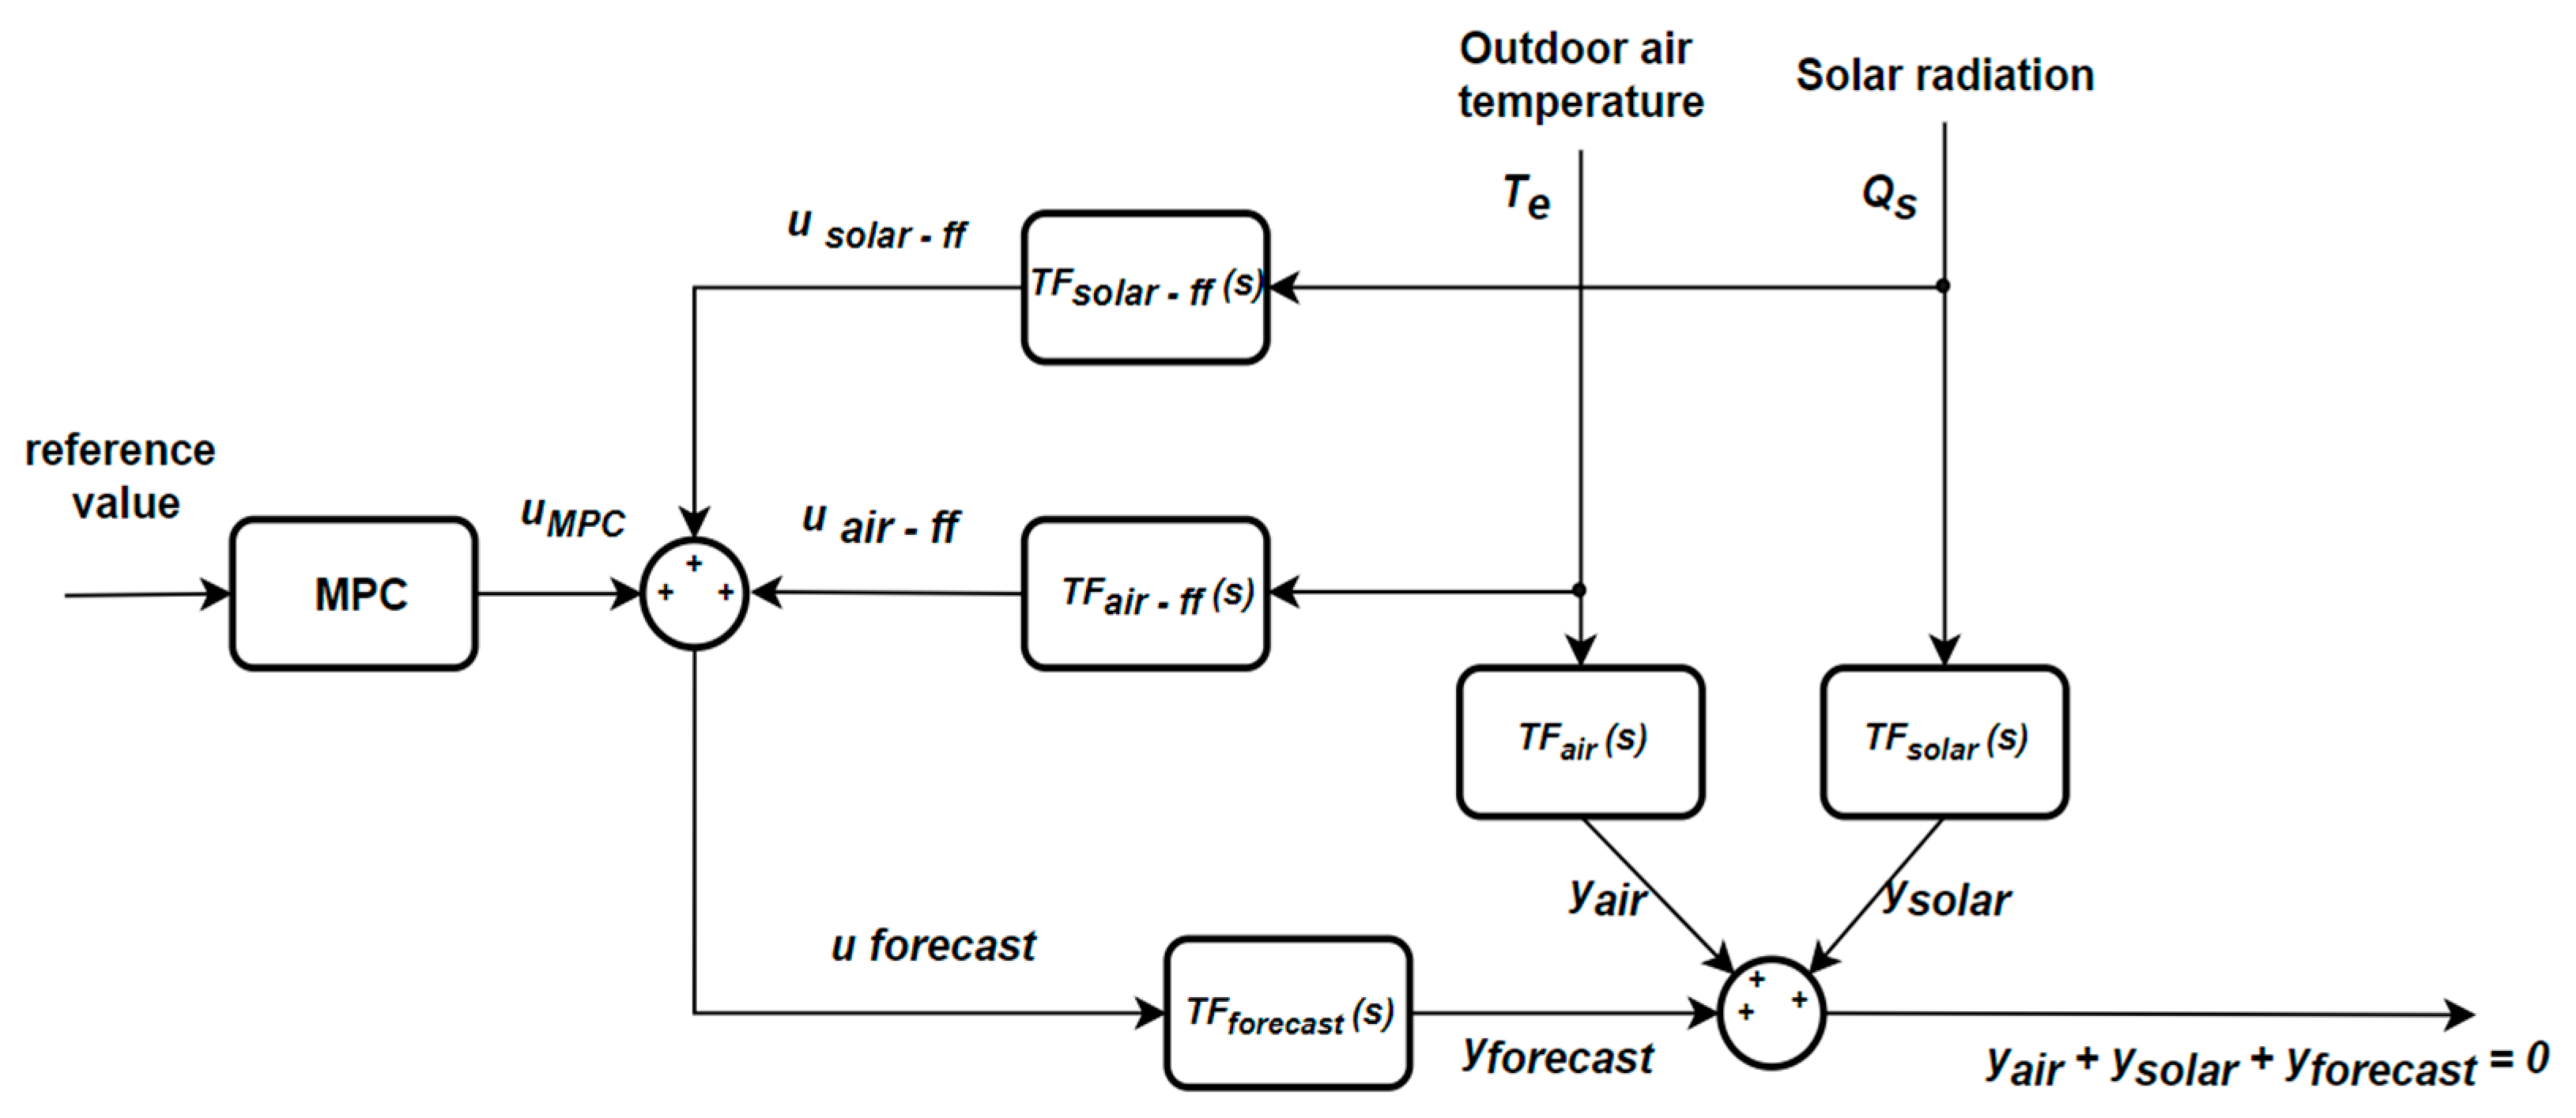
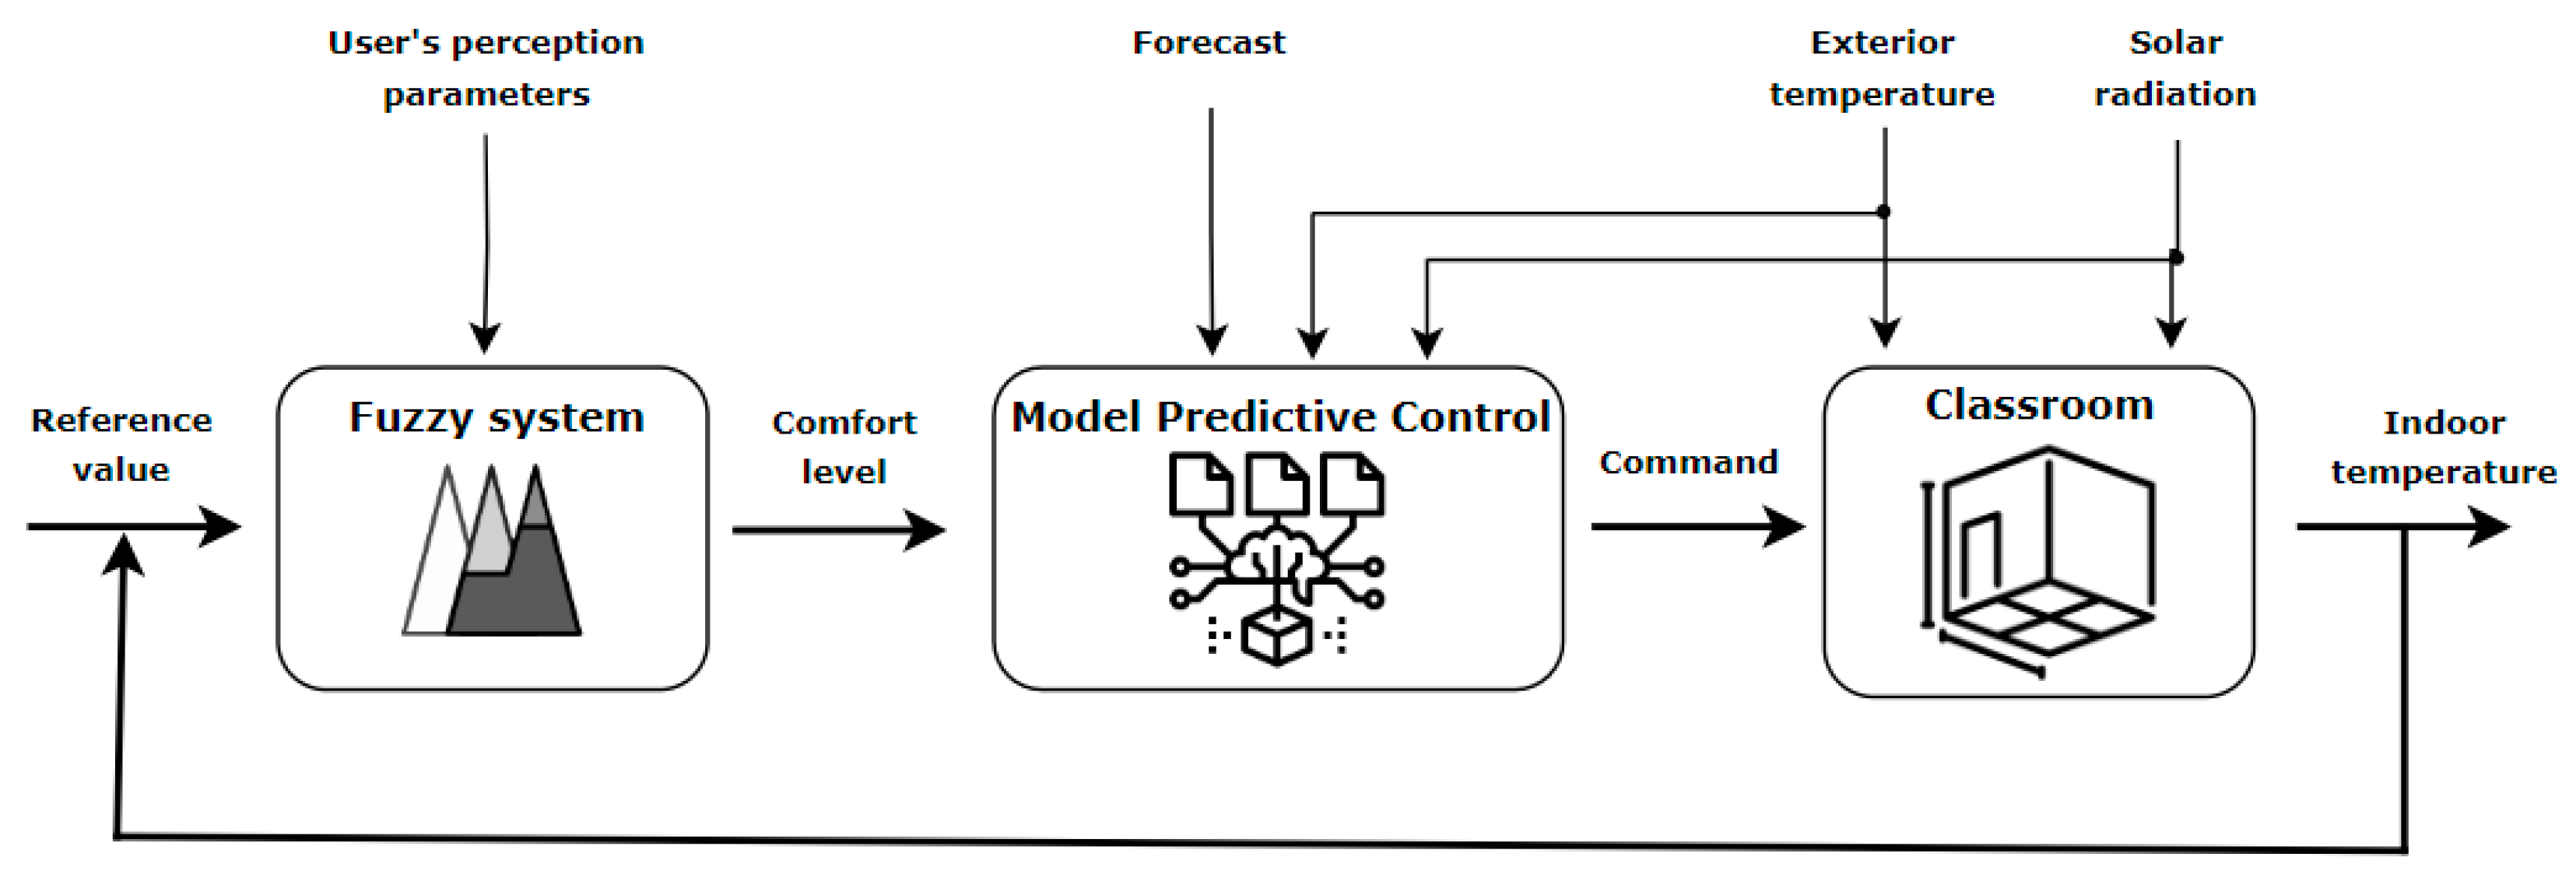
3.3. Model Predictive Control
- MPC—Model Predictive Control
- u—input parameter
- uff—input parameter in feedforward
- TF (s)—transfer function
- Te—outdoor air temperature
- Qs—solar radiation
- y—output parameter
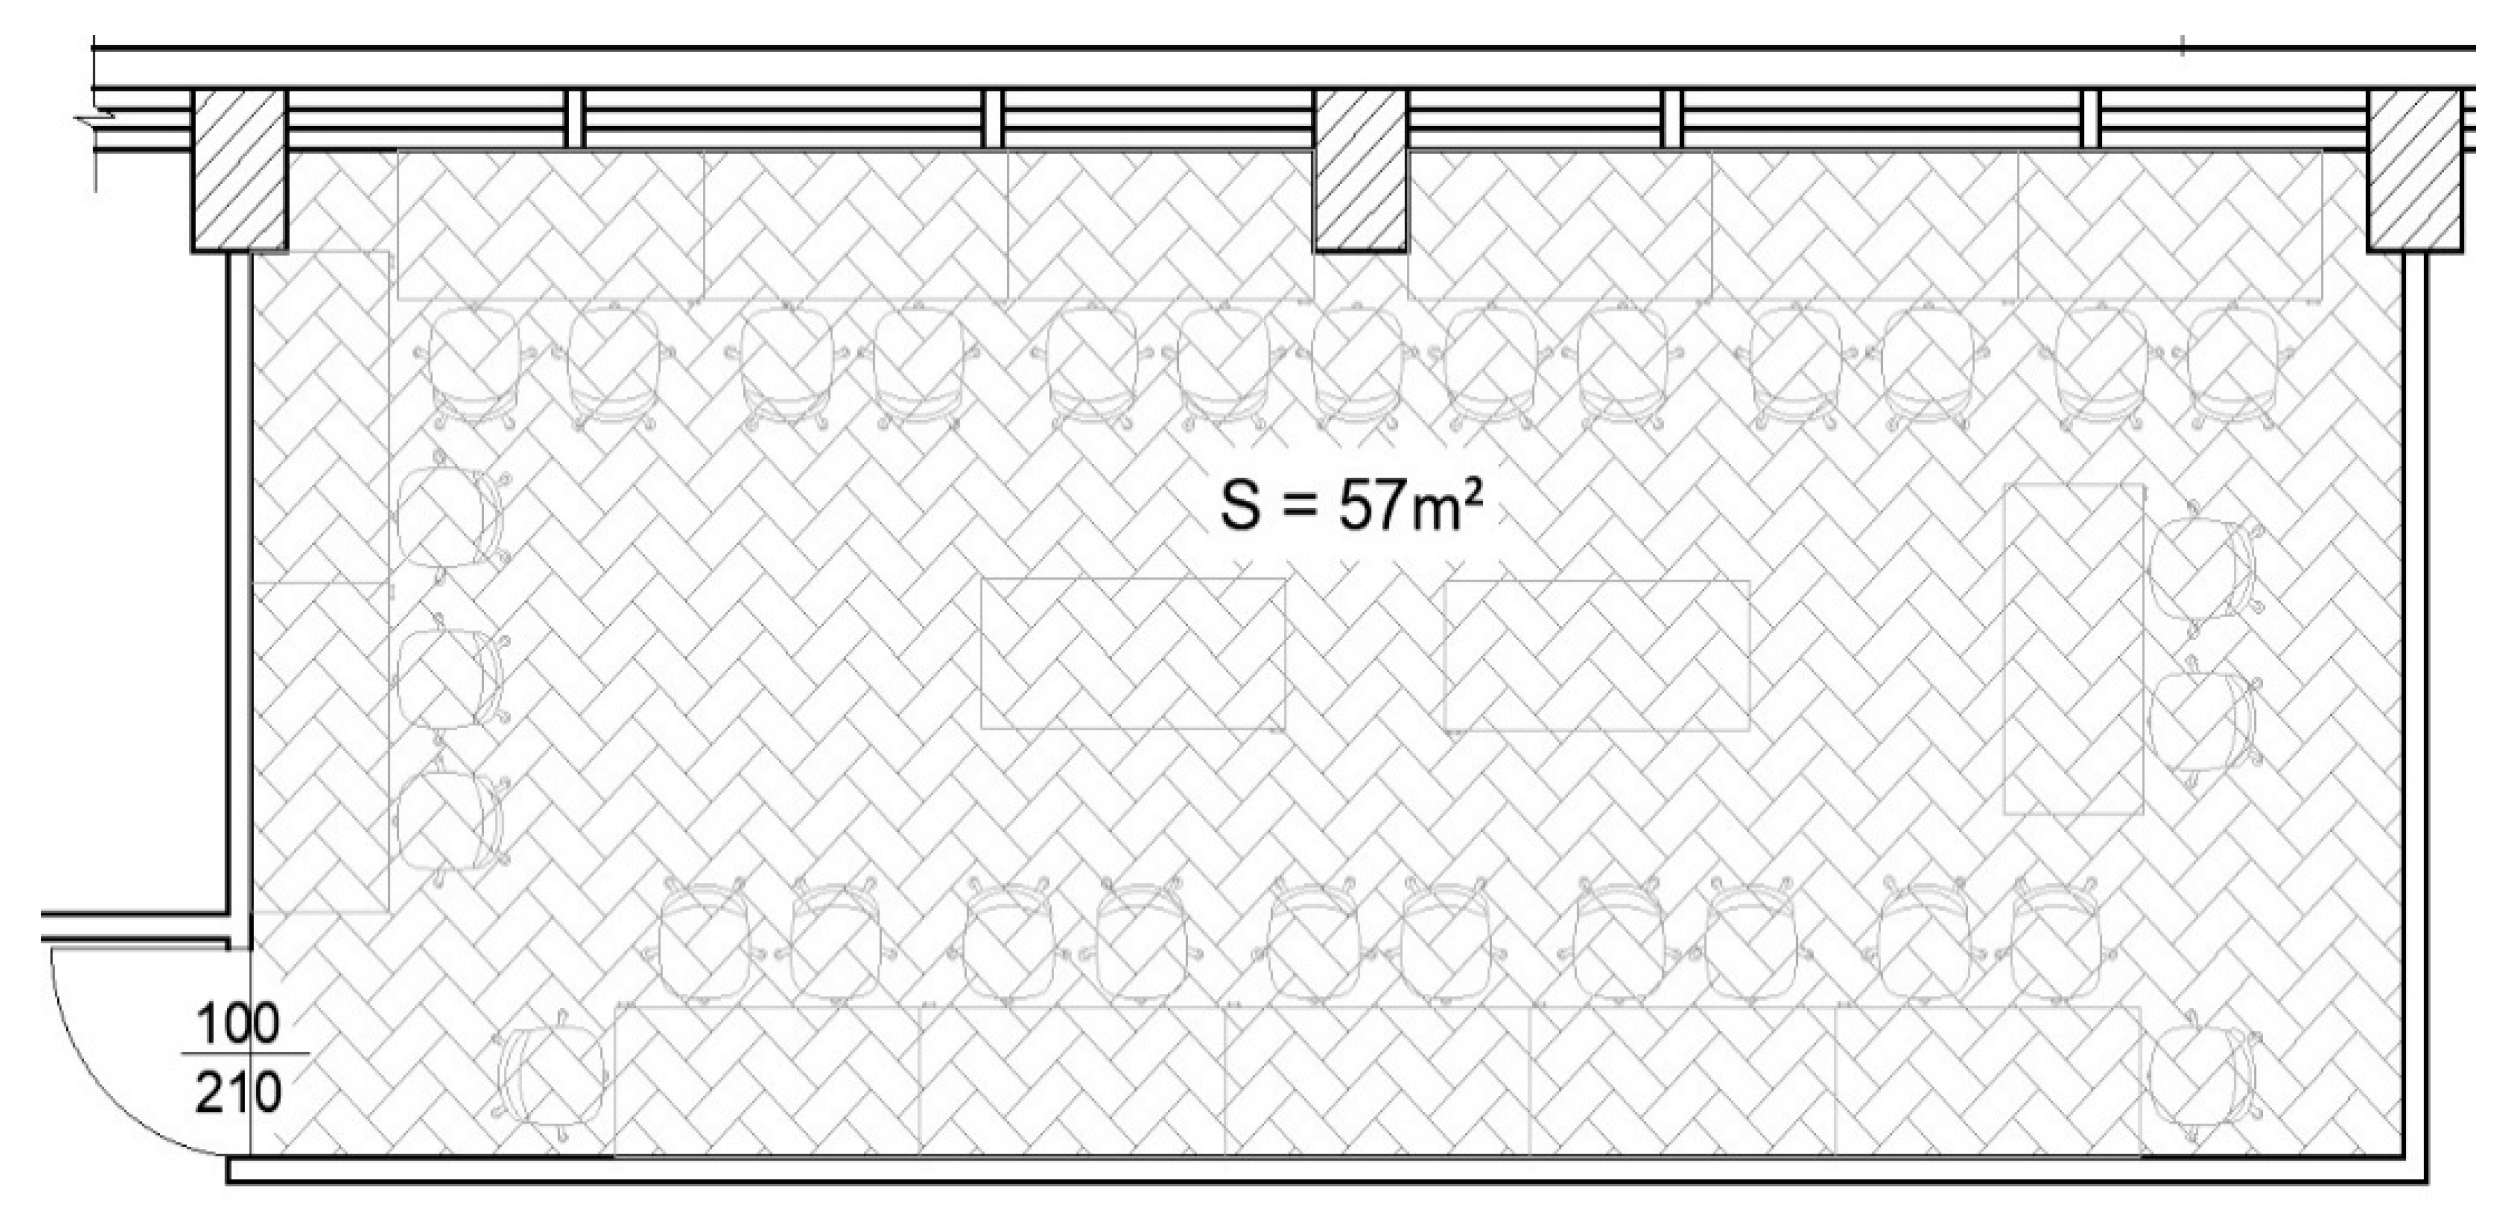
4. Case Study
4.1. Test Scenario
4.2. System Architecture
5. Conclusions
Author Contributions
Funding
Institutional Review Board Statement
Informed Consent Statement
Data Availability Statement
Conflicts of Interest
References
- Sansaniwal, S.K.; Mathur, J.; Mathur, S. Review of practices for human thermal comfort in buildings: Present and future perspectives. Int. J. Ambient. Energy 2020, 43, 2097–2123. [Google Scholar] [CrossRef]
- Grassi, B.; Piana, E.A.; Lezzi, A.M.; Pilotelli, M. A Review of Recent Literature on Systems and Methods for the Control of Thermal Comfort in Buildings. Appl. Sci. 2022, 12, 5473. [Google Scholar] [CrossRef]
- Bueno, A.M.; Xavier, A.A.d.P.; Broday, E.E. Evaluating the Connection between Thermal Comfort and Productivity in Buildings: A Systematic Literature Review. Buildings 2021, 11, 244. [Google Scholar] [CrossRef]
- Peng, Y.; Nagy, Z.; Schlüter, A. Temperature-preference learning with neural networks for occupant-centric building indoor climate controls. J. Affect. Disord. 2019, 154, 296–308. [Google Scholar] [CrossRef]
- Carbonare, N.; Pflug, T.; Bongs, C.; Wagner, A. Design and implementation of an occupant-centered self-learning controller for decentralized residential ventilation systems. J. Affect. Disord. 2021, 206, 108380. [Google Scholar] [CrossRef]
- Ballerini, V.; de Volo, E.P.B.; Pulvirenti, B.; di Schio, E.R.; Valdiserri, P.; Guidorzi, P. Influence of different heating systems on thermal comfort perception: A dynamic and CFD analysis. J. Phys. Conf. Ser. 2024, 2685, 012021. [Google Scholar] [CrossRef]
- Liu, D.; Li, G.; Wu, X.; Wang, J.; Hu, A.; Yan, Q.; Yang, X.; Zhou, H. Comparative analysis of heating characteristics of convective-radiant systems using various terminal air source heat pumps. Energy Build. 2023, 301, 113701. [Google Scholar] [CrossRef]
- Deng, Y.; Feng, Z.; Fang, J.; Cao, S.-J. Impact of ventilation rates on indoor thermal comfort and energy efficiency of ground-source heat pump system. Sustain. Cities Soc. 2018, 37, 154–163. [Google Scholar] [CrossRef]
- Tabadkani, A.; Roetzel, A.; Li, H.X.; Tsangrassoulis, A. A review of occupant-centric control strategies for adaptive facades. Autom. Constr. 2020, 122, 103464. [Google Scholar] [CrossRef]
- Liu, Z.; Zhang, X.; Sun, Y.; Zhou, Y. Advanced controls on energy reliability, flexibility and occupant-centric control for smart and energy-efficient buildings. Energy Build. 2023, 297, 113436. [Google Scholar] [CrossRef]
- Wegertseder-Martínez, P. The Need for a Paradigm Shift toward an Occupant-Centered Environmental Control Model. Sustainability 2023, 15, 5980. [Google Scholar] [CrossRef]
- Lamberti, G.; Fantozzi, F.; Salvadori, G. Thermal comfort in educational buildings: Future directions regarding the impact of environmental conditions on students’ health and performance. In Proceedings of the 2020 IEEE International Conference on Environment and Electrical Engineering and 2020 IEEE Industrial and Commercial Power Systems Europe (EEEIC/I&CPS Europe), Madrid, Spain, 9–12 June 2020; pp. 1–6. [Google Scholar]
- Li, W.; Zhang, J.; Zhao, T.; Ren, J. Experimental study of an indoor temperature fuzzy control method for thermal comfort and energy saving using wristband device. J. Affect. Disord. 2020, 187, 107432. [Google Scholar] [CrossRef]
- Chaouch, H.; Çeken, C.; Arı, S. Energy management of HVAC systems in smart buildings by using fuzzy logic and M2M communication. J. Build. Eng. 2021, 44, 102606. [Google Scholar] [CrossRef]
- Gholamzadehmir, M.; Del Pero, C.; Buffa, S.; Fedrizzi, R.; Aste, N. Adaptive-predictive control strategy for HVAC systems in smart buildings—A review. Sustain. Cities Soc. 2020, 63, 102480. [Google Scholar] [CrossRef]
- Yao, Y.; Shekhar, D.K. State of the art review on model predictive control (MPC) in Heating Ventilation and Air-conditioning (HVAC) field. J. Affect. Disord. 2021, 200, 107952. [Google Scholar] [CrossRef]
- Carli, R.; Cavone, G.; Ben Othman, S.; Dotoli, M. IoT Based Architecture for Model Predictive Control of HVAC Systems in Smart Buildings. Sensors 2020, 20, 781. [Google Scholar] [CrossRef] [PubMed]
- Kontes, G.D.; Giannakis, G.I.; Sánchez, V.; De Agustin-Camacho, P.; Romero-Amorrortu, A.; Panagiotidou, N.; Rovas, D.V.; Steiger, S.; Mutschler, C.; Gruen, G. Simulation-Based Evaluation and Optimization of Control Strategies in Buildings. Energies 2018, 11, 3376. [Google Scholar] [CrossRef]
- Kontes, G.D.; Giannakis, G.I.; Horn, P.; Steiger, S.; Rovas, D.V. Using Thermostats for Indoor Climate Control in Office Buildings: The Effect on Thermal Comfort. Energies 2017, 10, 1368. [Google Scholar] [CrossRef]
- Fanger, P.O. Thermal Comfort: Analysis and Application in Environment Engineering; Danish Technical Press: Copenhagen, Denmark, 1970; p. 244. [Google Scholar]
- Boicu, M.-G.; Făgărăşan, I.; Stamatescu, G.; Vasluianu, M.; Fudulu, C.-F.; Dobrea, M.-A. An Occupant-Centric Comfort Control Strategy Using Wearable Smart Devices in Smart-Buildings. In Proceedings of the 2023 IEEE 12th International Conference on Intelligent Data Acquisition and Advanced Computing Systems: Technology and Applications (IDAACS), Dortmund, Germany, 7–9 September 2023; pp. 912–916. [Google Scholar]
- Boicu, M.-G.; Stamatescu, G.; Fudulu, C.-.F.; Dobrea, M.-.A.; Vasluianu, M.; Neculoiu, G. Decision System for Ensuring Thermal Comfort of Occupants in a Smart Building. In Proceedings of the 2023 24th International Conference on Control Systems and Computer Science (CSCS), Bucharest, Romania, 24–26 May 2023; pp. 502–507. [Google Scholar]
- ISO 7730; Moderate Thermal Environments. Determination of the PMV and PPD Indices and Specification of the Conditions for Thermal Comfort. 2nd. ed. International Organisation for Standardisation: Geneva, Switzerland, 2005.
- Almagro-Lidón, M.; Pérez-Carramiñana, C.; Galiano-Garrigós, A.; Emmitt, S. Thermal comfort in school children: Testing the validity of the Fanger method for a Mediterranean climate. J. Affect. Disord. 2024, 253, 111305. [Google Scholar] [CrossRef]
- Abilkhassenova, Z.; Memon, S.A.; Ahmad, A.; Saurbayeva, A.; Kim, J. Utilizing the Fanger thermal comfort model to evaluate the thermal, energy, economic, and environmental performance of PCM-integrated buildings in various climate zones worldwide. Energy Build. 2023, 297, 113479. [Google Scholar] [CrossRef]
- ANSI/ASHRAE (2017) Standard 55; Thermal Environmental Conditions for Human Occupancy. ASHRAE: Atlanta, GA, USA, 2017.
- Neculoiu, G.; Dache, V.; Stamatescu, G.; Sgarciu, V. Buildings modeling in order to implement optimal temperature control. In Proceedings of the 2015 7th International Conference on Electronics, Computers and Artificial Intelligence (ECAI), Bucharest, Romania, 25–27 June 2015; pp. S-43–S-48. [Google Scholar]
- Neculoiu, G.; Dache, V.; Stamatescu, G.; Sgarciu, V. Model Predictive Control applied for building thermal control. In Proceedings of the 2015 Intl Aegean Conference on Electrical Machines & Power Electronics (ACEMP), 2015 Intl Conference on Optimization of Electrical & Electronic Equipment (OPTIM) & 2015 Intl Symposium on Advanced Electromechanical Motion Systems (ELECTROMOTION), Side, Turkey, 2–4 September 2015; pp. 363–368. [Google Scholar]
- Neculoiu, G.; Stamatescu, G.; Sgarciu, V. Thermal control strategies applied in buildings with intermittent heats. In UPB Scientific Bulletin; Series C: Electrical Engineering and Computer Science; University POLITEHNICA of Bucharest: Bucharest, Romania, 2016. [Google Scholar]


| Room Purpose | Level of Activity | Heat Released by the Occupant [kcal/h] | Recommended Comfort Index B Value |
|---|---|---|---|
| Production halls/commercial halls/shops (ti = 18 °C) | Light physical work | Under 200 | −1.5 < B < −0.5 |
| Administrative buildings/offices (ti = 18–20 °C) | Computer work/reading/light activity | Under 155 | −1.5 < B < −0.5 |
| Houses/schools (ti = 20 °C) | Human at rest/reading/light activity | 100 | −0.5 < B < −0.5 |
| Feature | Range | Precision |
|---|---|---|
| Indoor temperature measurement | −5 to +50 °C | ±1.5 °C |
| Outdoor temperature measurement | −40 to +60 °C | ±1.5 °C |
| Indoor humidity measurement | 1% to 90% | ±5% |
| Outdoor humidity measurement | 1% to 99% | ±5 % |
| Sensor transmission distance | Up to 150 m | - |
| Transmission frequency | 868 Mhz | - |
| No Label | Name | Clothing |
|---|---|---|
| 1 | Very light | Summer clothing |
| 2 | Light | T-shirt |
| 3 | Medium | Blouse, shirt |
| 4 | Heavy | Winter clothing—sweater |
| Date (Europe/Bucharest) | Day | Inside Temperature (°C) | Inside Humidity (%) | Skin Temperature | Activity Level | Clothing Level |
|---|---|---|---|---|---|---|
| 8:00:00 a.m. | 14 November | 19.3 | 51 | 36 | 1 | 3 |
| 8:10:00 a.m. | 14 November | 19.3 | 50 | 36 | 1 | 3 |
| 8:20:00 a.m. | 14 November | 19.4 | 49 | 36 | 1 | 3 |
| 8:30:00 a.m. | 14 November | 19.5 | 49 | 36 | 1 | 3 |
| 8:40:00 a.m. | 14 November | 19.5 | 49 | 36 | 1 | 3 |
| 8:50:00 a.m. | 14 November | 19.6 | 46 | 36 | 3 | 3 |
| 9:00:00 a.m. | 14 November | 19.7 | 45 | 36 | 1 | 3 |
| 9:10:00 a.m. | 14 November | 20 | 45 | 36 | 1 | 3 |
| 9:20:00 a.m. | 14 November | 20 | 45 | 36 | 1 | 3 |
| 9:30:00 a.m. | 14 November | 20.1 | 46 | 36 | 1 | 3 |
Disclaimer/Publisher’s Note: The statements, opinions and data contained in all publications are solely those of the individual author(s) and contributor(s) and not of MDPI and/or the editor(s). MDPI and/or the editor(s) disclaim responsibility for any injury to people or property resulting from any ideas, methods, instructions or products referred to in the content. |
© 2024 by the authors. Licensee MDPI, Basel, Switzerland. This article is an open access article distributed under the terms and conditions of the Creative Commons Attribution (CC BY) license (https://creativecommons.org/licenses/by/4.0/).
Share and Cite
Boicu, M.-G.; Stamatescu, G.; Făgărăşan, I.; Vasluianu, M.; Neculoiu, G.; Dobrea, M.-A. Optimizing Occupant Comfort in a Room Using the Predictive Control Model as a Thermal Control Strategy. Sensors 2024, 24, 3857. https://doi.org/10.3390/s24123857
Boicu M-G, Stamatescu G, Făgărăşan I, Vasluianu M, Neculoiu G, Dobrea M-A. Optimizing Occupant Comfort in a Room Using the Predictive Control Model as a Thermal Control Strategy. Sensors. 2024; 24(12):3857. https://doi.org/10.3390/s24123857
Chicago/Turabian StyleBoicu, Mihaela-Gabriela, Grigore Stamatescu, Ioana Făgărăşan, Mihaela Vasluianu, Giorgian Neculoiu, and Marius-Alexandru Dobrea. 2024. "Optimizing Occupant Comfort in a Room Using the Predictive Control Model as a Thermal Control Strategy" Sensors 24, no. 12: 3857. https://doi.org/10.3390/s24123857