Abstract
Understanding past and current trends is crucial in the fashion industry to forecast future market demands. This study quantifies and reports the characteristics of the trendy walking styles of fashion models during real-world runway performances using three cutting-edge technologies: (a) publicly available video resources, (b) human pose detection technology, and (c) multivariate human-movement analysis techniques. The skeletal coordinates of the whole body during one gait cycle, extracted from publicly available video resources of 69 fashion models, underwent principal component analysis to reduce the dimensionality of the data. Then, hierarchical cluster analysis was used to classify the data. The results revealed that (1) the gaits of the fashion models analyzed in this study could be classified into five clusters, (2) there were significant differences in the median years in which the shows were held between the clusters, and (3) reconstructed stick-figure animations representing the walking styles of each cluster indicate that an exaggerated leg-crossing gait has become less common over recent years. Accordingly, we concluded that the level of leg crossing while walking is one of the major changes in trendy walking styles, from the past to the present, directed by the world’s leading brands.
1. Introduction
In the fashion industry, trend analysis is crucial to forecasting future market demands because trends change with the times [1]. Despite the importance given to the walking skills exhibited by models during fashion shows [2], trend analysis has not been applied to their walking styles. A Google Scholar search using the keywords “fashion model” and “gait analysis” returned only seven articles as of 30 May 2024. None of these studies focused on the walking styles of fashion models in a historical or evolutionary context. Fashion models need a high degree of technical athletic coordination to perfect their gaits on the runway [2]. Additionally, they need to understand sophisticated movement features that evolve based on the demands of the industry and society [2]. Hence, quantifying and reporting the features of trendy walking styles from the past to the present is extremely beneficial not only for models, their trainers, and agencies to increase models’ chances of being cast in runway shows, but also for designers and brands to sustain the development of the industry.
Until recently, it was virtually impossible to analyze the top performances of the world’s best performers, such as professional athletes, dancers, and fashion models, to understand the nature of their sophisticated techniques. However, such an analysis is now possible using three cutting-edge technologies: (1) video-sharing services, such as YouTube, in which high-resolution video resources (even at the 4K level) of the world’s best performers, including the recordings of the fashion shows of the world’s leading brands over the past 20 years, are available; (2) human pose detection technology, such as OpenPose [3], which is a novel sensing technology that can extract the skeletal coordinates of the human body from RGB images with remarkable accuracy [4]; (3) multivariate human-movement analysis techniques, which can classify the data into several groups based on the characteristics of whole-body movements [5,6]. Several researchers have used these technologies to evaluate the performances of the world’s best performers during actual competitions [7,8,9]. For example, Hobara et al. analyzed publicly available internet broadcasts to determine the running characteristics of able-bodied and amputee sprinters in actual 100 m races at world championships [7]. Recently, advanced pose detection technologies have been used in various industries, such as sports [10], healthcare [11], and entertainment [12]. Therefore, we concluded that the combination of these cutting-edge technologies, namely, the analysis of publicly available fashion show video resources using pose detection technology and multivariate analysis techniques, can clarify the characteristics of the sophisticated walking styles of the world’s leading fashion models that are modified over time based on the demands of the industry.
This study is the first to analyze the gaits of fashion models during actual fashion shows of the world’s leading brands using the abovementioned three cutting-edge technologies, aimed at quantifying and reporting the features of past and current trendy walking styles directed by the world’s leading brands. This study focused only on women’s fashion shows, as the market size of women’s apparel is 1.5 times larger than that of men’s apparel (USD 901.10 billion [13] vs. USD 568.90 billion [14] in 2023), and 77.7% of fashion models in the United States are women [15]. Furthermore, we focused only on (1) the spring/summer prêt-à-porter collections and (2) the first model to walk down the runway of each show. We took this approach because heavy clothing, often worn in autumn/winter, and haute-couture collections make skeletal detection less accurate with the current computer vision technology. Additionally, the media highlights the “first look” as the hottest model of the year, significantly reflecting the fashion trends of each period.
2. Materials and Methods
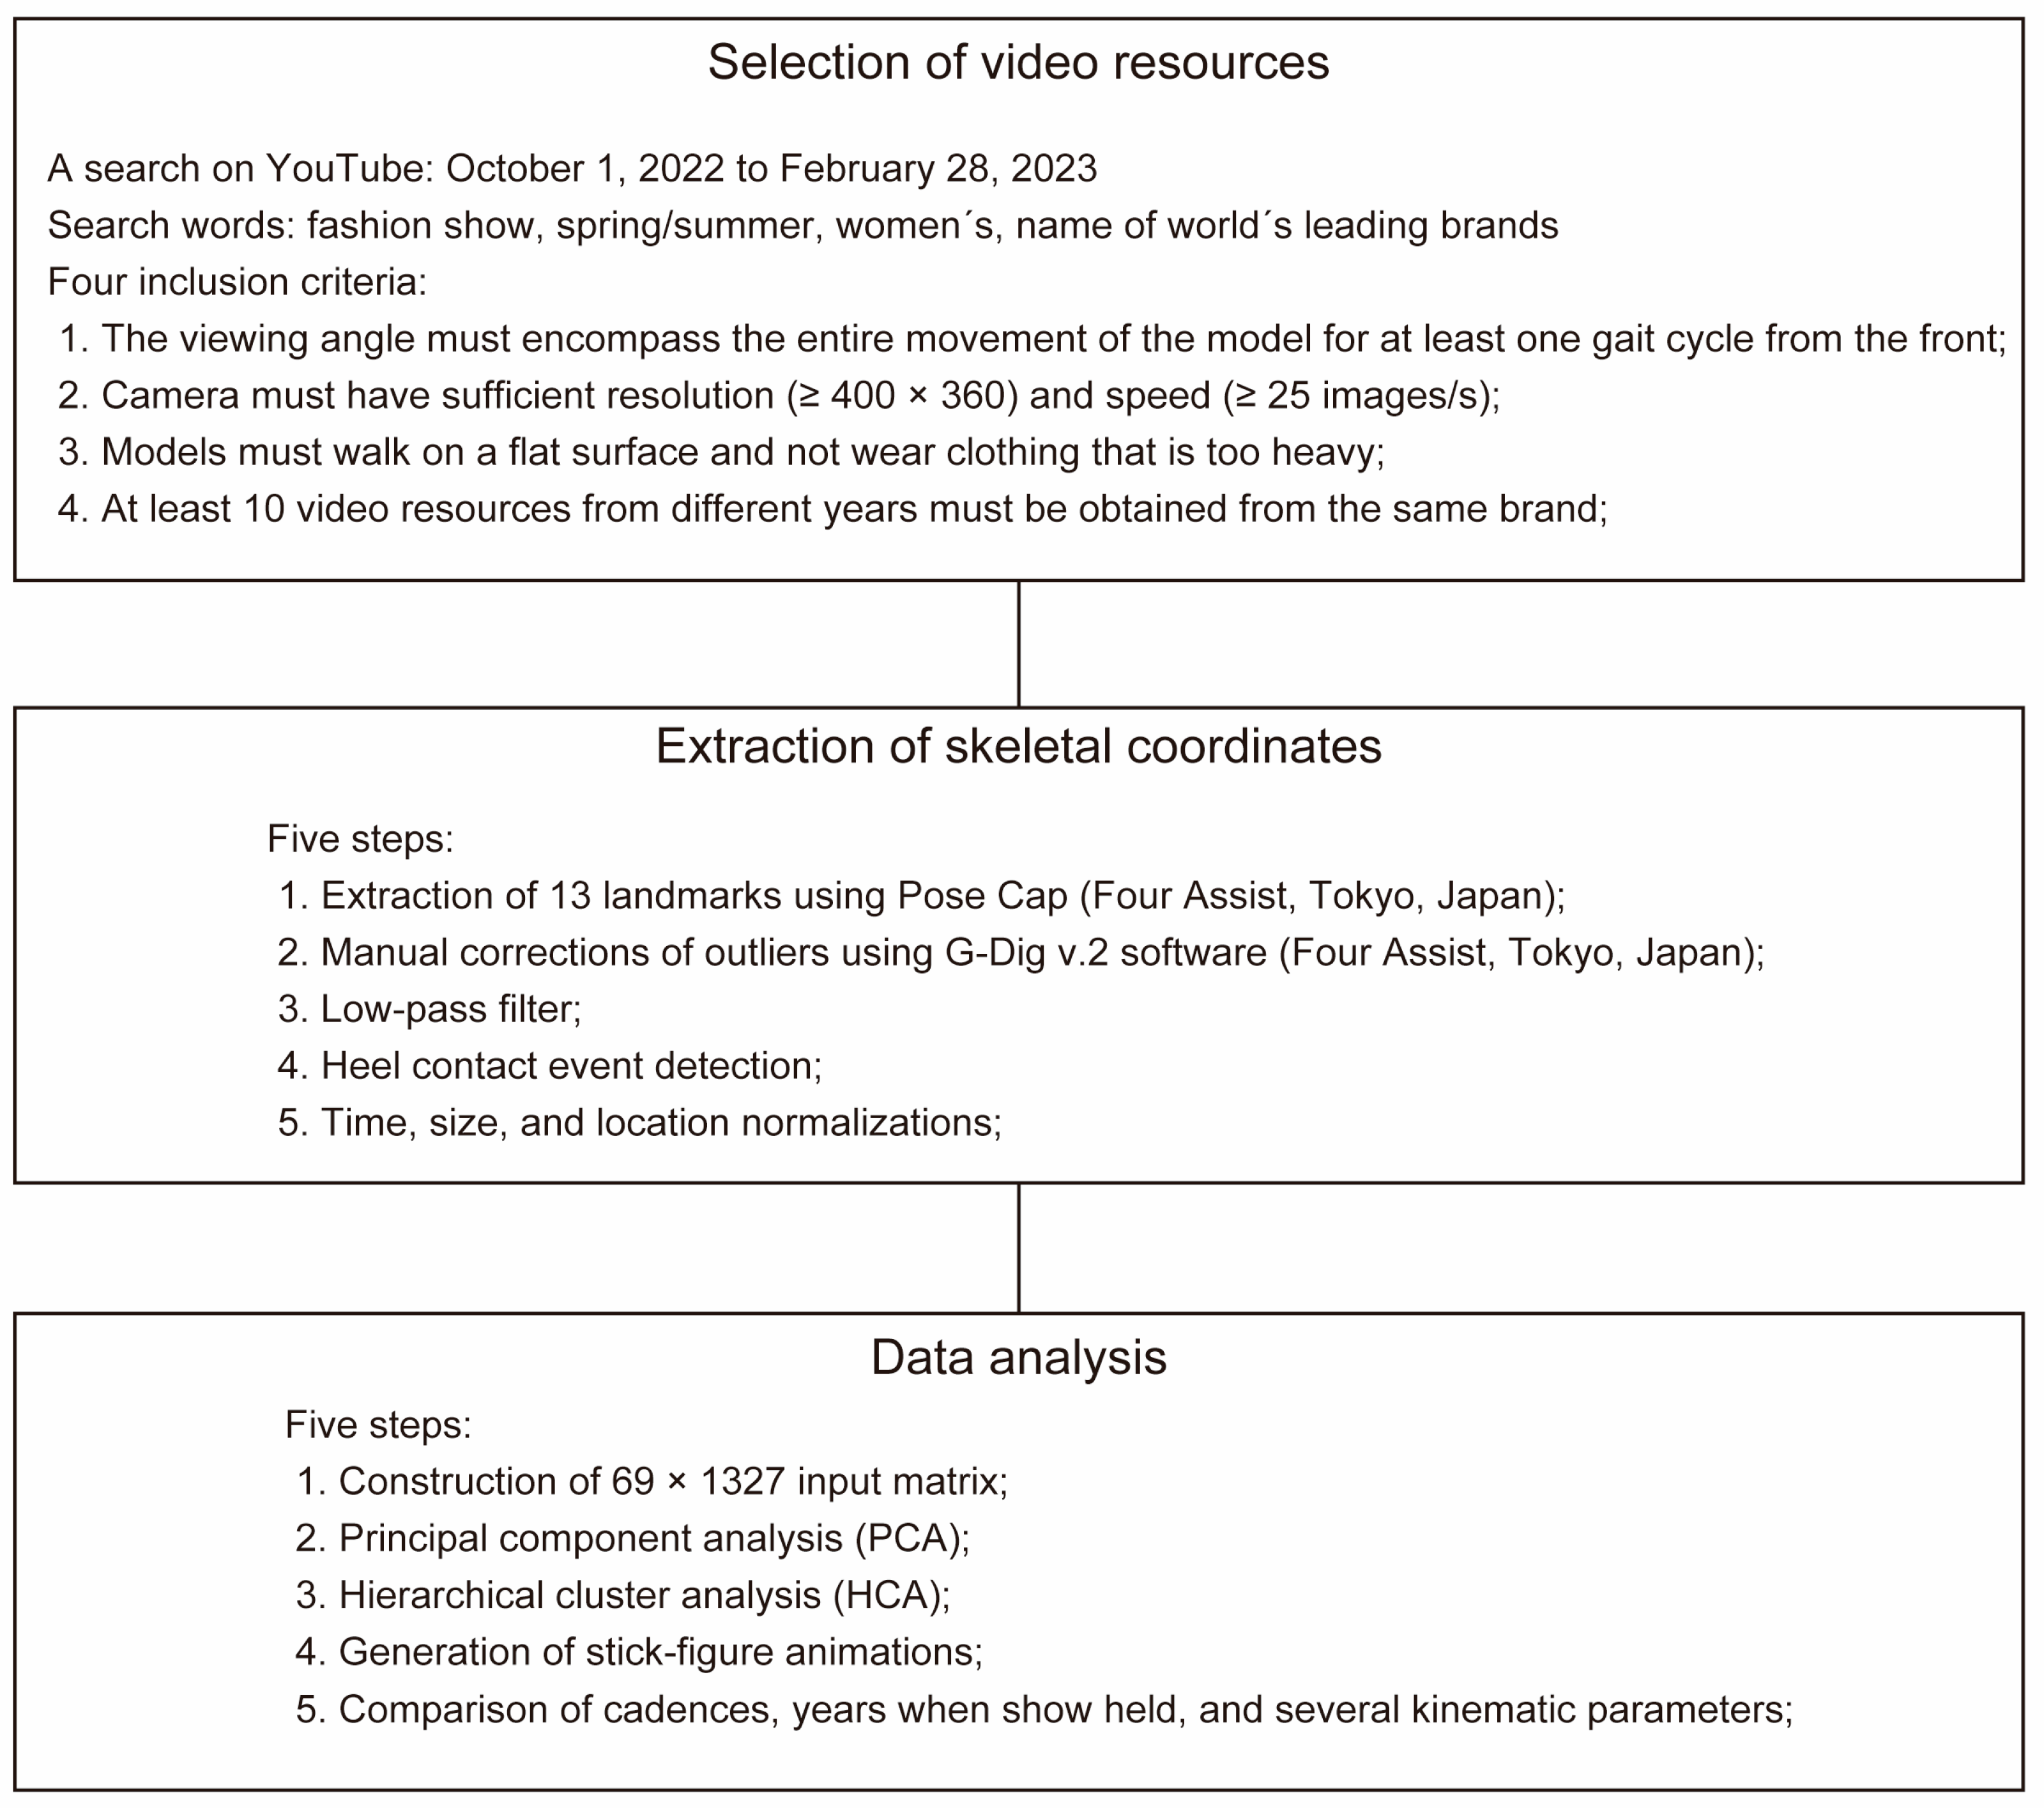
A flowchart indicating the overall research methodology is shown in Figure 1.
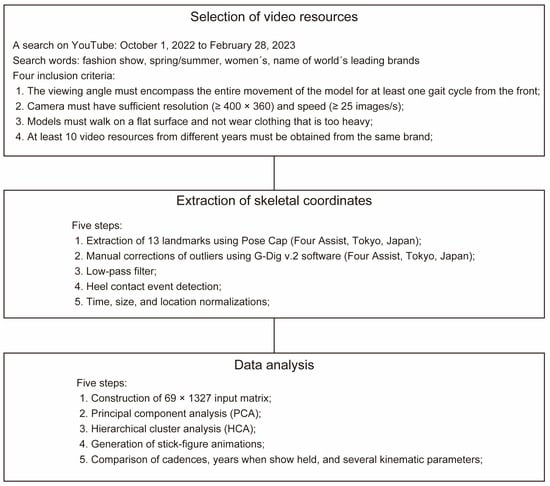
Figure 1.
Flowchart of the overall research methodology.
2.1. Selection of Video Resources
The principal investigator of this research (Y.K.) performed a search on YouTube from 1 October 2022 to 28 February 2023. The search terms used were “fashion show”, “spring/summer”, and “women’s” combined with the names of brands (e.g., Versace, Dolce & Gabbana, and Louis Vuitton) participating in either one of the two most popular fashion weeks in the world (Paris or Milan) [16]. Manual selection of the videos was performed according to the following four inclusion criteria:
- The viewing angle must encompass the entire movement of the model for at least one gait cycle from the front to avoid sliding effects;
- The camera must have sufficient resolution (≥400 × 360) and speed (≥25 images/s);
- Models must walk on a flat surface and not wear clothing that is too heavy, which would reduce the accuracy of the skeletal detection;
- At least 10 video resources from different years must be obtained from the same brand so that transitions over time can be determined. This criterion was determined based on previous studies that conducted trend analyses in the fashion industry [17,18].
Because the walking environments among the shows could not be perfectly matched, two expert biomechanical researchers (Y.K. and S.S.) independently reviewed the videos and selected those that met the criteria. Finally, 69 videos were accepted, as listed in Table A1 (Appendix C).
2.2. Extraction of Skeletal Coordinates
After selecting the videos, the following five steps were performed to extract reliable skeletal coordinates of the models during a single gait cycle:
- The 2D coordinates (x, y) of the following 13 landmarks were automatically extracted using the human pose detection library Pose Cap (Four Assist, Tokyo, Japan): head, shoulder center, hip center, right and left shoulders, right and left elbows, right and left hips, right and left knees, and right and left ankles. The default settings of the software were used for the pose detection. For skeletal landmarks with distinct outliers (e.g., when a part of the clothing was misidentified as a part of the human body), the principal investigator (Y.K.) made manual corrections using G-Dig v.2 software (Four Assist, Tokyo, Japan). The quality of the manual corrections was reviewed by a co-author (S.S.). We used this software because it allows for the manual correction of misidentified landmarks. This function was essential to the analysis of videos of fashion shows for which models sometimes wore flowy dresses;
- A Butterworth low-pass filter with a cut-off frequency of 6 Hz (the default value in the biomechanical simulator OpenSim [19,20]) was used to smooth the time-series landmark signals;
- For each video resource, Y.K. manually detected the timing of the right- and left-heel contact events frame by frame, and the skeletal coordinates for one gait cycle were extracted. When one gait cycle was extracted from the contact event of the left heel, the skeletal coordinates were inverted to the left and right for the subsequent analysis. Y.K. verified the accuracy of the heel contact event detection, and another biomechanics expert (S.S.) performed the same analysis on 18 randomly selected videos (25% of the total video resources). The mean absolute error of the manual heel contact event detection between the investigators was 0.53 frames (Table A2 in Appendix C);
- Time, size, and location normalizations were performed for each data unit. For the time normalization, the skeletal coordinate data were linearly interpolated such that one gait cycle contained 51 frames (0–100%; 2% per frame). The cadence (steps/min), determined from the number of frames and the frame rate (images/sec) between the heel contact events, was also recorded for subsequent analyses. For the size normalization, the distance from the neck to the center of the hip was set to one, and the size of the entire body was adjusted. For the location normalization, the 2D coordinates of the hip joint at the first and last frames were both set to origin, and the skeletal coordinate data between events were linearly interpolated. These normalization processes were necessary because the time of one stride, the model size, and the walking locations varied among the models/video resources.
2.3. Data Analysis
The time-, size-, and location-normalized skeletal coordinate data, as well as the cadence data, were analyzed as follows:
- A 69 × 1327 input matrix was constructed (69 models with 13 landmarks × 51 frames × 2D coordinates + cadence);
- Principal component analysis (PCA) was applied to the input matrix using a correlation matrix to reduce the data dimension;
- Hierarchical cluster analysis (HCA) was applied to the principal component scores (PCSs) of the principal component vectors (PCVs) with up to 80% cumulative variance to classify the data. The Euclidean distance and the Ward aggregation criterion were considered in the analysis. Dendrograms and cluster agglomeration schedules [21] were used to comprehensively determine the appropriate clusters for further analysis. Appendix A describes how to determine the appropriate clusters;
- To help with the interpretation of the walking styles, stick-figure animations representing the walking style of each cluster were generated from the reconstructed skeletal coordinates. The skeletal coordinates were reconstructed from the mean PCS of each cluster in each PCV and the mean and standard deviations of each data unit, as performed in previous studies [5,22];
- Furthermore, the cadences, years when the shows were held, and several kinematic parameters representing the walking styles of the clusters were compared statistically across the clusters. One-way analysis of variance (ANOVA) was applied when the normality and homoscedasticity assumptions were confirmed, and the Kruskal–Wallis test was applied when they were rejected. The Bonferroni method was used for multiple comparisons when a significant main effect was observed.
SPSS software (IBM SPSS Statistics v.19, IBM Inc., Armonk, NY, USA) was used for all statistical analyses. Given the number of data units in this study, we judged statistically significant differences by both p-values and effect sizes. This approach avoids the possible risk of misinterpreting the results based on the p-value alone. The effect sizes were the partial-eta-squared (ŋ2) value for the parametric tests and the r-value for the nonparametric tests. Based on previous studies [23,24], the criterion was set at p < 0.05 and a medium effect size (ŋ2 > 0.06 or r > 0.30).
3. Results
3.1. Classification of Walking Styles
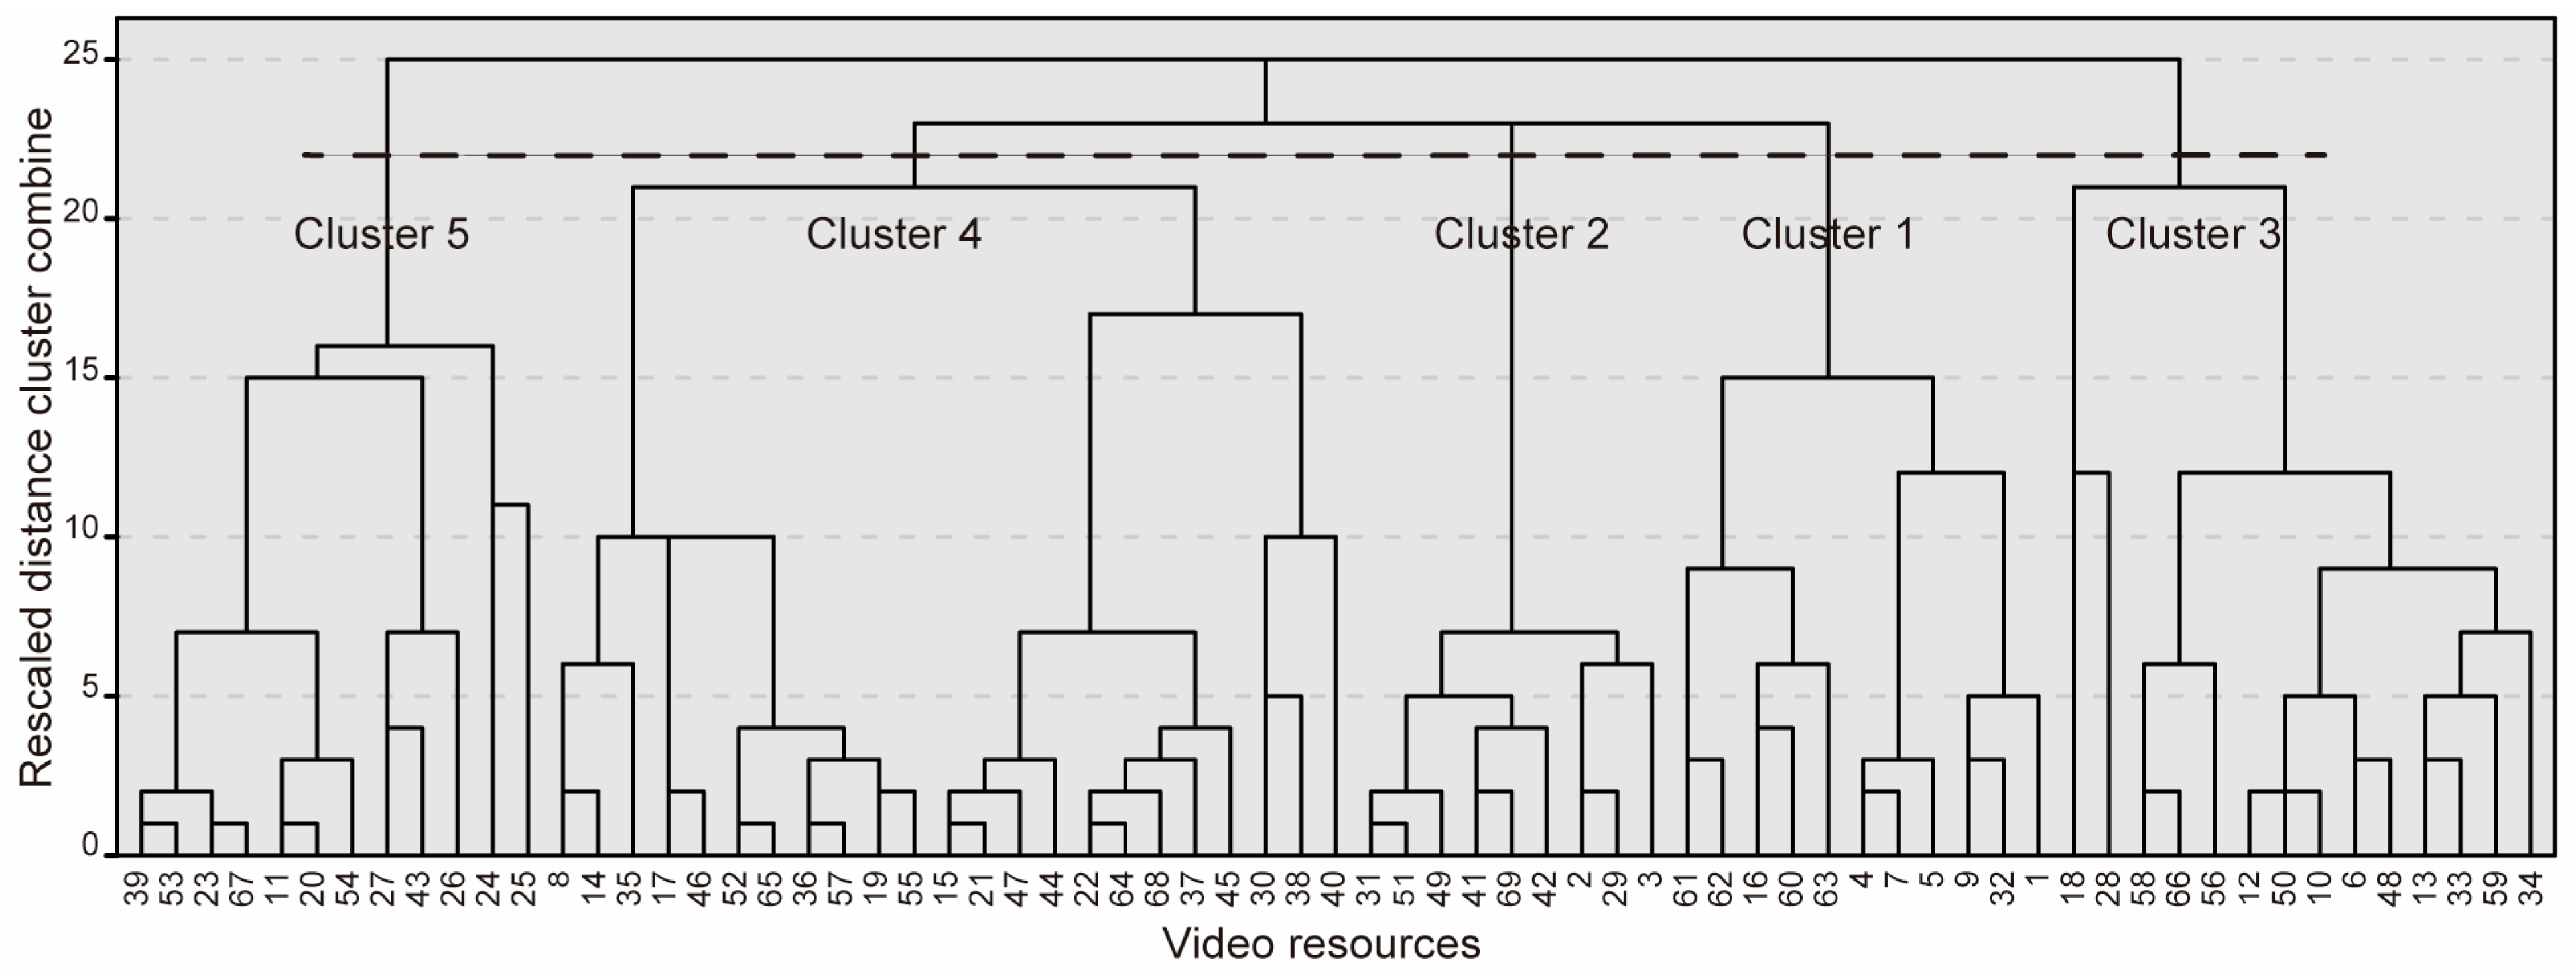
The PCA produced 57 PCVs with eigenvalues greater than one as outputs. Of the 57 PCVs, the first 13 PCVs explained more than 80% of the cumulative variance (Table A3 in Appendix C). Reliability of the PCA results have verified as described in Appendix B. The HCA produced the dendrogram shown in Figure 2 and the agglomeration schedule coefficients presented in Table A4 (Appendix C) as outputs. Based on these outputs and the detailed consideration described in Appendix A, we concluded that classifying the data into five clusters was the most appropriate for interpreting the results. Table 1 provides detailed information about each cluster.
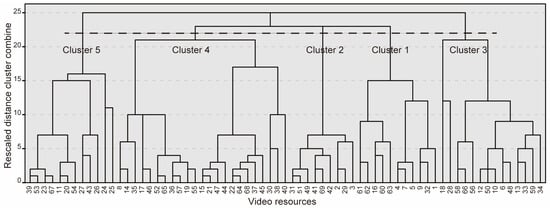
Figure 2.
Dendrogram extracted using hierarchical cluster analysis. Based on the outputs and the detailed consideration described in Appendix A, we concluded that classifying the data into five clusters was the most appropriate for interpreting the results.

Table 1.
Detailed information for each cluster. For the cadence and years when the shows were held, the median (interquartile range) is reported. Statistical analyses revealed a significant main effect on the year when the show was held but not on the cadence.
3.2. Cadences and Years When Shows Were Held
For the cadence, normality was rejected. The Kruskal–Wallis test revealed no significant main effect on the cadence (K(4, 69) = 2.892, not significant). For the years when the shows were conducted, both normality and homoscedasticity were rejected. The Kruskal–Wallis test revealed a significant main effect on the years when the shows were conducted (K(4, 69) = 12.759, p = 0.013). Post hoc analyses revealed that the median year of a show was significantly earlier for Cluster 1 than it was for Cluster 5, with the medium effect size (p < 0.001, r = 0.41). The median (interquartile range (IQR)) cadence (steps/min) and the year when a show was conducted in each cluster are listed in Table 1.
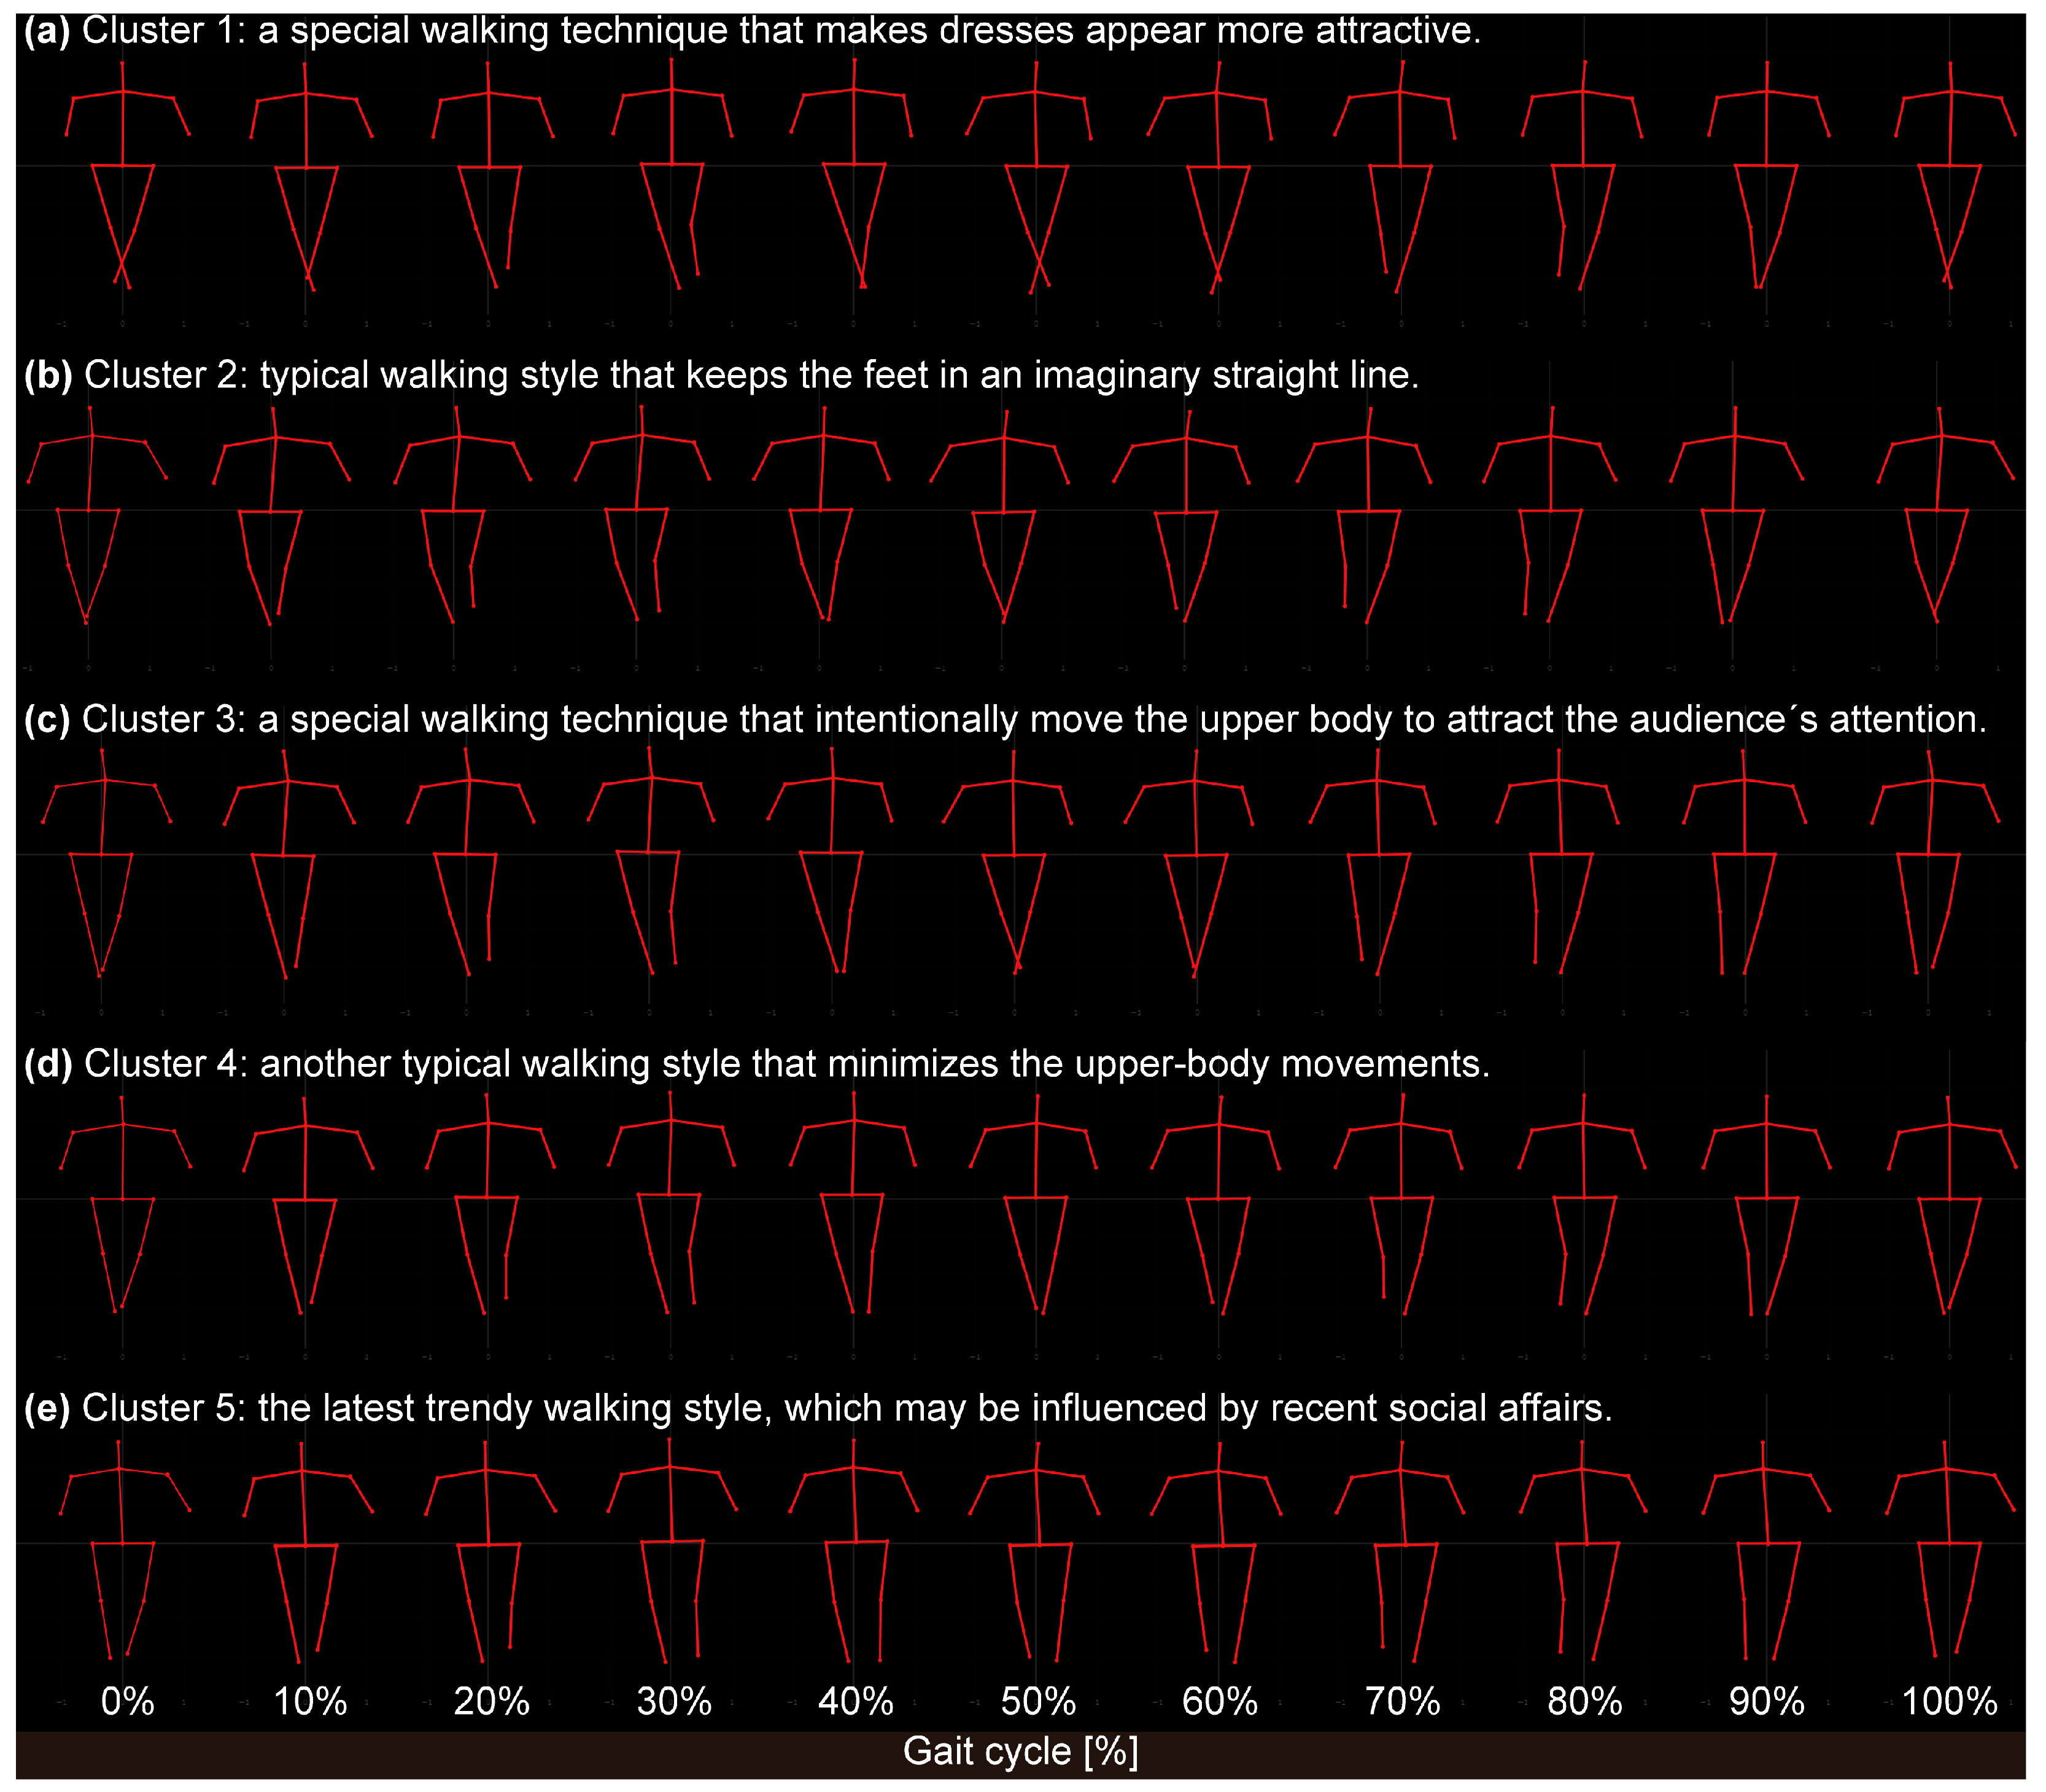
3.3. Reconstructed Walking Styles
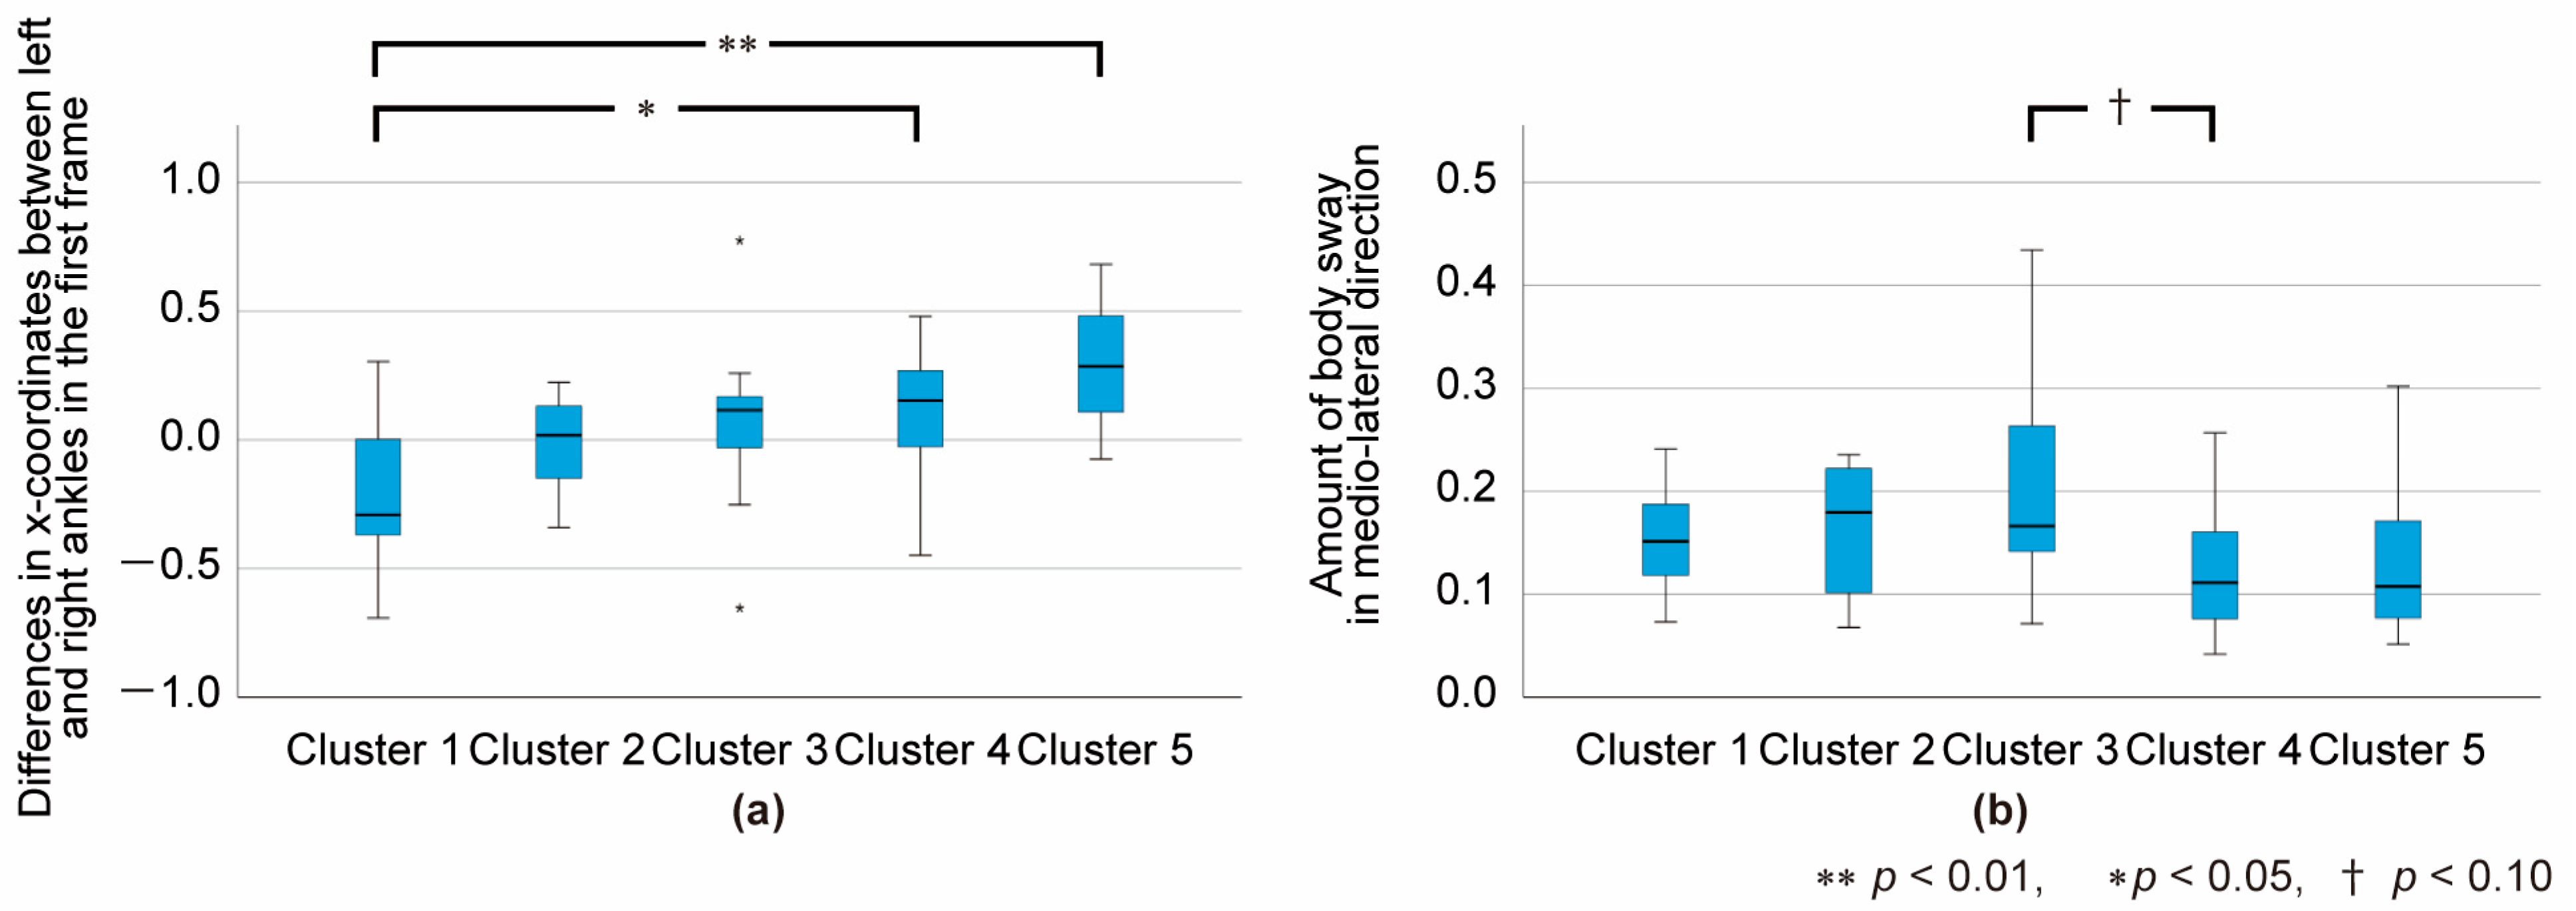
Figure 3a–e show the skeletal coordinates representing the walking styles of each cluster. Each subfigure represents a consecutive 10% segment of the gait cycle. The full animation movies can be downloaded from the Supplementary Material. As shown, the stick figures in Cluster 1 crossed their legs most exaggeratedly, and the level of leg crossing decreased in the order of Clusters 2, 3, 4, and 5. In Clusters 4 and 5, the skeletal figures did not cross their legs. Therefore, we compared the medio-lateral distance between the left- and right-ankle landmarks in the first frame (at the timing of heel contact) among the clusters. After confirming both the normality and homoscedasticity of the data, a one-way ANOVA was applied. The results revealed a significant main effect with the large effect size (F(4, 69) = 5.429, p < 0.001, η2 = 0.253), and multiple comparisons indicated significant differences between Clusters 1 and 4 (p < 0.05) and Clusters 1 and 5 (p < 0.01), as shown in Figure 4a.
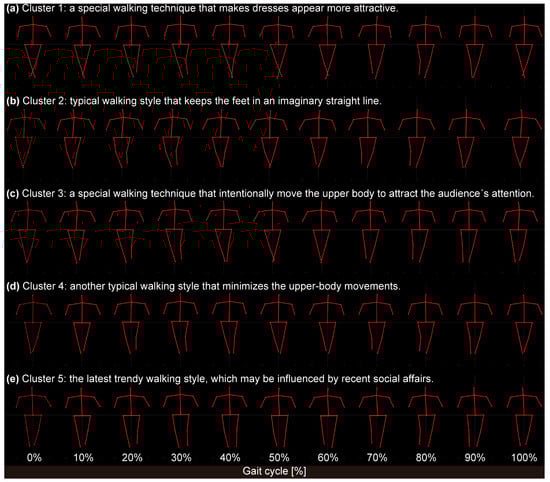
Figure 3.
Reconstructed stick figures representing the walking styles of models in each cluster: (a) Cluster 1, (b) Cluster 2, (c) Cluster 3, (d) Cluster 4, and (e) Cluster 5. Each subfigure represents a consecutive 10% segment of the gait cycle. Full animation movies can be downloaded from Supplementary Material.
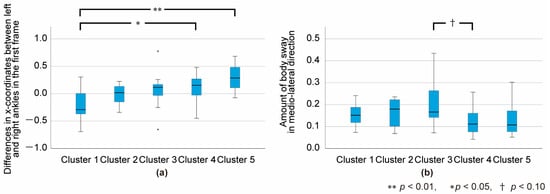
Figure 4.
Box plot representing the gait features of each cluster: (a) medio-lateral distance between left- and right-ankle landmarks at the timing of heel contact; (b) amount of body sway in the medio-lateral direction. Pairs with significant or near-significant differences are marked in the figure.
The model in Cluster 3 tended to walk with a swaying upper body. Therefore, we compared the range of the neck landmark motion in the medio-lateral direction during the entire gait cycle among the clusters. Because the normality of the data was rejected, we applied the Kruskal–Wallis test. As a result, a significant main effect (K(4, 69) = 9.794; p < 0.05) was confirmed. Multiple comparisons indicated near-significant differences between Clusters 3 and 4 with the medium effect size (p = 0.63, r = 0.33), as shown in Figure 4b.
4. Discussion
This study aimed to quantify and report the features of past and current trendy walking styles directed by the world’s leading brands. Therefore, we quantitatively analyzed the gaits of fashion models during real-world runway performances using publicly available video resources, human pose detection technology, and multivariate human-movement analysis techniques. Our results revealed that (1) the gaits of the fashion models analyzed in this study could be classified into five clusters; (2) the median year for the shows in each cluster became more recent in the order of Clusters 1, 2, 4, 3, and 5, with a significant difference observed between Clusters 1 and 5; and (3) the level of leg crossing has decreased in shows conducted more recently. Accordingly, we concluded that the level of leg crossing while walking is one of the major changes in trendy walking styles, from the past to the present, directed by the world’s leading brands. Detailed discussions of each cluster are described as follows.
4.1. Detailed Interpretations of Five Clusters
Cluster 1 was the oldest among the five clusters, comprising 11 videos from the early 2000s to the mid-2010s (Table 1). The reconstructed walking style clearly indicates that the models in Cluster 1 tended to walk with their legs crossed in the most exaggerated manner among the five clusters, with small trunk movements. According to the Fashion Republic forum [25], exaggerated cross-legged walking causes clothing to drape in a visually appealing, fluid manner. Indeed, several models classified in this cluster wore long skirts that moved along the models’ legs as they walked. Accordingly, the walking style of Cluster 1 can be interpreted as a special walking technique that makes dresses, such as long skirts, appear more attractive. However, these walking styles and fashions may not be recommended by the latest trends of the world’s leading brands, as evidenced by the fact that no shows after 2017 are included in this cluster.
Cluster 2 was the second oldest among the five clusters, and the smallest, with only nine videos, as listed in Table 1. The reconstructed stick figures indicate that the models in Cluster 2 tended to walk as if following a straight line. Guo et al. [26] stated that “keeping the feet in a straight line of imagination” is one of the basic requirements of walking for fashion models. Therefore, the walking style of Cluster 2 can be interpreted as one of the typical walking styles of fashion models who keep their feet in an imaginary straight line. Considering that the cluster is the smallest of the five and that no resources after 2020 are classified, the walking style of this cluster is likely becoming outdated.
Cluster 3 was the second most recent, with 14 videos included (Table 1). The reconstructed stick figures in this cluster are characterized by a large upper-body swing. Such a walking style is again another basic requirement of the walking style of fashion models, as described by Guo et al. [26]; that is, “upper-body relax, avoid swing range is too big”. However, in actual fashion shows, models seem to occasionally use their upper bodies to attract attention. Regarding the walking style of Karlie Kloss, one of the world’s most famous supermodels, the fashion magazine Elle [27] quoted, “Karlie uses her hips to sashay down the catwalk in heels with exaggerated arm movements to ensure all eyes are on her”. Therefore, the models included in this cluster may have intentionally moved their upper bodies to attract the audience’s attention. This type of walking is still applicable today as well because recent (2021, 2022, and 2023) shows are included in this cluster.
Cluster 4 was the third oldest and was the largest among the five clusters (Table 1). The reconstructed stick figures indicate that the models in this cluster tended to walk with the smallest upper-body motion among the five clusters. As mentioned in the previous paragraph, “upper-body relax, avoid swing range is too big” is described as one of the other basic requirements of the walking style of fashion models [26]. Therefore, the walking style of Cluster 4 can be interpreted as one of the other typical walking styles of fashion models that minimize upper-body movements. Because recent shows (2022 and 2023) are also included in this cluster, this type of walking is still applicable today as well.
Cluster 5 was the latest of the five clusters. A significant difference in the median years of the shows was observed between Cluster 1 and Cluster 5. This cluster had 12 videos, as listed in Table 1. Here, the models appeared to walk with a normal gait, not completely crossing their legs. From the mid-2010s, the keywords “gender neutral” or “gender fluidity” began to attract attention in the fashion scene [28]. Around the same period, “the charter for the well-being of fashion models” was released by an industry coalition [29]. As clothes and shoes become genderless, the gaits of models may also become genderless. Therefore, the walking style of Cluster 5 can be interpreted as the latest trend, which may be influenced by recent social affairs.
4.2. Limitations and Future Perspectives
Owing to the methodology employed, this study has several limitations. First, the image quality and camera angles were not consistent among the analyzed video resources. While considering the detailed criteria and validation methods employed to minimize the impacts of these factors, the reader should also keep these points in mind when interpreting the results. Furthermore, we only used software that utilizes fundamental two-dimensional human pose detection technology (Pose Cap and G-Dig v.2) because misidentified landmarks can be manually corrected. This function was essential for this study to analyze videos of fashion shows for which models sometimes wore flowy dresses. The use of quasi-three-dimensional (or 4D) pose detection technology, which has been recently developed [12,30,31], may provide further understanding of trendy walking styles. Recent studies on impressive walking styles have consistently reported that the pelvic postures in the sagittal plane also play an important role in the aesthetic impressions of gait [32,33,34].
The methodology employed also has some advantages. For example, the use of publicly available videos allow us to analyze the maximum performances of performers. They are conditioned to perform to their maximum potential at competitions and not in the laboratory. Additionally, it is difficult to mimic the atmosphere of a live environment (e.g., the excitement of an audience) in a laboratory setting. We will continue our research, applying the latest sensing technology, to provide beneficial information to fashion models who aspire to the top.
Supplementary Materials
The following supporting information can be downloaded at https://www.mdpi.com/article/10.3390/s24123865/s1, Video S1: CLST1_Animation.mp4, Video S2: CLST2_Animation.mp4, Video S3: CLST3_Animation.mp4, Video S4: CLST4_Animation.mp4, Video S5: CLST1_Animation.mp5.
Author Contributions
Y.K. provided the overall methodology for this study. Y.K. and S.S. performed the analyses. Y.K. drafted the manuscript. All authors contributed notes, edited the manuscript, and provided critical feedback for improving it. All authors have read and agreed to the published version of the manuscript.
Funding
This study was partially supported by the National Institute of Advanced Industrial Science and Technology internal research funds.
Institutional Review Board Statement
This study was deemed exempt from approval by the local institutional review board, as we analyzed only publicly available videos (confirmation ID: H2022-1313). All video data analyzed in this study were used in accordance with the “fair use” policy of YouTube [35] and the rules of the “copyright exception” for noncommercial research [36].
Informed Consent Statement
Not applicable.
Data Availability Statement
The datasets generated and/or analyzed in the current study can be obtained from the corresponding author upon reasonable request.
Conflicts of Interest
Tatsuya Murahori is the CEO of TOKYO GAISHO Inc. The remaining authors declare that this research was conducted in the absence of any commercial or financial relationships that could be interpreted as a potential conflict of interest.
Appendix A. Detailed Consideration of Clusters
Considering insufficient clusters made from only one or two resources and understanding their characteristics was inconsequential to achieve the study objectives. We therefore set the minimum number of data units to be included in each cluster at 7, which is approximately 10% of the total number of data units analyzed (i.e., 69 in total). As previous studies have and several lectures have instructed, we determined the optimal number of clusters comprehensively from the percent changes of the agglomeration schedule coefficients at each stage, in combination with the visual inspection of the dendrogram [37,38,39].
A hierarchical cluster analysis produced the dendrogram shown in Figure 1 and the agglomeration schedule coefficients presented in Table A2 (Appendix C) as outputs. The greatest percent change was found between stages 62 and 63, which indicated that classification into six clusters was optimal. However, in this case, Cluster 6 consists of only two shows (Louis Vuitton 2006 and Valentino 1995), violating the criterion for the minimum number of data units to be included in each cluster. Therefore, we considered classifying the data into five clusters. In this case, all the clusters met the criterion, and the visual inspection of the dendrogram was reasonable as well. Consequently, we concluded that classifying the data into five clusters was considered the most appropriate for interpreting the results.
Appendix B. Verification of the Reliability of the PCA Results
To verify the reliability of the PCA results in this study, we conducted the following test:
- Select 50 data units randomly from 69 data units to create a data subset;
- Repeat procedure 1 to create five different data subsets;
- Apply PCA to each of the data subsets;
- Calculate the correlation coefficients between the original and subset principal component loadings for principal components 1–13.
As a result, the average correlation coefficients for the five datasets were greater than 0.3 for principal components 1–13. This suggests that similar results could have been obtained from the PCA even if different datasets were used. Therefore, we can conclude that the results of the PCA reported in our study are reliable.
Appendix C. Supplemental Tables
Table A1.
List of selected resources. SS: spring/summer.
Table A1.
List of selected resources. SS: spring/summer.
Table A2.
Validation of manually detected heel contact events.
Table A2.
Validation of manually detected heel contact events.
| HC1: Y.K. | HC2: Y.K. | HC1: S.S. | HC2: S.S. | HC1 | HC2 | ||
|---|---|---|---|---|---|---|---|
| ID | Resources | Frame Number | Frame Number | Frame Number | Frame Number | Absolute Difference | Absolute Difference |
| 1 | Dolce & Gabbana 2003 | 16 | 43 | 16 | 43 | 0 | 0 |
| 6 | Dolce & Gabbana 2013 | 21 | 46 | 21 | 46 | 0 | 0 |
| 8 | Dolce & Gabbana 2015 | 18 | 43 | 17 | 43 | 1 | 0 |
| 9 | Dolce & Gabbana 2017 | 27 | 54 | 27 | 54 | 0 | 0 |
| 14 | Dolce & Gabbana 2022 | 14 | 36 | 14 | 38 | 0 | 2 |
| 16 | Louis Vuitton 2003 | 25 | 49 | 26 | 49 | 1 | 0 |
| 18 | Louis Vuitton 2006 | 25 | 49 | 24 | 48 | 1 | 1 |
| 21 | Louis Vuitton 2015 | 25 | 51 | 26 | 51 | 1 | 0 |
| 30 | Valentino 1998 | 30 | 57 | 29 | 56 | 1 | 1 |
| 34 | Valentino 2005 | 32 | 59 | 32 | 59 | 0 | 0 |
| 36 | Valentino 2012 | 17 | 43 | 18 | 43 | 1 | 0 |
| 39 | Valentino 2015 | 15 | 42 | 16 | 42 | 1 | 0 |
| 41 | Valentino 2018 | 18 | 43 | 18 | 43 | 0 | 0 |
| 43 | Valentino 2021 | 21 | 46 | 20 | 45 | 1 | 1 |
| 49 | Versace 2011 | 12 | 36 | 12 | 36 | 0 | 0 |
| 51 | Versace 2013 | 14 | 39 | 14 | 39 | 0 | 0 |
| 54 | Versace 2016 | 16 | 40 | 17 | 41 | 1 | 1 |
| 68 | Saint Laurent 2019 | 16 | 41 | 14 | 39 | 2 | 2 |
HC: heel contact.
Table A3.
Total variance of principal components.
Table A3.
Total variance of principal components.
| Principal Component | Eigenvalues | Principal Component | Eigenvalues | ||||
|---|---|---|---|---|---|---|---|
| Total | % of Variance | Cumulative % | Total | % of Variance | Cumulative % | ||
| 1 | 261.631 | 19.776 | 19.776 | 31 | 4.733 | 0.358 | 94.764 |
| 2 | 200.914 | 15.186 | 34.962 | 32 | 4.315 | 0.326 | 95.090 |
| 3 | 182.836 | 13.82 | 48.782 | 33 | 4.228 | 0.320 | 95.409 |
| 4 | 101.47 | 7.670 | 56.451 | 34 | 4.013 | 0.303 | 95.713 |
| 5 | 68.524 | 5.179 | 61.631 | 35 | 3.877 | 0.293 | 96.006 |
| 6 | 52.543 | 3.972 | 65.602 | 36 | 3.421 | 0.259 | 96.264 |
| 7 | 44.647 | 3.375 | 68.977 | 37 | 3.241 | 0.245 | 96.509 |
| 8 | 39.104 | 2.956 | 71.933 | 38 | 3.019 | 0.228 | 96.738 |
| 9 | 31.303 | 2.366 | 74.299 | 39 | 2.892 | 0.219 | 96.956 |
| 10 | 28.842 | 2.180 | 76.479 | 40 | 2.788 | 0.211 | 97.167 |
| 11 | 22.418 | 1.694 | 78.173 | 41 | 2.702 | 0.204 | 97.371 |
| 12 | 19.439 | 1.469 | 79.643 | 42 | 2.532 | 0.191 | 97.563 |
| 13 | 19.056 | 1.440 | 81.083 | 43 | 2.502 | 0.189 | 97.752 |
| 14 | 17.008 | 1.286 | 82.368 | 44 | 2.324 | 0.176 | 97.927 |
| 15 | 16.480 | 1.246 | 83.614 | 45 | 2.153 | 0.163 | 98.090 |
| 16 | 15.797 | 1.194 | 84.808 | 46 | 1.977 | 0.149 | 98.240 |
| 17 | 14.927 | 1.128 | 85.936 | 47 | 1.830 | 0.138 | 98.378 |
| 18 | 13.764 | 1.040 | 86.977 | 48 | 1.756 | 0.133 | 98.511 |
| 19 | 12.733 | 0.962 | 87.939 | 49 | 1.734 | 0.131 | 98.642 |
| 20 | 10.693 | 0.808 | 88.747 | 50 | 1.606 | 0.121 | 98.763 |
| 21 | 9.769 | 0.738 | 89.486 | 51 | 1.52 | 0.115 | 98.878 |
| 22 | 9.515 | 0.719 | 90.205 | 52 | 1.431 | 0.108 | 98.986 |
| 23 | 8.678 | 0.656 | 90.861 | 53 | 1.344 | 0.102 | 99.088 |
| 24 | 8.190 | 0.619 | 91.480 | 54 | 1.273 | 0.096 | 99.184 |
| 25 | 8.062 | 0.609 | 92.089 | 55 | 1.137 | 0.086 | 99.27 |
| 26 | 7.134 | 0.539 | 92.629 | 56 | 1.112 | 0.084 | 99.354 |
| 27 | 6.474 | 0.489 | 93.118 | 57 | 1.050 | 0.079 | 99.433 |
| 28 | 5.943 | 0.449 | 93.567 | ||||
| 29 | 5.658 | 0.428 | 93.995 | ||||
| 30 | 5.441 | 0.411 | 94.406 | ||||
Table A4.
Agglomeration schedule provided by HCA.
Table A4.
Agglomeration schedule provided by HCA.
| Stage | Combined Clusters | Coefficients | Stage at Which the Cluster First Appears | Next Stage | ||
|---|---|---|---|---|---|---|
| Cluster 1 | Cluster 2 | Cluster 1 | Cluster 2 | |||
| 1 | 39 | 53 | 0.994 | 0 | 0 | 16 |
| 2 | 22 | 64 | 2.608 | 0 | 0 | 11 |
| 3 | 31 | 51 | 4.603 | 0 | 0 | 15 |
| 4 | 23 | 67 | 6.677 | 0 | 0 | 16 |
| 5 | 52 | 65 | 9.029 | 0 | 0 | 32 |
| 6 | 15 | 21 | 11.692 | 0 | 0 | 19 |
| 7 | 11 | 20 | 14.360 | 0 | 0 | 22 |
| 8 | 36 | 57 | 17.112 | 0 | 0 | 29 |
| 9 | 19 | 55 | 20.687 | 0 | 0 | 29 |
| 10 | 12 | 50 | 24.324 | 0 | 0 | 17 |
| 11 | 22 | 68 | 28.195 | 2 | 0 | 28 |
| 12 | 41 | 69 | 32.124 | 0 | 0 | 35 |
| 13 | 17 | 46 | 36.383 | 0 | 0 | 53 |
| 14 | 4 | 7 | 40.649 | 0 | 0 | 23 |
| 15 | 31 | 49 | 44.916 | 3 | 0 | 37 |
| 16 | 23 | 39 | 49.184 | 4 | 1 | 48 |
| 17 | 10 | 12 | 53.572 | 0 | 10 | 38 |
| 18 | 58 | 66 | 58.131 | 0 | 0 | 42 |
| 19 | 15 | 47 | 62.808 | 6 | 0 | 24 |
| 20 | 8 | 14 | 67.498 | 0 | 0 | 44 |
| 21 | 2 | 29 | 72.260 | 0 | 0 | 41 |
| 22 | 11 | 54 | 77.202 | 7 | 0 | 48 |
| 23 | 4 | 5 | 82.210 | 14 | 0 | 58 |
| 24 | 15 | 44 | 87.270 | 19 | 0 | 46 |
| 25 | 61 | 62 | 92.967 | 0 | 0 | 50 |
| 26 | 9 | 32 | 98.941 | 0 | 0 | 36 |
| 27 | 13 | 33 | 105.013 | 0 | 0 | 39 |
| 28 | 22 | 37 | 111.342 | 11 | 0 | 31 |
| 29 | 19 | 36 | 117.783 | 9 | 8 | 32 |
| 30 | 6 | 48 | 124.437 | 0 | 0 | 38 |
| 31 | 22 | 45 | 131.447 | 28 | 0 | 46 |
| 32 | 19 | 52 | 138.884 | 29 | 5 | 53 |
| 33 | 16 | 60 | 146.627 | 0 | 0 | 43 |
| 34 | 27 | 43 | 154.417 | 0 | 0 | 49 |
| 35 | 41 | 42 | 162.358 | 12 | 0 | 37 |
| 36 | 1 | 9 | 171.666 | 0 | 26 | 58 |
| 37 | 31 | 41 | 181.129 | 15 | 35 | 47 |
| 38 | 6 | 10 | 191.068 | 30 | 17 | 51 |
| 39 | 13 | 59 | 201.125 | 27 | 0 | 45 |
| 40 | 30 | 38 | 211.187 | 0 | 0 | 52 |
| 41 | 2 | 3 | 221.706 | 21 | 0 | 47 |
| 42 | 56 | 58 | 232.444 | 0 | 18 | 57 |
| 43 | 16 | 63 | 243.376 | 33 | 0 | 50 |
| 44 | 8 | 35 | 254.721 | 20 | 0 | 54 |
| 45 | 13 | 34 | 267.346 | 39 | 0 | 51 |
| 46 | 15 | 22 | 280.375 | 24 | 31 | 62 |
| 47 | 2 | 31 | 293.487 | 41 | 37 | 65 |
| 48 | 11 | 23 | 306.696 | 22 | 16 | 59 |
| 49 | 26 | 27 | 320.456 | 0 | 34 | 59 |
| 50 | 16 | 61 | 337.771 | 43 | 25 | 60 |
| 51 | 6 | 13 | 355.717 | 38 | 45 | 57 |
| 52 | 30 | 40 | 374.133 | 40 | 0 | 62 |
| 53 | 17 | 19 | 392.680 | 13 | 32 | 54 |
| 54 | 8 | 17 | 412.592 | 44 | 53 | 63 |
| 55 | 24 | 25 | 433.653 | 0 | 0 | 61 |
| 56 | 18 | 28 | 455.566 | 0 | 0 | 64 |
| 57 | 6 | 56 | 478.205 | 51 | 42 | 64 |
| 58 | 1 | 4 | 501.157 | 36 | 23 | 60 |
| 59 | 11 | 26 | 530.219 | 48 | 49 | 61 |
| 60 | 1 | 16 | 559.464 | 58 | 50 | 65 |
| 61 | 11 | 24 | 590.135 | 59 | 55 | 67 |
| 62 | 15 | 30 | 621.827 | 46 | 52 | 63 |
| 63 | 8 | 15 | 660.884 | 54 | 62 | 66 |
| 64 | 6 | 18 | 700.994 | 57 | 56 | 68 |
| 65 | 1 | 2 | 744.246 | 60 | 47 | 66 |
| 66 | 1 | 8 | 788.376 | 65 | 63 | 67 |
| 67 | 1 | 11 | 835.548 | 66 | 61 | 68 |
| 68 | 1 | 6 | 884.000 | 67 | 64 | 0 |
References
- Koh, Y.; Lee, J. A study of color differences in women’s read-to-wear collections from world fashion cities: Intensive study of the Fall/Winter 2010 collections from New York, London, Milan, and Paris. Color Res. Appl 2013, 38, 463–468. [Google Scholar] [CrossRef]
- Volonté, P. Modelling Practice: The Inertia of Body Ideals in the Fashion. Sociologica 2019, 13, 11–26. [Google Scholar]
- Cao, Z.; Simon, T.; Wei, S.E.; Sheikh, Y. Realtime multi-person 2D pose estimation using part affinity fields. IEEE Trans. Pattern Anal. Mach. Intell. 2019, 43, 172–186. [Google Scholar] [CrossRef] [PubMed]
- Yamamoto, M.; Shimatani, K.; Ishige, Y.; Takemura, H. Verification of gait analysis method fusing camera-based pose estimation and an IMU sensor in various gait conditions. Sci. Rep. 2022, 12, 17719. [Google Scholar] [CrossRef] [PubMed]
- Kobayashi, Y.; Hobara, H.; Heldoorn, T.A.; Kouchi, M.; Mochimaru, M. Age-independent and age-dependent sex differences in gait pattern determined by principal component analysis. Gait Posture 2016, 46, 11–17. [Google Scholar] [CrossRef] [PubMed]
- Sawacha, Z.; Sartor, C.D.; Yi, L.C.; Guiotto, A.; Spolaor, F.; Sacco, I.C.N. Clustering classification of diabetic walking abnormalities: A new approach taking into account intralimb coordination patterns. Gait Posture 2020, 79, 33–40. [Google Scholar] [CrossRef] [PubMed]
- Hobara, H.; Kobayashi, Y.; Mochimaru, M. Spatiotemporal variables of able-bodied and amputee sprinters in men’s 100-m sprint. Int. J. Sports Med. 2015, 36, 494–497. [Google Scholar] [CrossRef]
- Tierney, G.J.; Gildea, K.; Krosshaug, T.; Simms, C.K. Analysis of ball carrier head motion during a rugby union tackle without direct head contact: A case study. Int. J. Sports Sci. Coach. 2019, 14, 190–196. [Google Scholar] [CrossRef]
- Magnani, C.; Ait-Said, E.D. Geometrical analysis of motion schemes on fencing experts from competition videos. PLoS ONE 2021, 16, e0261888. [Google Scholar] [CrossRef]
- Wu, C.H.; Wu, T.C.; Lin, W.B. Exploration of applying pose estimation techniques in table tennis. Appl. Sci. 2023, 13, 1896. [Google Scholar] [CrossRef]
- Segal, Y.; Hadar, O.; Lhotska, L. Using EfficientNet-B7 (CNN), Variational Auto Encoder (VAE) and Siamese Twins’ Networks to Evaluate Human Exercises as Super Objects in a TSSCI Images. J. Pers. Med. 2023, 22, 874. [Google Scholar] [CrossRef] [PubMed]
- TDPT Windows Version v0.6 Released! Available online: https://www.youtube.com/watch?v=Tfo8X86A6RI (accessed on 31 May 2024).
- Women’s Apparel—Worldwide. Available online: https://www.statista.com/outlook/cmo/apparel/women-s-apparel/worldwide (accessed on 7 April 2024).
- Men’s Apparel—Worldwide. Available online: https://www.statista.com/outlook/cmo/apparel/men-s-apparel/worldwide (accessed on 7 April 2024).
- Fashion Model Demographics and Statistics in the US. Available online: https://www.zippia.com/fashion-model-jobs/demographics/ (accessed on 7 April 2024).
- The Social Data Behind the Biggest Fashion Week Shows. 2024. Available online: https://www.brandwatch.com/blog/social-data-biggest-fashion-week-shows/ (accessed on 31 May 2024).
- Furukawa, T.; Miura, C.; Miyatake, K.; Watanabe, A.; Hasegawa, M. Quantitative trend analysis of luxury fashion based on visual impressions of young Japanese women. Int. J. Fash. Des. Technol. Educ. 2016, 10, 146–157. [Google Scholar] [CrossRef]
- An, H.; Park, M. Approaching fashion design trend applications using text mining and semantic network analysis. Fash. Text. 2020, 7, 34. [Google Scholar] [CrossRef]
- Sim, T.K. OpenSim Project Home. Available online: https://simtk.org/projects/opensim (accessed on 31 May 2024).
- Delp, S.L.; Anderson, F.C.; Arnold, A.S.; Loan, P.; Habib, A.; John, C.T.; Guendelman, E.; Thelan, D.G. OpenSim: Open-source software to create and analyze dynamic simulations of movement. IEEE Trans. Biomed. Eng. 2007, 55, 1940–1950. [Google Scholar] [CrossRef]
- Jauhiainen, S.; Pohl, A.J.; Äyrämö, S.; Kauppi, J.P.; Ferber, R. A hierarchical cluster analysis to determine whether injured runners exhibit similar kinematic gait patterns. Scand. J. Med. Sci. Sports 2020, 30, 732–740. [Google Scholar] [CrossRef] [PubMed]
- Deluzio, K.J.; Astephen, J.L. Biomechanical features of gait waveform data associated with knee osteoarthritis: An application of principal component analysis. Gait Posture 2007, 25, 86–93. [Google Scholar] [CrossRef]
- Cohen, J. Statistical Power Analysis for the Behavioral Sciences; Academic Press: Cambridge, MA, USA, 2013. [Google Scholar]
- Field, A. Discovering Statistics Using SPSS, 2nd ed.; Sage Publications: Washington, DC, USA, 2005. [Google Scholar]
- Why Do Models Walk Cross Legged? Available online: https://fashionrepublicmagazine.com/community/runway/why-do-models-walk-cross-legged/ (accessed on 7 April 2024).
- Guo, R.L.; Liu, B.; Huang, H.Y. The study of female fashion Model’s basic walking posture. Adv. Mater. Res. 2011, 332–334, 1272–1275. [Google Scholar] [CrossRef]
- An Analysis of the Most Iconic Supermodel Runway Walks: From Gigi Hadid to Hailey Bieber. 2016. Available online: https://www.elle.com/uk/fashion/celebrity-style/articles/a31869/an-analysis-of-the-most-iconic-supermodel-runway-walks/ (accessed on 7 April 2024).
- Gender Neutrality Becomes Fashion Reality. Available online: https://www.vogue.co.uk/article/gender-neutrality-becomes-fashion-reality (accessed on 7 April 2024).
- Press Release LVMH and Kering Have Drawn up a Charter on Working Relations with Fashion Models and Their Well-Being. Available online: https://r.lvmh-static.com/uploads/2017/09/press-release-models-charter-kering-lvmh-en-def-09-06-17.pdf (accessed on 7 April 2024).
- Aoyagi, Y.; Yamada, S.; Ueda, S.; Iseki, C.; Kondo, T.; Mori, K.; Kobayashi, Y.; Fukami, T.; Hoshimaru, M.; Ishikawa, M.; et al. Development of Smartphone Application for Markerless Three-Dimensional Motion Capture Based on Deep Learning Model. Sensors 2022, 22, 5282. [Google Scholar] [CrossRef]
- Goel, S.; Pavlakos, G.; Rajasegaran, J.; Kanazawa, A.; Malik, J. Humans in 4D: Reconstructing and Tracking Humans with Transformers. In Proceedings of the IEEE/CVF International Conference on Computer Vision, Paris, France, 2–3 October 2023. [Google Scholar]
- Tanabe, H.; Fujii, K.; Kaneko, N.; Yokoyama, H.; Nakazawa, K. Biomechanical strategies to maximize gait attractiveness among women. Front. Sports Act. Living 2023, 5, 1091470. [Google Scholar] [CrossRef]
- Tanabe, H.; Yamamoto, K. Structural equation modeling of female gait attractiveness using gait kinematics. Sci. Rep. 2023, 13, 17823. [Google Scholar] [CrossRef]
- Saito, S.; Saito, M.; Kondo, M.; Kobayashi, Y. Gait pattern can alter aesthetic visual impression from a third-person perspective. Sci. Rep. 2024, 14, 6602. [Google Scholar] [CrossRef] [PubMed]
- YouTube Fair Use Policy. Available online: https://www.youtube.com/howyoutubeworks/policies/copyright/#copyright-exceptions (accessed on 7 April 2024).
- Japanese Law Translation, Copyright Act. Available online: https://www.japaneselawtranslation.go.jp/ja/laws/view/4207 (accessed on 7 April 2024).
- Clough, S.; Tanguay, A.F.; Mutlu, B.; Turkstra, L.S.; Duff, M.C. How do Individuals With and Without Traumatic Brain Injury Interpret Emoji? Similarities and Differences in Perceived Valence, Arousal, and Emotion Representation. J. Nonverbal Behav. 2023, 47, 489–511. [Google Scholar] [CrossRef]
- Hierarchical Cluster Analysis Using SPSS|Agglomeration Schedule| Data Analysis: Part 3. Available online: https://www.youtube.com/watch?v=bNemTjPGWlo (accessed on 16 April 2024).
- Validating a Hierarchical Cluster Analysis. Available online: https://www.youtube.com/watch?v=mSzk2KrbNfs (accessed on 16 April 2024).
Disclaimer/Publisher’s Note: The statements, opinions and data contained in all publications are solely those of the individual author(s) and contributor(s) and not of MDPI and/or the editor(s). MDPI and/or the editor(s) disclaim responsibility for any injury to people or property resulting from any ideas, methods, instructions or products referred to in the content. |
© 2024 by the authors. Licensee MDPI, Basel, Switzerland. This article is an open access article distributed under the terms and conditions of the Creative Commons Attribution (CC BY) license (https://creativecommons.org/licenses/by/4.0/).