


Numerical Simulation Study on the Influence of Fracture on Borehole Wave Modes: Insights from Fracture Width, Filling Condition, and Acoustic Frequency

 ,
,
Abstract
1. Introduction
2. Numerical Simulation Method of Acoustic Logging in Fractured Formation
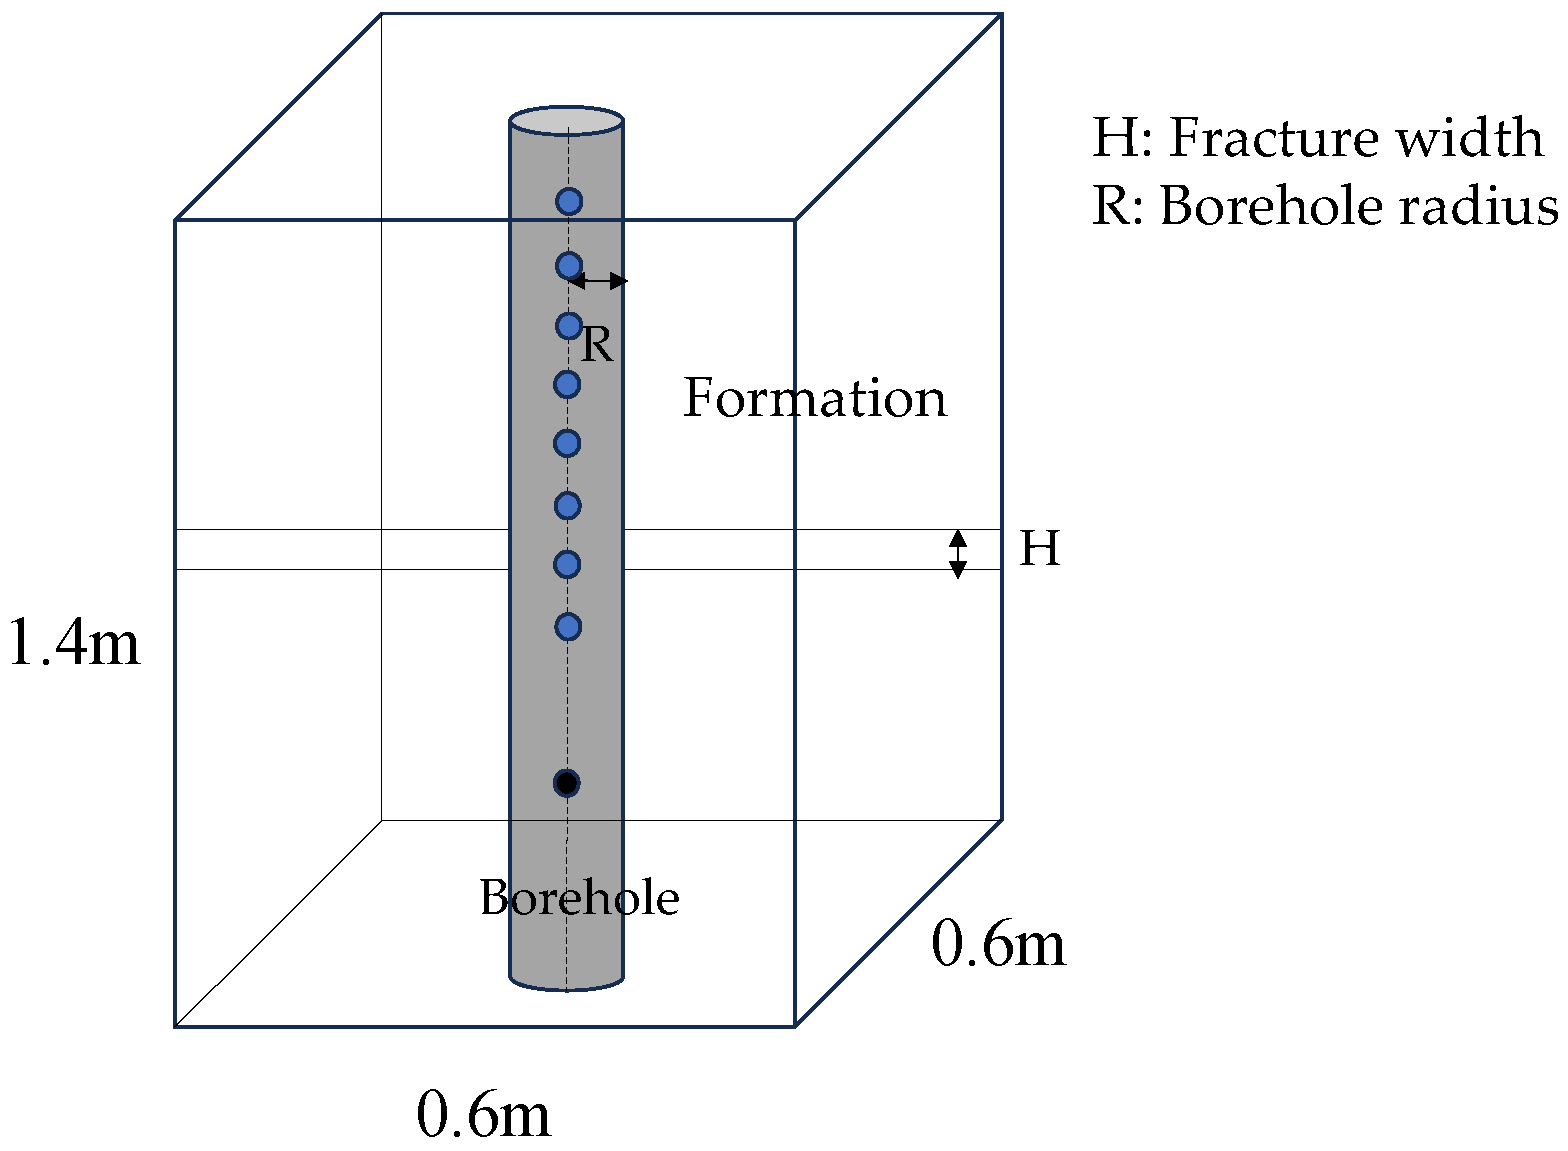
2.1. Parameters of Numerical Model
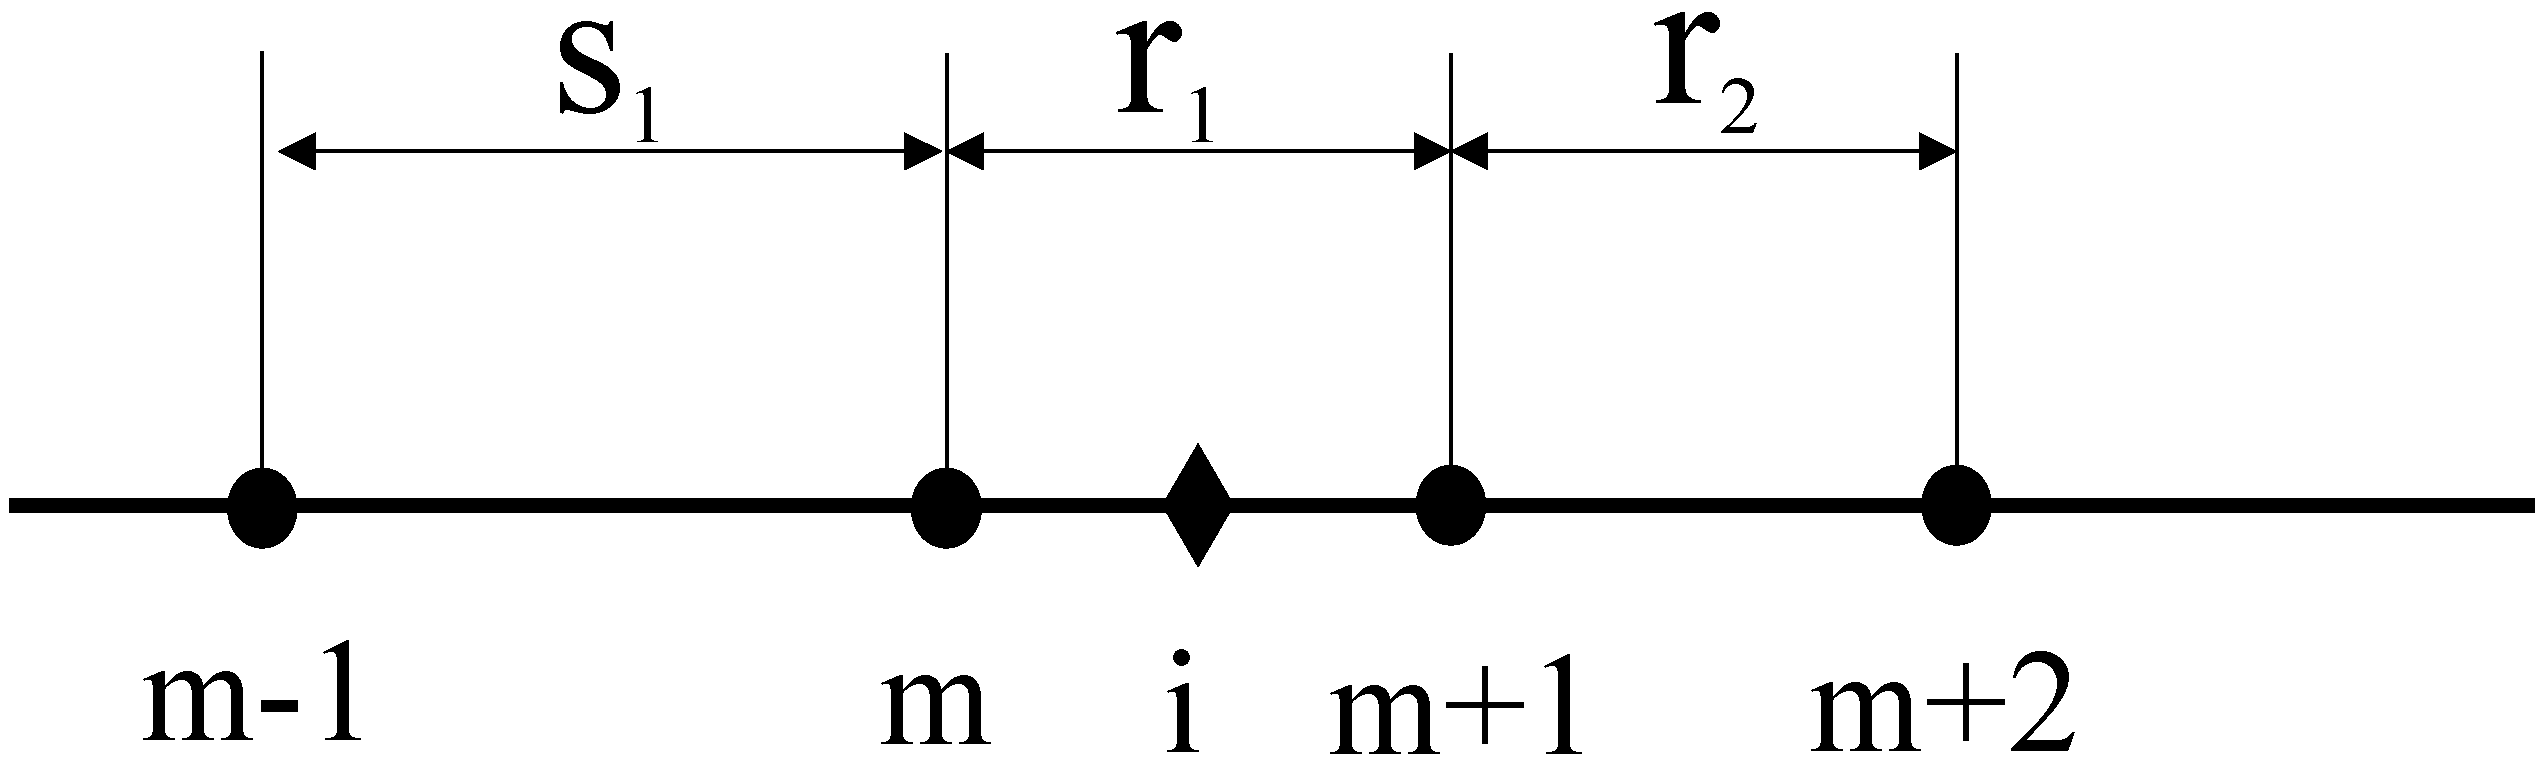
2.2. The 3D Variable Mesh Finite Difference Numerical Simulation Method
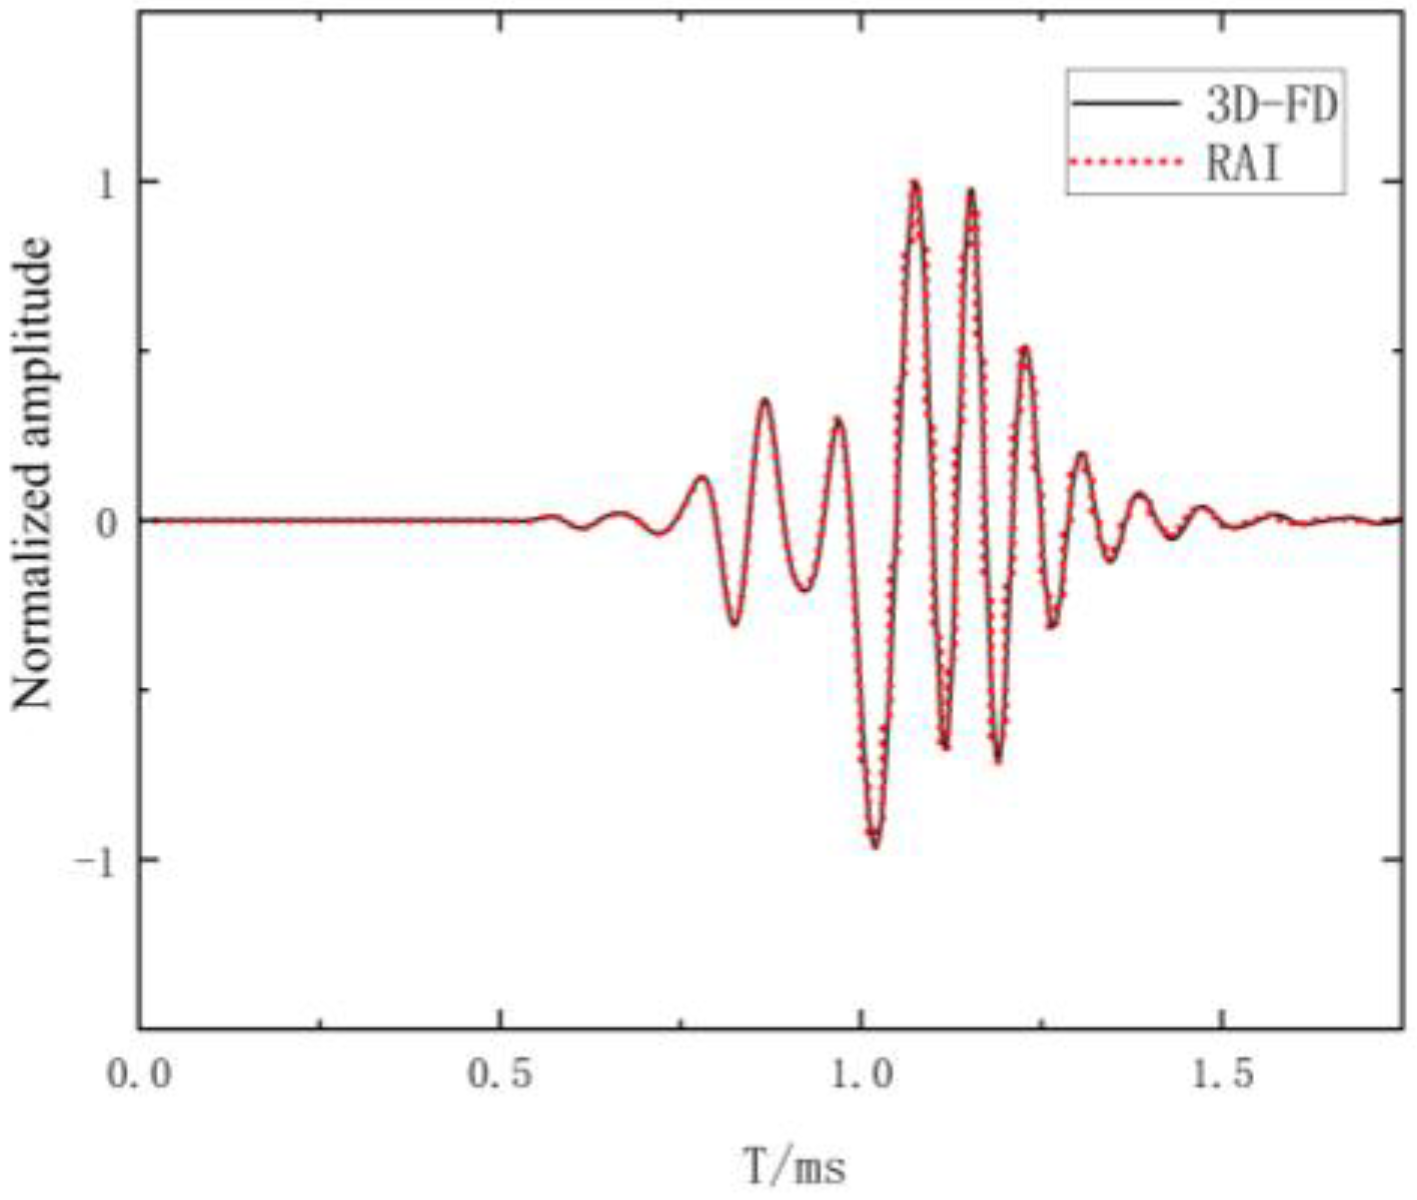
2.3. Verification of Numerical Simulation Program
3. Numerical Simulation and Analysis of Acoustic Logging in Fractured Formation
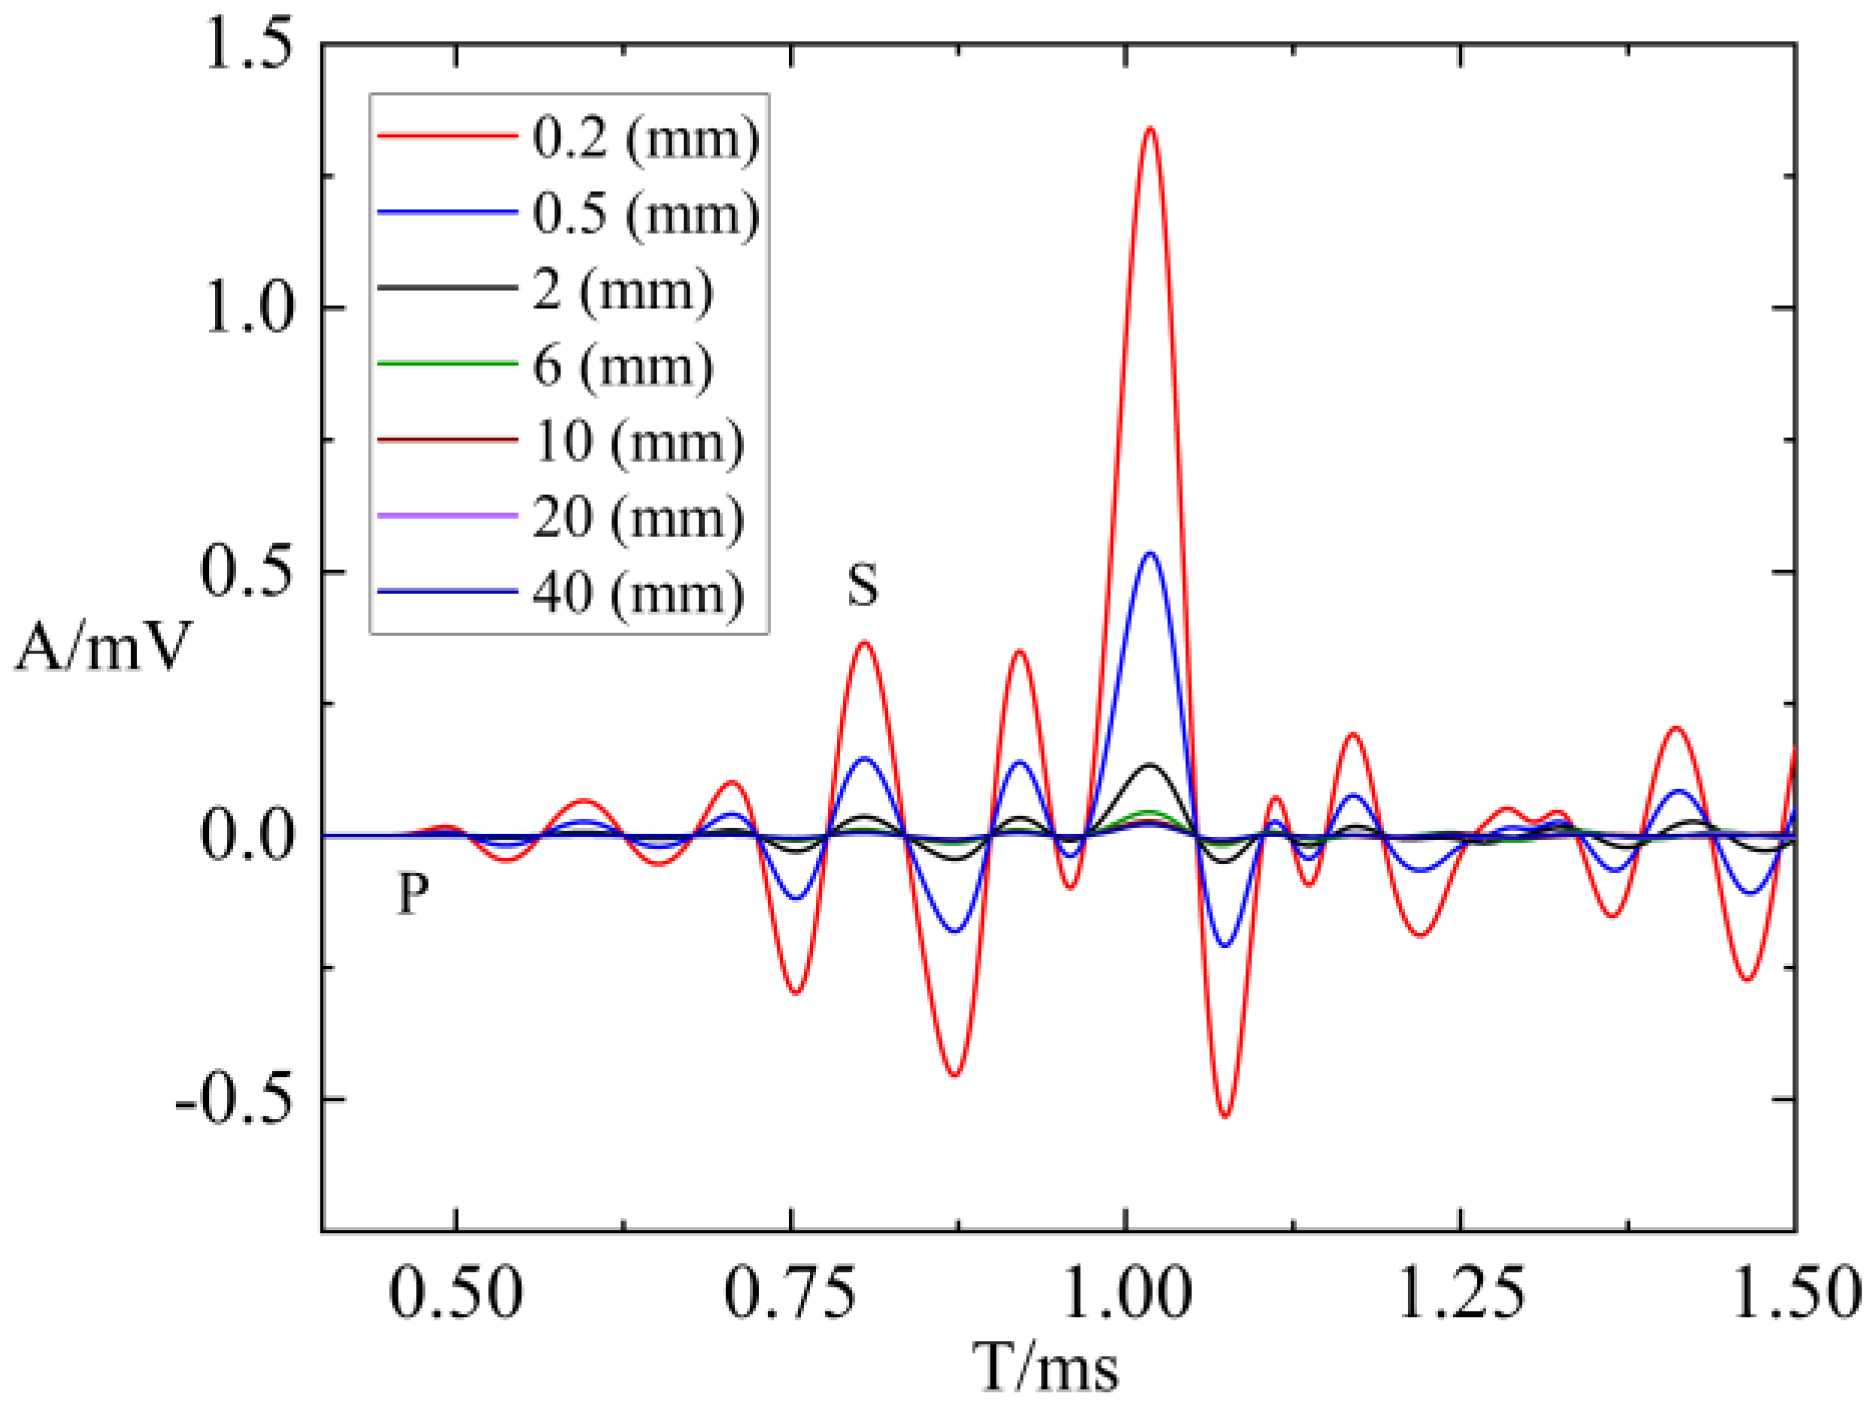
3.1. Influence of Fracture Width on Borehole Wave Modes
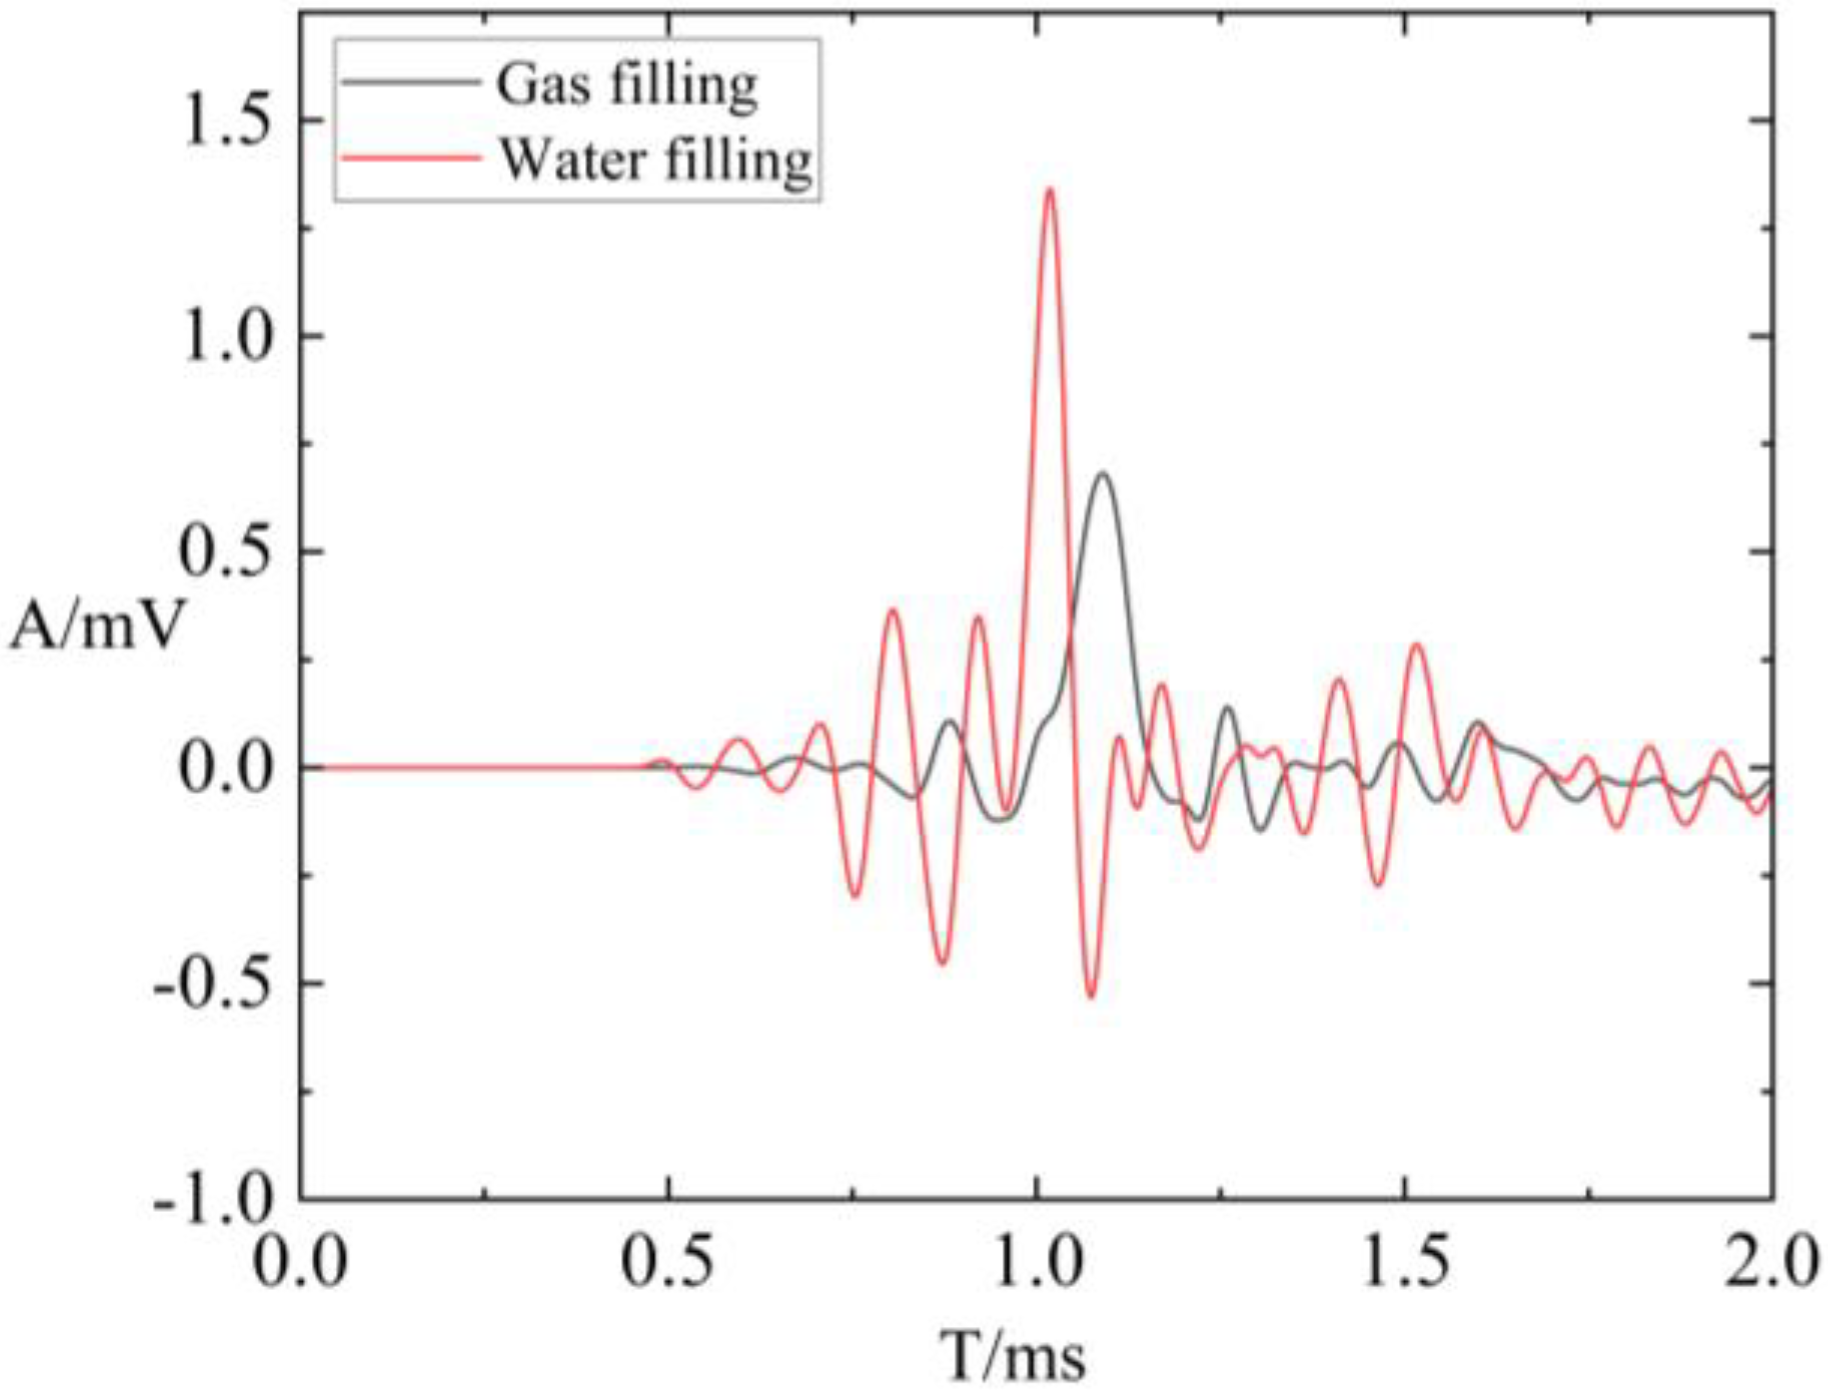
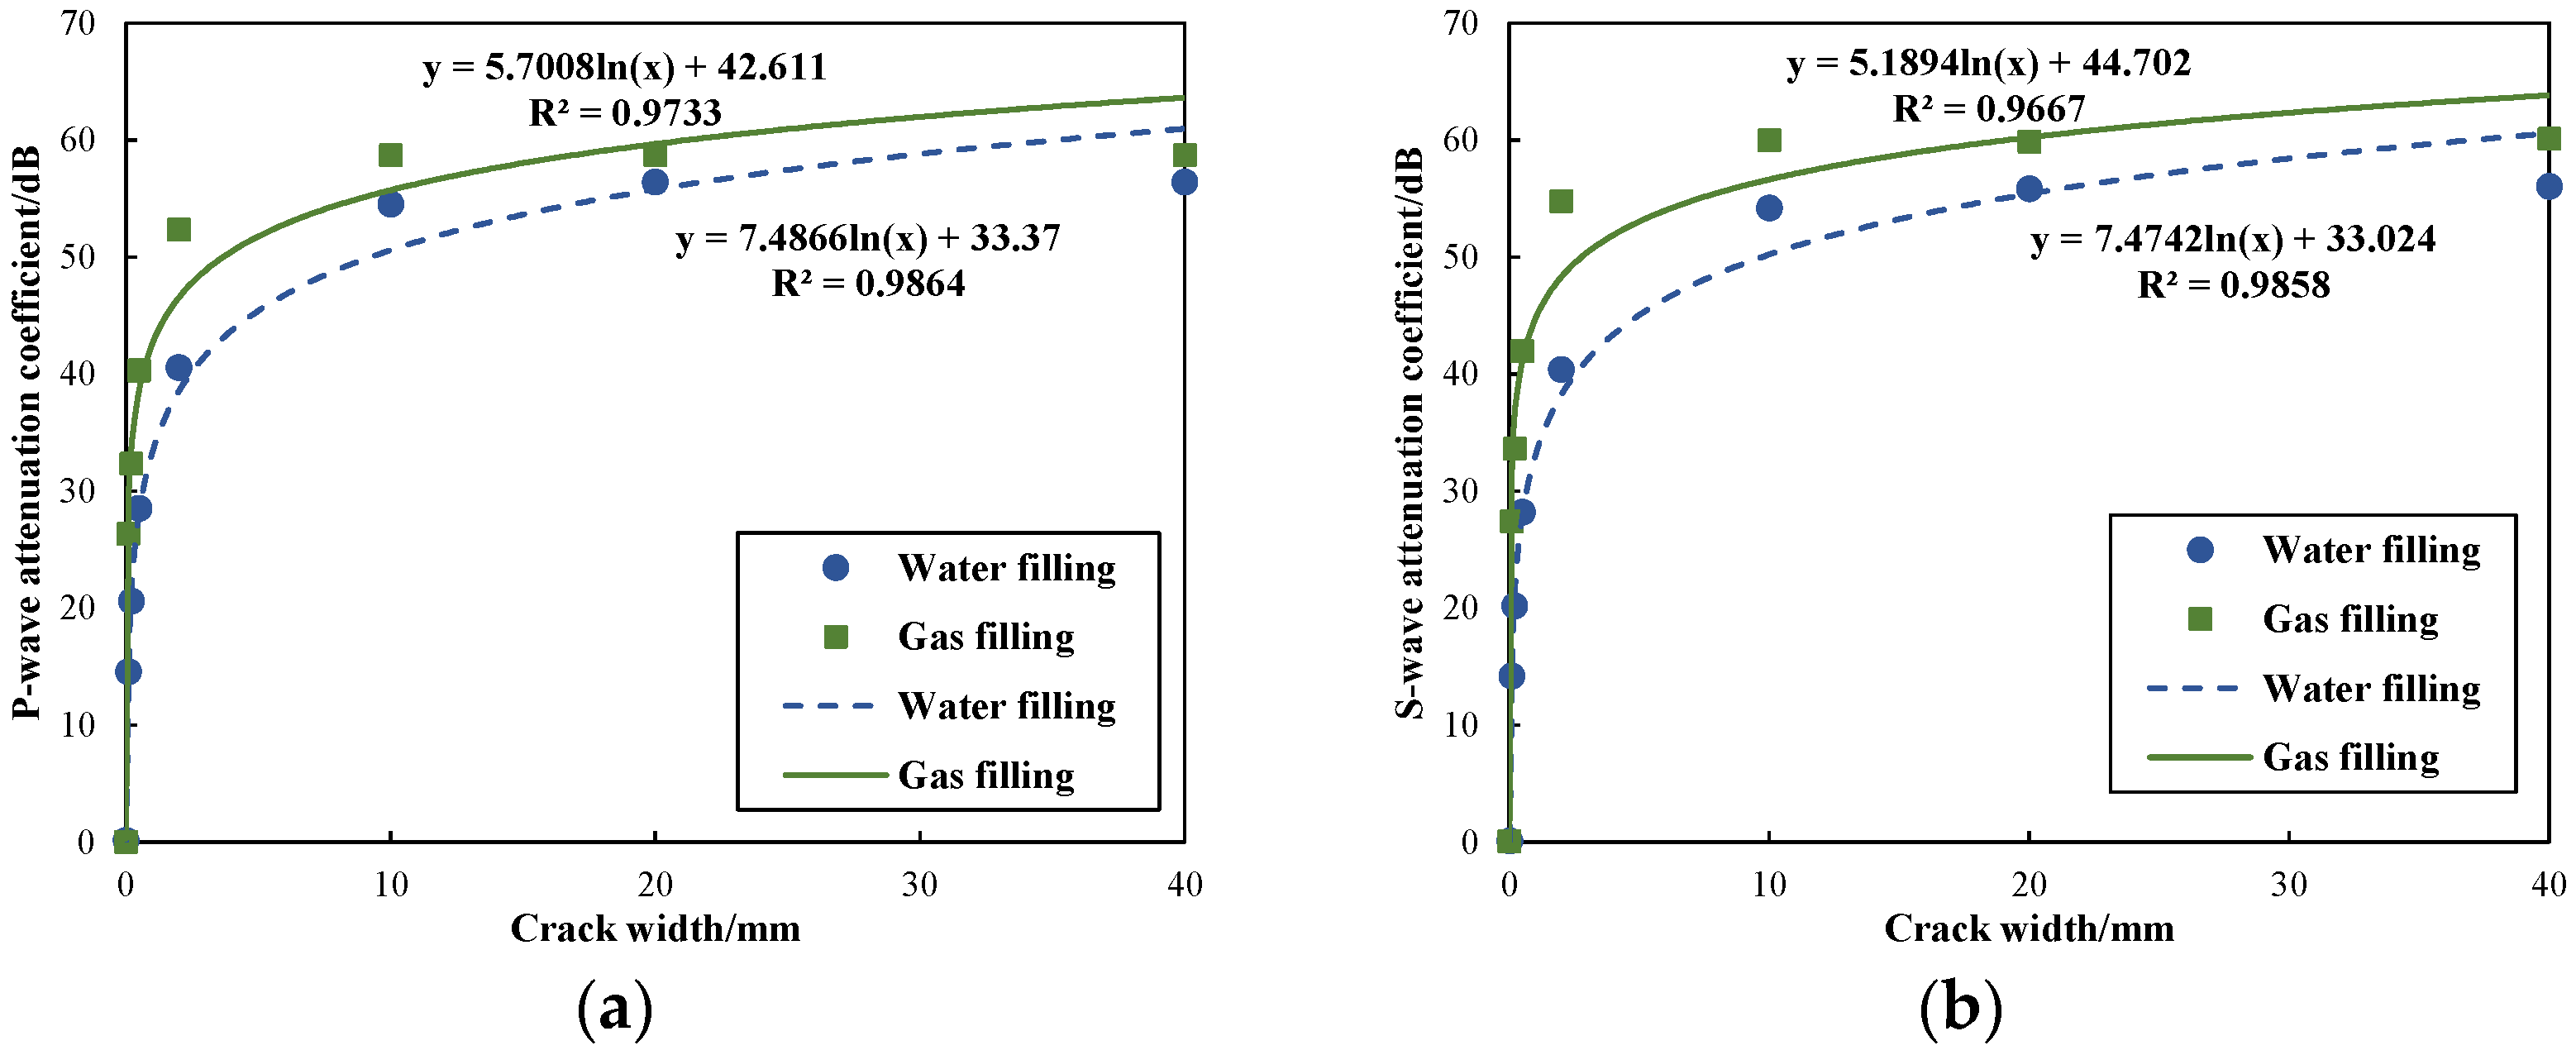
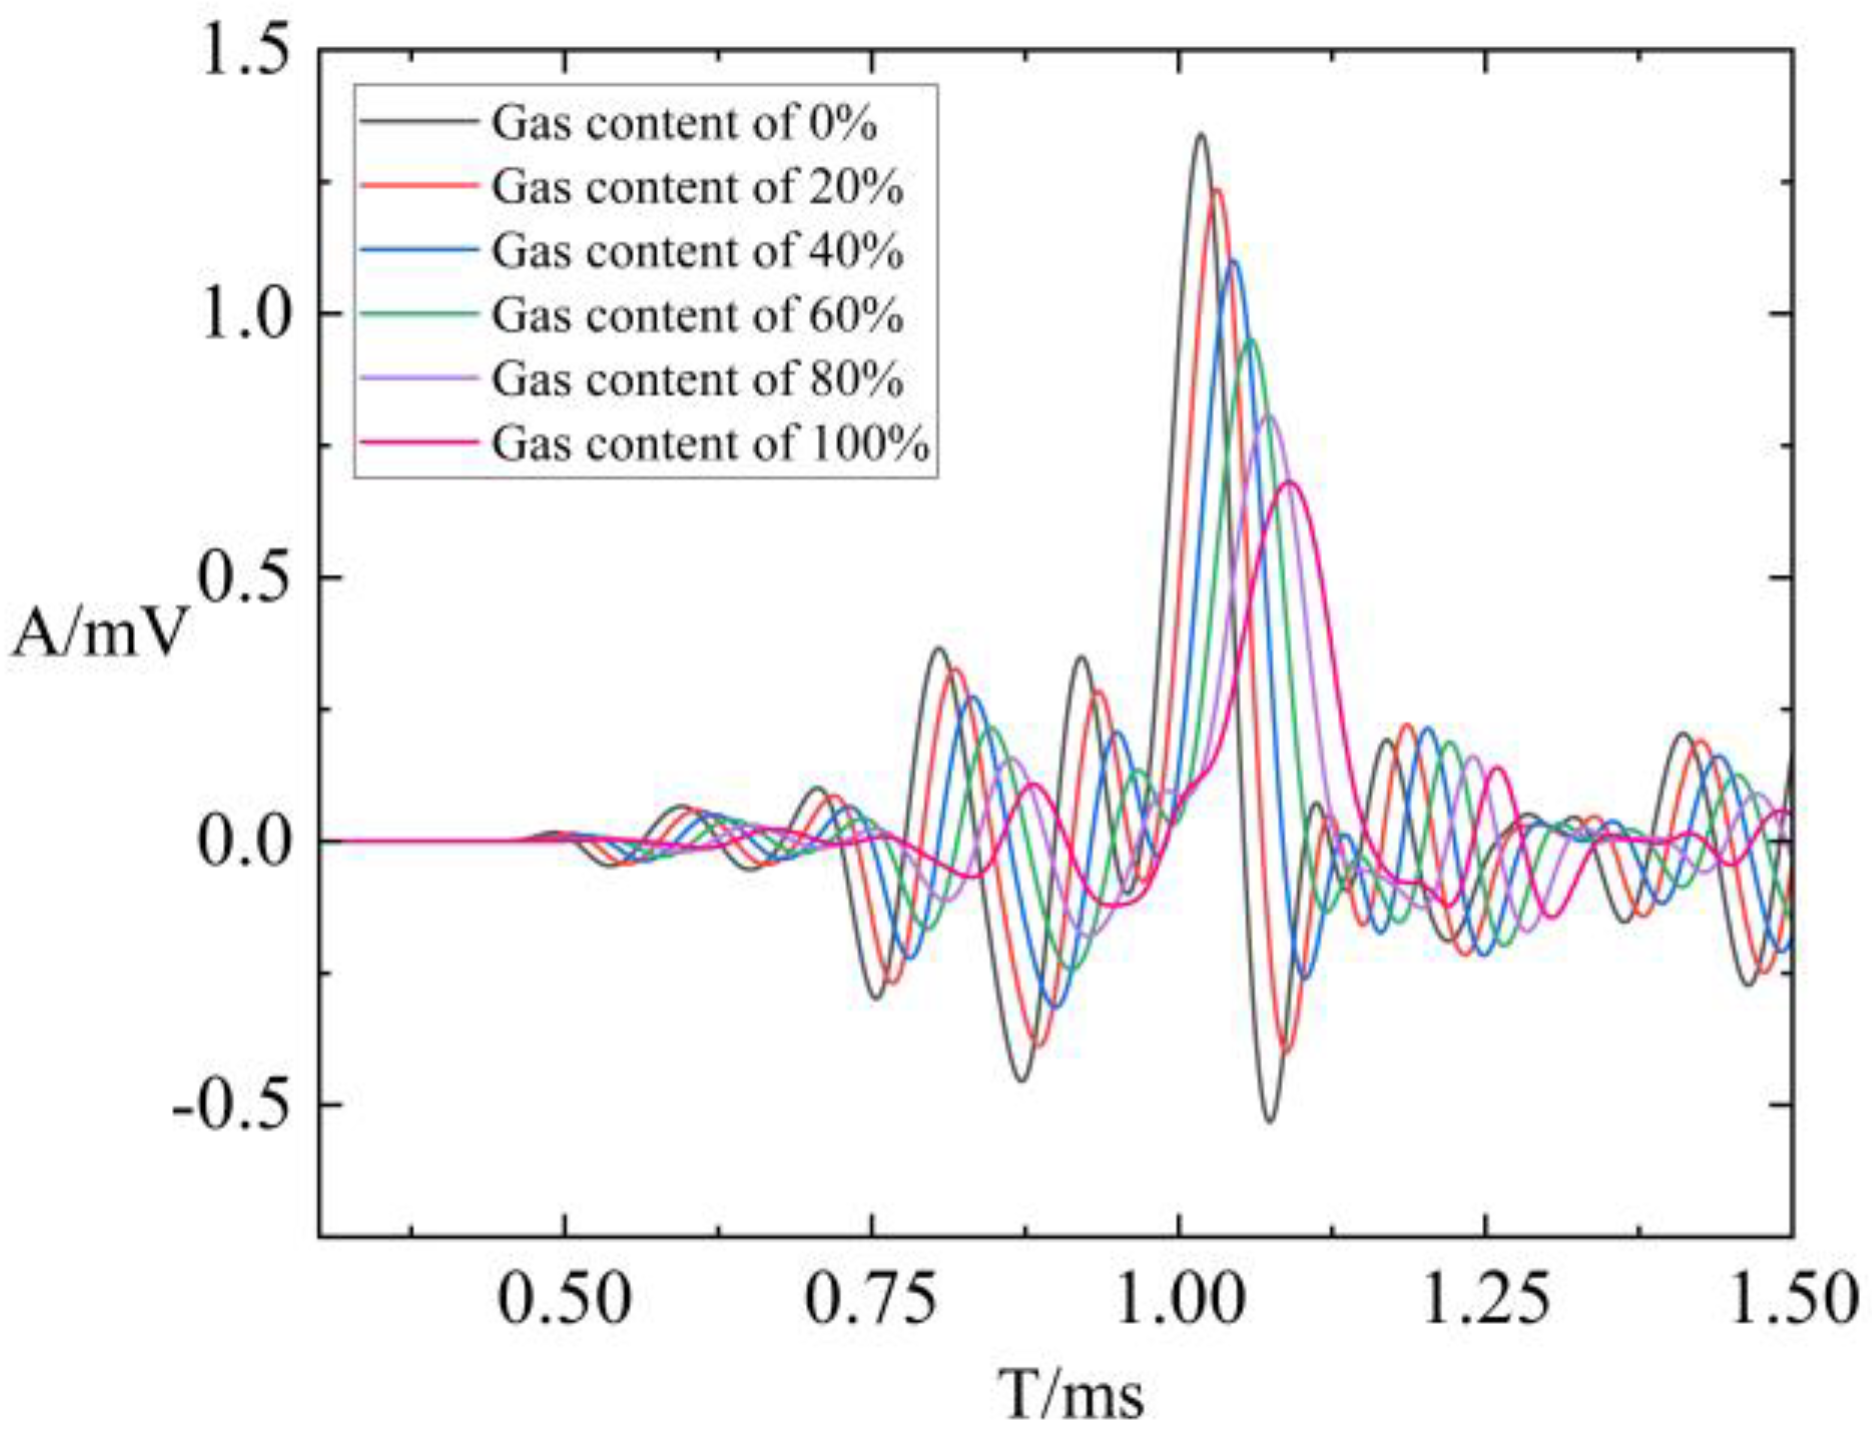
3.2. Influence of Fracture-Filling Conditions on Borehole Wave Modes
3.3. Influence of Acoustic Frequency on Borehole Wave Modes
4. Conclusions
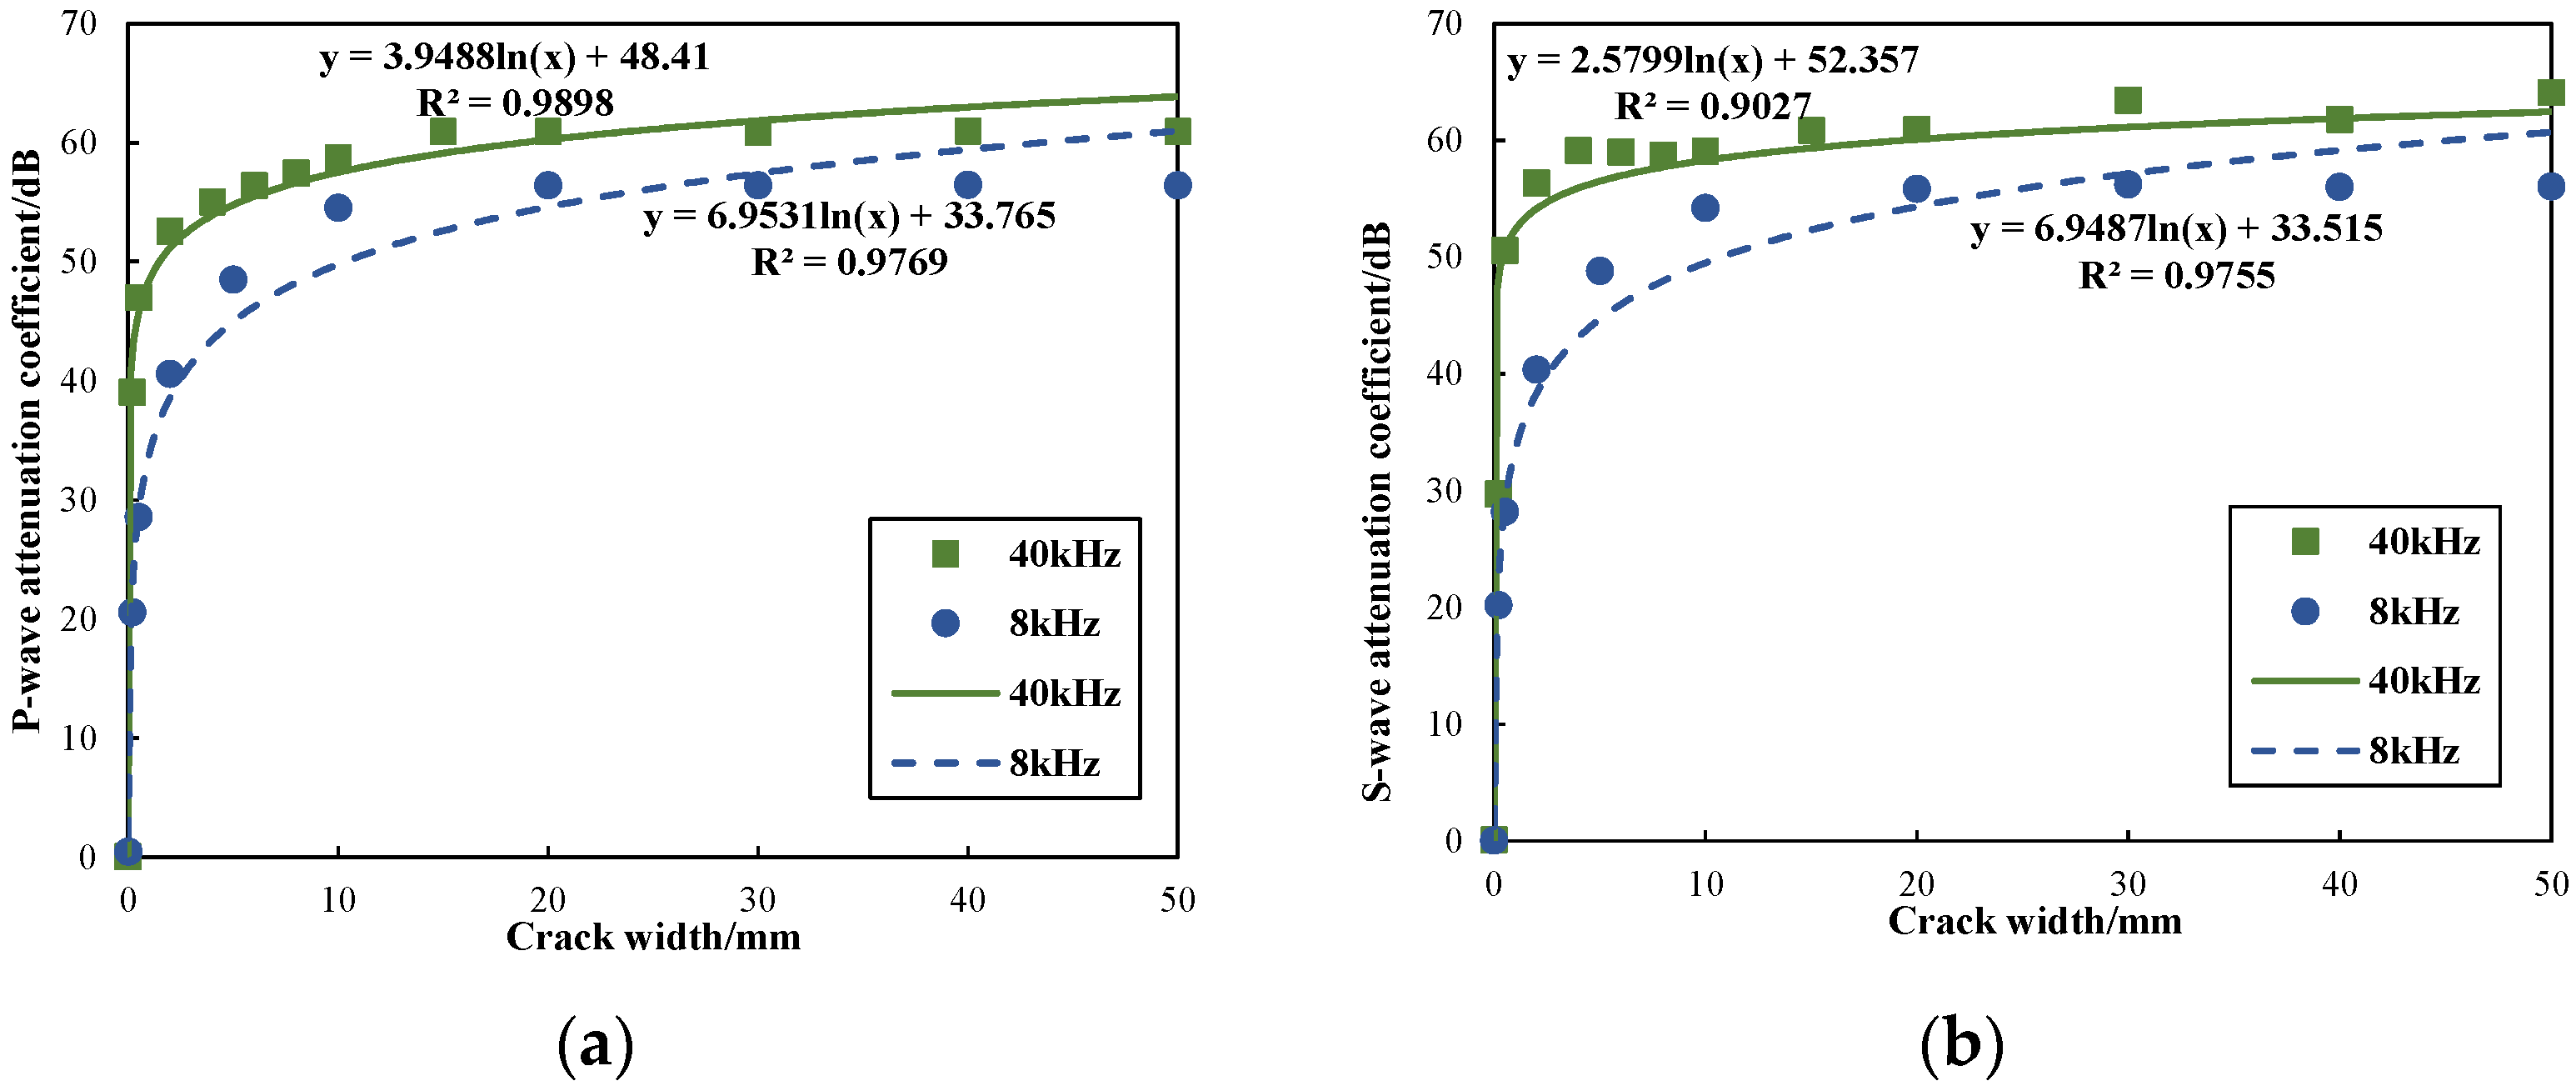
- (1)
- The attenuation coefficients of refracted P-waves and S-waves exhibit a logarithmic increase as the fracture width increases. Particularly, when the fracture width was within 2 mm, there was a significant rise in the attenuation coefficients of refracted P-waves and S-waves, indicating their sensitivity to micro-fractures. However, as the fracture width expanded to 10 mm, their attenuation coefficients stabilized, exhibiting a decreasing rate of attenuation increase. This suggests that P-waves and S-waves exhibit lower sensitivity to macro-fractures.
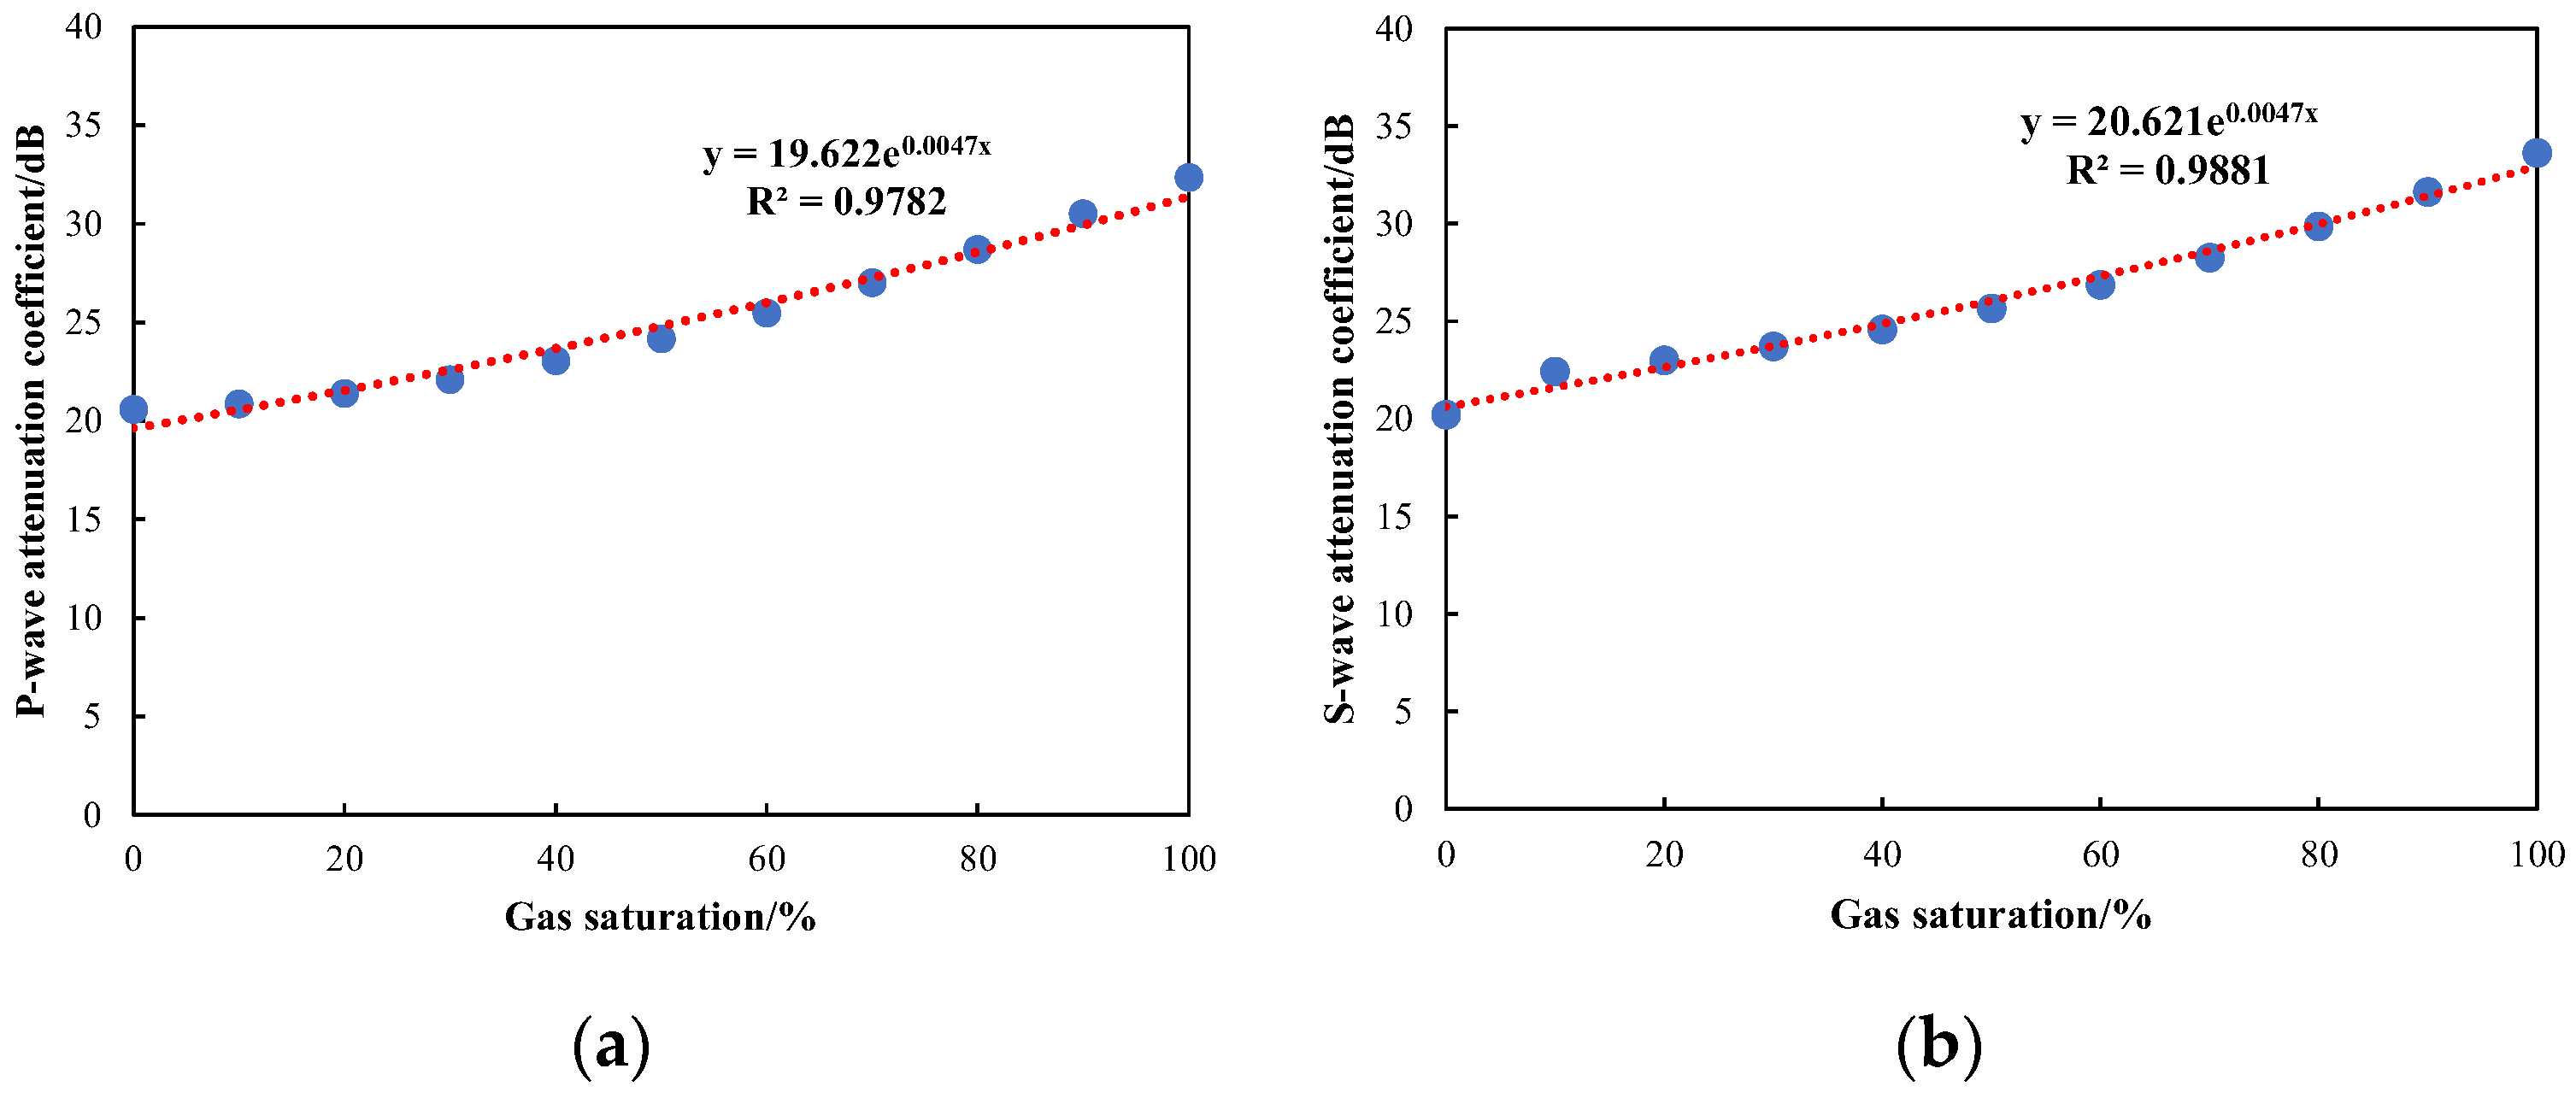
- (2)
- When the source dominant frequency and fracture width are fixed, fractures filled with gas experience faster attenuation compared to those filled with water. The attenuation coefficients of compressional and shear waves in gas-filled fractures consistently exceed those in water-filled fractures, with the difference being particularly noticeable in shear wave attenuation. Furthermore, through quantitative analysis, it was observed that the attenuation coefficients of both refracted compressional and shear waves exhibit an exponential variation with gas saturation. Under the determined fracture parameters, this functional relationship can be further utilized for the quantitative prediction of gas saturation in fractures. It provides a new means for identifying and predicting fluid properties in fractured reservoirs.
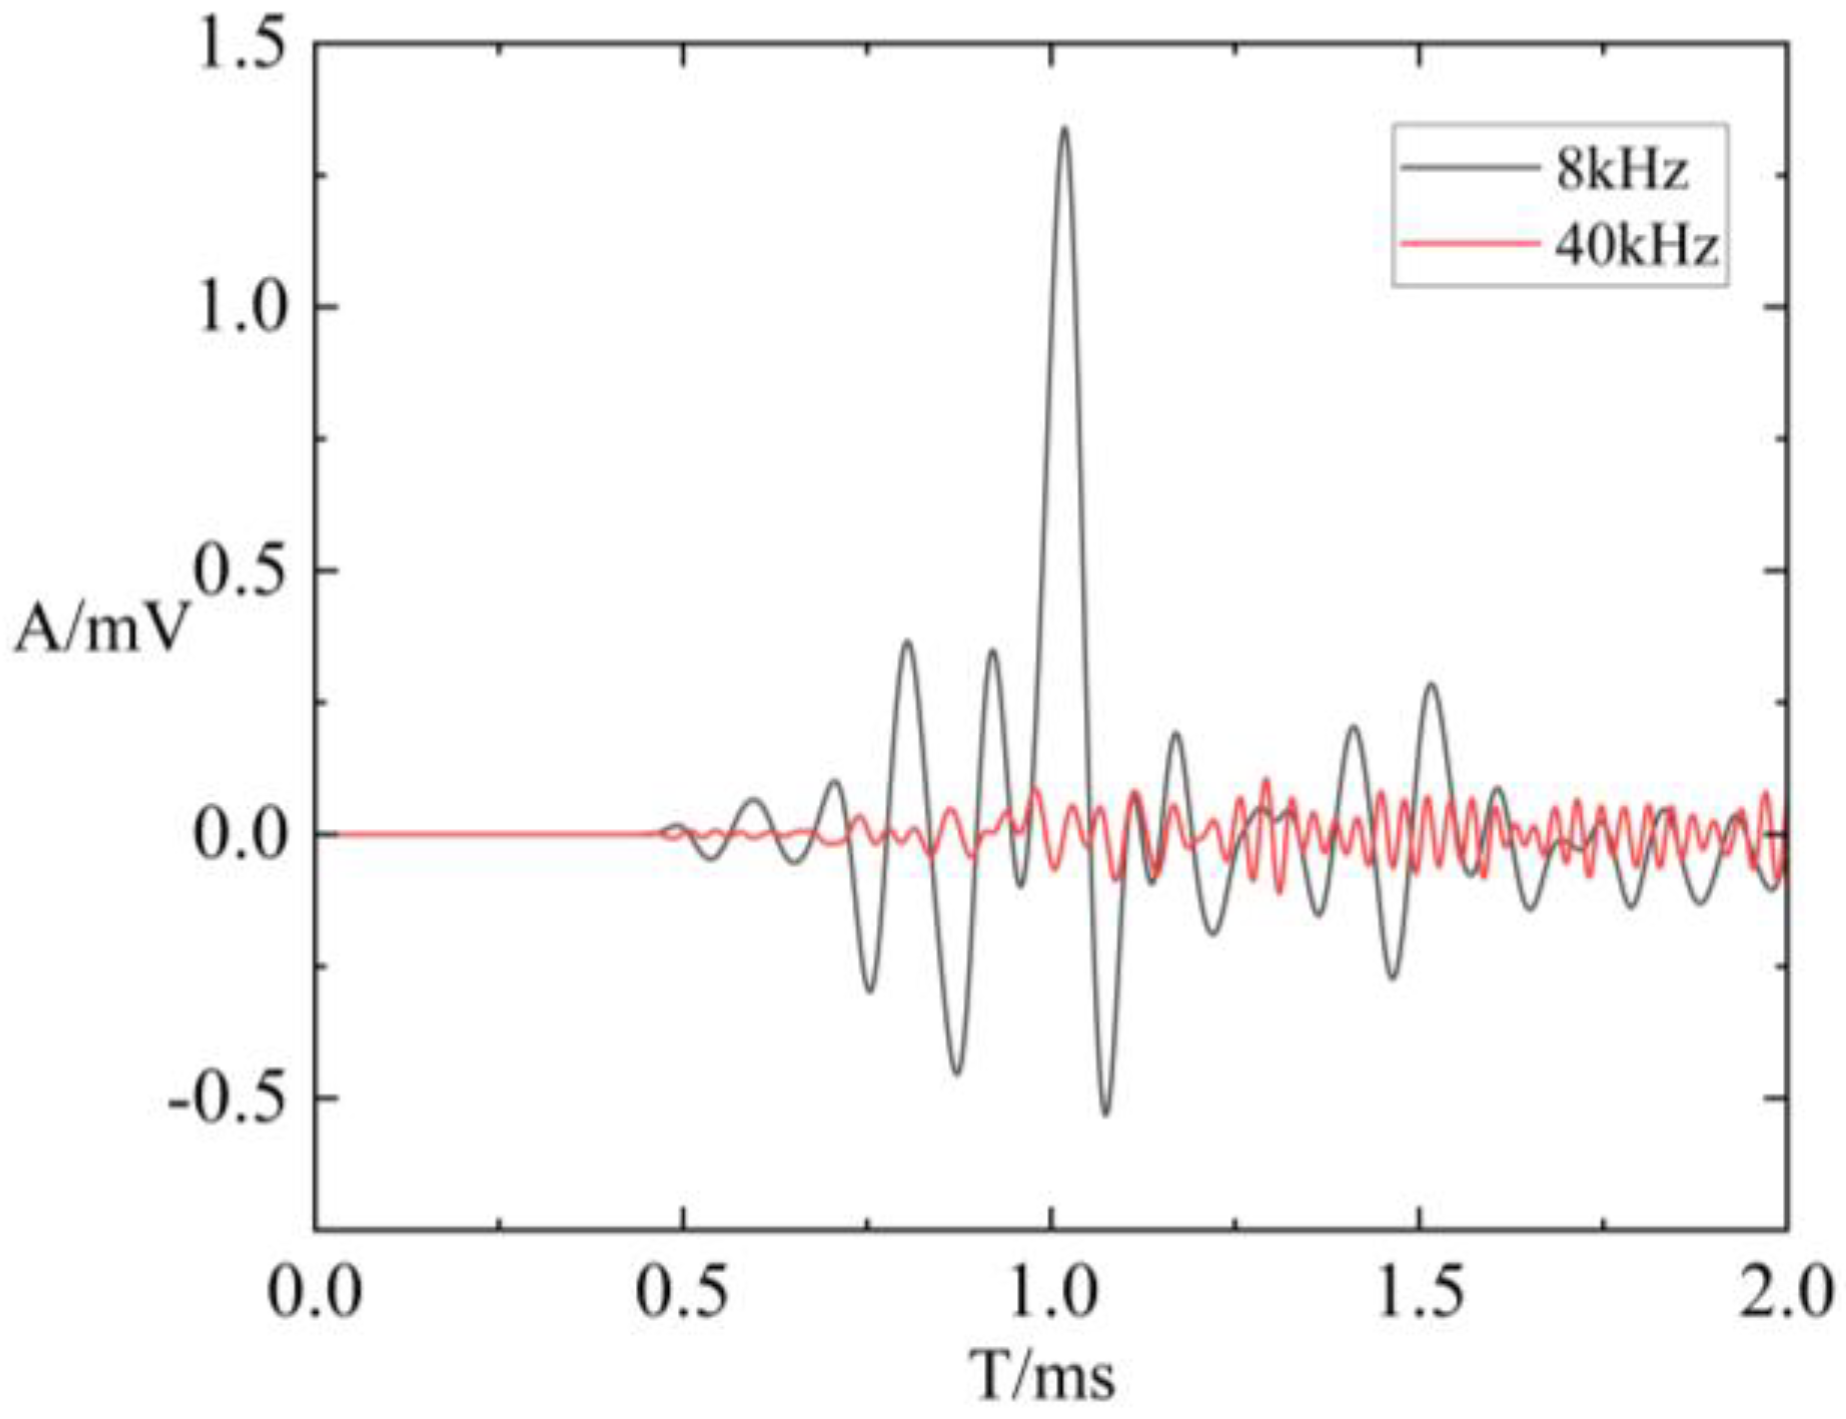
- (3)
- When the fracture width and filling conditions were fixed, the amplitudes of the compressional and shear waves were smaller when the dominant frequency was 40 kHz than when the dominant frequency was 8 kHz. Additionally, the attenuation of wave modes at 40 kHz was faster than that at 8 kHz. Further quantitative analysis revealed that, under different frequency conditions, the attenuation coefficients of wave modes corresponding to fractures with different widths exhibit a consistent pattern. At different frequencies, the ratios of wave modes’ attenuation coefficients for similarly scaled fracture widths (constant fracture width–frequency product) closely approach 1. This indicates that the acoustic propagation attenuation process in fractured media follows the principle of acoustical similarity. The influence of frequency on attenuation demonstrates a consistent proportionality. This conclusion provides a reference for frequency calibration in actual fracture evaluation based on acoustic logging, thereby enhancing the accuracy of fracture evaluation.
Author Contributions
Funding
Institutional Review Board Statement
Data Availability Statement
Conflicts of Interest
References
- Zhang, F.; Lu, Y.; Sang, K.; Huang, J. Attenuation and Dispersion of Seismic Waves in a Cracked-Fractured Medium. Chin. J. Geophys. 2019, 62, 3164–3174. (In Chinese) [Google Scholar] [CrossRef]
- Ren, S.; Han, T.; Fu, L.; Yan, H. Pressure Effects on the Anisotropic Velocities of Rocks with Aligned Fractures. Chin. J. Geophys. 2021, 64, 2504–2514. (In Chinese) [Google Scholar]
- Hengmao, T. Application of Imaging Well Logging Data in Prediction of Structural Fracture. Nat. Gas Ind. 2006, 26, 58–61. [Google Scholar]
- Nicol’as, D.; Eva, C.; Andrew, G. Estimation of the Effective Compliance of a Set of Fractures Using Full-Waveform Sonic Log Data. In Proceedings of the SEG International Exposition and Annual Meeting, Online, 11–16 October 2020. [Google Scholar]
- Xu, S.; Tang, X.; Chen, M.; Su, Y.; Qian, Y.; Sun, D.; Carlos, T. Estimation of Directional Crack Density and Fluid Properties from Well Logs in Vertical Wells. Geophysics 2021, 86, D113–D124. [Google Scholar] [CrossRef]
- Lu, J.; Han, J.; Wu, J.; Che, X.; Qiao, W.; Wang, J.; Chen, X. Physical Simulation of Ultrasonic Imaging Logging Response. Sensors 2022, 22, 9422. [Google Scholar] [CrossRef] [PubMed]
- Li, N.; Wang, K.; Liu, P.; Wu, H.; Feng, Z.; Fan, H.; David, S. Experimental Study on Attenuation of Stoneley Wave under Different Fracture Factors. Pet. Explor. Dev. 2021, 48, 258–265. (In Chinese) [Google Scholar] [CrossRef]
- Lu, J.; Men, B.; Che, X. Experimental Study on the Azimuthal-Transmitting Transducer of Acoustic Logging. Sensors 2023, 23, 3247. [Google Scholar] [CrossRef] [PubMed]
- Hao, X.; Ju, X.; Lu, J.; Men, B.; Zhou, J. Intelligent Fault-Diagnosis System for Acoustic Logging Tool Based on Multi-Technology Fusion. Sensors 2019, 19, 3273. [Google Scholar] [CrossRef] [PubMed]
- Qi, G.; Tang, J.; He, Z.; Shen, W.; Zheng, C.; Li, M. Experimental Research on the Acoustic Detection of Different Fracture Characteristics. Geophysics 2024, 89, B241–V330. [Google Scholar] [CrossRef]
- Cai, M.; Wu, H.; Xin, Y.; Liu, P.; Zhang, C.; Tang, J.; Lin, M.; Tan, L. Experimental Study on Shear Wave Transmission in Fractured Media. Sensors 2022, 22, 4047. [Google Scholar] [CrossRef]
- Zhang, Z.; Shi, J.; Wen, F. Phase Compensation-Based 2D-DOA Estimation for EMVS-MIMO Radar. IEEE Trans. Aerosp. Electron. Syst. 2024, 60, 1299–1308. [Google Scholar] [CrossRef]
- Vladimir, L.; Naum, M.; Lgor, K.; Polina, S.; Lgor, P. Numerical Modeling of Seismic Responses from Fractured Reservoirs in 4D Monitoring—Part 1: Seismic Responses from Fractured Reservoirs in Carbonate and Shale Formations. Geophysics 2021, 86, 1ND-Z3. [Google Scholar] [CrossRef]
- Biyoghé, A.; Leroy, Y.; Zimmerman, R. Simulations of S waves from the Piezoelectric Source to the Receiver to Assist in Laboratory Measurements of Rock Properties. Geophysics 2024, 89, MR91–MR106. [Google Scholar] [CrossRef]
- Binder, G.; Titov, A.; Liu, Y.; Simmons, J.; Tura, A.; Byerley, G.; Monk, D. Modeling the Seismic Response of Individual Hydraulic Fracturing Stages Observed in a Time-Lapse Distributed Acoustic Sensing Vertical Seismic Profiling Survey. Geophysics 2020, 85, T225–T235. [Google Scholar] [CrossRef]
- Su, L.; Cai, M.; Zheng, Z.; Xu, B.; Luo, J.; Hu, Y.; Zhang, J. Numerical Simulation of the Effects of Borehole Enlargement on Sonic logging Response of Horizontal Wells. Geophys. Geochem. Explor. 2022, 46, 467–473. (In Chinese) [Google Scholar] [CrossRef]
- Su, Y.; Li, Z.; Xu, S.; Zhuang, X.; Tang, X. Elastic-Wave Evaluation of Downhole Hydraulic Fracturing: Modeling and Field Applications. Geophysics 2017, 83, D1–D8. [Google Scholar] [CrossRef]
- Wei, L.; Gan, L.; Xiong, F.; Sun, W.; Ding, J.; Yang, H. Attenuation and Dispersion Characteristics of P-waves Based on the Three-Dimensional Pore Network Model. Chin. J. Geophys. 2021, 64, 4618–4628. (In Chinese) [Google Scholar]
- Cai, M.; Wu, H.; Liu, P.; Zhang, C.; Tang, J.; Chen, Y.; Tan, L. Intelligent Calculation Method of Relative Sonic Attenuation and its Application to Fracture Evaluation in Tight Sandstone Reservoir. J. Pet. Sci. Eng. 2022, 218, 110968. [Google Scholar] [CrossRef]
- Tang, J.; Zhang, C.; Xin, Y. A Fracture Evaluation by Acoustic Logging Technology in Oil-Based Mud: A Case from Tight SandStone Reservoirs in Keshen Area of Kuqa Depression, Tarim Basin, NW China. Pet. Explor. Dev. 2017, 44, 418–427. (In Chinese) [Google Scholar] [CrossRef]
- Hao, X.; Zhou, J.; Shang, H.; Xie, H.; Wang, W.; Yang, C. A Plasma Transmitting Source for Borehole Acoustic Reflection Imaging. Sensors 2022, 22, 8050. [Google Scholar] [CrossRef]
- Yao, Y.; Ju, X.; Lu, J.; Men, B. Acoustic Emission and Echo Signal Compensation Techniques Applied to an Ultrasonic Logging-While-Drilling Caliper. Sensors 2017, 17, 1351. [Google Scholar] [CrossRef]
- Wen, F.; Shi, J.; Lin, Y.; Gui, G. Joint DOD and DOA Estimation for NLOS Target Using IRS-aided Bistatic MIMO Radar. IEEE Trans. Veh. Technol. 2024, 1–6. [Google Scholar] [CrossRef]
- Ge, X.; Fan, Y.; Li, J.; Tan, B.; Wang, L.; Wu, Z.; Wang, X. Experimental Studies and Investigations on the Dual Lateral Log Response of Near Borehole Fractures. Chin. J. Geophys. 2019, 62, 354–360. (In Chinese) [Google Scholar] [CrossRef]
- Wu, Y.; Wu, Z.; Fan, Y.; Xing, T.; Li, C.; Yuan, C. Numerical and Physical Simulations of Array Laterolog in Deviated Anisotropic Formation. Pet. Sci. 2022, 19, 2107–2119. [Google Scholar] [CrossRef]
- Wang, H.; Shen, L.; Zhang, G. Dual Laterolog Response In 3D Environments. Petrophysics 2000, 41, 234–241. [Google Scholar]
- Liu, K.; Tang, X.; Zhuang, C. New Method for Cross Dipole Anisotropy Fast Processing. Prog. Geophys. 2018, 33, 690–695. (In Chinese) [Google Scholar] [CrossRef]
- Zhou, J. Dipole Shear Wave Logging Study on Reservoir Anisotropy in Sunan Gas Field. Master’s Thesis, Southwest Petroleum University, Chengdu, China, 2015. (In Chinese). [Google Scholar]
- Mehrdad, S.; Navid, S.; Ali, K.; David, W. The Effect of Frequency Bandwidth on DSI Anisotropy Evaluation. J. Appl. Geophys. 2022, 201. [Google Scholar] [CrossRef]
- Liu, L.; Zhang, C.; Cai, M.; He, Y.; Hua, Y.; Liu, Y. Studies on the Effect of Crack on the Propagation of Acoustic Waves in Wellbore. J. Geophys. Geochem. Explor. 2019, 43, 1333–1340. (In Chinese) [Google Scholar] [CrossRef]
- Xu, F. Study on the Acoustic Response of Wellbore in Fractured and Porous Formations. Ph.D. Thesis, Jilin University, Changchun, China, 2023. (In Chinese) [Google Scholar] [CrossRef]
- Chen, X.; Tang, X.; Qing, Y. Propagation Characteristics of Multipole Acoustic Logging in Cracked Porous Tight Formations. Chin. J. Geophys. 2014, 57, 2961–2970. (In Chinese) [Google Scholar] [CrossRef]
- Cao, H.; Zhang, C.; Cai, M.; Chen, Y.; Cai, D. Date Influence of Rough Crack on Borehole Acoustic Wave Propagation. Sci. Technol. Eng. 2022, 22, 9947–9954. (In Chinese) [Google Scholar]
- Wang, B.; Li, W.; Ye, Q.; Ma, K. A Nonparametric Spectrum Estimation Method for Dispersion and Attenuation Analysis of Borehole Acoustic Measurements. Pet. Sci. 2023, 20, 241–248. [Google Scholar] [CrossRef]
- Fang, X.; Yao, G.; Niu, F.; Wu, D. Estimating Optimal Parameters of Finite-Difference Scheme for Wavefield Modeling. Chin. J. Geophys. 2023, 66, 2520–2533. (In Chinese) [Google Scholar] [CrossRef]
- Zhang, Z.; Sun, Z.; Wang, R. Numerical Simulation of Wave Equation Using Finite Difference Method with Rugged Variable Refined Multigrid in Complex Surface. J. Jilin Univ. (Earth Sci. Ed.) 2023, 53, 598–608. (In Chinese) [Google Scholar] [CrossRef]
- Wu, Y.; Wu, G.; Li, Q. Finite Difference Simulation of Heterogeneous Acoustic Waves in the Frequency Space Domain. Pet. Geophys. Explor. 2022, 57, 342–356. (In Chinese) [Google Scholar] [CrossRef]
- Yan, S.; Xie, F.; Gong, D.; Zhang, C.; Zhang, B. Borehole acoustic fields in porous formation with tilted thin fracture. J. Chin. J. Geophys. 2015, 58, 307–317. (In Chinese) [Google Scholar] [CrossRef]
- Sun, W.; Yang, H. A 3-D Finite Difference Method Using Irregular Grids for Elastic Wave Propagation in Anisotropic Media. Chin. J. Geophys. 2004, 47, 332–337. (In Chinese) [Google Scholar] [CrossRef]
- Levander, A. Fourth-order Velocity Stress Finite-difference Scheme. Geophysics 1988, 53, 1425–1436. [Google Scholar] [CrossRef]


| Formation | 4000 | 2300 | 2300 |
| Borehole and fracture fluids | 1500 | — | 1000 |
| Source dominant frequency/kHz | 40 | 8 | ||||||||
| Width of fracture/mm | 2 | 4 | 6 | 8 | 10 | 10 | 20 | 30 | 40 | 50 |
| P-wave attenuation coefficient/dB | 52.566 | 54.999 | 56.375 | 57.435 | 58.696 | 54.512 | 56.410 | 56.410 | 56.433 | 56.410 |
| S-wave attenuation coefficient/dB | 56.344 | 59.107 | 58.993 | 58.727 | 59.086 | 54.215 | 55.861 | 56.241 | 56.039 | 56.077 |
| Source dominant ratio | 40:8 | ||||
| Fracture width ratio | 2:10 | 4:20 | 6:30 | 8:40 | 10:50 |
| P-wave attenuation coefficient ratio of similar ratio to fracture width at different frequencies | 0.964 | 0.975 | 0.999 | 1.018 | 1.041 |
| S-wave attenuation coefficient ratio of similar ratio to fracture width at different frequencies | 1.039 | 1.058 | 1.048 | 1.048 | 1.053 |
Disclaimer/Publisher’s Note: The statements, opinions and data contained in all publications are solely those of the individual author(s) and contributor(s) and not of MDPI and/or the editor(s). MDPI and/or the editor(s) disclaim responsibility for any injury to people or property resulting from any ideas, methods, instructions or products referred to in the content. |
© 2024 by the authors. Licensee MDPI, Basel, Switzerland. This article is an open access article distributed under the terms and conditions of the Creative Commons Attribution (CC BY) license (https://creativecommons.org/licenses/by/4.0/).
Share and Cite
Gao, Z.; Wu, D.; Wu, H.; Liu, P.; Cai, M.; Zhang, C.; Tang, J. Numerical Simulation Study on the Influence of Fracture on Borehole Wave Modes: Insights from Fracture Width, Filling Condition, and Acoustic Frequency. Sensors 2024, 24, 3955. https://doi.org/10.3390/s24123955
Gao Z, Wu D, Wu H, Liu P, Cai M, Zhang C, Tang J. Numerical Simulation Study on the Influence of Fracture on Borehole Wave Modes: Insights from Fracture Width, Filling Condition, and Acoustic Frequency. Sensors. 2024; 24(12):3955. https://doi.org/10.3390/s24123955
Chicago/Turabian StyleGao, Ziran, Dong Wu, Hongliang Wu, Peng Liu, Ming Cai, Chengguang Zhang, and Jun Tang. 2024. "Numerical Simulation Study on the Influence of Fracture on Borehole Wave Modes: Insights from Fracture Width, Filling Condition, and Acoustic Frequency" Sensors 24, no. 12: 3955. https://doi.org/10.3390/s24123955
APA StyleGao, Z., Wu, D., Wu, H., Liu, P., Cai, M., Zhang, C., & Tang, J. (2024). Numerical Simulation Study on the Influence of Fracture on Borehole Wave Modes: Insights from Fracture Width, Filling Condition, and Acoustic Frequency. Sensors, 24(12), 3955. https://doi.org/10.3390/s24123955