
Insights into Parkinson’s Disease-Related Freezing of Gait Detection and Prediction Approaches: A Meta Analysis

 , , and
Abstract
1. Introduction
1.1. Motivation and Background
1.2. Problem Statement and the Purpose of the Work
- (a)
- It offers a comprehensive literature review, encompassing publications up to 2024. This review provides researchers and practitioners with a thorough understanding of the existing body of knowledge and serves as a valuable reference point for further investigation and study.
- (b)
- It provides a description of the available cueing devices that can help unfreeze the gait of patients with PD.
- (c)
- This analysis presents the available datasets relevant to FOG research, offering detailed descriptions of each dataset. By displaying the characteristics of these datasets, researchers can make informed decisions regarding data selection and utilization in their studies.
- (d)
- The meta-analysis reveals the most common features extracted for FOG detection and prediction, showing the methodologies and techniques employed in feature extraction. This information equips researchers with the necessary insights to effectively extract and leverage features for FOG analysis.
- (e)
- A critical aspect of this meta-analysis is the comparative assessment of ML versus non-ML approaches in terms of accuracy. By measuring p-values and z-values, this analysis quantitatively evaluates the performance disparity between these methodologies, providing intuitions into their relative efficacy and applicability in FOG research.
- (f)
- Another facet is the exploration of the usage of explainable AI (XAI) within the context of FOG prediction. XAI offers a framework for creating transparent and interpretable ML models, facilitating greater understanding of FOG detection and prediction.
1.3. Paper Organization
2. Study of the Literature
2.1. Criteria for the Papers’ Inclusion and Exclusion
2.2. Datasets

| Dataset | # of Patients | Sensor Type | # of Sensors | Location of the Sensors | Created by |
|---|---|---|---|---|---|
| DAPHNet | 10 patients | Accelerometer | 3 | Shank, thigh, and lower back | [40] |
| IMU | 35 patients | IMU: gyroscope and accelerometer | - | Leg | [41] |
| Multimodal | 12 patients | accelerometer, EEG, EMG, and skin conductance | - | Leg muscles, scalp, waist and arm | [44] |
| CuPiD IMU | 18 patients | IMU: accelerometer and gyroscope | 2 | Above the ankle, and thigh | [43] |
| CuPiD multimodal | 18 patients | IMU: accelerometer and gyroscope, ECG and SC | 9, 1 and 1 | Different parts of the body | [42] |
| BXHC | 12 patients | Accelerometer, EEG, EMG, ECG, and SC | - | Different parts of the body | [45] |
| REMPARK | 21 patients | IMU: accelerometer and gyroscope | 1 | Waist | [46] |
| 6MWT | 38 patients | Accelerometer and gyroscope | 1 | Lower back | [47] |
| ADL | 59 patients | Accelerometer and gyroscope | 1 | Lower back | [48] |
2.2.1. Daphnet Dataset
2.2.2. IMU Dataset
2.2.3. Multimodal Dataset
2.2.4. CuPid IMU Dataset
2.2.5. CuPid Multimodal Dataset
2.2.6. BXHC Dataset
2.2.7. REMPARK Dataset
2.2.8. The 6 min Walking Test (6MWT) Dataset
2.2.9. ADL Dataset
2.3. Related Work
2.4. Wearable Cueing Devices
| Reference | Year | Population | Type of Sensor | Location of the Sensor | Algorithm | Features | Window Size | Pre-FOG Duration | Sampling Rate | Aim | Performance | Source of the Dataset |
|---|---|---|---|---|---|---|---|---|---|---|---|---|
| [54] | 2024 | 12 patients | IMU: Accelerometer + Gyroscope | 3 sensors, on lateral tibia of both left and right legs, and fifth lumbar spine of waist (L5) | CNN | CNN features | 0.5 s | 1 s to 4 s | 500 Hz | FOG prediction | NW: (Sens = 77.96%), (Spec = 89.90%), (prec = 78.33%) Pre-FOG: (Sens = 72.92%), (Spec = 85.44%), (prec = 72.52%) FOG: (Sens = 74.48%), (Spec = 87.30%), (prec = 75.13%) Accuracy: 75.02% | BXHC [45] |
| [55] | 2024 | (10 patients) (12 patients) | (Accelerometer) (EEG, EMG, ECG, SC, and acceleration) | (3 sensors, ankle, thigh, trunk) (left leg and wrist from acceleration sensor) | DL | Raw signal | 0.5 s, 1 s, 2 s, 3 s | 1 s, 2 s, 3 s, 4 s, 5 s | (64 Hz) (100 Hz) | 3 class prediction, walking, FOG, and transition. | sensitivity of 84.61%, a specificity of 94.74%, and an F1 score of 86.19% for pre-FOG class | BXHC [45] + Daphnet [40] |
| [56] | 2024 | 10 patients | Accelerometer | 3 sensors, ankle, thigh, trunk | RF | Mean, median, mode, min, max, range, harmonic mean, standard deviation, variance, mean absolute deviation, median absolute deviation, kurtosis, skewness, root mean square, locomotory power, freezing power, freezing index, sum power, mean frequency, median frequency, spectral centroid, spectral kurtosis, spectral entropy, spectral peak | 0.5 s | 3 s | 64 Hz | 4 class prediction, No FOG, FOG, pre-FOG, post-FOG | Average accuracy of 96.5% | Daphnet [40] |
| [57] | 2024 | 10 patients | Accelerometer | 3 sensors, ankle, thigh, trunk | DL | Freezing Index, information entropy, Teager energy entropy, the frequency with a ratio of cumulative energy in the band, the sum of the power in the freezing band (3–8 Hz) and the locomotion band (0.5–3 Hz), mean, and standard deviation | 1 s | 1 s, 3 s, 5 s | 64 Hz | 3 class prediction, walking, FOG and Pre-FOG. | Accuracy of 95.40% with an MF1 score of 0.89 and a Kappa coefficient of 0.87. | Daphnet [40] |
| [58] | 2024 | 12 patients | IMU: Accelerometer +Gyroscope | The pelvis and both sides of the tibia and talus | LSTM, TCN, SVM, KNN, XGBoost | 65 features | 1 s, 2 s and 4 s | - | 64 Hz | FOG Detection | FOG Intra-class correlation coefficient of 95% | - |
| [59] | 2024 | 1170 patients | Accelerometer | Lower back | Bagging and stacking, LightGBM as the base estimator | Mean, median, minimum, maximum, andstandard deviation. | 5 s | - | 128 Hz | FOG Detection | MAP score of 0.306 | Michael J. Fox Foundation for Parkinson’s Research |
| [60] | 2023 | (10 patients) and (35 patients) | (Accelerometer) and (IMU) | (3 sensors, ankle, thigh, trunk) and (leg) | Different combinations of parallel CNN Networks. | CNN Features | 2 s to 4 s | - | 64 Hz | FOG Detection | 98.1% with Daphnet dataset and 98.6% with IMU dataset | Daphnet [40] + IMU [41] |
| [61] | 2023 | 20 Patients | IMU: Accelerometer +Gyroscope | 7 sensors: waist (1), thigh (2), calf (2), ankle (2) | Autoregressive (AR) model and SVM | Mean, variance, standard deviation, max, min, energy, interquartile range, range, entropy, DC component, skewness, kurtosis of amplitude and shape. | 0.5 s | - | 100 Hz | FOG prediction | accuracy of 85.08% | - |
| [62] | 2023 | - | Accelerometer | - | BiLSTM | The mean, maximum, minimum, and standard deviation | - | - | 124 Hz | FOG prediction | combined score of 0.427 | DeFOG Competition [63] |
| [64] | 2023 | 8 patients | EEG and IMU | Head, left forearm, left shank | NN | Raw signal | 1 s, 2 s, 3 s, 4 s, 5 s, 6 s | - | 500 Hz | FOG prediction | accuracy of 92.1% | |
| [65] | 2023 | a. 21 patients b. 38 patients c. 59 patients | a. IMU: Accelerometer + Gyroscope b. Accelerometer +Gyroscope c. Accelerometer +Gyroscope | a. 1 sensor: waist b. 1 sensor: lower back c. 1 sensor: lower back | CNN | CNN features | 2 s | - | a. 200 Hz downs-ampled to 40 Hz b. 200 Hz c. 200 Hz | FOG Detection | specificity above 88% | a.REMPAR-K dataset [46] b. 6MWT dataset [47] c. ADL dataset [48] |
| [44] | 2022 | 12 patients | Accelerometer, EEG, EMG, and SC | lateral tibia of the left and right legs, fifth lumbar spine (L5) of the waist, left arm, muscle of the right leg, tibia anterior (TA) muscles of both legs, second belly of the left index finger and middle finger. | SVM model | Wavelet energy, wavelet entropy, mean absolute value, zeros crossing, slope sign change, wave length, three direction accelerations, the associated sample entropy, standard deviation, total power, freezing index, median value, minimum value, and maximum value. | 3 s | - | EEG and EMG at 1000 Hz (downsampled to 500 Hz), accelerometer and Sc at 500 Hz | FOG prediction | All combinations exceeded 93% accuracy. | Multimodal dataset [44] |
| [66] | 2022 | 12 patients | Accelerometer Gyroscope Force sensing resistor sensors | 7 sensors: Waist (1), Thigh (2), Shank (2), Sole (2) | Threshold | Freeze Index, energy, sum power, mean, absolute mean, zero crossing rate, standard deviation, range, root mean square, maximum, minimum, principal direction eigenvalue, entropy | 2 s | - | 100 Hz | FOG Detection | sensitivity 78.39%, specificity 91.66%, accuracy 88.09%, precision 77.58%, f-score 77.98% | - |
| [67] | 2022 | 11 patients | Plantar pressure sensor | 2 sensors: at soles | Decision tree and random undersampling boosting | Number, duration, length of COP reversals, number, duration, length of COP deviations, CV of COP position, velocity, acceleration, number of weight shifts, power, Dominant Frequency, max, min, mean, Freeze Index, variance, and energy | 1 s | 2 s | 100 Hz | FOG prediction (Binary, (Pre-FOG) and the freeze episodes were in the target class) | sensitivity 77.3%, specificity 82.9% | [68] |
| [69] | 2022 | 12 patients | IMU: Accelerometer +Gyroscope EEG | 3 sensors: Waist on L5 (1) Leg (2) | LSTM | Freezing index, sample entropy, energy index; standard deviation. | 2 s | - | 1000 Hz downsampled to 500 Hz | FOG Detection | geometric mean 91.0% | - |
| [70] | 2022 | 63 patients | IMU: Accelerometer +Gyroscope | 3 sensors: Ankle (2), 7th cervical vertebra (1) | CWT and CNN | cadence, step duration, velocity, stride length, FOG Criterion, gait cycle duration (stride time, stance time and swing time), power in the freezing band (between 3 and 8 Hz) and locomotor band (0.5 to 3 Hz). | 2.56 s | - | 50 Hz | FOG Detection | geometric mean 90.7%, F1 score 91.5%, sensitivity 91.9%, specificity 89.5% | - |
| [71] | 2022 | 16 patients | IMU: Accelerometer +Gyroscope | 6 sensors: Chest (1), Lumbar region (1), Ankle (2), Feet (2) | CNN | CNN features | 2 s | - | 64 Hz | FOG Detection | AUC 83% | - |
| [72] | 2022 | 7 patients | IMU: Accelerometer +Gyroscope | 2 sensors: ankle | CNN, Transfer learning, and k-mean clusters | CNN features | 2 s | 0.5 s, 1 s | 128 Hz | FOG Prediction | sensitivity 63.0%, specificity 98.6% | [73] |
| [74] | 2022 | 12 patients | EEG, EMG, ECG, EOG, SC, IMU: Accelerometer +Gyroscope | 4 sensors: Lateral tibia of the leg (2), Fifth lumbar spine (1), Wrist (1) | SVM and KNN | Total Power, Mean Power, Max Power, STD Power, Locomotion Band Power, Freeze Band Power, Locomotion Band Power STD, Freeze Band Power STD, Freeze Index, Freeze Ratio, Skewness, Kurtosis, Energy, Entropy, Dominant Frequency, Mean Frequency, Median Frequency, RMS, Mean, STD, Number of zero-crossing, Zero-crossing rate, Number of peaks, Mean distance between peaks, Mean height of the peaks, Energy, Max Amplitude, Min Amplitude, Range, Integral, Axes correlation, Total Power, Mean Power, STD Power, Max Power, Dominant Frequency, Mean Frequency, Median Frequency | 3 s | - | 500 Hz | FOG prediction | subject-independent accuracy 85% | - |
| [34] | 2021 | 11 patients | inertial sensor (IMU) | 2 sensors: on each shin, | Binary classification: DT, SVM PreFOG: SVM, LDA, KNN, LR | Standard Deviation, Range, Root Mean Square, Angular Jerk, Normalized Jerk, Stride Similarity, step time, stride time, Peak height, Peak width, Power Spectral Entropy, Principal Harmonic Frequency, Principal Harmonic Amplitude, Principal Harmonic Width, Weighted Power Spectral Frequency, Low Power Frequency | 2 s to 5 s | 2 s to 5 s | 60 Hz | FOG and Pre-FOG detection. | FOG and PreFOG respectively Se 95.9%, 84% Sp 95.4%, 88.3% Ac 95.5%, 87.4% | - |
| [75] | 2021 | 10 patients | Pressure sensors Accelerometer Angular velocity Sensor Euler angles sensor | 2 sensors at soles | CNN+ANN | CNN features | 0.5 s | - | 50 Hz | FOG Prediction | sensitivity 96.0%, specificity 99.6%, precision 89.5%, accuracy 99.5% | - |
| [76] | 2021 | 10 patients | accelerometer | 3 sensors: ankle, thigh, trunk | KNN, SVM and MLP | time-domain attributes + PCA | 0.94 s | - | 64 Hz | no FOG, pre-FOG, FOG, and pre of post FOG prediction | precision of no FOG, pre-FOG, FOG, and pre of post FOG is 99.42%, 92.23%, 97.84%, and 92.73%, respectively, accuracy of 98.92% | Daphnet [40] |
| [77] | 2021 | 28 patients | 3D motion analysis | Anatomical landmarks were marked with 34 retroreflective markers. | CNN + LRP to provide transparency. | CNN features | - | - | 100 Hz | explainable FOG prediction | Accuracy of 86% | [78] |
| [79] | 2021 | 11 patients | Plantar pressure sensors | insoles | LSTM networks | Center of pressure (COP), COP velocity, COP acceleration, Ground Reaction Force (GRF) and Fraction of total GRF | 1 s | 2 s | 100 Hz | FOG prediction Binary, (Pre-FOG) and the freeze episodes were in the target class) | 2-layer LSTM: 82.1% sensitivity and 89.5% specificity. 3-layer LSTM: 83.4% sensitivity and 87.4% specificity. | [68] |
| [80] | 2021 | 10 patients | Accelerometer | 3 sensors: ankle, thigh, trunk | LSTM network | Raw signal | 1 s | - | 64 Hz | FOG Detection | AUC score of 97.62% | Daphnet [40] |
| [81] | 2021 | 18 patients | IMU: Accelerometer +Gyroscope | wrist | CNN | CNN features | 0.25 s | - | 128 Hz | FOG Detection | 90% specificity and 86% sensitivity | CuPiD IMU Dataset |
| [82] | 2021 | 10 patients | Accelerometer | 3 sensors: ankle, thigh, trunk | LSTM | Raw signal | 0.5 s, 1 s, 2 s, 3 s | 1 s and 3 s | 64 Hz | FOG prediction: They used preFOG to predict FOG | 89% prediction accuracy | Daphnet [40] |
| [83] | 2021 | 10 patients | Accelerometer | 3 sensors, ankle, thigh, trunk | CNN and LSTM | Min, max, range, mean, median, mode, trimmed mean, standard deviation, variance, root mean square, mean absolute value, median absolute deviation, 25th percentile, 75th percentile, interquantile range, normalized signal magnitude area, skewness, kurtosis, mean crossing rate, signal vector magnitude, peak of Fourier transform, entropy, energy, peak frequency, Freeze Index, band power, RP, STFT, DWT and PWVD | 1 s to 4 s | 1 window | 64 Hz | FOG Detection and Prediction | accuracy 98.5%, sensitivity 98.5%, specificity 97.9% | Daphnet [40] |
| [68] | 2021 | 11 patients | Plantar pressure sensor | 2 sensors: at soles | decision tree ensemble | Number, duration, length of COP reversals, number, duration, length of COP deviations, CV of COP position, velocity, acceleration, number of weight shifts, power, Dominant Frequency, max, min, mean, Freeze Index, variance, and energy | 1 s | 2 s | 100 Hz | FOG, pre-FOG and transition between FOG and pre-FOG detection | 76.4% sensitivity and 86.2% specificity | [68] |
| [84] | 2021 | 10 patients | Accelerometer | 3 sensors: ankle, thigh, trunk | LDA, regression trees, SVM and RF. | Norm, max, min, median, incidence coefficient and degree of proximity. | - | - | 64 Hz | FOG Detection | accuracy 89.94%, sensitivity 87.8%, specificity 93.02% | Daphnet [40] |
| [85] | 2020 | 10 patients | accelerometer | 3 sensors: ankle, thigh, trunk | CNN + The attention-enhanced LSTM | CNN features | - | - | 64 Hz | FOG Detection | 95.1% sensitivity and 98.8% specificity | Daphnet [40] |
| [86] | 2020 | 12 patients | Accelerometer | Lower back | AdaBoost | Freezing Index, variance, Dominant Frequency, cadence, step regularity, and gait pattern variability | 5 s | 5 windows | 100 Hz | FOG prediction | Model A: 77%, model B: 81.2%, model C: 80.9%, model D: 82.7% | - |
| [87] | 2020 | 10 patients | accelerometer | 3 sensors: ankle, thigh, trunk | LDA and PCA | variance, mode, standard deviation, maximum and minimum values | 1 s to 6 s | 2 s to 4 s | 64 Hz | FOG prediction: They used preFOG to predict FOG | FOG: sensitivity and specificity of 94.1% and 97.1%, respectively. | Daphnet [40] |
| [88] | 2020 | 1 patient | IMU: Accelerometer +Gyroscope | 2 sensors: on both shanks | Closed-loop DBS algorithms | arrhythmicity over the last six steps (AR), stride time (ST), swing angular range (SA), and asymmetry over the last six steps (AS) | - | - | 128 Hz | FOG Prediction | - | - |
| [89] | 2020 | 67 patients | IMU: Accelerometer + Gyroscope | 3 sensors: Ankle (2), 7th cervical vertebra (1) | CNN | CNN features | 4 s | - | 50 frames per second | FOG Detection | accuracy 89.2%, geometric mean 88.8% | - |
| [90] | 2020 | 10 patients | Accelerometer | 3 sensors, ankle, thigh, trunk | RF, GB, XGB, SVM, and NN | Mean, standard deviation, min, max, Quartile1, Quartile3, median, skew, kurtosis, zero crossing rate, peak-to-peak, crest factor, root mean square (RMS), velocity root mean square, entropy, Freeze Index, power difference, fast Fourier transform mean magnitude, fast Fourier transform mean phase, power spectrum, integrals, center of gravity of x, y, z components, angles of x, y, z components | 2 s, 3 s, 4 s | 2 s, 3 s, 4 s | 64 Hz | 3 class prediction: walking, FOG, and transition | FOG: sensitivity 72.34% specificity 87.36% Transition: sensitivity 91.49% specificity 88.51% Normal activity: sensitivity 75% specificity 93.62% | Daphnet [40] |
| [87] | 2020 | 10 patients | Accelerometer | 3 sensors: ankle, thigh, trunk | KNN | KLDA | 1 s to 6 s | 1 window | 64 Hz | FOG prediction (2 classes: FOG and No FOG), (3 classes: FOG, Pre-FOG and No FOG) | specificity 97.1%, sensitivity 94.1% | Daphnet [40] |
| [91] | 2020 | 71 patients | Accelerometer Gyroscope Magnetometer | 4 sensors: Lower back (2), Ankle (2) | SVM | Mean standard deviation, correlations, range, RMS, peak amplitude, entropy, freezing index, power, skewness, kurtosis | 3 s | - | 128 Hz | FOG Detection | accuracy 85.0%, specificity 83.4%, sensitivity 84.1% | - |
| [92] | 2020 | 21 patients | Accelerometer | 1 sensor: waist | RNN, CNN and LSTM | 128 features, 192 features and 256 features. | 3.2 s | - | 200 Hz downsampled to 40 Hz | FOG Detection | mean AUC 93.9%, mean specificity 87.1%, mean sensitivity 87.1% | - |
| [93] | 2019 | 10 patients | accelerometer | 3 sensors, ankle, thigh, trunk | Random orest, multilayer percep-tron and hidden Markov models, CNN+MLP | mean, standard deviation, variance, frequency entropy, energy, Freeze Index (power of the freeze band (3–8 Hz) divided by power in locomotor band (0.5–3 Hz)), and power in both bands, median absolute deviation, largest value, smallest value, signal magnitude area, interquartile range, ecdf, auto regression coefficients, the correlation coefficient between two axes, weighted average, skewness, kurtosis, Harmonicity in time and frequency domains, predictability in time and frequency domains, and spectral flux | 4 s | - | 64 Hz | FOG Detection | sensitivity 95%, specificity 75% | Daphnet [40] |
| [94] | 2019 | 10 patients | accelerometer | 3 sensors: ankle, thigh, trunk | Statistical | Freeze Index, the wavelet index and sample entropy | 2 s, 2.5 s, 3 s, 3.5 s and 4 s. | 2 s | 64 Hz | FOG Prediction: They used preFOG to predict FOG | 88.8%, 92.5%, and 89.0% for average predictivity, sensitivity, and specificity, respectively | Daphnet [40] |
| [95] | 2019 | 7 Patients | EMG and IMU: accelerometer and gyroscope | Right leg | FOG detection algorithm | Absolute value of the averaged angular velocity, threshold, step window | - | - | 6.6K Hz | FOG Detection | 2% false negative and 5% false posi-tive | - |
| [96] | 2019 | 10 patients | Accelerometer | 3 sensors: ankle, thigh, trunk | autoregressive moving average model | Freeze Index, high-resolution time–frequency spectral | 6 s | - | 64 Hz | FOG Detection | sensitivity 99.2%, specificity 94.59% | Daphnet [40] |
| [97] | 2019 | 18 patient | Accelerometer | 2 sensors: ankle | Adaptive Synthetic sampling algorithm | Freeze Index, entropy, power, standard deviation | 2 s | 2 windows | 128 Hz down sampled to 64 Hz | FOG Prediction | accuracy 97.4%, prediction 66.7% | [24] |
| [98] | 2019 | 10 patients | Accelerometer | 3 sensors: ankle, thigh, trunk | SVM and probabilistic neural networks | freezing index, extended freezing index, peak, average peak distance, number of dominant peaks, average peak width, zero crossings, zero crossings of jerk, variance, norms of acceleration, dominant singular values, | 4 s | - | 64 Hz | FOG Prediction | sensitivity 93%, specificity 91% | Daphnet [40] |
| [73] | 2019 | 10 patients | Accelerometer Gyroscope Magnetometer | 1 sensor: wrist | Threshold | Freeze Index | 3 s | - | 512 Hz | FOG Detection | accuracy 99.7% | - |
| [99] | 2019 | 25 patients | IMU: Accelerometer +Gyroscope | 2 sensors: ankles | NN | Freeze Index, freeze band, locomotor band, mean frequency, Dominant Frequency, power, spectral entropy, root mean square, mean, standard deviation, coefficient of variation, kurtosis, maximum acceleration, range of acceleration, stride peak, stride time, velocity, stride length, and the FOG criterion. | - | - | 50 Hz | FOG Detection | specificity 93.1%, sensitivity 95.9% | - |
| [100] | 2018 | 8 patients | accelerometer | 3 sensors: ankle, thigh, trunk | MLP, RF, XGB, SVM, KNN, NB | mean, RMS velocity, proportion above mean, proportion below mean, sum of changes, madogram, variogram, peak frequency, Freeze Index | 5 s | 5 s | 64 Hz | 3 class prediction: walking, FOG, and transition. | W, F, T respectively Se: 86.00%, 89.00%, 75.00% Sp: 95.00%, 91.00%, 88.00% Ac: 91.00%, 90.00%, 82.00% | Daphnet [40] |
| [101] | 2018 | 16 patients | EEG | head | Combination of DTF, ICA and Bayesian neural network | the mean, the maximum and the minimum values of DTF | 5 s | 5 s | 500 Hz | FOG Prediction | Sensitivity of 82.65% and a specificity of 86.60% | - |
| [102] | 2018 | 51 patients | Accelerometer | 2 sensors: on both knees | SVM, k-NN, NB, DT | step time, stride time, step length, stride length, walking speed, standard deviation, harmonic ratio, and cross-correlation coefficient | - | - | 32 Hz | FOG Detection | sensitivity and specificity of 90.89% and 91.2%, respectively | - |
| [103] | 2018 | 21 patients | accelerometer, gyroscope and magnetometer | 1 sensor: waist | DL | the mean, standard deviation, variance, the entropy, and the energy | 2.56 s | - | 50 Hz | FOG Detection | accuracy 89%, sensitivity 91.9%, specificity 89.5% | - |
| [104] | 2018 | 15 patients | Accelerometer | 1 sensor: waist | Threshold | means, difference among mean values, standard deviations, correlations, frequency standard deviation, highest harmonics and center of mass, skewness, kurtosis, integrals, auto-regression coefficients, principal component values | 0.8 s, 1.6 s, 3.2 s, 6.4 s | - | 40 Hz | FOG Detection | sensitivity 91.7%, specificity 87.4% | - |
| [105] | 2017 | 10 patients | Accelerometer Gyroscope Magnetometer | 3 sensors: Head (1), Ankle (2) | Threshold | Raw signal | 1 s | - | 50 Hz | FOG Detection | Accuracy: 92.86% | - |
| [106] | 2017 | 10 patients | accelerometer | 3 sensors: ankle, thigh, trunk | Time frequency domain analysis | Energy, freezing index and spectral coherence. | 0.1 s to 1 s | - | 64 Hz | FOG Detection | The accuracies were 92%, 90.1%, and 89.8% for the knee, ankle, and hip sensors. | Daphnet [40] |
| [107] | 2017 | 11 patients | IMU Electrocardiography Skin-conductance | 3 sensors: left and right ankle (2), and lower back (1) | Linear Discriminant Analysis | Turning degrees, gait symmetry (left–right cross-correlation, left–right difference in SD), gait amplitude, power in the locomotor band, power in the freezing band, and freezing index. | 2 s | 2 s | 128 Hz | Pre-FOG Prediction | Good performance | Cubid dataset [42] |
| [108] | 2017 | 10 patients | Accelerometer | 3 sensors, ankle, thigh, trunk | Anomaly score detector with adaptive thresholding | maximum and number of peaks in the spectral coherence, Freezing index, Average, standard deviation, variance, median, entropy, energy, power | 2 s to 8 s | - | 64 Hz | FOG Detection | Ankle: (accuracy: 94%) (specificity: 84%) Lower back: (accuracy: 89%) (specificity: 94%) | Daphnet [40] |
| [83] | 2017 | 16 patients without FOG and 28 patients with FOG. | IMU: Accelerometer +Gyroscope | 2 sensors: on each shin | Ad hoc algorithms | Step velocity, stride length, stride time, and cadence. | - | - | 25 Hz | FOG Detection | accuracy 98.51%, sensitivity 93.41%, specificity 98.51% | - |
| [46] | 2017 | 21 patients | IMU: Accelerometer + Gyroscope (only accelerometer used) | 1 sensor: Waist | SVM | Mean, Increments of consecutive windows’ mean values, Difference between the increments of the windows’ mean values, Standard deviation, Correlation, Highest harmonic peaks, Spectral density center of mass, Skewness, kurtosis, A change of basis, Integrals, Auto regression coefficients | 3.2 s | - | 200 Hz down sampled to 40 Hz | FOG Detection | sensitivity 74.7%, specificity 79.0% | - |
| [109] | 2017 | 6 patients | EEG | 1 sensor: head | Bayesian Neural Networks and time–frequency Stockwell Transform | maximum amplitude for each band at a time (t), the sum of amplitude of the each band at a time (t) | 1 s | - | 512 Hz | Turning FOG Detection | sensitivity 84.2%, specificity 88%, accuracy: 86.2% | - |
| [110] | 2017 | 12 patients | IMU: Accelerometer + Gyroscope magnetometer | 1 sensor: waist | SVM | mean, standard deviation, range, signal magnitude area, signal correlations, skewness, kurtosis; energy and spectral density in specific bands | - | - | 40 Hz | FOG and Bradykinetic Gait Detection | sensitivity 82.08%, specificity 93.75% | - |
| [111] | 2017 | 32 patients | Acceleromete Gyroscope | 2 sensors: shin | Threshold | k-index | - | - | 25 Hz | FOG Detection | accuracy 97.56%, precision 89.55%, sensitivity 93.41%, specificity 97.57% | - |
| [112] | 2016 | 3 patients | accelerometer | 3 sensors: shank, thigh, and torso | LRN | Raw signal | - | - | Approx. 200 Hz | FOG prediction | 89% precision 30% recall | - |
| [113] | 2016 | 18 patients | IMU: Accelerometer +Gyroscope | 2 sensors at ankles and 2 sensors at wrist | Supervised machine learning | Mean, Standard deviation, power | 3 s | - | 128 Hz | FOG Detection | Subject-dependent accuracy 85%, specificity 80%; subject-independent accuracy 90%, specificity 66% | [43] |
| [114] | 2016 | 10 patients | Accelerometer | 3 sensors, ankle, thigh, trunk | continuous wavelet transform (CWT) | Freeze Index | 1 s, 2 s, 3 s, 4 s | - | 64 Hz | FOG Detection | sensitivity: 82.1% specificity: 77.1% | Daphnet [40] |
| [115] | 2016 | 20 patients | Accelerometer | 1 sensor: Hip | Threshold | Freezing index, energy, and step cadence | 2.56 s | - | 100 Hz | FOG Detection | sensitivity 87.57%, specificity 94.97% | - |
| [42] | 2015 | 18 patients | IMU, ECG and SC sensors | 2 sensors: chest (1), finger (1) | Threshold | mean, median, variance, power on very low frequencies, power on low frequencies, power on high frequencies, ratio between the power, standard deviation, minimum, maximum, difference between minimum and maximum, number of local minima in the window and the number of local maxima in the same window. | 3 s | 4.2 s | ECG = 512 Hz Sc = 51.2 Hz | FOG Prediction | accuracy 71.3% | Cubid dataset [42] |
| [116] | 2015 | 23 patients | accelerometer | 1 sensor: Waist | Threshold | Freeze Index | 2 s, 4 s and 6 s | - | 100 Hz | FOG Detection | 76% specificity and 75% sensitivity | - |
| [35] | 2015 | 5 patients | IMU, ECG and SC sensors | 2 sensors: chest (1), finger (1) | Frequency Features Trends | Stride duration, stride length, stance phase percentage, and LR/RL limb durations | 4 s to 6 s | 4 s | ECG = 512 Hz Sc = 51.2 Hz | Pre-FOG Detection | - | Cubid dataset [42] |
| [117] | 2015 | 15 patients | Accelerometer Gyroscope | 3 sensors: Waist (1), Trouser pocket (1), Shin (1) | AdaBoost.M1 classifier | mean, variance, standard deviation, entropy, signal energy, FI, power, root mean square, interquantile range, kurtosis, and frequency domain features power | 4 s | - | 200 Hz down sampled to 50 Hz | FOG Detection | Waist: (sensitivity 86%) (specificity 91.7%) Trouser pocket: (sensitivity 84%) (specificity 92.5%) | - |
| [118] | 2014 | 4 patients | 3D accelerometer, a 3D magnetometer and a 3D gyrometer | 1 sensor: shank | Threshold | cadence and stride length | 6 s | - | 100 Hz | FOG Detection | sensitivity 79.5% | - |
| [119] | 2014 | 20 patients | Accelerometer | 1 sensor: shoe | Threshold | root-mean-squared (RMS) mean of the acceleration | 0.2 s, 1.0 s, 2.0 s, 3.0 s, 3.5 s, 4.0 s, 4.5 s, 6.0 s, and 8 s | - | 250 Hz | FOG Detection | sensitivity 86%, specificity 86% | - |
| [120] | 2014 | 14 patients | IMU: Accelerometer +Gyroscope | 7 sensors: Lower back (1) Thigh (2) Shin (2) Foot (2) | Threshold | Freeze band power | 4 s | - | 50 Hz | FOG Detection | - | - |
| [121] | 2013 | 16 patients | Accelerometer Gyroscope | 6 sensors: Wrist (2), Shin (2), Waist (1), Chest (1) | Naïve Bayes, Random Forests, and decision tree and Random Tree algorithms | Entropy, standard deviation | 1 s | - | 50 Hz/60 Hz | FOG Detection | sensitivity 81.94%, specificity 98.74%, accuracy 96.11% and AUC 98.6% | - |
| [122] | 2013 | 25 patients | IMU:Accelerometer + Gyroscope (only accelerometer was used) | 7 sensors: back (1), Thigh (2), Shank (2), Foot (2) | Threshold | Peaks at the stride and step frequencies, Freeze Index | 2.5, 5, 7.5 and 10 s | - | 50 Hz | FOG Identification | sensitivity 86.2%, specificity 82.4% | - |
| [123] | 2012 | 10 patients | Accelerometer | 3 sensors, ankle, thigh, trunk | RT, RF, NB, BN, KNN-l, KNN-2, MLP, Ada-Boost, and bagging. | Mean, entropy, standard deviation, power, and freezing Index, variance and energy. | 1 s 4 s | - | 64 Hz | FOG Detection | average sensitivity of 98.35% and an average specificity of 99.72%. | Daphnet [40] |
| [124] | 2011 | 16 patients | Accelerometer Gyroscope | right and left wrist, right and left leg, chest and waist | DT and RF | Entropy, sampling frequency, time position, sample of the signal and probability. | 1 s and 2 s | - | 62.5 Hz | FOG Detection | accuracy 96.11% | - |
| [125] | 2011 | 10 patients | Accelerometer Electromyographic | 3 sensors: Forearm (1), Thigh (1), Skin (1) | Dynamic neural network and linear classifier | Various features designed to distinguish voluntary movements from involuntary movements. | 2 s | - | 1000 Hz | FOG Detection | specificity 97.3%, sensitivity 82.9% | - |
2.4.1. Auditory Cueing Devices
2.4.2. Visual Cueing Devices
2.4.3. Somatosensory Stimulation Devices
3. Discussion
3.1. Datasets and Preprocessing

| Reference | [54] | [55] | [90] | |||
|---|---|---|---|---|---|---|
| Performance | Sensitivity | Specificity | Sensitivity | Specificity | Sensitivity | Specificity |
| 1 s | 69.26% | 83.56% | 67.02% | 93.60% | - | - |
| 2 s | 70.67% | 82.71% | 75.77% | 93.67% | 91.49% | 94.51% |
| 3 s | 74.79% | 87.85% | 81.40% | 94.64% | 85.11% | 94.25% |
| 4 s | 72.98% | 86.83% | 82.88% | 94.48% | 76.60% | 92.94% |
| 5 s | - | - | 84.61% | 94.74% | ||
3.2. Features Extraction
| Feature | Description/Equation | Used by |
|---|---|---|
| Freeze Index | The amount of power within a specific frequency band associated with freezing of gait episodes (3–8 Hz) relative to the power in the locomotor band (0.5–3 Hz) where x is the signal. | [56,57,66,67,68,69,73,74,83,86,90,91,93,94,96,97,98,99,100,106,107,108,114,115,116,117,122,123] |
| Standard Deviation | A measure of the amount of variation or dispersion of a set of values. , where is the standard deviation, N is the number of observations, is the value, and is the mean. | [34,42,46,56,57,61,62,66,69,74,83,87,90,91,93,97,99,102,103,104,108,110,113,117,121,123] |
| Mean | The average value of the signal. , where is the mean, N is the number of observations, and is the value of the signal. | [42,46,56,57,61,62,66,67,68,74,83,90,93,99,100,103,104,108,110,113,117,123] |
| Power | Total power across all frequencies of interest in a signal. , where is the power spectral density function, indicating the power of the signal at each frequency f, and and are the minimum and maximum frequencies of interest, respectively. | [42,44,56,66,67,68,74,83,90,91,93,97,99,107,108,113,117,120,123] |
| Entropy | A measure of the amount of uncertainty or information content in the signal. where is the probability of occurrence of the ith value. | [57,61,66,69,74,83,90,91,93,94,97,99,103,108,117,121,123,124] |
| Energy | The total magnitude of the signal squared, summed over time. | [44,57,61,66,67,68,69,74,83,93,103,106,108,110,115,117,123] |
| Maximum | The maximum value in a given window | [42,44,56,61,62,66,67,68,83,87,90,93,101] |
| Minimum | The minimum value in a given window | [42,44,56,61,62,66,67,68,83,87,90,93,101] |
| Variance | A measure of the dispersion of a set of values around the mean. , where is the variance, N is the number of observations, is the value, and is the mean. | [56,61,67,68,83,86,87,93,99,103,108,117,123] |
| Kurtosis | It measures the ’tailedness’ of the data distribution. , where n is the number of observations, is the standard deviation, is the value, and is the mean. | [46,56,61,74,83,90,91,95,99,104,110,117] |
| Skewness | It measures the asymmetry of the data distribution around the mean. , where n is the number of observations, is the standard deviation, is the value, and is the mean. | [46,56,61,74,83,90,91,95,104,110] |
| Root Mean Square | The square root of the total sum of squares of each data in an observation. , where N is the number of observations, and is the value of the signal. | [34,56,66,83,90,91,99,117,119] |
| Range | The difference between the highest and lowest values , where are the values of the signal. | [34,56,61,66,74,83,91,110] |
| Median | The middle value in a sorted list of numbers. | [42,44,56,83,90,93,108] |
| Correlation | The extent to which two variables are linearly related. , where N is the number of observations, and are the value and the mean of the first variable, and and are the value and the mean of the second variable | [46,91,93,104,110] |
| Dominant Frequency | The frequency component that has the highest energy or amplitude in the frequency spectrum. where is the magnitude of the FFT at each frequency and denotes the frequency at which achieves the maximum value. | [67,68,74,86,99] |
| Peak Height | Peak height measures the amplitude of the peak of the signal relative to zero, representing the maximum angular velocity reached in each step. | [34,56,74,91,98] |
| Stride Time | Stride time is the time interval between two successive steps on the same leg, giving an indication of the cycle of the gait. | [34,88,99,102] |
| Zero Crossing Rate (ZCR) | Quantifies the rate at which a signal changes from positive to negative or vice versa. , where n is the number of observations, is the value of the signal, and is the sign function that returns the sign of a real number. | [44,66,74,98] |
| Auto Regression Coefficients | The parameters in an AutoRegressive (AR) model describe the relationship between the current value of a time series and its previous values. The general form of an AR model of order p (AR(p)) can be expressed as: , where is the value of the time series at time t, c is a constant, ,are the auto regression coefficients, is the error term at time t, and p is the order of the model. | [46,93,104] |
| Interquartile Range (IQR) | IQR indicates the spread of the middle 50% of a dataset. , where is the first quintile (25th percentile) of the dataset, and is the third quantile (75th percentile) of the dataset. | [61,93,117] |
| Empirical Cumulative Distribution Function (ECDF) | ECDF describes the distribution of data points in a sample. The ECDF is defined for a set of observations . For any value, the ECDF is calculated as , where N is the number of observations. | [93] |
| Mode | The value that appears most frequently in a dataset. | [56,83,87] |
| Step time | Step time is the duration between one step and the subsequent step of the opposite leg, providing information about the rhythm and pace of gait. | [34,95,102] |
| Cadence | The number of steps taken per minute. | [86,115] |
| Length of COP | Quantifies postural stability and control. The COP trajectory length is calculated by summing the distances between successive COP positions recorded at each time step during the analysis period. | [67,68] |
| Mean Absolute Value (MAV) | The average of the absolute values of the observations in a dataset. , where N is the number of observations, and is the value of the signal. | [44,66] |
| Median Absolute Deviation (MAD) | MAD is calculated as the median of the absolute deviations from the data’s median. For a set of observations , the MAD is given by: | [83,93] |
| Peak Frequency | The frequency that has the maximum power in the Power Spectral Density (PSD) of the signal. , where is the power spectral density function. | [83,100] |
| Peak Width | Peak width is determined by the width of the peak at half of its maximum power (which corresponds to the square of the amplitude), and it is proportional to the duration of the swing phase of the step. | [34,98] |
| Power Spectral Entropy | Measures the disorder or complexity of a frequency spectrum where p is the normalized power spectral density, and is a small constant to ensure the log term is well-defined | [34,93] |
| Principal Harmonic Frequency | [34,93] | |
| Root Mean Square Velocity | The quadradic mean of the speed of the signal x in the time domain. , where N is the number of observations, is the value of the signal, and is the inverse of the function. The function provides a discrete integration for a vector, a matrix or a time series object. | [74,100] |
3.3. Evaluation Metrics
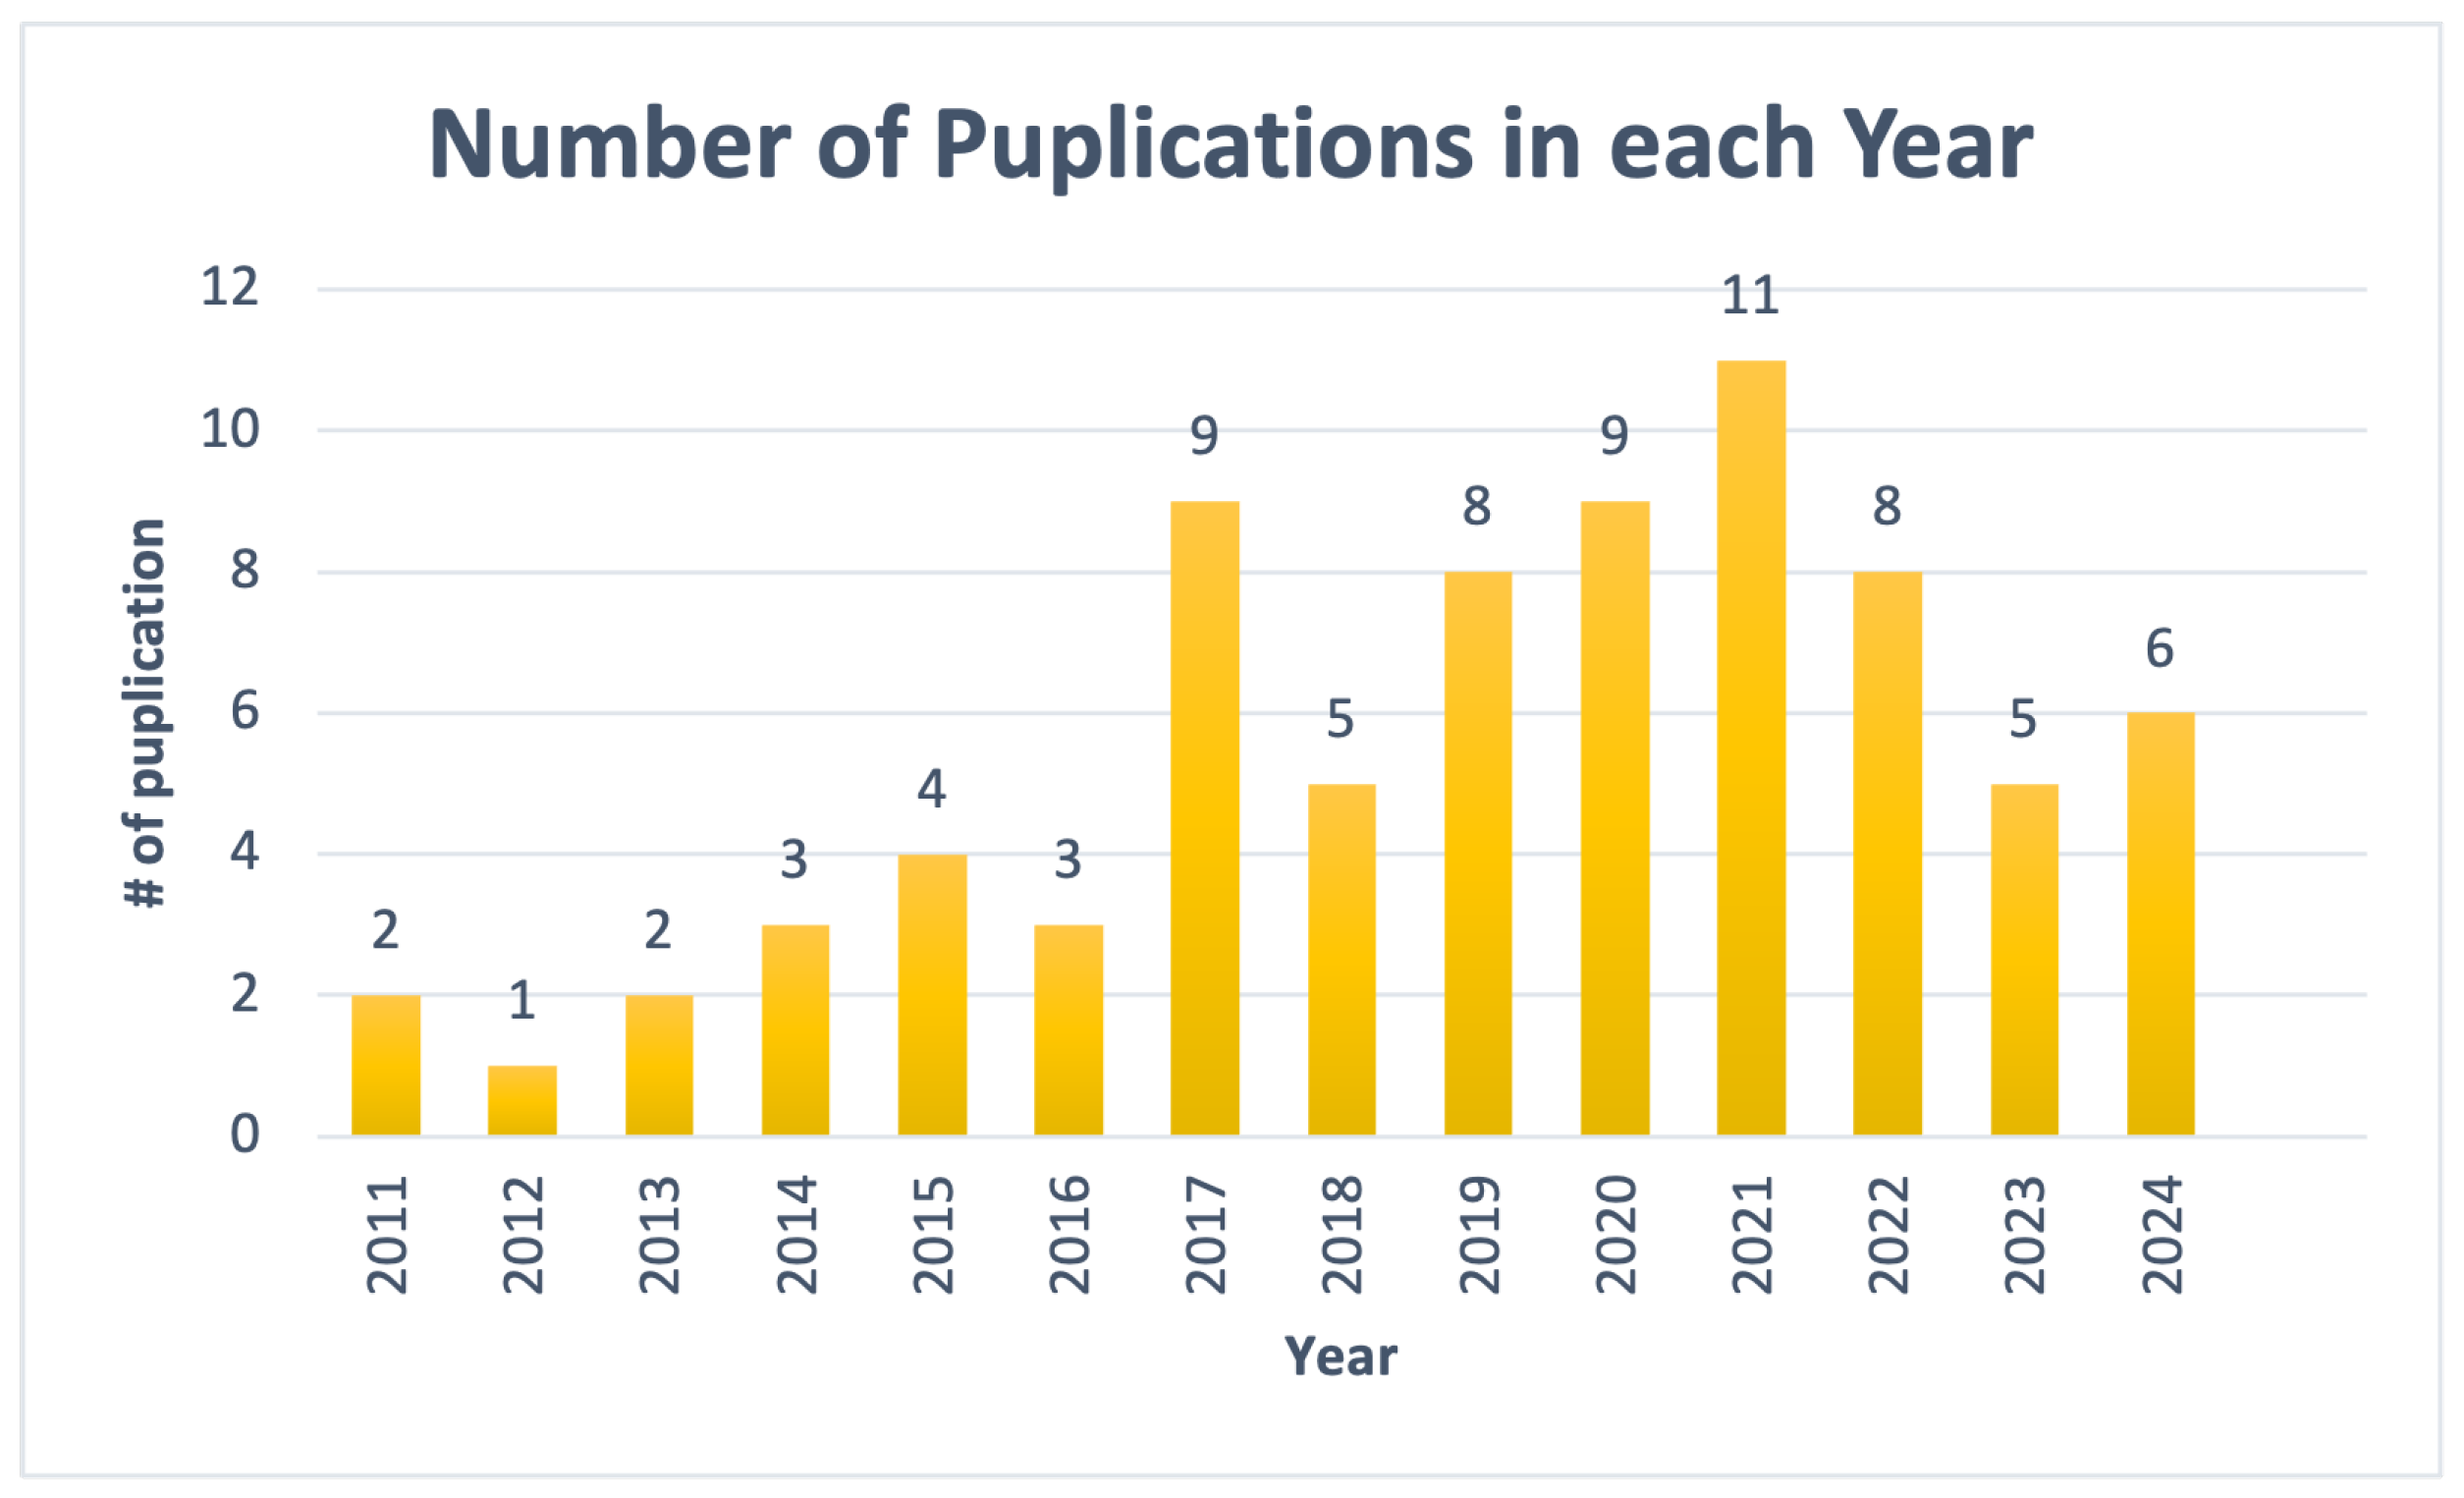
3.4. Publication Years
3.5. ML vs. Non ML Approaches
| ML | Dataset | Accuracy | Non-ML Approach | Dataset | Accuracy | z-Value/p-Value |
|---|---|---|---|---|---|---|
| ANN [75] | Daphnet | 99.5% | Threshold [73] | custom | 99.7% | 1.24975/0.21138 |
| KNN, SVM and MLP [76] | Daphnet | 98.92% | Ad hoc algorithm [83] | custom | 98.51% | |
| CNN [60] | IMU | 98.6% | Threshold [111] | custom | 97.57% | |
| CNN [60] | Daphnet | 98.1% | Adaptive Synthetic sampling algorithm [97] | custom | 97.4% | |
| RF [56] | Daphnet | 96.5% | Anomaly score detector [108] | Daphnet | 94% | |
| DT and RF [124] | custom | 96.11% | Threshold [105] | custom | 92.86% | |
| DT and SVM [34] | custom | 95.5% | Time-frequency domain analysis [106] | Daphnet | 92% |
3.6. System Overview
3.7. Explainability
3.8. Limitations and Future Directions
4. Conclusions
Author Contributions
Funding
Conflicts of Interest
References
- Bloem, B.R.; Okun, M.S.; Klein, C. Parkinson’s disease. Lancet 2021, 397, 2284–2303. [Google Scholar] [CrossRef] [PubMed]
- Hayes, M.T. Parkinson’s disease and parkinsonism. Am. J. Med. 2019, 132, 802–807. [Google Scholar] [CrossRef] [PubMed]
- Rea, P. Essential Clinical Anatomy of the Nervous System; Academic Press: Cambridge, MA, USA, 2015. [Google Scholar]
- Sveinbjornsdottir, S. The clinical symptoms of Parkinson’s disease. J. Neurochem. 2016, 139, 318–324. [Google Scholar] [CrossRef] [PubMed]
- Kumaresan, M.; Khan, S. Spectrum of non-motor symptoms in Parkinson’s disease. Cureus 2021, 13, e13275. [Google Scholar] [CrossRef] [PubMed]
- Parkinson, J. An essay on the shaking palsy. J. Neuropsychiatry Clin. Neurosci. 2002, 14, 223–236. [Google Scholar] [CrossRef] [PubMed]
- Schrag, A.; Horsfall, L.; Walters, K.; Noyce, A.; Petersen, I. Prediagnostic presentations of Parkinson’s disease in primary care: A case-control study. Lancet Neurol. 2015, 14, 57–64. [Google Scholar] [CrossRef] [PubMed]
- Alves, G.; Wentzel-Larsen, T.; Aarsland, D.; Larsen, J.P. Progression of motor impairment and disability in Parkinson disease. Neurology 2005, 65, 1436–1441. [Google Scholar] [CrossRef] [PubMed]
- Le Ray, D.; Juvin, L.; Ryczko, D.; Dubuc, R. Supraspinal control of locomotion: The mesencephalic locomotor region. Prog. Brain Res. 2011, 188, 51–70. [Google Scholar] [PubMed]
- Peterson, D.S.; Horak, F.B. Neural Control of Walking in People with Parkinsonism. Physiology 2016, 31, 95–107. [Google Scholar] [CrossRef]
- Wang, D.D.; Choi, J.T. Brain network oscillations during gait in Parkinson’s disease. Front. Hum. Neurosci. 2020, 14, 568703. [Google Scholar] [CrossRef]
- Lin, C.; Ridder, M.; Sah, P. The PPN and motor control: Preclinical studies to deep brain stimulation for Parkinson’s disease. Front. Neural Circuits 2023, 17, 1095441. [Google Scholar] [CrossRef]
- Huang, C.; Chu, H.; Zhang, Y.; Wang, X. Deep Brain Stimulation to Alleviate Freezing of Gait and Cognitive Dysfunction in Parkinson’s Disease: Update on Current Research and Future Perspectives. Front. Neurosci. 2018, 5. [Google Scholar] [CrossRef] [PubMed]
- Nutt, J.; Bloem, B.; Giladi, N.; Hallett, M.; Horak, F.; Nieuwboer, A. Freezing of gait: Moving forward on a mysterious clinical phenomenon. Lancet Neurol. 2011, 10, 734–744. [Google Scholar] [CrossRef]
- Wang, M.; Jiang, S.; Yuan, Y.; Zhang, L.; Ding, J.; Wang, J.; Zhang, J.; Zhang, K.; Wang, J. Alterations of functional and structural connectivity of freezing of gait in Parkinson’s disease. J. Neurol. 2016, 263, 1583–1592. [Google Scholar] [CrossRef]
- Safiri, S.; Noori, M.; Nejadghaderi, S.A.; Mousavi, S.E.; Sullman, M.J.; Araj-Khodaei, M.; Singh, K.; Kolahi, A.A.; Gharagozli, K. The burden of Parkinson’s disease in the Middle East and North Africa region, 1990–2019: Results from the global burden of disease study 2019. BMC Public Health 2023, 23, 107. [Google Scholar] [CrossRef] [PubMed]
- World Health Organization. Available online: https://www.who.int/news-room/fact-sheets/detail/parkinson-disease (accessed on 25 October 2023).
- Driver, J.A.; Logroscino, G.; Gaziano, J.M.; Kurth, T. Incidence and remaining lifetime risk of Parkinson disease in advanced age. Neurology 2009, 72, 432–438. [Google Scholar] [CrossRef] [PubMed]
- Miller, I.N.; Cronin-Golomb, A. Gender differences in Parkinson’s disease: Clinical characteristics and cognition. Mov. Disord. 2010, 25, 2695–2703. [Google Scholar] [CrossRef] [PubMed]
- Statistics—Parkinson.org. Available online: https://www.parkinson.org/understanding-parkinsons/statistics (accessed on 25 October 2023).
- Van Den Eeden, S.K.; Tanner, C.M.; Bernstein, A.L.; Fross, R.D.; Leimpeter, A.; Bloch, D.A.; Nelson, L.M. Incidence of Parkinson’s Disease: Variation by Age, Gender, and Race/Ethnicity. Am. J. Epidemiol. 2003, 157, 1015–1022. [Google Scholar] [CrossRef]
- Amboni, M.; Stocchi, F.; Abbruzzese, G.; Morgante, L.; Onofrj, M.; Ruggieri, S.; Tinazzi, M.; Zappia, M.; Attar, M.; Colombo, D.; et al. Prevalence and associated features of self-reported freezing of gait in Parkinson disease: The DEEP FOG study. Park. Relat. Disord. 2015, 21, 644–649. [Google Scholar] [CrossRef]
- Perez-Lloret, S.; Negre-Pages, L.; Damier, P.; Delval, A.; Derkinderen, P.; Destée, A.; Meissner, W.G.; Schelosky, L.; Tison, F.; Rascol, O. Prevalence, Determinants, and Effect on Quality of Life of Freezing of Gait in Parkinson Disease. JAMA Neurol. 2014, 71, 884–890. [Google Scholar] [CrossRef]
- Schaafsma, J.; Balash, Y.; Gurevich, T.; Bartels, A.; Hausdorff, J.M.; Giladi, N. Characterization of freezing of gait subtypes and the response of each to levodopa in Parkinson’s disease. Eur. J. Neurol. 2003, 10, 391–398. [Google Scholar] [CrossRef] [PubMed]
- Giladi, N.; Hausdorff, J.M. The role of mental function in the pathogenesis of freezing of gait in Parkinson’s disease. J. Neurol. Sci. 2006, 248, 173–176. [Google Scholar] [CrossRef] [PubMed]
- Giladi, N.; Nieuwboer, A. Understanding and treating freezing of gait in parkinsonism, proposed working definition, and setting the stage. Mov. Disord. 2008, 23 (Suppl. 2), S423–S425. [Google Scholar] [CrossRef] [PubMed]
- Moore, O.; Peretz, C.; Giladi, N. Freezing of gait affects quality of life of peoples with Parkinson’s disease beyond its relationships with mobility and gait. Mov. Disord. Off. J. Mov. Disord. Soc. 2007, 22, 2192–2195. [Google Scholar] [CrossRef] [PubMed]
- Bloem, B.R.; Hausdorff, J.M.; Visser, J.E.; Giladi, N. Falls and freezing of gait in Parkinson’s disease: A review of two interconnected, episodic phenomena. Mov. Disord. Off. J. Mov. Disord. Soc. 2004, 19, 871–884. [Google Scholar] [CrossRef] [PubMed]
- Hausdorff, J.M.; Balash, Y.; Giladi, N. Time series analysis of leg movements during freezing of gait in Parkinson’s disease: Akinesia, rhyme or reason? Phys. A Stat. Mech. Appl. 2003, 321, 565–570. [Google Scholar] [CrossRef]
- Sweeney, D.; Quinlan, L.R.; Browne, P.; Richardson, M.; Meskell, P.; ÓLaighin, G. A technological review of wearable cueing devices addressing freezing of gait in Parkinson’s disease. Sensors 2019, 19, 1277. [Google Scholar] [CrossRef] [PubMed]
- Nonnekes, J.; Snijders, A.H.; Nutt, J.G.; Deuschl, G.; Giladi, N.; Bloem, B.R. Freezing of gait: A practical approach to management. Lancet Neurol. 2015, 14, 768–778. [Google Scholar] [CrossRef] [PubMed]
- Okuma, Y. Practical approach to freezing of gait in Parkinson’s disease. Pract. Neurol. 2014, 14, 222–230. [Google Scholar] [CrossRef]
- Lee, S.J.; Yoo, J.Y.; Ryu, J.S.; Park, H.K.; Chung, S.J. The effects of visual and auditory cues on freezing of gait in patients with Parkinson disease. Am. J. Phys. Med. Rehabil. 2012, 91, 2–11. [Google Scholar] [CrossRef]
- Borzì, L.; Mazzetta, I.; Zampogna, A.; Suppa, A.; Olmo, G.; Irrera, F. Prediction of Freezing of Gait in Parkinson’s Disease Using Wearables and Machine Learning. Sensors 2021, 21, 614. [Google Scholar] [CrossRef] [PubMed]
- Ferster, M.L.; Mazilu, S.; Tröster, G. Gait parameters change prior to freezing in Parkinson’s disease: A data-driven study with wearable inertial units. EAI Endorsed Trans. Ambient Syst. 2015. [Google Scholar]
- Mazilu, S.; Blanke, U.; Dorfman, M.; Gazit, E.; Mirelman, A.M.; Hausdorff, J.; Tröster, G. A wearable assistant for gait training for Parkinson’s disease with freezing of gait in out-of-the-lab environments. ACM Trans. Interact. Intell. Syst. (TIIS) 2015, 5, 1–31. [Google Scholar] [CrossRef]
- Ginis, P.; Nackaerts, E.; Nieuwboer, A.; Heremans, E. Cueing for people with Parkinson’s disease with freezing of gait: A narrative review of the state-of-the-art and novel perspectives. Ann. Phys. Rehabil. Med. 2018, 61, 407–413. [Google Scholar] [CrossRef] [PubMed]
- McCandless, P.J.; Evans, B.J.; Janssen, J.; Selfe, J.; Churchill, A.; Richards, J. Effect of three cueing devices for people with Parkinson’s disease with gait initiation difficulties. Gait Posture 2016, 44, 7–11. [Google Scholar] [CrossRef] [PubMed]
- Nieuwboer, A. Cueing for freezing of gait in patients with Parkinson’s disease: A rehabilitation perspective. Mov. Disord. Off. J. Mov. Disord. Soc. 2008, 23, S475–S481. [Google Scholar] [CrossRef] [PubMed]
- Bächlin, M.; Plotnik, M.; Roggen, D.; Maidan, I.; Hausdorff, J.; Giladi, N.; Troster, G. Wearable Assistant for Parkinson’s Disease Patients with the Freezing of Gait Symptom. Inf. Technol. Biomed. IEEE Trans. 2010, 14, 436–446. [Google Scholar] [CrossRef] [PubMed]
- Ribeiro De Souza, C.; Miao, R.; Ávila De Oliveira, J.; Cristina De Lima-Pardini, A.; Fragoso De Campos, D.; Silva-Batista, C.; Teixeira, L.; Shokur, S.; Mohamed, B.; Coelho, D.B. A Public Data Set of Videos, Inertial Measurement Unit, and Clinical Scales of Freezing of Gait in Individuals with Parkinson’s Disease During a Turning-In-Place Task. Front. Neurosci. 2022, 16, 832463. [Google Scholar] [CrossRef] [PubMed]
- Mazilu, S.; Calatroni, A.; Gazit, E.; Mirelman, A.; Hausdorff, J.M.; Tröster, G. Prediction of Freezing of Gait in Parkinson’s From Physiological Wearables: An Exploratory Study. IEEE J. Biomed. Health Inform. 2015, 19, 1843–1854. [Google Scholar] [CrossRef]
- Mazilu, S.; Blanke, U.; Roggen, D.; Tröster, G.; Gazit, E.; Hausdorff, J.M. Engineers meet clinicians: Augmenting Parkinson’s disease patients to gather information for gait rehabilitation. In Proceedings of the 4th Augmented Human International Conference, New York, NY, USA, 7 March 2013; AH ’13. pp. 124–127. [Google Scholar] [CrossRef]
- Zhang, W.; Yang, Z.; Li, H.; Huang, D.; Wang, L.; Wei, Y.; Zhang, L.; Ma, L.; Feng, H.; Pan, J.; et al. Multimodal Data for the Detection of Freezing of Gait in Parkinson’s Disease. Sci. Data 2022, 9, 606. [Google Scholar] [CrossRef]
- Li, H. Multimodal dataset of freezing of gait in parkinson’s disease. Mendeley Data 2021, 3, 2021. [Google Scholar]
- Rodríguez-Martín, D.; Samà, A.; Pérez-López, C.; Català, A.; Moreno Arostegui, J.M.; Cabestany, J.; Bayés, À.; Alcaine, S.; Mestre, B.; Prats, A.; et al. Home detection of freezing of gait using support vector machines through a single waist-worn triaxial accelerometer. PLoS ONE 2017, 12, e0171764. [Google Scholar] [CrossRef] [PubMed]
- Borzì, L.; Varrecchia, M.; Olmo, G.; Artusi, C.A.; Fabbri, M.; Rizzone, M.G.; Romagnolo, A.; Zibetti, M.; Lopiano, L. Home monitoring of motor fluctuations in Parkinson’s disease patients. J. Reliab. Intell. Environ. 2019, 5, 145–162. [Google Scholar] [CrossRef]
- Borzì, L.; Olmo, G.; Artusi, C.A.; Fabbri, M.; Rizzone, M.G.; Romagnolo, A.; Zibetti, M.; Lopiano, L. A new index to assess turning quality and postural stability in patients with Parkinson’s disease. Biomed. Signal Process. Control 2020, 62, 102059. [Google Scholar] [CrossRef]
- Ginis, P.; Heremans, E.; Ferrari, A.; Bekkers, E.M.; Canning, C.G.; Nieuwboer, A. External input for gait in people with Parkinson’s disease with and without freezing of gait: One size does not fit all. J. Neurol. 2017, 264, 1488–1496. [Google Scholar] [CrossRef] [PubMed]
- Bächlin, M.; Plotnik, M.; Roggen, D.; Giladi, N.; Hausdorff, J.M.; Tröster, G. A wearable system to assist walking of Parkinson s disease patients. Methods Inf. Med. 2010, 49, 88–95. [Google Scholar]
- Zhang, W.; Han, Y.; Shi, Y.; Yan, S.; Song, W.; Cui, G.; Xiang, J. Effects of wearable visual cueing on gait pattern and stability in patients with Parkinson’s disease. Front. Neurol. 2023, 14, 1077871. [Google Scholar] [CrossRef] [PubMed]
- Hoogendoorn, E.M.; Geerse, D.J.; van Dam, A.T.; Stins, J.F.; Roerdink, M. Gait-modifying effects of augmented-reality cueing in people with Parkinson’s disease. Front. Neurol. 2024, 15, 1379243. [Google Scholar] [CrossRef]
- Vitório, R.; Morris, R.; Das, J.; Walker, R.; Mancini, M.; Stuart, S. Brain activity response to cues during gait in Parkinson’s disease: A study protocol. PLoS ONE 2022, 17, e0275894. [Google Scholar] [CrossRef]
- Huang, D.; Wu, C.; Wang, Y.; Zhang, Z.; Chen, C.; Li, L.; Zhang, W.; Zhang, Z.; Li, J.; Guo, Y.; et al. Episode-level prediction of freezing of gait based on wearable inertial signals using a deep neural network model. Biomed. Signal Process. Control 2024, 88, 105613. [Google Scholar] [CrossRef]
- Xia, Y.; Sun, H.; Zhang, B.; Xu, Y.; Ye, Q. Prediction of freezing of gait based on self-supervised pretraining via contrastive learning. Biomed. Signal Process. Control 2024, 89, 105765. [Google Scholar] [CrossRef]
- Khosla, A.; Kumar, N.; Khera, P. Machine learning approach for predicting state transitions via shank acceleration data during freezing of gait in Parkinson’s disease. Biomed. Signal Process. Control 2024, 92, 106053. [Google Scholar] [CrossRef]
- Sun, H.; Ye, Q.; Xia, Y. Predicting freezing of gait in patients with Parkinson’s disease by combination of Manually-Selected and deep learning features. Biomed. Signal Process. Control 2024, 88, 105639. [Google Scholar] [CrossRef]
- Yang, P.K.; Filtjens, B.; Ginis, P.; Goris, M.; Nieuwboer, A.; Gilat, M.; Slaets, P.; Vanrumste, B. Freezing of gait assessment with inertial measurement units and deep learning: Effect of tasks, medication states, and stops. J. Neuroeng. Rehabil. 2024, 21, 24. [Google Scholar] [CrossRef] [PubMed]
- Cohen, S.; Rokach, L. BagStacking: An Integrated Ensemble Learning Approach for Freezing of Gait Detection in Parkinson’s Disease. arXiv 2024, arXiv:2402.17783. [Google Scholar]
- Dimoudis, D.; Tsolakis, N.; Magga-Nteve, C.; Meditskos, G.; Vrochidis, S.; Kompatsiaris, I. InSEption: A robust mechanism for predicting FoG episodes in PD patients. Electronics 2023, 12, 2088. [Google Scholar] [CrossRef]
- Ouyang, S.; Chen, Z.; Chen, S.; Zhao, J. Prediction of Freezing of Gait in Parkinson’s Disease Using Time-Series Data from Wearable Sensors. In Proceedings of the 2023 42nd Chinese Control Conference (CCC), Tianjin, China, 24–26 July 2023; pp. 3269–3273. [Google Scholar] [CrossRef]
- Mo, W.T.; Chan, J.H. Freezing of Gait Prediction Using Deep Learning. In Proceedings of the 13th International Conference on Advances in Information Technology, Bangkok, Thailand, 6–9 December 2023. IAIT ’23. [Google Scholar] [CrossRef]
- Howard, A.; Salomon, A.; Gazit, E.; L-Jevster, H.C.; Hausdorff, J.; Kirsch, L.; Maggie; Ginis, P.; Holbrook, R.; Karim, Y.F. Parkinson’s Freezing of Gait Prediction. 2023. Available online: https://kaggle.com/competitions/tlvmc-parkinsons-freezing-gait-prediction (accessed on 3 March 2024).
- Bajpai, R.; Khare, S.; Joshi, D. A Multimodal Model-Fusion Approach for Improved Prediction of Freezing of Gait in Parkinson’s Disease. IEEE Sens. J. 2023, 23, 16168–16175. [Google Scholar] [CrossRef]
- Borzì, L.; Sigcha, L.; Rodríguez-Martín, D.; Olmo, G. Real-time detection of freezing of gait in Parkinson’s disease using multi-head convolutional neural networks and a single inertial sensor. Artif. Intell. Med. 2023, 135, 102459. [Google Scholar] [CrossRef] [PubMed]
- Ren, K.; Chen, Z.; Ling, Y.; Zhao, J. Recognition of freezing of gait in Parkinson’s disease based on combined wearable sensors. BMC Neurol. 2022, 22, 229. [Google Scholar] [CrossRef]
- Pardoel, S.; Nantel, J.; Kofman, J.; Lemaire, E.D. Prediction of freezing of gait in Parkinson’s disease using unilateral and bilateral plantar-pressure data. Front. Neurol. 2022, 13, 831063. [Google Scholar] [CrossRef]
- Pardoel, S.; Shalin, G.; Nantel, J.; Lemaire, E.D.; Kofman, J. Early detection of freezing of gait during walking using inertial measurement unit and plantar pressure distribution data. Sensors 2021, 21, 2246. [Google Scholar] [CrossRef] [PubMed]
- Guo, Y.; Huang, D.; Zhang, W.; Wang, L.; Li, Y.; Olmo, G.; Wang, Q.; Meng, F.; Chan, P. High-accuracy wearable detection of freezing of gait in Parkinson’s disease based on pseudo-multimodal features. Comput. Biol. Med. 2022, 146, 105629. [Google Scholar] [CrossRef] [PubMed]
- Shi, B.; Tay, A.; Au, W.L.; Tan, D.M.L.; Chia, N.S.Y.; Yen, S.C. Detection of Freezing of Gait Using Convolutional Neural Networks and Data From Lower Limb Motion Sensors. IEEE Trans. Biomed. Eng. 2022, 69, 2256–2267. [Google Scholar] [CrossRef]
- O’Day, J.; Lee, M.; Seagers, K.; Hoffman, S.; Jih-Schiff, A.; Kidziński, Ł.; Delp, S.; Bronte-Stewart, H. Assessing inertial measurement unit locations for freezing of gait detection and patient preference. J. Neuroeng. Rehabil. 2022, 19, 20. [Google Scholar] [CrossRef] [PubMed]
- Naghavi, N.; Wade, E. Towards Real-Time Prediction of Freezing of Gait in Patients with Parkinson’s Disease: A Novel Deep One-Class Classifier. IEEE J. Biomed. Health Inform. 2022, 26, 1726–1736. [Google Scholar] [CrossRef]
- Pierleoni, P.; Belli, A.; Bazgir, O.; Maurizi, L.; Paniccia, M.; Palma, L. A Smart Inertial System for 24h Monitoring and Classification of Tremor and Freezing of Gait in Parkinson’s Disease. IEEE Sens. J. 2019, 19, 11612–11623. [Google Scholar] [CrossRef]
- Mesin, L.; Porcu, P.; Russu, D.; Farina, G.; Borzì, L.; Zhang, W.; Guo, Y.; Olmo, G. A multi-modal analysis of the freezing of gait phenomenon in Parkinson’s disease. Sensors 2022, 22, 2613. [Google Scholar] [CrossRef]
- Prado, A.; Kwei, K.; Vanegas-Arroyave, N.; Agrawal, S.K. Identification of Freezing of Gait in Parkinson’s Patients Using Instrumented Shoes and Artificial Neural Networks. In Proceedings of the 2020 8th IEEE RAS/EMBS International Conference for Biomedical Robotics and Biomechatronics (BioRob), New York, NY, USA, 29 November–1 December 2020; pp. 68–73. [Google Scholar] [CrossRef]
- Halder, A.; Singh, R.; Suri, A.; Joshi, D. Predicting State Transition in Freezing of Gait via Acceleration Measurements for Controlled Cueing in Parkinson’s Disease. IEEE Trans. Instrum. Meas. 2021, 70, 1–16. [Google Scholar] [CrossRef]
- Filtjens, B.; Ginis, P.; Nieuwboer, A.; Afzal, M.R.; Spildooren, J.; Vanrumste, B.; Slaets, P. Modelling and identification of characteristic kinematic features preceding freezing of gait with convolutional neural networks and layer-wise relevance propagation. BMC Med. Inform. Decis. Mak. 2021, 21, 341. [Google Scholar] [CrossRef]
- Spildooren, J.; Vercruysse, S.; Desloovere, K.; Vandenberghe, W.; Kerckhofs, E.; Nieuwboer, A. Freezing of gait in Parkinson’s disease: The impact of dual-tasking and turning. Mov. Disord. 2010, 25, 2563–2570. [Google Scholar] [CrossRef]
- Shalin, G.; Pardoel, S.; Lemaire, E.D.; Nantel, J.; Kofman, J. Prediction and detection of freezing of gait in Parkinson’s disease from plantar pressure data using long short-term memory neural-networks. J. Neuroeng. Rehabil. 2021, 18, 167. [Google Scholar] [CrossRef] [PubMed]
- Esfahani, A.H.; Dyka, Z.; Ortmann, S.; Langendörfer, P. Impact of Data Preparation in Freezing of Gait Detection Using Feature-Less Recurrent Neural Network. IEEE Access 2021, 9, 138120–138131. [Google Scholar] [CrossRef]
- Bikias, T.; Iakovakis, D.; Hadjidimitriou, S.; Charisis, V.; Hadjileontiadis, L.J. DeepFoG: An IMU-Based Detection of Freezing of Gait Episodes in Parkinson’s Disease Patients via Deep Learning. Front. Robot. AI 2021, 8. [Google Scholar] [CrossRef] [PubMed]
- Basaklar, T.; Tuncel, Y.; Ogras, U.Y. Subject-Independent Freezing of Gait (FoG) Prediction in Parkinson’s Disease Patients. In Proceedings of the 2021 IEEE Biomedical Circuits and Systems Conference (BioCAS), Berlin, Germany, 7–9 October 2021; pp. 1–6. [Google Scholar] [CrossRef]
- Suppa, A.; Kita, A.; Leodori, G.; Zampogna, A.; Nicolini, E.; Lorenzi, P.; Rao, R.; Irrera, F. L-DOPA and freezing of gait in Parkinson’s disease: Objective assessment through a wearable wireless system. Front. Neurol. 2017, 8, 406. [Google Scholar] [CrossRef] [PubMed]
- Ghosh, N.; Banerjee, I. IoT-based freezing of gait detection using grey relational analysis. Internet Things 2021, 13, 100068. [Google Scholar] [CrossRef]
- Li, B.; Yao, Z.; Wang, J.; Wang, S.; Yang, X.; Sun, Y. Improved deep learning technique to detect freezing of gait in Parkinson’s disease based on wearable sensors. Electronics 2020, 9, 1919. [Google Scholar] [CrossRef]
- Zhang, Y.; Yan, W.; Yao, Y.; Ahmed, J.B.; Tan, Y.; Gu, D. Prediction of Freezing of Gait in Patients with Parkinson’s Disease by Identifying Impaired Gait Patterns. IEEE Trans. Neural Syst. Rehabil. Eng. 2020, 28, 591–600. [Google Scholar] [CrossRef] [PubMed]
- Demrozi, F.; Bacchin, R.; Tamburin, S.; Cristani, M.; Pravadelli, G. Toward a Wearable System for Predicting Freezing of Gait in People Affected by Parkinson’s Disease. IEEE J. Biomed. Health Inform. 2020, 24, 2444–2451. [Google Scholar] [CrossRef]
- O’Day, J.J.; Kehnemouyi, Y.M.; Petrucci, M.N.; Anderson, R.W.; Herron, J.A.; Bronte-Stewart, H.M. Demonstration of Kinematic-Based Closed-loop Deep Brain Stimulation for Mitigating Freezing of Gait in People with Parkinson’s Disease. In Proceedings of the 2020 42nd Annual International Conference of the IEEE Engineering in Medicine & Biology Society (EMBC), Montreal, QC, Canada, 20–24 July 2020; pp. 3612–3616. [Google Scholar] [CrossRef]
- Shi, B.; Yen, S.C.; Tay, A.; Tan, D.M.; Chia, N.S.Y.; Au, W. Convolutional Neural Network for Freezing of Gait Detection Leveraging the Continuous Wavelet Transform on Lower Extremities Wearable Sensors Data. In Proceedings of the 2020 42nd Annual International Conference of the IEEE Engineering in Medicine & Biology Society (EMBC), Montreal, QC, Canada, 20–24 July 2020; pp. 5410–5415. [Google Scholar] [CrossRef]
- Kleanthous, N.; Hussain, A.J.; Khan, W.; Liatsis, P. A new machine learning based approach to predict Freezing of Gait. Pattern Recognit. Lett. 2020, 140, 119–126. [Google Scholar] [CrossRef]
- Reches, T.; Dagan, M.; Herman, T.; Gazit, E.; Gouskova, N.A.; Giladi, N.; Manor, B.; Hausdorff, J.M. Using wearable sensors and machine learning to automatically detect freezing of gait during a FOG-provoking test. Sensors 2020, 20, 4474. [Google Scholar] [CrossRef]
- Sigcha, L.; Costa, N.; Pavón, I.; Costa, S.; Arezes, P.; López, J.M.; De Arcas, G. Deep learning approaches for detecting freezing of gait in Parkinson’s disease patients through on-body acceleration sensors. Sensors 2020, 20, 1895. [Google Scholar] [CrossRef] [PubMed]
- San-Segundo, R.; Torres-Sánchez, R.; Hodgins, J.; De la Torre, F. Increasing robustness in the detection of freezing of gait in Parkinson’s disease. Electronics 2019, 8, 119. [Google Scholar] [CrossRef]
- Naghavi, N.; Wade, E. Prediction of Freezing of Gait in Parkinson’s Disease Using Statistical Inference and Lower–Limb Acceleration Data. IEEE Trans. Neural Syst. Rehabil. Eng. 2019, 27, 947–955. [Google Scholar] [CrossRef] [PubMed]
- Mazzetta, I.; Zampogna, A.; Suppa, A.; Gumiero, A.; Pessione, M.; Irrera, F. Wearable sensors system for an improved analysis of Freezing of gait in Parkinson’s disease using electromyography and inertial signals. Sensors 2019, 19, 948. [Google Scholar] [CrossRef] [PubMed]
- Guo, Y.; Wang, L.; Li, Y.; Guo, L.; Meng, F. The Detection of Freezing of Gait in Parkinson’s Disease Using Asymmetric Basis Function TV-ARMA Time–Frequency Spectral Estimation Method. IEEE Trans. Neural Syst. Rehabil. Eng. 2019, 27, 2077–2086. [Google Scholar] [CrossRef] [PubMed]
- Naghavi, N.; Miller, A.; Wade, E. Towards real-time prediction of freezing of gait in patients with Parkinson’s disease: Addressing the class imbalance problem. Sensors 2019, 19, 3898. [Google Scholar] [CrossRef] [PubMed]
- Arami, A.; Poulakakis-Daktylidis, A.; Tai, Y.F.; Burdet, E. Prediction of Gait Freezing in Parkinsonian Patients: A Binary Classification Augmented with Time Series Prediction. IEEE Trans. Neural Syst. Rehabil. Eng. 2019, 27, 1909–1919. [Google Scholar] [CrossRef] [PubMed]
- Mikos, V.; Heng, C.H.; Tay, A.; Yen, S.C.; Chia, N.S.Y.; Koh, K.M.L.; Tan, D.M.L.; Au, W.L. A Wearable, Patient-Adaptive Freezing of Gait Detection System for Biofeedback Cueing in Parkinson’s Disease. IEEE Trans. Biomed. Circuits Syst. 2019, 13, 503–515. [Google Scholar] [CrossRef] [PubMed]
- Orphanidou, N.K.; Hussain, A.; Keight, R.; Lishoa, P.; Hind, J.; Al-Askar, H. Predicting Freezing of Gait in Parkinsons Disease Patients Using Machine Learning. In Proceedings of the 2018 IEEE Congress on Evolutionary Computation (CEC), Rio de Janeiro, Brazil, 8–13 July 2018; pp. 1–8. [Google Scholar] [CrossRef]
- Handojoseno, A.; Naik, G.; Gilat, M.; Shine, J.; Nguyen, T.; Ly, Q.T.; Lewis, S.; Nguyen, H. Prediction of Freezing of Gait in Patients with Parkinson’s Disease Using EEG Signals. Stud. Health Technol. Inform. 2018, 246, 124–131. [Google Scholar]
- Aich, S.; Pradhan, P.M.; Park, J.; Sethi, N.; Vathsa, V.S.S.; Kim, H.C. A validation study of freezing of gait (FoG) detection and machine-learning-based FoG prediction using estimated gait characteristics with a wearable accelerometer. Sensors 2018, 18, 3287. [Google Scholar] [CrossRef]
- Camps, J.; Samà, A.; Martín, M.; Rodriguez-Martin, D.; Pérez-López, C.; Arostegui, J.M.M.; Cabestany, J.; Catala, A.; Alcaine, S.; Mestre, B.; et al. Deep learning for freezing of gait detection in Parkinson’s disease patients in their homes using a waist-worn inertial measurement unit. Knowl.-Based Syst. 2018, 139, 119–131. [Google Scholar] [CrossRef]
- Samà, A.; Rodríguez-Martín, D.; Pérez-López, C.; Català, A.; Alcaine, S.; Mestre, B.; Prats, A.; Crespo, M.C.; Bayés, À. Determining the optimal features in freezing of gait detection through a single waist accelerometer in home environments. Pattern Recognit. Lett. 2018, 105, 135–143. [Google Scholar] [CrossRef]
- Ahn, D.; Chung, H.; Lee, H.W.; Kang, K.; Ko, P.W.; Kim, N.S.; Park, T. Smart gait-aid glasses for Parkinson’s disease patients. IEEE Trans. Biomed. Eng. 2017, 64, 2394–2402. [Google Scholar] [CrossRef] [PubMed]
- Pham, T.T.; Nguyen, D.N.; Dutkiewicz, E.; McEwan, A.L.; Leong, P.H. Wearable healthcare systems: A single channel accelerometer based anomaly detector for studies of gait freezing in Parkinson’s disease. In Proceedings of the 2017 IEEE International Conference on Communications (ICC), Paris, France, 21–25 May 2017; pp. 1–5. [Google Scholar] [CrossRef]
- Palmerini, L.; Rocchi, L.; Mazilu, S.; Gazit, E.; Hausdorff, J.M.; Chiari, L. Identification of Characteristic Motor Patterns Preceding Freezing of Gait in Parkinson’s Disease Using Wearable Sensors. Front. Neurol. 2017, 8. [Google Scholar] [CrossRef] [PubMed]
- Pham, T.T.; Moore, S.T.; Lewis, S.J.G.; Nguyen, D.N.; Dutkiewicz, E.; Fuglevand, A.J.; McEwan, A.L.; Leong, P.H. Freezing of Gait Detection in Parkinson’s Disease: A Subject-Independent Detector Using Anomaly Scores. IEEE Trans. Biomed. Eng. 2017, 64, 2719–2728. [Google Scholar] [CrossRef] [PubMed]
- Ly, Q.T.; Handojoseno, A.A.; Gilat, M.; Chai, R.; Ehgoetz Martens, K.A.; Georgiades, M.; Naik, G.R.; Tran, Y.; Lewis, S.J.; Nguyen, H.T. Detection of turning freeze in Parkinson’s disease based on S-transform decomposition of EEG signals. In Proceedings of the 2017 39th Annual International Conference of the IEEE Engineering in Medicine and Biology Society (EMBC), Jeju, Republic of Korea, 11–15 July 2017; pp. 3044–3047. [Google Scholar] [CrossRef]
- Rodríguez-Martín, D.; Pérez-López, C.; Samà, A.; Català, A.; Moreno Arostegui, J.M.; Cabestany, J.; Mestre, B.; Alcaine, S.; Prats, A.; Cruz Crespo, M.d.l.; et al. A waist-worn inertial measurement unit for long-term monitoring of Parkinson’s disease patients. Sensors 2017, 17, 827. [Google Scholar] [CrossRef] [PubMed]
- Kita, A.; Lorenzi, P.; Rao, R.; Irrera, F. Reliable and Robust Detection of Freezing of Gait Episodes with Wearable Electronic Devices. IEEE Sens. J. 2017, 17, 1899–1908. [Google Scholar] [CrossRef]
- Zia, J.; Tadayon, A.; McDaniel, T.; Panchanathan, S. Utilizing Neural Networks to Predict Freezing of Gait in Parkinson’s Patients. In Proceedings of the 18th International ACM SIGACCESS Conference on Computers and Accessibilit, Reno, NV, USA, 23–26 October 2016; ASSETS ’16. pp. 333–334. [Google Scholar] [CrossRef]
- Mazilu, S.; Blanke, U.; Calatroni, A.; Gazit, E.; Hausdorff, J.; Tröster, G. The role of wrist-mounted inertial sensors in detecting gait freeze episodes in Parkinson’s disease. Pervasive Mob. Comput. 2016, 33. [Google Scholar] [CrossRef]
- Rezvanian, S.; Lockhart, T.E. Towards real-time detection of freezing of gait using wavelet transform on wireless accelerometer data. Sensors 2016, 16, 475. [Google Scholar] [CrossRef]
- Capecci, M.; Pepa, L.; Verdini, F.; Ceravolo, M.G. A smartphone-based architecture to detect and quantify freezing of gait in Parkinson’s disease. Gait Posture 2016, 50, 28–33. [Google Scholar] [CrossRef]
- Zach, H.; Janssen, A.M.; Snijders, A.H.; Delval, A.; Ferraye, M.U.; Auff, E.; Weerdesteyn, V.; Bloem, B.R.; Nonnekes, J. Identifying freezing of gait in Parkinson’s disease during freezing provoking tasks using waist-mounted accelerometry. Park. Relat. Disord. 2015, 21, 1362–1366. [Google Scholar] [CrossRef]
- Kim, H.; Lee, H.J.; Lee, W.; Kwon, S.; Kim, S.K.; Jeon, H.S.; Park, H.; Shin, C.W.; Yi, W.J.; Jeon, B.S.; et al. Unconstrained detection of freezing of Gait in Parkinson’s disease patients using smartphone. In Proceedings of the 2015 37th Annual International Conference of the IEEE Engineering in Medicine and Biology Society (EMBC), Milan, Italy, 25–29 August 2015; pp. 3751–3754. [Google Scholar] [CrossRef]
- Coste, C.A.; Sijobert, B.; Pissard-Gibollet, R.; Pasquier, M.; Espiau, B.; Geny, C. Detection of freezing of gait in Parkinson disease: Preliminary results. Sensors 2014, 14, 6819–6827. [Google Scholar] [CrossRef] [PubMed]
- Kwon, Y.; Park, S.H.; Kim, J.W.; Ho, Y.; Jeon, H.M.; Bang, M.J.; Jung, G.I.; Lee, S.M.; Eom, G.M.; Koh, S.B.; et al. A practical method for the detection of freezing of gait in patients with Parkinson’s disease. Clin. Interv. Aging 2014, 9, 1709–1719. [Google Scholar]
- Yungher, D.A.; Morris, T.R.; Dilda, V.; Shine, J.M.; Naismith, S.L.; Lewis, S.J.; Moore, S.T. Temporal characteristics of high-frequency lower-limb oscillation during freezing of gait in Parkinson’s disease. Park. Dis. 2014, 2014, 606427. [Google Scholar] [CrossRef] [PubMed]
- Tripoliti, E.E.; Tzallas, A.T.; Tsipouras, M.G.; Rigas, G.; Bougia, P.; Leontiou, M.; Konitsiotis, S.; Chondrogiorgi, M.; Tsouli, S.; Fotiadis, D.I. Automatic detection of freezing of gait events in patients with Parkinson’s disease. Comput. Methods Programs Biomed. 2013, 110, 12–26. [Google Scholar] [CrossRef]
- Moore, S.T.; Yungher, D.A.; Morris, T.R.; Dilda, V.; MacDougall, H.G.; Shine, J.M.; Naismith, S.L.; Lewis, S.J. Autonomous identification of freezing of gait in Parkinson’s disease from lower-body segmental accelerometry. J. Neuroeng. Rehabil. 2013, 10, 1–11. [Google Scholar] [CrossRef] [PubMed]
- Mazilu, S.; Hardegger, M.; Zhu, Z.; Roggen, D.; Tröster, G.; Plotnik, M.; Hausdorff, J.M. Online detection of freezing of gait with smartphones and machine learning techniques. In Proceedings of the 2012 6th International Conference on Pervasive Computing Technologies for Healthcare (PervasiveHealth) and Workshops, San Diego, CA, USA, 21–24 May 2012; pp. 123–130. [Google Scholar] [CrossRef]
- Tsipouras, M.G.; Tzallas, A.T.; Tripoliti, E.; Rigas, G.; Bougia, P.; Fotiadis, D.I.; Tsouli, S.; Konitsiotis, S. On assessing motor disorders in parkinson’s disease. In Proceedings of the Wireless Mobile Communication and Healthcare: Second International ICST Conference, MobiHealth 2010, Ayia Napa, Cyprus, 18–20 October 2010; Revised Selected Papers 1. Springer: Berlin/Heidelberg, Germany, 2011; pp. 35–38. [Google Scholar]
- Cole, B.T.; Roy, S.H.; Nawab, S.H. Detecting freezing-of-gait during unscripted and unconstrained activity. In Proceedings of the 2011 Annual International Conference of the IEEE Engineering in Medicine and Biology Society, Boston, MA, USA, 30 August–3 September 2011; pp. 5649–5652. [Google Scholar] [CrossRef]
- Arias, P.; Cudeiro, J. Effect of rhythmic auditory stimulation on gait in Parkinsonian patients with and without freezing of gait. PLoS ONE 2010, 5, e9675. [Google Scholar] [CrossRef] [PubMed]
- Samà, A.; Pérez-López, C.; Rodríguez-Martín, D.; Moreno-Aróstegui, J.M.; Rovira, J.; Ahlrichs, C.; Castro, R.; Cevada, J.; Graça, R.; Guimarães, V.; et al. A double closed loop to enhance the quality of life of Parkinson’s Disease patients: REMPARK system. Innov. Med. Healthc. 2015, 207, 115–124. [Google Scholar]
- Zhao, Y.; Nonnekes, J.; Storcken, E.J.; Janssen, S.; van Wegen, E.E.; Bloem, B.R.; Dorresteijn, L.D.; van Vugt, J.P.; Heida, T.; van Wezel, R.J. Feasibility of external rhythmic cueing with the Google Glass for improving gait in people with Parkinson’s disease. J. Neurol. 2016, 263, 1156–1165. [Google Scholar] [CrossRef]
- Zoetewei, D.; Herman, T.; Brozgol, M.; Ginis, P.; Thumm, P.C.; Ceulemans, E.; Decaluwé, E.; Palmerini, L.; Ferrari, A.; Nieuwboer, A.; et al. Protocol for the DeFOG trial: A randomized controlled trial on the effects of smartphone-based, on-demand cueing for freezing of gait in Parkinson’s disease. Contemp. Clin. Trials Commun. 2021, 24, 100817. [Google Scholar] [CrossRef]
- Espay, A.J.; Baram, Y.; Dwivedi, A.K.; Shukla, R.; Gartner, M.; Gaines, L.; Duker, A.P.; Revilla, F.J. At-home training with closed-loop augmented-reality cueing device for improving gait in patients with Parkinson disease. J. Rehabil. Res. Dev. 2010, 47, 573–581. [Google Scholar] [CrossRef] [PubMed]
- Bryant, M.S.; Rintala, D.H.; Lai, E.C.; Protas, E.J. A pilot study: Influence of visual cue color on freezing of gait in persons with Parkinson’s disease. Disabil. Rehabil. Assist. Technol. 2010, 5, 456–461. [Google Scholar] [CrossRef] [PubMed]
- Donovan, S.; Lim, C.; Diaz, N.; Browner, N.; Rose, P.; Sudarsky, L.; Tarsy, D.; Fahn, S.; Simon, D. Laserlight cues for gait freezing in Parkinson’s disease: An open-label study. Park. Relat. Disord. 2011, 17, 240–245. [Google Scholar] [CrossRef] [PubMed]
- Buated, W.; Sriyudthsak, M.; Sribunruangrit, N.; Bhidayasiri, R. A low-cost intervention for improving gait in Parknson’s disease patients: A cane providing visual cues. Eur. Geriatr. Med. 2012, 3, 126–130. [Google Scholar] [CrossRef]
- Tang, L.; Gao, C.; Wang, D.; Liu, A.; Chen, S.; Gu, D. Rhythmic laser cue is beneficial for improving gait performance and reducing freezing of turning in Parkinson’s disease patients with freezing of gait. Int. J. Clin. Exp. Med. 2017, 10, 16802–16808. [Google Scholar]
- Barthel, C.; Nonnekes, J.; Van Helvert, M.; Haan, R.; Janssen, A.; Delval, A.; Weerdesteyn, V.; Debû, B.; Van Wezel, R.; Bloem, B.R.; et al. The laser shoes: A new ambulatory device to alleviate freezing of gait in Parkinson disease. Neurology 2018, 90, e164–e171. [Google Scholar] [CrossRef] [PubMed]
- Geerse, D.J.; Coolen, B.; van Hilten, J.J.; Roerdink, M. Holocue: A wearable holographic cueing application for alleviating freezing of gait in Parkinson’s disease. Front. Neurol. 2022, 12, 628388. [Google Scholar] [CrossRef] [PubMed]
- Rosenthal, L.; Sweeney, D.; Cunnington, A.L.; Quinlan, L.R.; OLaighin, G. Sensory electrical stimulation cueing may reduce freezing of gait episodes in Parkinson’s disease. J. Healthc. Eng. 2018, 2018, 4684925. [Google Scholar] [CrossRef] [PubMed]
- Gonçalves, H.; Moreira, R.; Rodrigues, A.; Santos, C. Finding parameters around the abdomen for a vibrotactile system: Healthy and patients with Parkinson’s disease. J. Med. Syst. 2018, 42, 232. [Google Scholar] [CrossRef]
- Mancini, M.; Smulders, K.; Harker, G.; Stuart, S.; Nutt, J.G. Assessment of the ability of open-and closed-loop cueing to improve turning and freezing in people with Parkinson’s disease. Sci. Rep. 2018, 8, 12773. [Google Scholar] [CrossRef]
- Kim, J.; Porciuncula, F.; Yang, H.D.; Wendel, N.; Baker, T.; Chin, A.; Ellis, T.D.; Walsh, C.J. Soft robotic apparel to avert freezing of gait in Parkinson’s disease. Nat. Med. 2024, 30, 177–185. [Google Scholar] [CrossRef] [PubMed]
- Klaver, E.; van Vugt, J.; Bloem, B.; van Wezel, R.; Nonnekes, J.; Tjepkema-Cloostermans, M. Good vibrations: Tactile cueing for freezing of gait in Parkinson’s disease. J. Neurol. 2023, 270, 3424–3432. [Google Scholar] [CrossRef] [PubMed]
- Ashfaque Mostafa, T.; Soltaninejad, S.; McIsaac, T.L.; Cheng, I. A Comparative Study of Time Frequency Representation Techniques for Freeze of Gait Detection and Prediction. Sensors 2021, 21, 6446. [Google Scholar] [CrossRef] [PubMed]
- Singaravelu, M.; Mubibya, G.S.; Almhana, J. Improving Freezing of Gait Detection and Prediction Using ML and Transformers. In Proceedings of the ICC 2023—IEEE International Conference on Communications, Rome, Italy, 28 May–1 June 2023; pp. 2804–2809. [Google Scholar] [CrossRef]
- Kursa, M.B.; Rudnicki, W.R. Feature selection with the Boruta package. J. Stat. Softw. 2010, 36, 1–13. [Google Scholar] [CrossRef]
- Yang, F.; Liu, S.; Dobriban, E.; Woodruff, D.P. How to reduce dimension with PCA and random projections? IEEE Trans. Inf. Theory 2021, 67, 8154–8189. [Google Scholar] [CrossRef] [PubMed]
- Peng, H.; Long, F.; Ding, C. Feature selection based on mutual information criteria of max-dependency, max-relevance, and min-redundancy. IEEE Trans. Pattern Anal. Mach. Intell. 2005, 27, 1226–1238. [Google Scholar] [CrossRef] [PubMed]
- Nelles, O. Nonlinear System Identification. Meas. Sci. Technol. 2002, 13, 646. [Google Scholar] [CrossRef]
- Kenny, L.; Moore, K.; O’Riordan, C.; Fox, S.; Barton, J.; Tedesco, S.; Sica, M.; Crowe, C.; Alamäki, A.; Condell, J.; et al. The views and needs of people with Parkinson disease regarding wearable devices for disease monitoring: Mixed methods exploration. JMIR Form. Res. 2022, 6, e27418. [Google Scholar] [CrossRef]

| Stem | Leaves | Stem | Leaves | Stem | Leaves |
|---|---|---|---|---|---|
| 6 | 3 | 6 | 6 | ||
| 7 | 157 | 7 | 234555567889 | 7 | 5679 |
| 8 | 01223555566678999999 | 8 | 12222344444666667779 | 8 | 02223345667777888889999 |
| 9 | 000011122233455666777888899 | 9 | 111123335445556889 | 9 | 000111123333444555777777888899 |
| (a) | (b) | (c) | |||
Disclaimer/Publisher’s Note: The statements, opinions and data contained in all publications are solely those of the individual author(s) and contributor(s) and not of MDPI and/or the editor(s). MDPI and/or the editor(s) disclaim responsibility for any injury to people or property resulting from any ideas, methods, instructions or products referred to in the content. |
© 2024 by the authors. Licensee MDPI, Basel, Switzerland. This article is an open access article distributed under the terms and conditions of the Creative Commons Attribution (CC BY) license (https://creativecommons.org/licenses/by/4.0/).
Share and Cite
Elbatanouny, H.; Kleanthous, N.; Dahrouj, H.; Alusi, S.; Almajali, E.; Mahmoud, S.; Hussain, A. Insights into Parkinson’s Disease-Related Freezing of Gait Detection and Prediction Approaches: A Meta Analysis. Sensors 2024, 24, 3959. https://doi.org/10.3390/s24123959
Elbatanouny H, Kleanthous N, Dahrouj H, Alusi S, Almajali E, Mahmoud S, Hussain A. Insights into Parkinson’s Disease-Related Freezing of Gait Detection and Prediction Approaches: A Meta Analysis. Sensors. 2024; 24(12):3959. https://doi.org/10.3390/s24123959
Chicago/Turabian StyleElbatanouny, Hagar, Natasa Kleanthous, Hayssam Dahrouj, Sundus Alusi, Eqab Almajali, Soliman Mahmoud, and Abir Hussain. 2024. "Insights into Parkinson’s Disease-Related Freezing of Gait Detection and Prediction Approaches: A Meta Analysis" Sensors 24, no. 12: 3959. https://doi.org/10.3390/s24123959
APA StyleElbatanouny, H., Kleanthous, N., Dahrouj, H., Alusi, S., Almajali, E., Mahmoud, S., & Hussain, A. (2024). Insights into Parkinson’s Disease-Related Freezing of Gait Detection and Prediction Approaches: A Meta Analysis. Sensors, 24(12), 3959. https://doi.org/10.3390/s24123959