Abstract
The development of non-contact techniques for monitoring human vital signs has significant potential to improve patient care in diverse settings. By facilitating easier and more convenient monitoring, these techniques can prevent serious health issues and improve patient outcomes, especially for those unable or unwilling to travel to traditional healthcare environments. This systematic review examines recent advancements in non-contact vital sign monitoring techniques, evaluating publicly available datasets and signal preprocessing methods. Additionally, we identified potential future research directions in this rapidly evolving field.
1. Introduction
In the past 15 years, advancements in camera technology have coincided with increased availability and affordability, leading to an increasing interest in using these technologies in healthcare settings. Image-based monitoring methods can simultaneously measure multiple vital signs using a non-contact sensor. Imaging photoplethysmography (iPPG) is an optical technique that uses a simple camera to assess several vital functions, such as heart rate and respiratory rate. Researchers have made significant efforts to reliably estimate heart and respiratory rates. Currently, research is focusing on the remote estimation of pulse, respiratory rate, oxygen saturation and blood pressure (BP). While there is an increasing number of articles and research on pulse and respiratory rate monitoring, there is also a limited number of publicly available publications on advancements related to BP estimation. The most monitored vital signs using non-invasive methods are heart rate, temperature, respiratory rate and oxygen saturation. Not so common and under development is blood pressure.
There is an estimated dependency of the pulse amplitude of the heart cycle. A suggestion is that depending on the blood pressure, there is a different length in systolic upstroke and diastolic time and also pulse amplitude width. In theory, it should be possible to estimate blood pressure from these key timings and amplitudes by adding blood pressure to remote the vital sign monitoring domain. While pulse and respiratory rate are primary health measurement data providers, blood pressure is a deep and more informative health status. High blood pressure needs to be detected in the early stages as it shows no symptoms until heart disease or failure occurs or even lethal outcomes. Annually, high blood pressure causes approximately 12.8% of deaths worldwide and 3.7% of disabilities that are considered permanent [1]. A multitude of studies have provided confirmation that this specific factor constitutes a substantial risk for the onset of numerous cardiovascular ailments, including but not limited to coronary heart disease (CHD), ischemic heart disease, atherosclerosis, myocardial infarction (MI) and hemorrhagic stroke.
Throughout the 20th century, researchers made significant strides in improving the sphygmomanometer, such as enhancing diastolic pressure readings and increasing device durability [2]. Newer manometers successfully addressed the accuracy issues that plagued their mid-century predecessors, producing precise measurements of mean arterial pressure (MAP). However, over time, these automated oscillometric manometers also encountered issues, causing significant discomfort for children, the elderly and those with medical challenges [2]. Using infrared (IR) light, photoplethysmography (PPG) can measure changes in blood vessel volume and provide valuable information about cardiovascular health. It can even accurately estimate blood pressure changes. Typically, PPG devices have a light source and sensor and measure reflected light in response to changes in blood volume [3]. Depending on the region of application, IR or light-emitting diode (LED) light sources are usually used.
Multiple past reviews have concluded that various methods of measuring blood pressure (BP) often require invasive devices or cumbersome equipment, which can be inconvenient to carry around. A lack of annotated training data was identified as a key application issue of machine learning-based methods. To address this issue, researchers have explored the idea of measuring BP in a non-contact way. One promising solution is remote photoplethysmography (rPPG), which utilizes color digital camera to capture subtle changes in light reflected from human skin. This paper seeks to review the latest deep learning applications in the non-contact monitoring of vital signs that are applicable in a the context of a home environment and can be used with a conventional device, such as, color cameras. This article is organized as follows. Section 2 presents the materials and methodology used for the scientific article search and selection. Selected articles are briefly reviewed in Section 3. Contextual analysis is performed in Section 4 and the article is concluded with a discussion of the findings in Section 5.
2. Materials and Methods
This study was conducted using Preferred Reporting Items for Systematic Reviews and Meta-Analyses (PRISMA) guidelines. The following section provides a detailed explanation of this article’s search procedure.
2.1. Eligibility Criteria
Articles were selected based on the qualifying requirements listed in Table 1. Key factors included quality, accessibility, comparability and methodological clarity. Metrics such as the publishing language, paper type, complete paper availability, medical domain, goal, use of data modalities, deep learning use and performance assessment were included in the criteria. Articles were filtered using exclusion criteria based on the title, abstract and keywords, followed by being thoroughly reviewed to assess their suitability.

Table 1.
Article eligibility criteria.
2.2. Article Search Process
Primary and secondary search tactics were employed using electronic databases such as Scopus and Web of Science. The primary search was conducted on the 25th of March 2024 and considered articles published had to have been published since 2019. The most significant abbreviations (such as RPPG, PPG, HR) were incorporated in Boolean logic queries that were defined by concatenating words using the OR gate and combining term categories using the AND gate. Several phrases (such as Econ, EART and so on) were used in order to include or exclude research papers and area symbols and guide the search results. The search query was limited to the abstract and title.
The whole search code used was the following:
((“blood pressure”) AND (“remote”) AND (“vital”) AND (“heart rate”) AND (“video”) AND (“photoplethysmography”) AND (rppg)) AND PUBYEAR > 2016 AND PUBYEAR < 2024 AND (EXCLUDE (SUBJAREA, “VETE”) OR EXCLUDE (SUBJAREA, “ARTS”) OR EXCLUDE (SUBJAREA, “AGRI”) OR EXCLUDE (SUBJAREA, “BUSI”) OR EXCLUDE (SUBJAREA, “CENG”) OR EXCLUDE (SUBJAREA, “CHEM”) OR EXCLUDE (SUBJAREA, “IMMU”) OR EXCLUDE (SUBJAREA, “ECON”) OR EXCLUDE (SUBJAREA, “PHAR”) OR EXCLUDE (SUBJAREA, “EART”) OR EXCLUDE (SUBJAREA, “PSYC”) OR EXCLUDE (SUBJAREA, “DECI”)) AND (LIMIT-TO (LANGUAGE, “English”)) AND (LIMIT-TO (DOCTYPE, “ar”) OR LIMIT-TO (DOCTYPE, “cp”) OR LIMIT-TO (DOCTYPE, “ch”)).
Excluded areas included the fields of Veterinary Medicine, Arts, Agriculture, Business, Economics, Pharmacology and Psychology. We looked at the final stage of each selected paper. Some papers were wrongly named, where instead of the article there was some commercial like for FLIR cameras or a World Health Organization overview. References discovered in articles from the initial search were examined again and manually included during the secondary search, contingent upon their relevance as determined by the eligibility criteria.
2.3. Selection Process
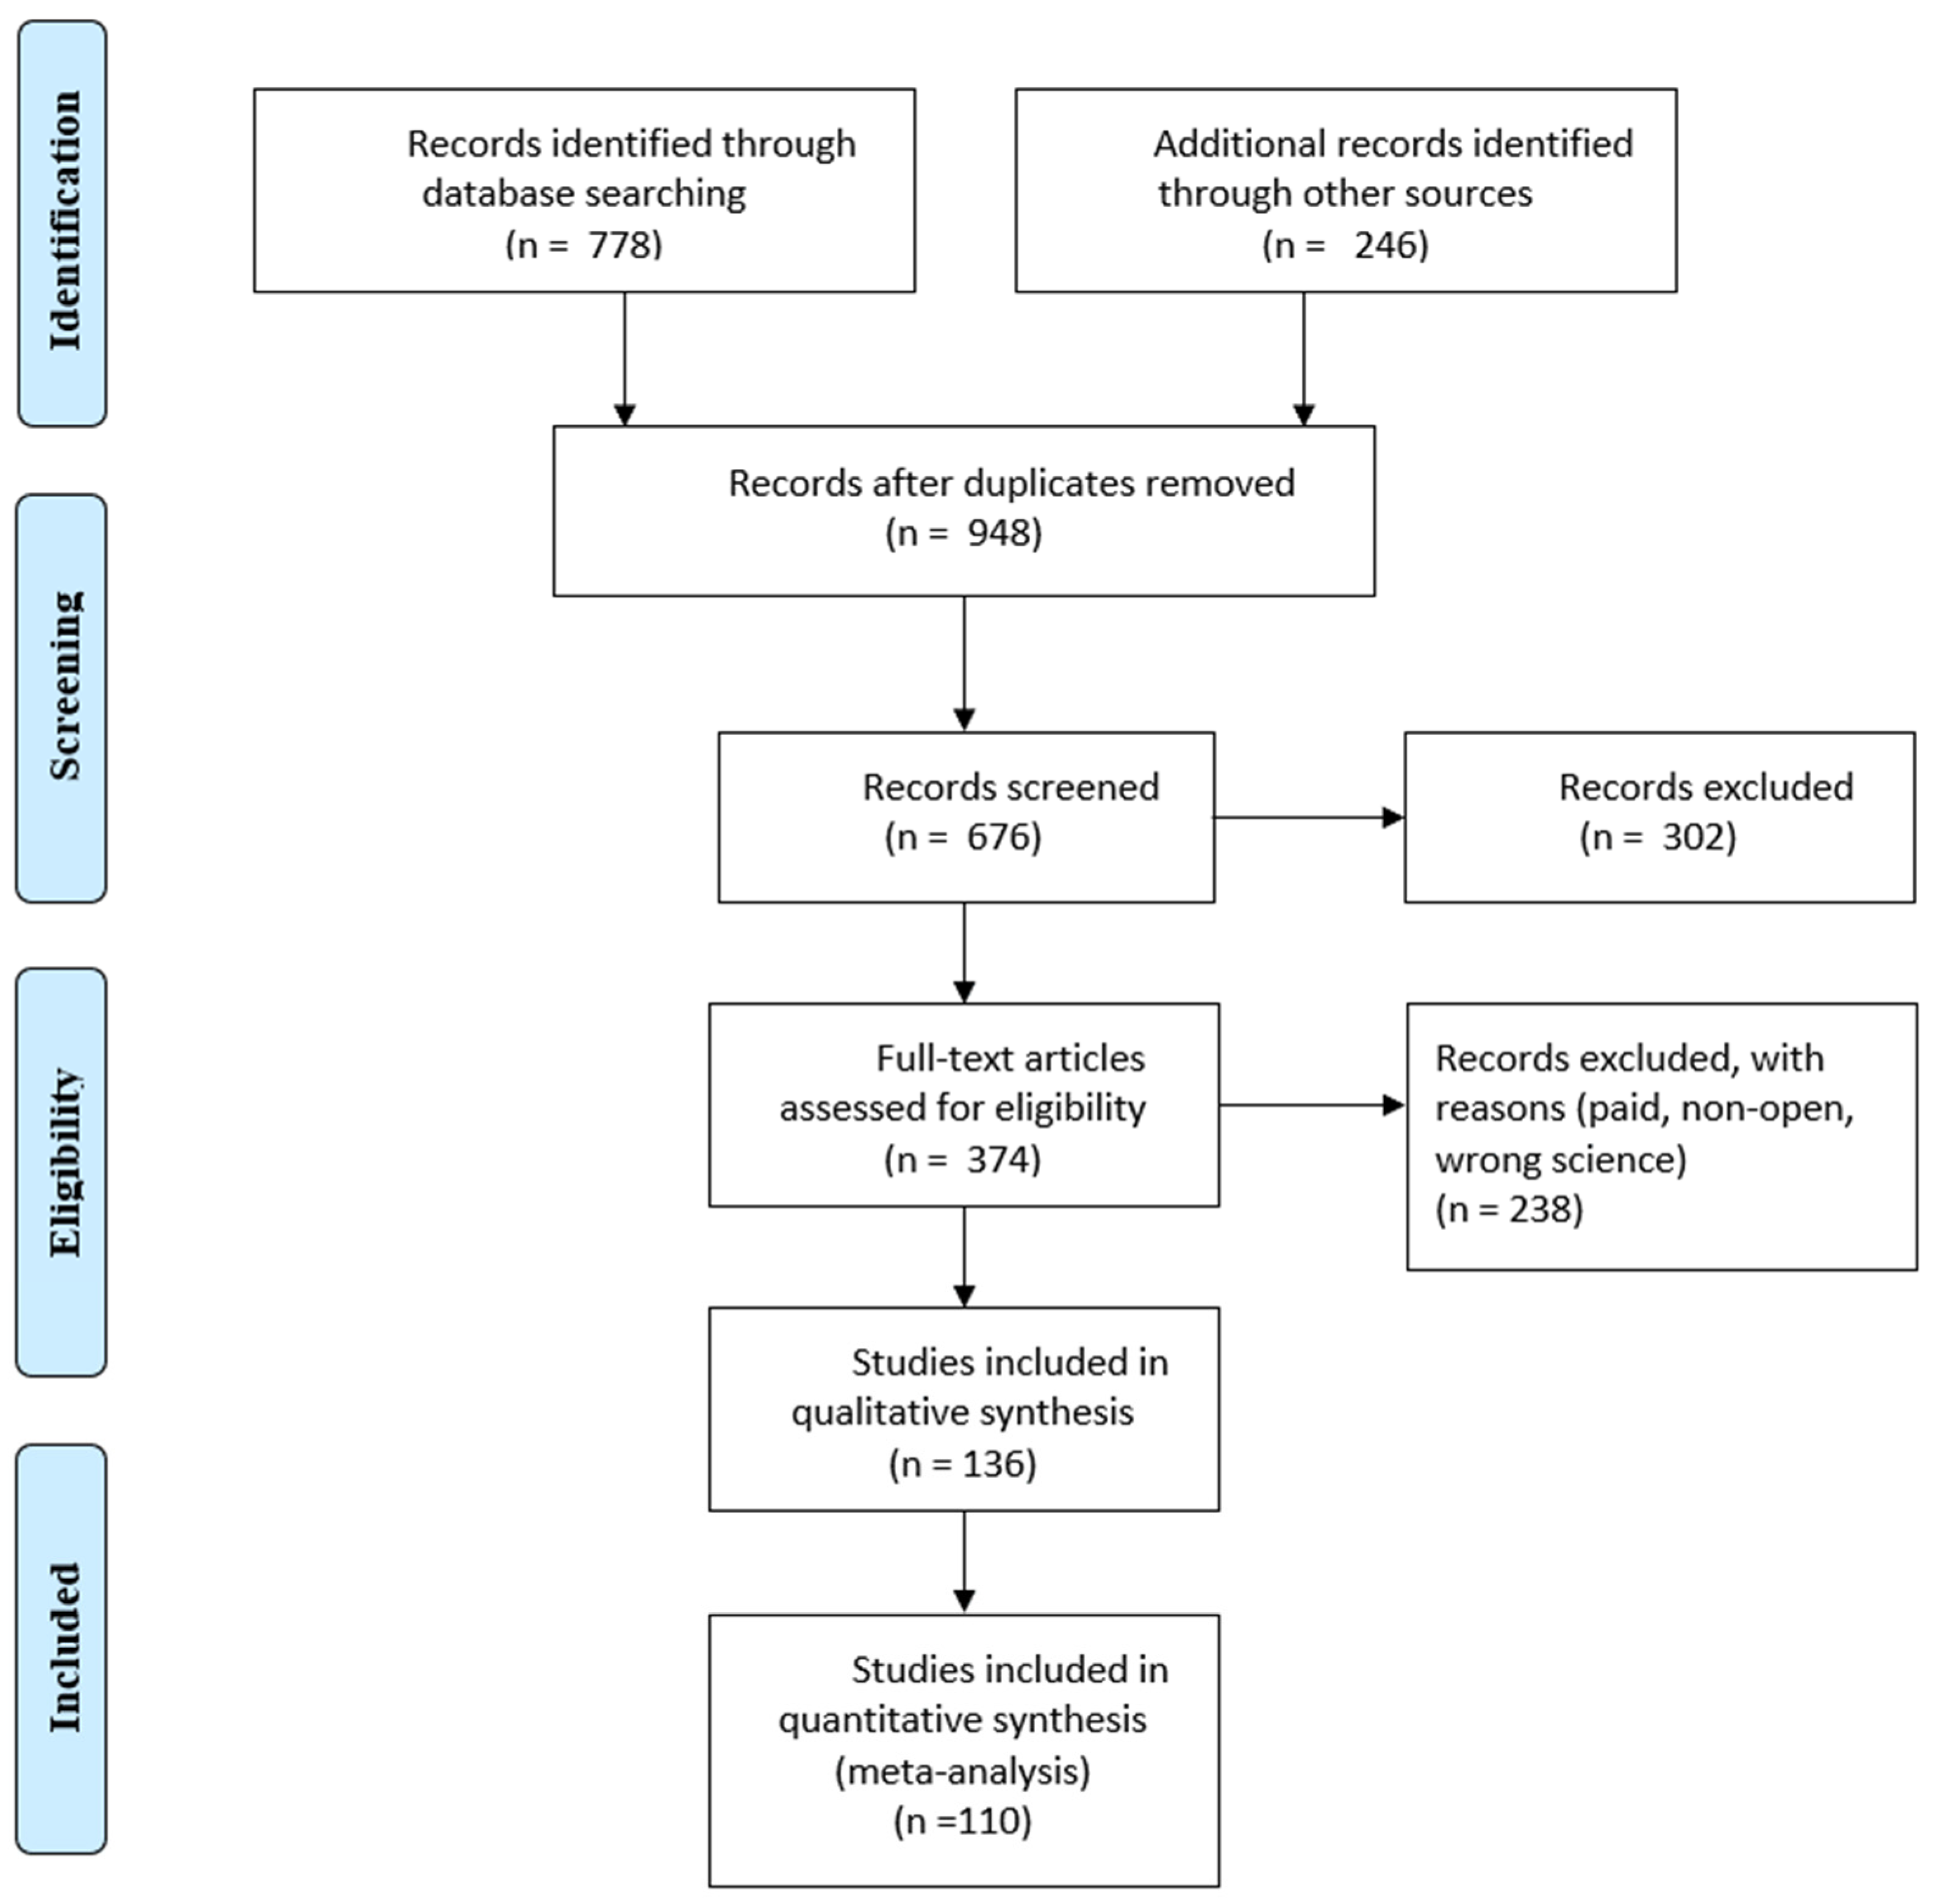
Selection was made from the Scopus and IEEE databases, the main articles were taken from Scopus, although many were found in the IEEE. The title, authors, publication date, paper type, article venue, complete abstract and keywords were among the search data. Duplicate articles were removed using the Microsoft® 365 Excel tool and checking for repetitive titles. Excluded articles also included those that were not in journals or in the English language. The remaining publications’ titles, abstracts and keywords were filtered using the standards listed in Table 1. After reading every article, those that did not fit the requirements were eliminated. A PRISMA flow diagram is presented in Figure 1.
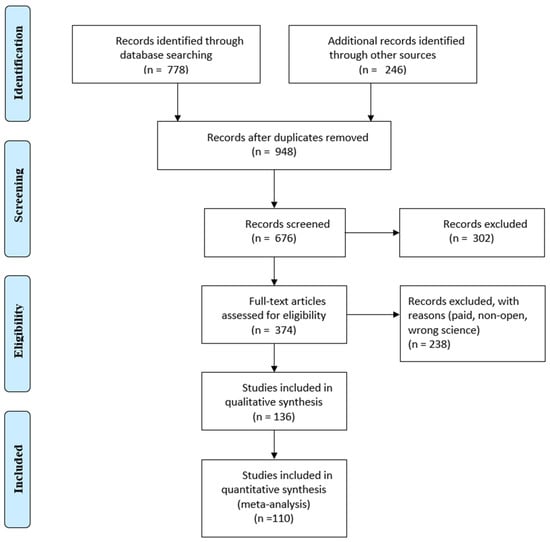
Figure 1.
PRISMA flow diagram.
2.4. Selection Summary
The type of data was determined by the review’s objectives. Some article metadata could be found in online databases, but the following information was extracted during a full article read in order to quantitatively evaluate the articles: objectives, subject and classes, methodology, initial sample count, training sample count, preprocessing and machine learning methods. Regretfully, several publications failed to provide the necessary information. Consequently, assumptions regarding the absent data were made as the following:
- Number of training samples—If this number was not provided, the initial sample count was taken into account when evaluating the dataset location;
- Application of preprocessing techniques—It is deemed that none were applied.
3. Results
When searching the Scopus and Web of Science databases 1024 articles were found. After duplicate articles were removed, 948 original articles remained. Titles, abstracts and keywords were compared to the qualifying criteria in this group (Figure 1). The entire texts of the remaining 948 articles were assessed using the same set of criteria. In the end, 110 articles were chosen, and 26 more were added as a consequence of forward snowballing and reference reviews in related review articles. This section displays the analytical results for the articles listed below. The results of the searches are represented in Figure 2, which shows the distribution of articles by date. It is clear that interest in this area of study has been growing for the previous five years.
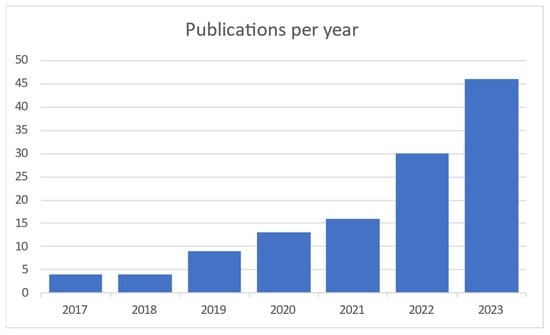
Figure 2.
Publications per year [4,5,6,7,8,9,10,11,12,13,14,15,16,17,18,19,20,21,22,23,24,25,26,27,28,29,30,31,32,33,34,35,36,37,38,39,40,41,42,43,44,45,46,47,48,49,50,51,52,53,54,55,56,57,58,59,60,61,62,63,64,65,66,67,68,69,70,71,72,73,74,75,76,77,78,79,80,81,82,83,84,85,86,87,88,89,90,91,92,93,94,95,96,97,98,99,100,101,102,103,104,105,106,107,108,109,110,111,112,113,114,115,116,117,118,119,120,121,122].
It is obvious and mentioned in most of the articles that this field of interest became needed more and more with the COVID-19 pandemic to monitor vital signs without primary contact with the patient. Today, as modern society gets older, it is needed to monitor elderly people from their homes. Contact measurements mostly have some discomfort or body intrusion elements, while contactless ones can even be unnoticed. Most publications on the subject are coming from China and the United States, as shown in Figure 3.
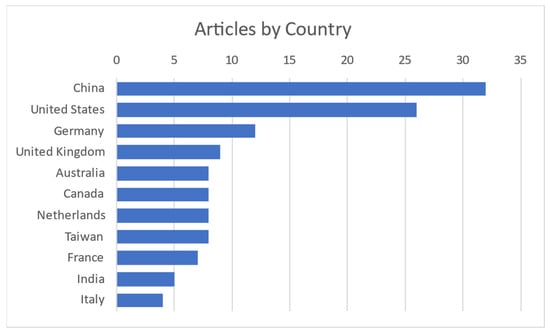
Figure 3.
Publications per country [4,5,6,7,8,9,10,11,12,13,14,15,16,17,18,19,20,21,22,23,24,25,26,27,28,29,30,31,32,33,34,35,36,37,38,39,40,41,42,43,44,45,46,47,48,49,50,51,52,53,54,55,56,57,58,59,60,61,62,63,64,65,66,67,68,69,70,71,72,73,74,75,76,77,78,79,80,81,82,83,84,85,86,87,88,89,90,91,92,93,94,95,96,97,98,99,100,101,102,103,104,105,106,107,108,109,110,111,112,113,114,115,116,117,118,119,120,121,122].
Studies are made mostly in Computer Science and Engineering, as remote vital sign monitoring includes visual data interpretation in mathematical ways to obtain and check differences between arrays of pixels and colors in taken pictures or video streams. All this data must be mathematically, or with the help of AI, summarized and presented to the user in a simple number or trend format. Also, data must be accurate because they are related to human health. To make data more accurate data from medicine were used. One of the datasets entailed premade video streams taken during different human stress and calm states with information on the heartbeat taken by a professional, medical-grade HR monitoring device. The Physics and Astronomy subject area is shown as separate, but uses the same methods as Engineering and Computer science—data gathering, signal processing as RGB or motion analysis processed with different mathematical algorithms. The detailed articles spread by their area are represented in Figure 4.
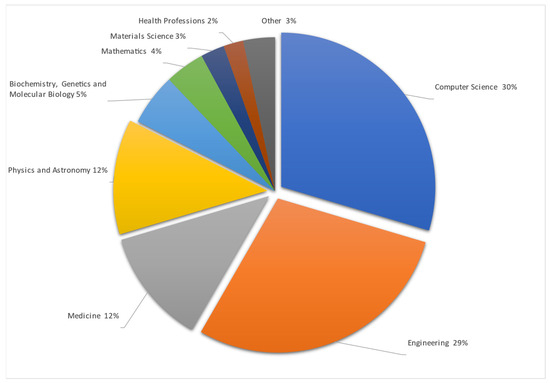
Figure 4.
Publications by subject area [4,5,6,7,8,9,10,11,12,13,14,15,16,17,18,19,20,21,22,23,24,25,26,27,28,29,30,31,32,33,34,35,36,37,38,39,40,41,42,43,44,45,46,47,48,49,50,51,52,53,54,55,56,57,58,59,60,61,62,63,64,65,66,67,68,69,70,71,72,73,74,75,76,77,78,79,80,81,82,83,84,85,86,87,88,89,90,91,92,93,94,95,96,97,98,99,100,101,102,103,104,105,106,107,108,109,110,111,112,113,114,115,116,117,118,119,120,121,122].
From representation of results in Figure 2, Figure 3 and Figure 4 there were excluded other systematic reviews like [123,124,125,126,127].
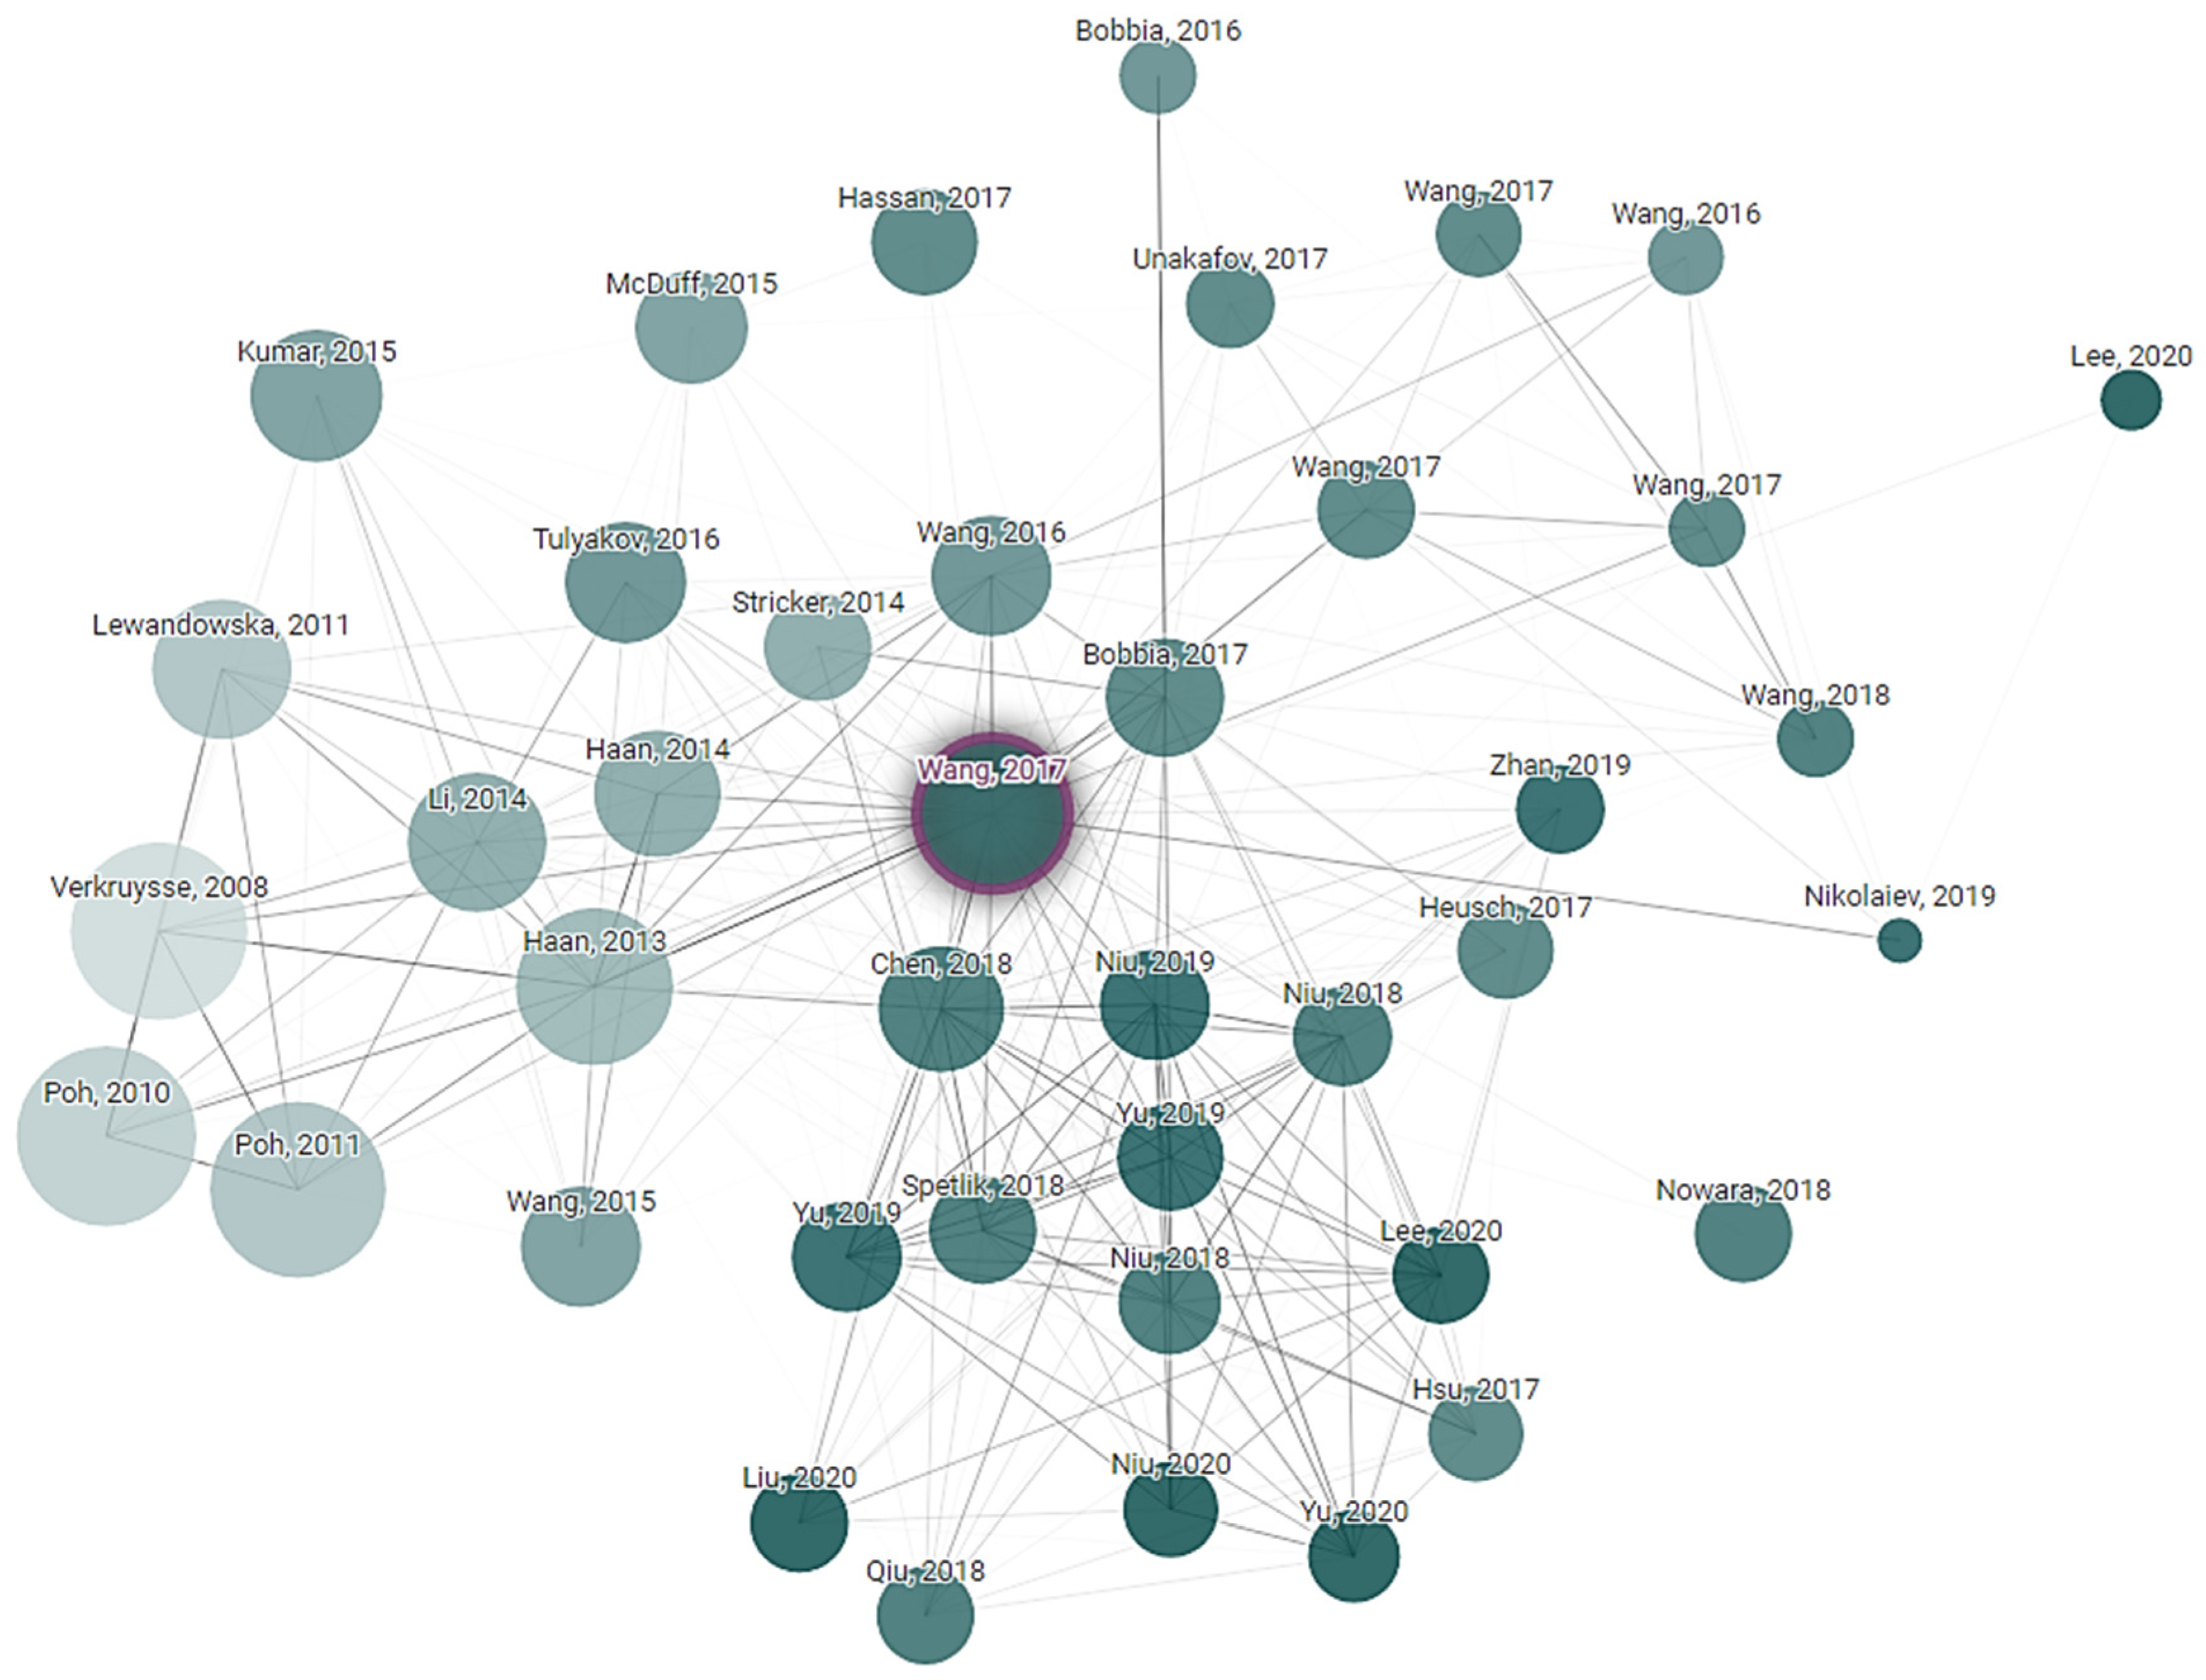
Connected Papers exploration is a technique used to discover and navigate the academic literature in the field of non-contact vital sign monitoring. Paper exploration started from key research articles in the research field. The citation tracking tool was used to find other related research papers to the initial one. Finally, a connection network of research was created that explored the development and advancement in non-contact vital sign monitoring technologies. This exploration is helping to understand the current state of the field, identify emerging trends and see how different research groups are contributing to the technology. Connected Papers exploration is based on a starting article written by Wenjin Wang, “Algorithmic Principles of Remote PPG”, whose principles were cited 677 times in the following years after publication. It is obvious that subequal articles one way or another use a primary one as the start state and add their own approaches and variations. How articles reference each other, or their relations, are shown in Figure 5.
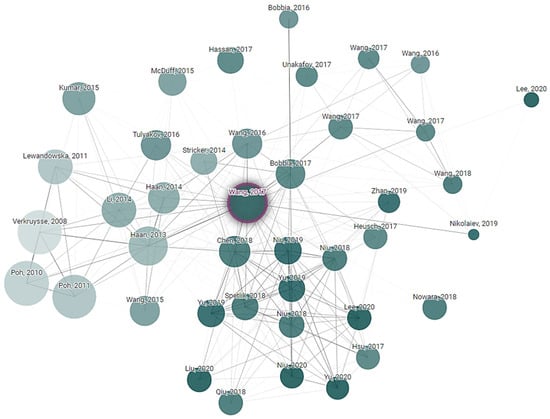
Figure 5.
Article dependency network of research that explored the development and advancements in non-contact vital sign monitoring technologies.
To categorize and organize the information from articles, a Systematic Literature Review (SLR) coding scheme was used. It is applied to the detailed sorting and labeling of a large amount of information from academic papers. Firstly, categories and groups of information like the vital signs, technology and devices used, patient experience during examination and feasibility of the method were decided upon. Then, articles were sorted according to these groups and categories. Once articles were sorted, information in it like a paragraph, meaning and method was labeled as belonging to the appropriate category. Doing this helped to sort and analyze the data further on. Statistical analysis was also conducted. For this categorization and labeling, the MaxQDA tool was used. Important in creating a coding scheme was separating non-contact methods and looking for ways and methodologies to have non-contact or remote vital sign monitoring, including by considering the following factors: what studies were made; how simple the method was; what their feasibility was; how practical the method was when applied; what technologies were used in the study; what devices were used; what vital signs were measured; and how common the method was compared to other studies.
3.1. Performance Metrics
For the purpose of evaluating the model and comparing it to the articles of other authors, several common performance indicators were employed. This section provides the specifics of the most commonly used metrics and their derived methods. Only the metrics that were listed in tables including evaluated papers and that were utilized by more than five (inclusive) articles will be detailed. The effectiveness of the proposed approach was assessed using a number of quality criteria, such as the mean error (ME), standard deviation (STD), mean absolute error (MAE), root mean square error (RMSE) and mean absolute percentage error (MAPE). The metrics shown in Table 2 represent the error between the estimated (es) XR and the ground truth (lb) values, where X ∈ [H (heart), R (respiratory)].
Table 2.
Model performance metrics.
Performance metrics were analyzed in all articles, and it was found that 90% of articles could be compared by using the MAE, while less than 70% of articles, with RMSE. The unit of beats per minute or bmp is often used to represent the physical difference between estimated and ground truth heart rates (HRs). The breaths per minute or bmp is often used to represent the physical difference between estimated and ground truth respiratory rates (RRs). The mean absolute percentage error is represented with units of percentage (%). The units of millimeters of mercury or mmHg is used to measure differences in other vital signs such as the systolic blood pressure (SBP) and diastolic blood pressure (DBP). Blood oxygen saturation level is measured in percentage (%) units. The following Table 3 provides summaries of reviewed articles filtered by the subject “heart rate”.
Table 3.
Summary of papers in non-contact vital sign monitoring analyzing heart rate.
As seen from Table 3, using the rPPG, it was possible to obtain data accuracy close to 5 bpm from certified or tested contact-based photoplethysmography using common datasets. By using custom or their own datasets, article authors claimed to obtain an accuracy of 1–2 bpm, which is truly remarkable, but based on the dataset size, it is obvious that the authors used a personalized dataset and personalized results. In common datasets with higher variability, results were less accurate for the whole array of tests.
For blood pressure estimation from rPPG, custom datasets were mostly used. Table 4 displays the filtered results. In summary, the outcomes of tests in this area were unknown or hidden. Of the published results, the highest accuracy was 75–80%. This is unusable in medical testing. By medical device usage certification, there were three levels:
- adequate for a “high-accuracy” device (defined as resulting in a mean BP difference between the reference and test device measurement and its associated standard deviation of 0 ± 3–6 [mean ± SD] mmHg), as it would have <14% chance to fail;
- inadequate for a “moderate accuracy” device (difference of 4 ± 5 mmHg), as it would have 28% of a chance to fail, which is unacceptably high;
- adequate for a “low accuracy” device (difference of 6–8 ± 5 mmHg, or 0 ± 10–12 mmHg, or 4–6 ± 8 mmHg), as it would have 94% chance to fail.
Table 4.
Summary of papers in non-contact vital sign monitoring analyzing blood pressure.
Table 4.
Summary of papers in non-contact vital sign monitoring analyzing blood pressure.
| Reference | Methodology | Data Set | Results |
|---|---|---|---|
| Das B. et al., 2022 [1] | remote photoplethysmography (rPPG) | MIMIC III 53,423 of subjects | - |
| Steinman et al., 2021 [2] | remote photoplethysmography using smartphone and cameras | - | - |
| Gao et al., 2023 [43] | remote photoplethysmography (rPPG) long short-term memory network (LSTM) | IIP-HCI dataset UBFC-Phys dataset LGI-PPGI dataset Custom dataset | - |
| Van Putten et al., 2023 [44] | remote photoplethysmography (rPPG) 100 discriminating feauters | Custom dataset (4500 measurement) | Acc = 79% of all individuals with hypertension |
| Wu et al., 2023 [45] | remote photoplethysmography (rPPG) Windkessel model and hand-crafted waveform characteristics | Chiao Tung BP (CTBP) dataset | MAESBP = 6.48 mmHg MAEDBP = 5.06 mmHg |
| Bousefsaf et al., 2022 [46] | imaging photoplethysmographic (iPPG) deep U-shaped neural network | BP4D+ (140 participants) Custom dataset 57 participants based-on AMM and BHS | MAEDBP = 5.1 mmHg; MAESBP = 6.73 mmHg |
| Wiffen et al., 2023 [28] | developing a measurement protocol | Custom dataset with patients data 1950 participants | - |
| Qiao et al., 2022 [32] | web-camera based solution | PURE dataset | MAEHR = 1.73 bpm MAEHRV = 18.55 ms MAESpO2 = 1.64% |
| Wuerich et al., 2022 [47] | remote photoplethysmography (rPPG) | Custom dataset | MAESBP = 5.5 ± 4.52 mmHg MAEDBP = 3.7 ± 2.86 mmHg |
| Schrumpf et al., 2021 [48] | remote photoplethysmography (rPPG) deep learning techniques | MIMIC-III (12000 records of PPG) | MAEAlexNet = 15.7 SBP mmHg MAEREsNet = 13.02 SBP mmHg |
| Shirbani et al., 2021 [49] | video-based photoplethysmography (vPPG) | Custom dataset (10 subjects video records of face and palm) | PTT-BP Correlation coefficient = 0.8 |
| Tran et al., 2020 [42] | Custom datset | RMSESBP = 7.942 RMSEDBP = 7.912 | |
| Fan et al., 2020 [50] | remote photoplethysmography (rPPG) Gaussian model | Custom dataset | rSBP = −0.84 rDBP = −0.66 |
From the results of reviewed articles, the closest results on customer datasets had a moderate accuracy, which could be used in preliminary BP testing but not final health estimation.
For remote blood pressure monitoring, there were the lowest-accuracy results; on the other hand, for SpO2 monitoring, there were quite high-accuracy results. In Table 5, the represented results of SpO2 estimation from various articles are shown. It can clearly be seen that oxygen saturation could be measured with a 1.64% error or higher than 95% accuracy level using standard datasets like PURE or large customer datasets, as in Wiffen et al.’s article [28].
Table 5.
Summary of papers on non-contact vital sign monitoring analyzing SpO2.
The majority (around 80%) of research articles focused on remote heart rate estimation and a bit less on remote respiratory rate estimation. Less than 20% of research focused on remote blood pressure monitoring. Remote photoplethysmography (rPPG) technology served as the basis for remote monitoring of vital signs. Measuring technologies such as video-based photoplethysmography (vPPG), video plethysmography (VPG) and imaging photoplethysmography (iPPG) refer to the same remote monitoring technique. Respiratory rate, heart rate, heart rate variability and oxygen saturation were estimated by measuring the skin surface of the subject’s face. The pulsatile pressure wave was measured in the areas of the neck artery or the palmar artery. Blood pressure, both systolic and diastolic, was estimated by focusing image sensors into two body areas that were at a certain distance from each other, such as, the forehead and palm. Estimated values of vital signs were compared with values that were acquired using contact diagnostic devices, such as, electrocardiographs, finger blood pressure monitors, etc. Current solutions, which rely on remote PPG analysis, were adapted to specific scenarios by utilizing limited public and/or custom datasets. There is a lack of research on the deep learning-based vital signs used to estimate a model’s resilience and capacity for generalization.
3.2. Datasets
Although deep learning models reduce the need for manual feature engineering, they increase the number of model parameters. These kinds of models require large datasets for training, and while public, general-purpose datasets have accumulated sufficient samples, the availability of publicly available medical data restricts the applications of deep learning. Inference time constraints and the hardware a model will run on also limit a model’s development. Ethical considerations restrict the acquisition of medical pictures, and the absence of retrospective patient approval constricts the use of already-existing imagery. In this setting, scientists are encouraged to work together with healthcare facilities and other researchers to obtain new annotated samples or to repurpose reliable, openly accessible data. This section aims to account for major publicly available data by listing datasets reported in the reviewed research.
Table 6 lists all datasets that were made publicly available. We identified some limitations and shortcomings of the aforementioned rPPG datasets, and some of them appeared as follows. The majority of publicly available datasets provided labels for heart rate and respiratory rate only. The MTHS dataset contained an acceptably sufficient number of samples (enough to train a neural network-based classifier) but provided labels for HR and SpO2 only. More significantly, the availability of only a few publicly accessible video-PPG datasets would limit the ability to evaluate the generalization capacity, accuracy and resilience of any deep learning system for vitals estimation. This is why a new and sizable dataset on video-PPG is required. The majority of available datasets used a straightforward video-collecting technique. For example, samples within a single set were gathered under constant conditions, and incorporating videos from other datasets might have helped improve dataset variety. Diverse patient ethnicities, lighting settings and recording equipment contribute to a variety that is advantageous for a classification model intended for usage by non-professionals with commercially accessible smartphones at home.
Table 6.
Available datasets for rPPG research.
3.3. Architectures of Regression Models
Vital sign estimation based on deep neural networks is a commonly used backbone term to describe the regression part of state-of-the-art articles. Vital sign monitoring plays a crucial role in healthcare, and AI-based regression models in this field are more accurate and efficient. These models estimate vital signs (heart rate, blood oxygen saturation, etc.) by analyzing various signals like remote photoplethysmography (rPPG). The most common and prominent approach utilizes deep learning architectures, particularly convolutional neural networks (CNNs). These models process an input signal through a series of convolutional layers, extracting features that correlate with vital signs. Techniques like residual connections and a discrete cosine transform (DCT) and other transformations are incorporated to enhance feature extraction. Deep neural networks (DNNs), particularly convolutional neural networks (CNNs), dominate the field. A major challenge is the limited size of datasets in vital sign estimation research. Training DNNs effectively often requires vast amounts of data. A survey of articles indicates that the size of the datasets, which are small, limits researchers to mostly relying on pretrained, known feature extraction and regression architectures. To address this issue, researchers leverage pretrained models, typically trained on large, generic datasets for image recognition or other tasks. These pretrained models act as powerful feature extractors, capturing essential patterns within the data. Subsequently, these features are finetuned for the specific task of vital sign estimation.
While pretrained models offer a solid foundation, some researchers opt for custom convolutional neural networks (CNNs) in combination with data transformations. This approach allows for greater control over feature extraction specific to the vital signs of interest. Data transformations, like discrete cosine transform (DCT), can further enhance a model’s ability to identify relevant patterns in its input signals. The custom CNN approach is particularly appealing when there is a need for increased efficiency. By carefully designing network architectures and potentially reducing the number of parameters, researchers are developing models suitable for deployment on mobile devices or resource-constrained environments.
Another area of focus is designing compact and efficient models suitable for deployment on mobile devices. This enables continuous monitoring and promotes accessibility. Researchers achieve this by reducing the number of parameters in a model or employing lightweight architectures. Researchers are actively exploring ways to improve both accuracy and efficiency using lightweight architectures, transfer learning and explainable AI., including the following factors: designing models with fewer parameters for deployment on resource-constrained devices; leveraging knowledge gained from estimating one vital sign to improve the estimation of others; and developing models that explain their reasoning behind vital sign estimations, fostering trust and improving clinical decision-making. AI-based vitals estimation models offer a promising technique. The choice of architecture depends on the desired balance between accuracy and computational efficiency. Researchers strive to develop AI-based regression models that are not only accurate but also efficient and interpretable for vital sign estimation, paving the way for wider adoption in healthcare settings.
4. Future Research
If an rPPG signal were accurate and reliable to acquire through not only BPM readings but also cardiogram trends like from an ECG, this would further prove the efficacy of using this method in clinical applications. With the current discussed method, there is the possibility of measuring heart rate variability (HRV). In recent research, the conclusion was made that HRV is heavily related to autonomic nervous system functionality. HRV depression has been observed in various clinical situations, such as autonomic neuropathy, heart transplantation, congestive heart failure, myocardial infarction (MI) and other cardiac and noncardiac diseases. It is crucial to understand that the clinical significance of HRV analysis has only been clearly acknowledged in two specific clinical situations: as a means of predicting the risk of arrhythmic events or sudden cardiac death following an acute myocardial infarction, and as a clinical indicator of developing diabetic neuropathy. More recently, its significance in the assessment and treatment of heart failure has also been acknowledged. It is crucial to acknowledge the constraints of HRV in terms of its current clinical usefulness. The standardization of HRV methodology has been inadequate [136].
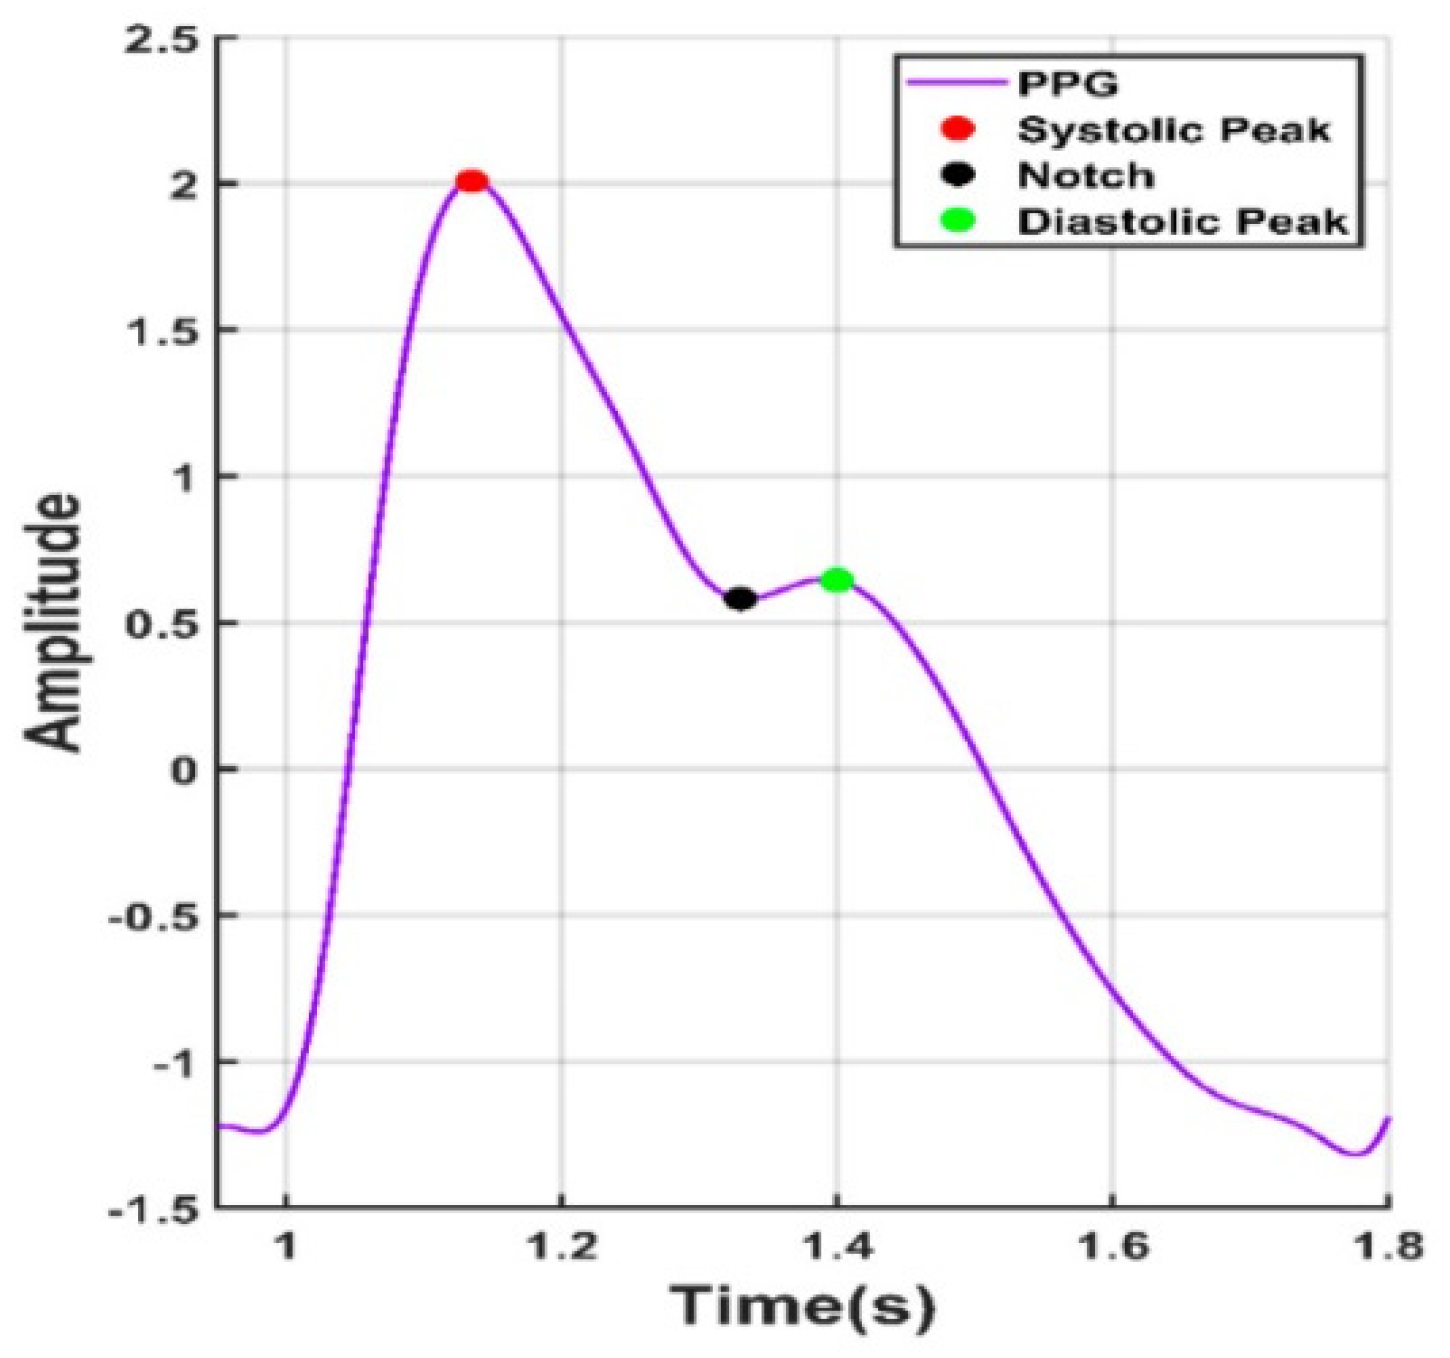
Looking forward in terms of research possibilities, by obtaining reliable rPPG readings in the form of oscillometric pressure pulse waves, this would open up even more medical information about the tested person, like their history of arrythmia or blood pressure [137]. In the overviewed PPG articles, there were attempts to obtain blood pressure by measuring the time between the heart cycle start, pulse peak and heart cycle end, like in Figure 6.

Figure 6.
Points of interest from a PPG signal.
In such a way, using mathematical calculations, it is possible to obtain a somewhat estimated blood pressure. By integrating deep learning techniques, it is possible to improve the accuracy of readings. However, as of the publication of this article, the results obtained are still below the acceptable medical threshold when considering the universally accepted criteria for validating blood pressure measuring devices [138].
5. Conclusions and Discussion
For most remote vital sign monitoring articles, video and RGB image processing using cameras were mentioned, where each color range extracts a specific part of an image difference based on blood vessels’ proximity to outer skin. From exploring the color of outer skin, it was noticed that the closer the blood vessel is to it, the more bluish the color of the outer skin becomes. By employing image recognition and mathematical calculation as well as AI algorithms, it is possible to compare video frames and from them, by processing differences in color, it is possible to determine pulse. As blood pressure changes, so does vessel diameter change and so does its closeness to outer skin. Respiratory rate was measured by changes in body movements. It is the easiest vital sign to measure, as even if a human is covering their face with a mask, it is possible to check their breathing rate by mask or bodily micro-movements. Based on the examined articles, the accuracy of measurement of vital signs using remote photoplethysmography methods depends on factors including human skin color, ambient light signs taken from the face and the direction of the human gaze. By combining camera image processing using algorithms with additional convolutional neural network (CNN) processing, the reliability of data is increased dramatically. Additional light can be introduced, if possible, to increase accuracy.
There was a lack of deeper research on blood pressure (BP) and the methods and possibilities around its use. Most of the articles that did mention it only did so in the results of their investigation, and not in the methods themselves. There is a need for open-source databases and code availability to be approachable by more scientific studies and universities; that way, there will be an increased amount of research and articles with more reliable methods. Further investigation is required regarding remote blood pressure measurements, specifically to address concerns regarding accuracy, validation in various environments, long-term reliability, repeatability, and user behavior comprehension. The accuracy of remote methods such as video-based photoplethysmography has to be compared with traditional arm cuffs, which are the gold standard for blood pressure measurement. While some research shows promising results, larger and more diverse populations need to be included to ensure accuracy across various demographics and health conditions. The majority of experimental investigations were executed in controlled clinical settings. However, real-world use at home or in remote areas might introduce variations due to user techniques, environmental factors or device limitations. More research is needed to see how these remote-sensing technologies perform in everyday scenarios. State-of-the-art research often focuses on short-term use. Extended monitoring over weeks or months is needed to assess if remote technologies provide consistent and reliable readings. Remote monitoring might capture average blood pressure, but it might miss important fluctuations that traditional cuffs can detect. More research is needed to understand if remote technologies can effectively capture this variability. The success of remote monitoring depends on user adoption and adherence. Research on user behavior can help identify factors that influence compliance and develop strategies to improve it.
These are just some of the areas where deeper research is needed for remote blood pressure measurements. Nowadays, every article covers its own approach to problem solving, and most of them are theoretically based on simulations like MATLAB’s Simulink or Python, and not on real-world applications. While simulations are valuable tools, the overemphasis on theoretical approaches in articles can lead to a gap between theory and practice. Simulations enable researchers to isolate and manipulate variables to understand their individual and combined effects on a system. This level of control can be difficult to achieve in real-world experiments. Simulations allow for a quick exploration of multiple design options. Researchers can test different configurations and identify the most promising ones efficiently. Many articles do not however provide enough detail on how to translate simulated solutions into real-world implementations and how their proposed method was validated in real-world settings. Real-world systems are complex and can be influenced by unforeseen factors not captured in a simulation. Simulations might miss crucial details that could impact the final outcome. Findings from simulations conducted on specific scenarios might not be generalizable to broader real-world applications.
Author Contributions
Conceptualization, L.S. and V.R.; methodology, V.R.; software, L.S.; formal analysis, G.D.; investigation, writing—original draft preparation, L.S.; writing—review and editing, V.B.; visualization, G.D.; supervision, V.R. All authors have read and agreed to the published version of the manuscript.
Funding
This research received no external funding.
Institutional Review Board Statement
Not applicable.
Informed Consent Statement
Not applicable.
Data Availability Statement
Dataset available on request from the authors.
Conflicts of Interest
The authors declare no conflicts of interest.
References
- Das, B.; Neupane, D.; Singh Gill, S.; Bir Singh, G. Factors Affecting Non-adherence to Medical Appointments among Patients with Hypertension at Public Health Facilities in Punjab, India. J. Clin. Hypertens. 2021, 23, 713–719. [Google Scholar] [CrossRef]
- Steinman, J.; Barszczyk, A.; Sun, H.S.; Lee, K.; Feng, Z.P. Smartphones and Video Cameras: Future Methods for Blood Pressure Measurement. Front. Digit. Health 2021, 3, 770096. [Google Scholar] [CrossRef]
- Wang, C.; Li, Z.; Wei, X. Monitoring Heart and Respiratory Rates at Radial Artery Based on PPG. Optik 2013, 124, 3954–3956. [Google Scholar] [CrossRef]
- Peng, J.; Su, W.; Tian, Z.; Zang, D.; Li, X.; Song, Z. MVPD: A Multimodal Video Physiology Database for RPPG. In Proceedings of the 2023 3rd IEEE International Conference on Software Engineering and Artificial Intelligence, SEAI 2023, Xiamen, China, 16–18 June 2023; pp. 173–177. [Google Scholar]
- Cheng, C.-H.; Wong, K.-L.; Chin, J.-W.; Chan, T.-T.; So, R.H.Y. Deep Learning Methods for Remote Heart Rate Measurement: A Review and Future Research Agenda. Sensors 2021, 21, 6296. [Google Scholar] [CrossRef]
- Mehmood, A.; Sarouji, A.; Rahman, M.M.U.; Al-Naffouri, T.Y. Your Smartphone Could Act as a Pulse-Oximeter and as a Single-Lead ECG. Sci. Rep. 2023, 13, 19277. [Google Scholar] [CrossRef]
- Tong, Y.; Huang, Z.; Zhang, Z.; Yin, M.; Shan, G.; Wu, J.; Qin, F. Detail-Preserving Arterial Pulse Wave Measurement Based Biorthogonal Wavelet Decomposition from Remote RGB Observations. Measurement 2023, 222, 113605. [Google Scholar] [CrossRef]
- Duan, Y.; He, C.; Zhou, M. Anti-Motion Imaging Photoplethysmography via Self-Adaptive Multi-ROI Tracking and Selection. Physiol. Meas. 2023, 44, 115003. [Google Scholar] [CrossRef]
- Lin, B.; Tao, J.; Xu, J.; He, L.; Liu, N.; Zhang, X. Estimation of Vital Signs from Facial Videos via Video Magnification and Deep Learning. iScience 2023, 26, 107845. [Google Scholar] [CrossRef]
- Karthick, R.; Dawood, M.S.; Meenalochini, P. Analysis of Vital Signs Using Remote Photoplethysmography (RPPG). J. Ambient. Intell. Humaniz. Comput. 2023, 14, 16729–16736. [Google Scholar] [CrossRef]
- Qayyum, A.; Mazher, M.; Nuhu, A.; Benzinou, A.; Malik, A.S.; Razzak, I. Assessment of Physiological States from Contactless Face Video: A Sparse Representation Approach. Computing 2023, 105, 761–781. [Google Scholar] [CrossRef]
- Molinaro, N.; Zangarelli, F.; Schena, E.; Silvestri, S.; Massaroni, C. Cardiorespiratory Parameters Monitoring Through a Single Digital Camera in Real Scenarios: ROI Tracking and Motion Influence. IEEE Sens. J. 2023, 23, 20097–20106. [Google Scholar] [CrossRef]
- Ouzar, Y.; Djeldjli, D.; Bousefsaf, F.; Maaoui, C. X-IPPGNet: A Novel One Stage Deep Learning Architecture Based on Depthwise Separable Convolutions for Video-Based Pulse Rate Estimation. Comput. Biol. Med. 2023, 154, 106592. [Google Scholar] [CrossRef]
- Li, L.; Chen, C.; Pan, L.; Zhang, L.Y.; Zhang, J.; Xiang, Y. SigA: RPPG-Based Authentication for Virtual Reality Head-Mounted Display. In Proceedings of the RAID’23: 26th International Symposium on Research in Attacks, Intrusions and Defenses, Hong Kong, China, 16–18 October 2023; pp. 686–699. [Google Scholar]
- Liu, L.; Xia, Z.; Zhang, X.; Peng, J.; Feng, X.; Zhao, G. Heart Rate Estimation by Leveraging Static and Dynamic Region Weights. J. Electron. Imaging 2023, 32, 043037. [Google Scholar] [CrossRef]
- Firmansyah, R.A.; Prabowo, Y.A.; Suheta, T.; Muharom, S. Implementation of 1D Convolutional Neural Network for Improvement Remote Photoplethysmography Measurement. Indones. J. Electr. Eng. Comput. Sci. 2023, 29, 1326–1335. [Google Scholar] [CrossRef]
- Smiley, A.; Finkelstein, J. Contactless IPPG Extraction Using Infrared Imaging. In Proceedings of the 2023 IEEE International Conference on Bioinformatics and Biomedicine (BIBM), Istanbul, Turkiye, 5–8 December 2023; pp. 4945–4947. [Google Scholar]
- Guler, S.; Golparvar, A.; Ozturk, O.; Dogan, H.; Kaya Yapici, M. Optimal Digital Filter Selection for Remote Photoplethysmography (RPPG) Signal Conditioning. Biomed. Phys. Eng. Express 2023, 9, 027001. [Google Scholar] [CrossRef]
- Ontiveros, R.C.; Elgendi, M.; Missale, G.; Menon, C. Evaluating RGB Channels in Remote Photoplethysmography: A Comparative Study with Contact-Based PPG. Front. Physiol. 2023, 14, 1296277. [Google Scholar] [CrossRef]
- Shenoy, V.R.; Marks, T.K.; Mansour, H.; Lohit, S. Unrolled IPPG: Video Heart Rate Estimation via Unrolling Proximal Gradient Descent. In Proceedings of the 2023 IEEE International Conference on Image Processing (ICIP), Kuala Lumpur, Malaysia, 8–11 October 2023; pp. 2715–2719. [Google Scholar]
- Zhalbekov, I.; Beynenson, L.; Trushkov, A.; Bulychev, I.; Yin, W. Frequency Tracker for Unsupervised Heart Rate Estimation. In Proceedings of the IEEE Computer Society Conference on Computer Vision and Pattern Recognition Workshops, Vancouver, BC, Canada, 17–24 June 2023; pp. 6024–6033. [Google Scholar]
- Xu, M.; Zeng, G.; Song, Y.; Cao, Y.; Liu, Z.; He, X. Ivrr-PPG: An Illumination Variation Robust Remote-PPG Algorithm for Monitoring Heart Rate of Drivers. IEEE Trans. Instrum. Meas. 2023, 7, 3515510. [Google Scholar] [CrossRef]
- Jian, W.; Zhang, Y.; Hu, K. Remote Heart Rate Estimation Based on ROI Extraction. In Proceedings of the 2023 16th International Congress on Image and Signal Processing, BioMedical Engineering and Informatics (CISP-BMEI), Taizhou, China, 28–30 October 2023. [Google Scholar]
- Revanur, A.; Dasari, A.; Tucker, C.S.; Jeni, L.A. Instantaneous physiological estimation using video transformers. In Multimodal AI in Healthcare: A Paradigm Shift in Health Intelligence; Springer International Publishing: Cham, Switzerland, 2023; Volume 1060. [Google Scholar]
- Hu, M.; Guo, D.; Jiang, M.; Qian, F.; Wang, X.; Ren, F. RPPG-Based Heart Rate Estimation Using Spatial-Temporal Attention Network. IEEE Trans. Cogn. Dev. Syst. 2022, 14, 1630–1641. [Google Scholar] [CrossRef]
- Jorge, J.; Villarroel, M.; Tomlinson, H.; Gibson, O.; Darbyshire, J.L.; Ede, J.; Harford, M.; Young, J.D.; Tarassenko, L.; Watkinson, P. Non-Contact Physiological Monitoring of Post-Operative Patients in the Intensive Care Unit. NPJ Digit. Med. 2022, 5, 116004. [Google Scholar] [CrossRef]
- Wang, H.; Yang, X.; Liu, X.; Wang, D. Heart Rate Estimation from Facial Videos with Motion Interference Using T-SNE-Based Signal Separation. Biomed. Opt. Express 2022, 13, 4494–4509. [Google Scholar] [CrossRef]
- Wiffen, L.; Brown, T.; Maczka, A.B.; Kapoor, M.; Pearce, L.; Chauhan, M.; Chauhan, A.J.; Saxena, M. Measurement of Vital Signs by Lifelight Software in Comparison to Standard of Care Multisite Development (VISION-MD): Protocol for an Observational Study. JMIR Res. Protoc. 2023, 12, e41533. [Google Scholar] [CrossRef]
- Przybyło, J. A Deep Learning Approach for Remote Heart Rate Estimation. Biomed. Signal Process Control 2022, 74, 103457. [Google Scholar] [CrossRef]
- Liu, X.; Yang, X.; Wang, D.; Wong, A.; Ma, L.; Li, L. VidAF: A Motion-Robust Model for Atrial Fibrillation Screening From Facial Videos. IEEE J. Biomed. Health Inf. 2022, 26, 1672–1683. [Google Scholar] [CrossRef]
- Han, J.; Ou, W.; Xiong, J.; Feng, S. Remote Heart Rate Estimation by Pulse Signal Reconstruction Based on Structural Sparse Representation. Electronics 2022, 11, 3738. [Google Scholar] [CrossRef]
- Qiao, D.; Ayesha, A.H.; Zulkernine, F.; Jaffar, N.; Masroor, R. ReViSe: Remote Vital Signs Measurement Using Smartphone Camera. IEEE Access 2022, 10, 131656–131670. [Google Scholar] [CrossRef]
- Sun, Z.; Li, X. Contrast-phys: Unsupervised video-based remote physiological measurement via spatiotemporal contrast. In European Conference on Computer Vision; Springer International Publishing: Cham, Switzerland, 2022; ISBN 9783031197741. [Google Scholar]
- Ding, S.; Ke, Z.; Yue, Z.; Song, C.; Lu, L. Noncontact Multiphysiological Signals Estimation via Visible and Infrared Facial Features Fusion. IEEE Trans. Instrum. Meas. 2022, 71, 4009213. [Google Scholar] [CrossRef]
- Das, M.; Choudhary, T.; Bhuyan, M.K.; Sharma, L.N. Non-Contact Heart Rate Measurement From Facial Video Data Using a 2D-VMD Scheme. IEEE Sens. J. 2022, 22, 11153–11161. [Google Scholar] [CrossRef]
- Zheng, X.; Zhang, C.; Chen, H.; Zhang, Y.; Yang, X. Remote Measurement of Heart Rate from Facial Video in Different Scenarios. Measurement 2022, 188, 110243. [Google Scholar] [CrossRef]
- Abbas, L.; Samy, S.; Ghazal, R.; Eldeib, A.M.; Elgohary, S.H. Contactless Vital Signs Monitoring for Public Health Welfare. In Proceedings of the 2021 9th International Japan-Africa Conference on Electronics, Communications, and Computations (JAC-ECC), Alexandria, Egypt, 13–14 December 2021; pp. 183–186. [Google Scholar]
- Ryu, J.; Hong, S.; Liang, S.; Pak, S.; Chen, Q.; Yan, S. A Measurement of Illumination Variation-Resistant Noncontact Heart Rate Based on the Combination of Singular Spectrum Analysis and Sub-Band Method. Comput. Methods Programs Biomed. 2021, 200, 105824. [Google Scholar] [CrossRef]
- Kado, S.; Monno, Y.; Yoshizaki, K.; Tanaka, M.; Okutomi, M. Spatial-Spectral-Temporal Fusion for Remote Heart Rate Estimation. IEEE Sens. J. 2020, 20, 11688–11697. [Google Scholar] [CrossRef]
- Zhang, C.; Gebhart, I.; Kühmstedt, P.; Rosenberger, M.; Notni, G. Enhanced Contactless Vital Sign Estimation from Real-Time Multimodal 3D Image Data. J. Imaging 2020, 6, 123. [Google Scholar] [CrossRef]
- Liu, X.; Yang, X.; Jin, J.; Wong, A. Detecting Pulse Wave from Unstable Facial Videos Recorded from Consumer-Level Cameras: A Disturbance-Adaptive Orthogonal Matching Pursuit. IEEE Trans. Biomed. Eng. 2020, 67, 3352–3362. [Google Scholar] [CrossRef]
- Tran, Q.-V.; Su, S.-F.; Tran, Q.-M.; Truong, V. Intelligent Non-Invasive Vital Signs Estimation from Image Analysis. In Proceedings of the 2020 International Conference on System Science and Engineering (ICSSE), Kagawa, Japan, 31 August–3 September 2020. [Google Scholar]
- Gao, H.; Zhang, C.; Pei, S.; Wu, X. LSTM-Based Real-Time Signal Quality Assessment for Blood Volume Pulse Analysis. Biomed. Opt. Express 2023, 14, 1119–1136. [Google Scholar] [CrossRef]
- Van Putten, L.D.; Bamford, K.E. Improving Systolic Blood Pressure Prediction from Remote Photoplethysmography Using a Stacked Ensemble Regressor. In Proceedings of the IEEE Computer Society Conference on Computer Vision and Pattern Recognition Workshops, Vancouver, BC, Canada, 17–24 June 2023; pp. 5957–5964. [Google Scholar]
- Wu, B.-J.; Wu, B.-F.; Hsu, C.-P. Camera-Based Blood Pressure Estimation via Windkessel Model and Waveform Features. IEEE Trans. Instrum. Meas. 2023, 72, 5004113. [Google Scholar] [CrossRef]
- Bousefsaf, F.; Desquins, T.; Djeldjli, D.; Ouzar, Y.; Maaoui, C.; Pruski, A. Estimation of Blood Pressure Waveform from Facial Video Using a Deep U-Shaped Network and the Wavelet Representation of Imaging Photoplethysmographic Signals. Biomed. Signal Process Control 2022, 78, 103895. [Google Scholar] [CrossRef]
- Wuerich, C.; Humm, E.-M.; Wiede, C.; Schiele, G. A Feature-Based Approach on Contact-Less Blood Pressure Estimation from Video Data. In Proceedings of the European Signal Processing Conference, Belgrade, Serbia, 29 August–2 September 2022; pp. 1343–1347. [Google Scholar]
- Schrumpf, F.; Frenzel, P.; Aust, C.; Osterhoff, G.; Fuchs, M. Assessment of Deep Learning Based Blood Pressure Prediction from PPG and RPPG Signals. In Proceedings of the IEEE Computer Society Conference on Computer Vision and Pattern Recognition Workshops, Nashville, TN, USA, 19–25 June 2021; pp. 3815–3825. [Google Scholar]
- Shirbani, F.; Moriarty, A.; Hui, N.; Cox, J.; Tan, I.; Avolio, A.P.; Butlin, M. Contactless Video-Based Photoplethysmography Technique Comparison Investigating Pulse Transit Time Estimation of Arterial Blood Pressure. In Proceedings of the 2021 43rd Annual International Conference of the IEEE Engineering in Medicine & Biology Society (EMBC), Mexico City, Mexico, 1–5 November 2021; pp. 5650–5653. [Google Scholar]
- Fan, X.; Ye, Q.; Yang, X.; Choudhury, S.D. Robust Blood Pressure Estimation Using an RGB Camera. J. Ambient. Intell. Humaniz. Comput. 2020, 11, 4329–4336. [Google Scholar] [CrossRef]
- Wu, B.-J.; Wu, B.-F.; Dong, Y.-C.; Lin, H.-C.; Li, P.-H. Peripheral Oxygen Saturation Measurement Using an RGB Camera. IEEE Sens. J. 2023, 23, 26551–26563. [Google Scholar] [CrossRef]
- van Gastel, M.; Verkruysse, W. Contactless SpO2 with an RGB Camera: Experimental Proof of Calibrated SpO2. Biomed. Opt. Express 2022, 13, 6791–6802. [Google Scholar] [CrossRef]
- Kraft, D.; Bieber, G.; Fellmann, M. Reliability Factor for Accurate Remote PPG Systems. In Proceedings of the PETRA’23: 16th International Conference on PErvasive Technologies Related to Assistive Environments, Corfu, Greece, 5–7 July 2023; pp. 448–456. [Google Scholar]
- Rohmetra, H.; Raghunath, N.; Narang, P.; Chamola, V.; Guizani, M.; Lakkaniga, N.R. AI-Enabled Remote Monitoring of Vital Signs for COVID-19: Methods, Prospects and Challenges. Computing 2023, 105, 783–809. [Google Scholar] [CrossRef]
- Zhang, Q.; Lin, X.; Zhang, Y.; Liu, Q.; Cai, F. Non-Contact High Precision Pulse-Rate Monitoring System for Moving Subjects in Different Motion States. Med. Biol. Eng. Comput. 2023, 61, 2769–2783. [Google Scholar] [CrossRef]
- Wang, D.; Chahl, J. Simulating Cardiac Signals on 3D Human Models for Photoplethysmography Development. Front. Robot. AI 2023, 10, 1266535. [Google Scholar] [CrossRef]
- Liu, X.; Yang, X.; Song, R.; Wang, D.; Li, L. PFDNet: A Pulse Feature Disentanglement Network for Atrial Fibrillation Screening From Facial Videos. IEEE J. Biomed. Health Inf. 2023, 27, 1060–1071. [Google Scholar] [CrossRef]
- McDuff, D. Camera Measurement of Physiological Vital Signs. ACM Comput. Surv. 2023, 55, 1–40. [Google Scholar] [CrossRef]
- Hwang, T.-H.; Shi, J.; Lee, K. Enhancing Privacy-Preserving Personal Identification Through Federated Learning With Multimodal Vital Signs Data. IEEE Access 2023, 11, 121556–121566. [Google Scholar] [CrossRef]
- Balaraman, K.; Claret, S.P.A. Recent Innovations and Improvements in Remote Heart Rate and Heart Disease Measuring Methods Using RGB Camera. In Proceedings of the 2023 International Conference on Circuit Power and Computing Technologies (ICCPCT), Kollam, India, 10–11 August 2023; pp. 1690–1696. [Google Scholar]
- Niu, L.; Speth, J.; Vance, N.; Sporrer, B.; Czajka, A.; Flynn, P. Full-Body Cardiovascular Sensing with Remote Photoplethysmography. In Proceedings of the IEEE Computer Society Conference on Computer Vision and Pattern Recognition Workshops, Vancouver, BC, Canada, 17–24 June 2023; pp. 5994–6004. [Google Scholar]
- Grech, N.; Calleja-Agius, J.; Sciberras, S.; Micallef, N.; Camilleri, K.; Falzon, O. Non-Contact Vital Signs Monitoring in Paediatric Anaesthesia—Current Challenges and Future Direction. Acta Med. 2023, 66, 39–46. [Google Scholar] [CrossRef]
- Hwang, T.-H.; Lee, K. Web-Based Non-Contact Edge Computing Solution for Suspected COVID-19 Infection Classification Model. J. Web Eng. 2023, 22, 597–614. [Google Scholar] [CrossRef]
- Chen, Y.J.; Lin, L.-C.; Yang, S.-T.; Hwang, K.-S.; Liao, C.-T.; Ho, W.-H. High-Reliability Non-Contact Photoplethysmography Imaging for Newborn Care by a Generative Artificial Intelligence. IEEE Access 2023, 11, 90801–90810. [Google Scholar] [CrossRef]
- Boussaki, H.E.; Latif, R.; Saddik, A. Video-Based Heart Rate Estimation Using Embedded Architectures. Int. J. Adv. Comput. Sci. Appl. 2023, 14, 1155–1164. [Google Scholar] [CrossRef]
- Fleischhauer, V.; Bruhn, J.; Rasche, S.; Zaunseder, S. Photoplethysmography upon Cold Stress—Impact of Measurement Site and Acquisition Mode. Front. Physiol. 2023, 14, 1127624. [Google Scholar] [CrossRef]
- Rother, A.; Notni, G.; Hasse, A.; Noack, B.; Beyer, C.; Reibmann, J.; Zhang, C.; Ragni, M.; Arlinghaus, J.; Spiliopoulou, M. Productive Teaming under Uncertainty: When a Human and a Machine Classify Objects Together. In Proceedings of the IEEE Workshop on Advanced Robotics and its Social Impacts, ARSO, Berlin, Germany, 5–7 June 2023; pp. 9–14. [Google Scholar]
- Odinaev, I.; Chin, J.W.; Ho Luo, K.; Ke, Z.; So, R.H.Y.; Long Wong, K. Optimizing Camera Exposure Control Settings for Remote Vital Sign Measurements in Low-Light Environments. In Proceedings of the IEEE Computer Society Conference on Computer Vision and Pattern Recognition Workshops, Vancouver, BC, Canada, 17–24 June 2023; pp. 6086–6093. [Google Scholar]
- Baumann, S.; Stone, R.T.; Genschel, U.; Mgaedeh, F. The Pi-CON Methodology Applied: Operator Errors and Preference Tracking of a Novel Ubiquitous Vital Signs Sensor and Its User Interface. Int. J. Hum. Comput. Interact. 2023, 1–23. [Google Scholar] [CrossRef]
- Kiddle, A.; Barham, H.; Wegerif, S.; Petronzio, C. Dynamic Region of Interest Selection in Remote Photoplethysmography: Proof-of-Concept Study. JMIR Form. Res. 2023, 7, e44575. [Google Scholar] [CrossRef]
- Hu, Q.; Zeng, W.; Sheng, Y.; Xu, J.; Ou, W.; Tan, R. Study on Real-Time Heart Rate Detection Based on Multi-People. Comput. Syst. Sci. Eng. 2023, 44, 1397–1408. [Google Scholar] [CrossRef]
- Baker, S.; Xiang, W. Artificial Intelligence of Things for Smarter Healthcare: A Survey of Advancements, Challenges, and Opportunities. IEEE Commun. Surv. Tutor. 2023, 25, 1261–1293. [Google Scholar] [CrossRef]
- Jin, J.; Lu, J.Q.; Chen, C.; Zhou, R.; Hu, X.-H. Photoplethysmographic Imaging and Analysis of Pulsatile Pressure Wave in Palmar Artery at 10 Wavelengths. J. Biomed. Opt. 2022, 27, 4. [Google Scholar] [CrossRef]
- Guler, S.; Ozturk, O.; Golparvar, A.; Dogan, H.; Yapici, M.K. Effects of Illuminance Intensity on the Green Channel of Remote Photoplethysmography (RPPG) Signals. Phys. Eng. Sci. Med. 2022, 45, 1317–1323. [Google Scholar] [CrossRef]
- Volkov, I.Y.; Sagaidachnyi, A.A.; Fomin, A.V. Photoplethysmographic Imaging of Hemodynamics and Two-Dimensional Oximetry. Opt. Spectrosc. 2022, 130, 452–469. [Google Scholar] [CrossRef]
- Capraro, G.A.; Balmaekers, B.; den Brinker, A.C.; Rocque, M.; DePina, Y.; Schiavo, M.W.; Brennan, K.; Kobayashi, L. Contactless Vital Signs Acquisition Using Video Photoplethysmography, Motion Analysis and Passive Infrared Thermography Devices During Emergency Department Walk-In Triage in Pandemic Conditions. J. Emerg. Med. 2022, 63, 115–129. [Google Scholar] [CrossRef]
- Allado, E.; Poussel, M.; Renno, J.; Moussu, A.; Hily, O.; Temperelli, M.; Albuisson, E.; Chenuel, B. Remote Photoplethysmography Is an Accurate Method to Remotely Measure Respiratory Rate: A Hospital-Based Trial. J. Clin. Med. 2022, 11, 3647. [Google Scholar] [CrossRef]
- Liu, P. Research on Noncontact Heart Rate Detection Based on Face Tracking and BVP Signal Extraction. J. Electron. Imaging 2022, 31, 043053. [Google Scholar] [CrossRef]
- Liu, X.; Wang, Y.; Xie, S.; Zhang, X.; Ma, Z.; McDuff, D.; Patel, S. MobilePhys: Personalized Mobile Camera-Based Contactless Physiological Sensing. Proc. ACM Interact. Mob. Wearable Ubiquitous Technol. 2022, 6, 1–23. [Google Scholar] [CrossRef]
- Ayesha, A.H.; Qiao, D.; Zulkernine, F. A web application for experimenting and validating remote measurement of vital signs. In International Conference on Information Integration and Web; Springer International Publishing: Cham, Switzerland, 2022; ISBN 9783031210464. [Google Scholar]
- Xu, G.; Dong, L.; Yuan, J.; Zhao, Y.; Liu, M.; Hui, M.; Zhao, Y.; Kong, L. Rational Selection of RGB Channels for Disease Classification Based on IPPG Technology. Biomed. Opt. Express 2022, 13, 1820–1833. [Google Scholar] [CrossRef]
- Liu, X.; Zhang, M.; Jiang, Z.; Patel, S.; McDuff, D. Federated Remote Physiological Measurement with Imperfect Data. In Proceedings of the IEEE Computer Society Conference on Computer Vision and Pattern Recognition Workshops, New Orleans, LA, USA, 19–20 June 2022; pp. 2154–2163. [Google Scholar]
- Wong, K.L.; Wei Chin, J.; Chan, T.T.; Odinaev, I.; Suhartono, K.; Tianqu, K.; So, R.H.Y. Optimising RPPG Signal Extraction by Exploiting Facial Surface Orientation. In Proceedings of the IEEE Computer Society Conference on Computer Vision and Pattern Recognition Workshops, New Orleans, LA, USA, 19–20 June 2022; pp. 2164–2170. [Google Scholar]
- Wallace, B.; Kassab, L.Y.; Law, A.; Goubran, R.; Knoefel, F. Contactless Remote Assessment of Heart Rate and Respiration Rate Using Video Magnification. IEEE Instrum. Meas. Mag. 2022, 25, 20–27. [Google Scholar] [CrossRef]
- Huang, H.-W.; Chen, J.; Chai, P.R.; Ehmke, C.; Rupp, P.; Dadabhoy, F.Z.; Feng, A.; Li, C.; Thomas, A.J.; da Silva, M.; et al. Mobile Robotic Platform for Contactless Vital Sign Monitoring. Cyborg Bionic Syst. 2022, 2022, 9780497. [Google Scholar] [CrossRef]
- Huang, H.-W.; Rupp, P.; Cheri, J.; Kemkar, A.; Khandelwal, N.; Ballinger, I.; Chai, P.; Traverso, G. Cost-Effective Solution of Remote Photoplethysmography Capable of Real-Time, Multi-Subject Monitoring with Social Distancing. In Proceedings of the 2022 IEEE Sensors, Dallas, TX, USA, 30 October–2 November 2022. [Google Scholar]
- Bousefsaf, F.; Djeldjli, D.; Ouzar, Y.; Maaoui, C.; Pruski, A. IPPG 2 CPPG: Reconstructing Contact from Imaging Photoplethysmographic Signals Using U-Net Architectures. Comput. Biol. Med. 2021, 138, 104860. [Google Scholar] [CrossRef]
- Zhang, L.; Fu, C.-H.; Hong, H.; Xue, B.; Gu, X.; Zhu, X.; Li, C. Non-Contact Dual-Modality Emotion Recognition System by CW Radar and RGB Camera. IEEE Sens. J. 2021, 21, 23198–23212. [Google Scholar] [CrossRef]
- Huang, B.; Chen, W.; Lin, C.-L.; Juang, C.-F.; Xing, Y.; Wang, Y.; Wang, J. A Neonatal Dataset and Benchmark for Non-Contact Neonatal Heart Rate Monitoring Based on Spatio-Temporal Neural Networks. Eng. Appl. Artif. Intell. 2021, 106, 104447. [Google Scholar] [CrossRef]
- Botina-Monsalve, D.; Benezeth, Y.; Miteran, J. RTrPPG: An Ultra Light 3DCNN for Real-Time Remote Photoplethysmography. In Proceedings of the IEEE Computer Society Conference on Computer Vision and Pattern Recognition Workshops, New Orleans, LA, USA, 19–20 June 2022; pp. 2145–2153. [Google Scholar]
- Van Gastel, M.; Stuijk, S.; Overeem, S.; Van Dijk, J.P.; Van Gilst, M.M.; De Haan, G. Camera-Based Vital Signs Monitoring during Sleep—A Proof of Concept Study. IEEE J. Biomed. Health Inf. 2021, 25, 1409–1418. [Google Scholar] [CrossRef]
- Wu, B.-F.; Wu, B.-J.; Tsai, B.-R.; Hsu, C.-P. A Facial-Image-Based Blood Pressure Measurement System Without Calibration. IEEE Trans. Instrum. Meas. 2022, 71, 5009413. [Google Scholar] [CrossRef]
- McDuff, D. Applications of camera-based physiological measurement beyond healthcare. In Contactless Vital Signs Monitoring; Academic Press: Cambridge, MA, USA, 2021; ISBN 9780128222812. [Google Scholar]
- Wang, X.; Shao, D. Human physiology and contactless vital signs monitoring using camera and wireless signals. In Contactless Vital Signs Monitoring; Academic Press: Cambridge, MA, USA, 2021; ISBN 9780128222812. [Google Scholar]
- den Brinker, A.C.; Wang, W. Model-based camera-PPG: Pulse-rate monitoring in fitness. In Contactless Vital Signs Monitoring; Academic Press: Cambridge, MA, USA, 2021; ISBN 9780128222812. [Google Scholar]
- Kraft, D.; Van Laerhofen, K.; Bieber, G. CareCam: Concept of a New Tool for Corporate Health Management. In Proceedings of the PETRA’21: 14th PErvasive Technologies Related to Assistive Environments Conference, Corfu, Greece, 29 June–2 July 2021; pp. 585–593. [Google Scholar]
- Ouzar, Y.; Djeldjli, D.; Bousefsaf, F.; Maaoui, C. LCOMS Lab’s Approach to the Vision for Vitals (V4V) Challenge. In Proceedings of the IEEE International Conference on Computer Vision, Montreal, BC, Canada, 11–17 October 2021; pp. 2750–2754. [Google Scholar]
- Laurie, J.; Higgins, N.; Peynot, T.; Fawcett, L.; Roberts, J. An Evaluation of a Video Magnification-Based System for Respiratory Rate Monitoring in an Acute Mental Health Setting. Int. J. Med. Inf. 2021, 148, 104378. [Google Scholar] [CrossRef]
- Gupta, M.; Chen, L.; Yu, D.; Aggarwal, V. A Supervised Learning Approach for Robust Health Monitoring Using Face Videos. In Proceedings of the DFHS’20: 2nd ACM Workshop on Device-Free Human Sensing, Virtual Event, 15 November 2020; pp. 6–10. [Google Scholar]
- Rios, E.A.; Lai, C.-C.; Yan, B.-R.; Lai, B.-C. Parametric Study of Performance of Remote Photopletysmography System. In Proceedings of the IEEE International Symposium on Circuits and Systems, Daegu, Republic of Korea, 22–28 May 2021. [Google Scholar]
- Natarajan, K.; Yavarimanesh, M.; Wang, W.; Mukkamala, R. Camera-based blood pressure monitoring. In Contactless Vital Signs Monitoring; Academic Press: Cambridge, MA, USA, 2021; ISBN 9780128222812. [Google Scholar]
- Sinhal, R.; Singh, K.; Raghuwanshi, M.M. An overview of remote photoplethysmography methods for vital sign monitoring. In Computer Vision and Machine Intelligence in Medical Image Analysis: International Symposium, ISCMM 2019; Springer: Singapore, 2020; Volume 992, ISBN 9789811387975. [Google Scholar]
- Liu, X.; Fromm, J.; Patel, S.; McDuff, D. Multi-Task Temporal Shift Attention Networks for on-Device Contactless Vitals Measurement. Adv. Neural Inf. Process. Syst. 2020, 33, 19400–19411. [Google Scholar]
- Ghodratigohar, M.; Ghanadian, H.; Al Osman, H. A Remote Respiration Rate Measurement Method for Non-Stationary Subjects Using CEEMDAN and Machine Learning. IEEE Sens. J. 2020, 20, 1400–1410. [Google Scholar] [CrossRef]
- Lee, H.; Ko, H.; Chung, H.; Lee, J. Robot Assisted Instantaneous Heart Rate Estimator Using Camera Based Remote Photoplethysmograpy via Plane-Orthogonal-to-Skin and Finite State Machine. In Proceedings of the 2020 42nd Annual International Conference of the IEEE Engineering in Medicine & Biology Society (EMBC), Montreal, QC, Canada, 20–24 July 2020; pp. 4425–4428. [Google Scholar]
- Fan, X.; Tjahjadi, T. Robust Contactless Pulse Transit Time Estimation Based on Signal Quality Metric. Pattern Recognit. Lett. 2020, 137, 12–16. [Google Scholar] [CrossRef]
- Benedetto, S.; Caldato, C.; Greenwood, D.C.; Bartoli, N.; Pensabene, V.; Actis, P. Remote Heart Rate Monitoring—Assessment of the Facereader RPPg by Noldus. PLoS ONE 2019, 14, e0225592. [Google Scholar] [CrossRef]
- Kossack, B.; Wisotzky, E.L.; Hilsmann, A.; Eisert, P.; Hänsch, R. Local Blood Flow Analysis and Visualization from RGB-Video Sequences. Curr. Dir. Biomed. Eng. 2019, 5, 373–375. [Google Scholar] [CrossRef]
- Rasche, S.; Trumpp, A.; Schmidt, M.; Plötze, K.; Gätjen, F.; Malberg, H.; Matschke, K.; Rudolf, M.; Baum, F.; Zaunseder, S. Remote Photoplethysmographic Assessment of the Peripheral Circulation in Critical Care Patients Recovering from Cardiac Surgery. Shock 2019, 52, 174–182. [Google Scholar] [CrossRef]
- Chen, X.; Cheng, J.; Song, R.; Liu, Y.; Ward, R.; Wang, Z.J. Video-Based Heart Rate Measurement: Recent Advances and Future Prospects. IEEE Trans. Instrum. Meas. 2019, 68, 3600–3615. [Google Scholar] [CrossRef]
- Iozza, L.; Lázaro, J.; Cerina, L.; Silvestri, D.; Mainardi, L.; Laguna, P.; Gil, E. Monitoring Breathing Rate by Fusing the Physiological Impact of Respiration on Video-Photoplethysmogram with Head Movements. Physiol. Meas. 2019, 40, 094002. [Google Scholar] [CrossRef]
- Nikolaiev, S.; Telenyk, S.; Tymoshenko, Y. Non-Contact Video-Based Remote Photoplethysmography for Human Stress Detection. J. Autom. Mob. Robot. Intell. Syst. 2020, 14, 63–73. [Google Scholar] [CrossRef]
- Wang, W.; Den Brinker, A.C.; Stuijk, S.; De Haan, G. Robust Heart Rate from Fitness Videos. Physiol. Meas. 2017, 38, 1023–1044. [Google Scholar] [CrossRef]
- Lin, Y.-C.; Wang, Y.-J.; Cheng, J.C.-H.; Lin, Y.-H. Contactless Monitoring of Pulse Rate and Eye Movement for Uveal Melanoma Patients Undergoing Radiation Therapy. IEEE Trans. Instrum. Meas. 2019, 68, 474–482. [Google Scholar] [CrossRef]
- Zaunseder, S.; Trumpp, A.; Ernst, H.; Förster, M.; Malberg, H. Spatio-Temporal Analysis of Blood Perfusion by Imaging Photoplethysmography. In Proceedings of the Optical Diagnostics and Sensing XVIII: Toward Point-of-Care Diagnostics, San Francisco, CA, USA, 27 January–1 February 2018; Volume 10501. [Google Scholar]
- Zhao, C.; Mei, P.; Xu, S.; Li, Y.; Feng, Y. Performance Evaluation of Visual Object Detection and Tracking Algorithms Used in Remote Photoplethysmography. In Proceedings of the 2019 International Conference on Computer Vision Workshop, ICCVW 2019, Seoul, Republic of Korea, 27–28 October 2019; pp. 1646–1655. [Google Scholar]
- Spicher, N.; Lovelace, T.; Kukuk, M. Feasibility of Photoplethysmography Imaging of the Sole of the Foot. In Proceedings of the MeMeA 2018—2018 IEEE International Symposium on Medical Measurements and Applications, Rome, Italy, 11–13 June 2018. [Google Scholar]
- Trumpp, A.; Rasche, S.; Wedekind, D.; Rudolf, M.; Malberg, H.; Matschke, K.; Zaunseder, S. Relation between Pulse Pressure and the Pulsation Strength in Camera-Based Photoplethysmograms. Curr. Dir. Biomed. Eng. 2017, 3, 489–492. [Google Scholar] [CrossRef]
- Mitsuhashi, R.; Iuchi, K.; Goto, T.; Matsubara, A.; Hirayama, T.; Hashizume, H.; Tsumura, N. Video-Based Stress Level Measurement Using Imaging Photoplethysmography. In Proceedings of the 2019 IEEE International Conference on Multimedia and Expo Workshops, ICMEW 2019, Shanghai, China, 8–12 July 2019; pp. 90–95. [Google Scholar]
- Shao, D.; Tsow, F.; Liu, C.; Yang, Y.; Tao, N. Simultaneous Monitoring of Ballistocardiogram and Photoplethysmogram Using a Camera. IEEE Trans. Biomed. Eng. 2017, 64, 1003–1010. [Google Scholar] [CrossRef]
- Moço, A.V.; Stuijk, S.; De Haan, G. New Insights into the Origin of Remote PPG Signals in Visible Light and Infrared. Sci. Rep. 2018, 8, 8501. [Google Scholar] [CrossRef]
- Wang, W.; Den Brinker, A.C.; Stuijk, S.; De Haan, G. Algorithmic Principles of Remote PPG. IEEE Trans. Biomed. Eng. 2017, 64, 1479–1491. [Google Scholar] [CrossRef]
- Arrow, C.; Ward, M.; Eshraghian, J.; Dwivedi, G. Capturing the Pulse: A State-of-the-Art Review on Camera-Based Jugular Vein Assessment. Biomed. Opt. Express 2023, 14, 6470–6492. [Google Scholar] [CrossRef]
- El Boussaki, H.; Latif, R.; Saddik, A. A review on video-based heart rate, respiratory rate and blood pressure estimation. In International Conference of Machine Learning and Computer Science Applications; Springer Nature Switzerland: Cham, Switzerland, 2023; ISBN 9783031288456. [Google Scholar]
- Lu, Y.; Wang, C.; Meng, M.Q.-H. Video-Based Contactless Blood Pressure Estimation: A Review. In Proceedings of the 2020 IEEE International Conference on Real-time Computing and Robotics (RCAR), Asahikawa, Japan, 28–29 September 2020; pp. 62–67. [Google Scholar]
- Harford, M.; Catherall, J.; Gerry, S.; Young, J.D.; Watkinson, P. Availability and Performance of Image-Based, Non-Contact Methods of Monitoring Heart Rate, Blood Pressure, Respiratory Rate, and Oxygen Saturation: A Systematic Review. Physiol. Meas. 2019, 40, 06TR01. [Google Scholar] [CrossRef]
- Zaunseder, S.; Trumpp, A.; Wedekind, D.; Malberg, H. Cardiovascular Assessment by Imaging Photoplethysmography-a Review. Biomed. Tech. 2018, 63, 529–535. [Google Scholar] [CrossRef]
- Li, X.; Wang, T.; Zhao, G.; Zhang, X.; Kang, X.; Yin, L. ReactioNet: Learning High-Order Facial Behavior from Universal Stimulus-Reaction by Dyadic Relation Reasoning. In Proceedings of the IEEE/CVF International Conference on Computer Vision, Paris, France, 2–6 October 2023. [Google Scholar]
- Soleymani, M. A Multimodal Database for Affect Recognition and Implicit Tagging. IEEE Trans. Affect. Comput. 2012, 3, 42–55. [Google Scholar] [CrossRef]
- Bobbia, S.; Macwan, R.; Benezeth, Y.; Mansouri, A.; Dubois, J. Unsupervised Skin Tissue Segmentation for Remote Photoplethysmography. Pattern Recognit. Lett. 2019, 124, 82–90. [Google Scholar] [CrossRef]
- Yin, L. MMSE-HR dataset (Multimodal Spontaneous Expression-Heart Rate Dataset). Case ID: RB537. 2020. Available online: https://suny.technologypublisher.com/tech/MMSE-HR_dataset_(Multimodal_Spontaneous_Expression-Heart_Rate_dataset) (accessed on 12 March 2024).
- Nemcova, A.; Vargova, E.; Smisek, R.; Maršánová, L.; Smital, L.; Vitek, M. Brno University of Technology Smartphone PPG Database (BUT PPG): Annotated Dataset for PPG Quality Assessment and Heart Rate Estimation. Biomed Res. Int. 2021, 2021, 3453007. [Google Scholar] [CrossRef]
- Freeman, J.; Nicholson, D.; Squire, P.; Bolton, A. Data & Analytics Tools for Agile Training & Readiness Assessment. 2014. Available online: https://www.researchgate.net/profile/Denise-Nicholson/publication/281498350_Data_Analytics_Tools_for_Agile_Training_Readiness_Assessment/links/55eb9d4a08ae21d099c5ea03/Data-Analytics-Tools-for-Agile-Training-Readiness-Assessment.pdf (accessed on 21 March 2024).
- Heusch, G.; Marcel, S.; Anjos, A. COHFACE [Data Set]. Zenodo. 2016. Available online: https://www.idiap.ch/en/scientific-research/data/cohface (accessed on 12 March 2024). [CrossRef]
- Xuesong, N.; Hu, H.; Shiguang, S.; Xilin, C. VIPL-HR: A Multi-modal Database for Pulse Estimation from Less-constrained Face Video. In Proceedings of the Computer Vision–ACCV 2018: 14th Asian Conference on Computer Vision, Perth, Australia, 2–6 December 2018; Revised Selected Papers. Springer International Publishing: Cham, Switzerland, 2018. [Google Scholar]
- Stys, A.; Stys, T. Current clinical applications of heart rate variability. Clin. Cardiol. 1998, 21, 719–724. [Google Scholar] [CrossRef]
- Chowdhury, M.H.; Shuzan, M.N.I.; Chowdhury, M.E.H.; Mahbub, Z.B.; Uddin, M.M.; Khandakar, A.; Reaz, M.B.I. Estimating Blood Pressure from the Photoplethysmogram Signal and Demographic Features Using Machine Learning Techniques. Sensors 2020, 20, 3127. [Google Scholar] [CrossRef]
- Stergiou, G.S.; Alpert, B.; Mieke, S.; Asmar, R.; Atkins, N.; Eckert, S.; Frick, G.; Friedman, B.; Graßl, T.; Ichikawa, T.; et al. A Universal Standard for the Validation of Blood Pressure Measuring Devices. Hypertension 2018, 71, 368–374. [Google Scholar] [CrossRef]


Disclaimer/Publisher’s Note: The statements, opinions and data contained in all publications are solely those of the individual author(s) and contributor(s) and not of MDPI and/or the editor(s). MDPI and/or the editor(s) disclaim responsibility for any injury to people or property resulting from any ideas, methods, instructions or products referred to in the content. |
© 2024 by the authors. Licensee MDPI, Basel, Switzerland. This article is an open access article distributed under the terms and conditions of the Creative Commons Attribution (CC BY) license (https://creativecommons.org/licenses/by/4.0/).