Article

Associations of Physical Activity and Heart Rate Variability from a Two-Week ECG Monitor with Cognitive Function and Dementia: The ARIC Neurocognitive Study

1
Department of Epidemiology, Johns Hopkins Bloomberg School of Public Health, Baltimore, MD 21205, USA
2
Center on Aging and Health, Johns Hopkins Bloomberg School of Public Health, Baltimore, MD 21205, USA
3
Courant Institute of Mathematical Sciences, New York University, New York, NY 10012, USA
4
Welch Center for Prevention, Epidemiologic, and Clinical Research, Johns Hopkins Bloomberg School of Public Health, Baltimore, MD 21205, USA
5
Department of Cardiology, Wake Forest University School of Medicine, Winston-Salem, NC 27109, USA
6
Cochlear Center for Hearing and Public Health, Johns Hopkins Bloomberg School of Public Health, Baltimore, MD 21205, USA
7
Department of Biostatistics, Johns Hopkins Bloomberg School of Public Health, Baltimore, MD 21205, USA
8
Department of Mental Health, Johns Hopkins Bloomberg School of Public Health, Baltimore, MD 21205, USA
9
Department of Psychiatry and Behavioral Sciences, Johns Hopkins School of Medicine, Baltimore, MD 20205, USA
10
Lillehei Heart Institute, Department of Medicine, University of Minnesota Medical School, Minneapolis, MN 55455, USA
*
Author to whom correspondence should be addressed.
Sensors 2024, 24(13), 4060; https://doi.org/10.3390/s24134060
Submission received: 6 May 2024 / Revised: 10 June 2024 / Accepted: 19 June 2024 / Published: 21 June 2024
(This article belongs to the Special Issue Sensors Technology and Application in ECG Signal Processing)

Abstract

:
Low physical activity (PA) measured by accelerometers and low heart rate variability (HRV) measured from short-term ECG recordings are associated with worse cognitive function. Wearable long-term ECG monitors are now widely used, and some devices also include an accelerometer. The objective of this study was to evaluate whether PA or HRV measured from long-term ECG monitors was associated with cognitive function among older adults. A total of 1590 ARIC participants had free-living PA and HRV measured over 14 days using the Zio® XT Patch [aged 72–94 years, 58% female, 32% Black]. Cognitive function was measured by cognitive factor scores and adjudicated dementia or mild cognitive impairment (MCI) status. Adjusted linear or multinomial regression models examined whether higher PA or higher HRV was cross-sectionally associated with higher factor scores or lower odds of MCI/dementia. Each 1-unit increase in the total amount of PA was associated with higher global cognition (β = 0.30, 95% CI: 0.16–0.44) and executive function scores (β = 0.38, 95% CI: 0.22–0.53) and lower odds of MCI (OR = 0.38, 95% CI: 0.22–0.67) or dementia (OR = 0.25, 95% CI: 0.08–0.74). HRV (i.e., SDNN and rMSSD) was not associated with cognitive function. More research is needed to define the role of wearable ECG monitors as a tool for digital phenotyping of dementia.

1. Introduction

Physical activity (PA) is a known modifiable risk factor for cognitive impairment and dementia [1,2,3]. There is a growing interest in objectively measuring PA using accelerometers. These devices are small, non-invasive, and continuously capture free-living movement over multiple days [4]. This method has important advantages for measuring PA in older adult populations who typically spend most of their time being sedentary or performing lighter intensity PA [4]. There are many different brands of accelerometers currently used in research [4]. Yet, there are barriers to integrating these devices into clinical environments [5]. Recent work from our group found that accelerometry data measured by the Zio® XT Patch, a commonly used ambulatory electrocardiogram (ECG) monitor capable of continuous (i.e., uninterrupted) wear for up to 14 days, was highly correlated with ActiGraph wrist accelerometry data [6]. To determine the potential utility of wearable ECG monitors with embedded accelerometers, it is important to evaluate associations between accelerometer-measured PA and important clinical outcomes, such as cognitive impairment. However, whether PA measured from these ECG monitors is related to cognitive function has not yet been established.
Heart rate variability (HRV) is defined as variation in successive heartbeats and lower HRV is associated with poor health outcomes [7,8]. Previous studies among adults without cognitive impairment have shown that lower HRV is associated with poorer global cognition [9,10], memory [9,11], language [9], attention [9], executive function [9,12], visuospatial performance [9], and processing speed [9]. Lower HRV is also related to lower cognitive test performance among those with cognitive impairment [13] and neurodegenerative diseases [14]. This prior work is based on HRV measures from ECG recordings taken over several minutes in clinical settings or 24 h recordings taken in a free-living environment. Longer ECG recordings might be more accurate in representing an individual’s HRV, particularly in response to the environment [7,15]. To date, no studies have evaluated associations between HRV from long-term ECG recordings and cognitive function.
Thus, we aimed to address these gaps by leveraging data from Zio® XT Patch ECG (iRhythm Technologies, San Francisco, CA, USA). and accelerometry data measured over 14 days in a free-living environment. First, we evaluated the cross-sectional association of total PA with cognitive function among older adults. Second, we examined the cross-sectional association between long-term HRV and cognitive function. We hypothesized that lower total PA and lower HRV are associated with lower cognitive test performance and higher odds of dementia compared to higher PA or HRV, respectively.

2. Methods

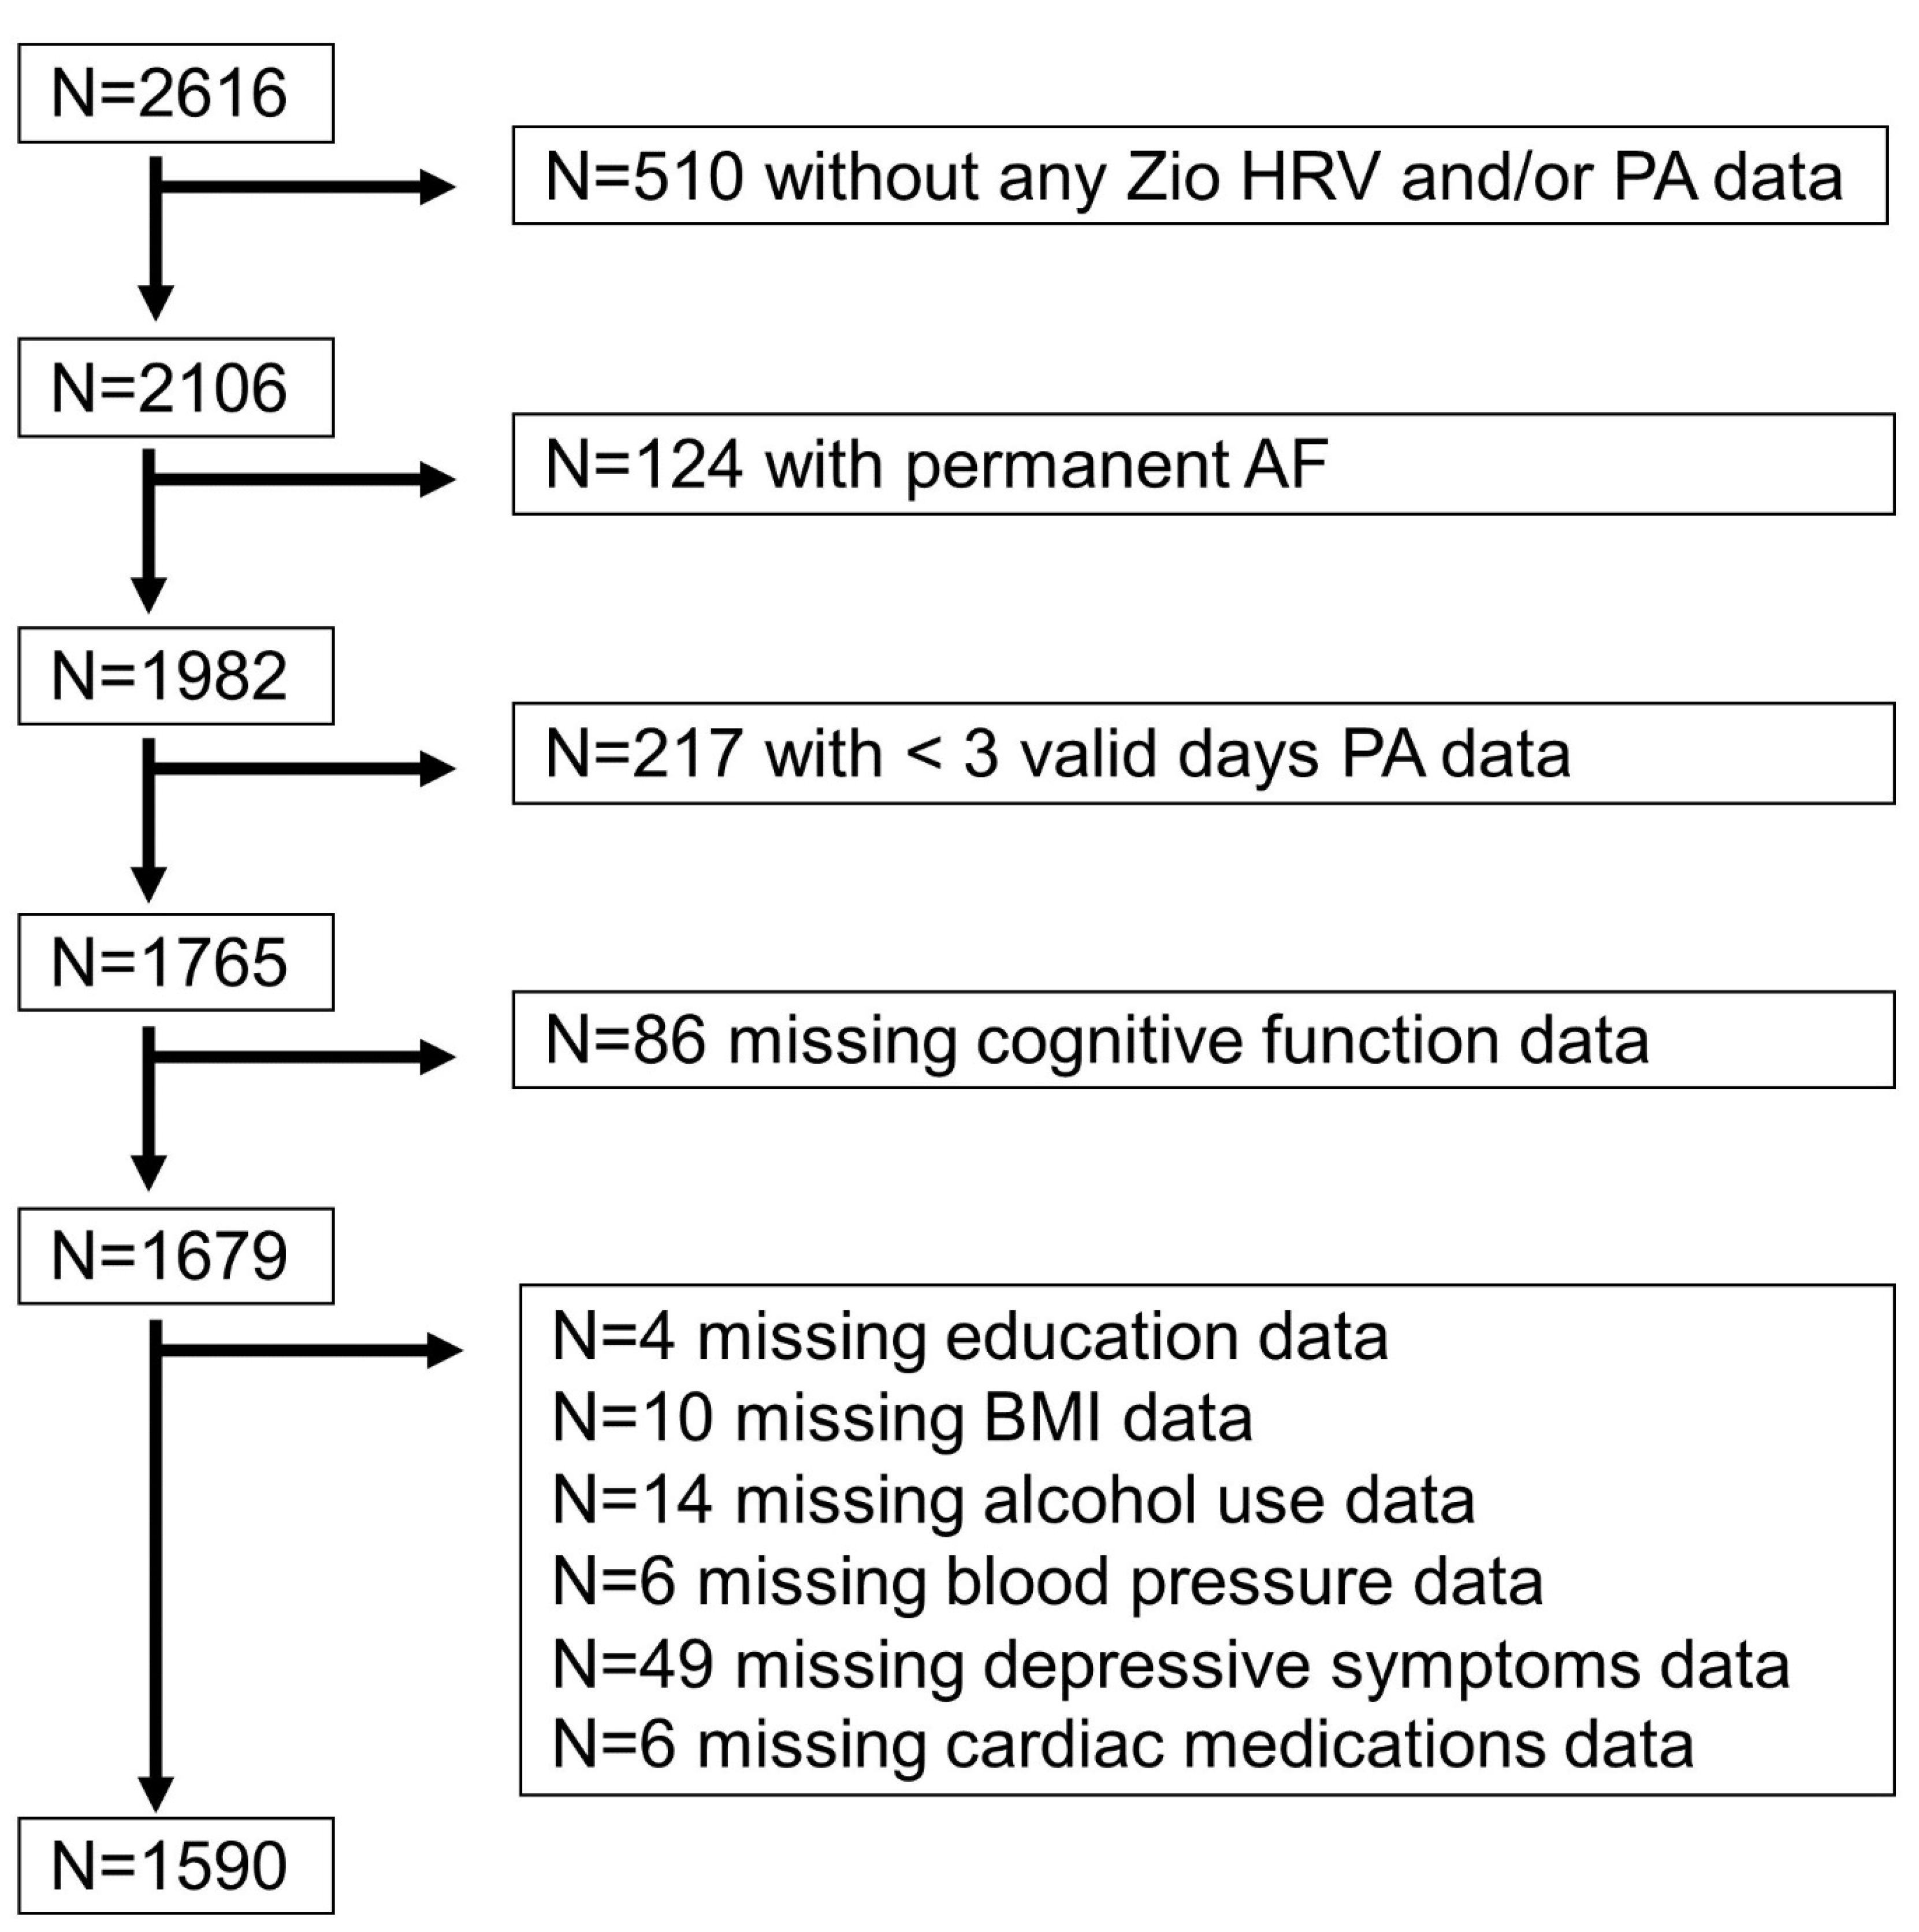
2.1. Study Population

The Atherosclerosis Risk in Communities (ARIC) study is a prospective cohort study of 15,792 community-dwelling, mostly Black and White, adults aged 45–64 years at enrollment. Participants were enrolled from Forsyth County, North Carolina, Jackson, Mississippi, Minneapolis, Minnesota, or Washington County, Maryland, between 1987 and 1989 [16]. This analysis included participants without permanent atrial fibrillation who attended visit 6 in 2016–2017 and wore the Zio® XT Patch (iRhythm Technologies, San Francisco, CA, USA). Participants missing cognitive tests, dementia status, or covariate data were excluded (Figure 1). All study protocols were approved by the institutional review board at each study site, and all participants provided informed consent.

2.2. Heart Rate Variability

HRV measures were derived from continuous ECG raw data over 14 days from the Zio® XT Patch. The patch was placed on the participant’s chest and worn continuously until the end of data collection. After data collection, the participant mailed the patch to iRhythm Technologies Inc for data processing. The primary HRV measures of interest included two HRV indices in the time domain: (1) the standard deviation of normal-to-normal RR intervals (SDNN) and (2) the root mean squared successive difference in normal-to-normal RR intervals (rMSSD). Lower SDNN and rMSSD are associated with poor health outcomes [7,8]. RR intervals are the time between successive normal heartbeats, SDNN represents the standard deviation between heartbeats, and rMSSD describes beat-to-beat variance [7]. SDNN and rMSSD were log-transformed due to non-normal distributions and then analyzed continuously. Additional details of HRV data processing can be found in the supplementary materials (heart rate variability data processing).

2.3. Physical Activity

First, accelerometry raw data from the Zio® XT Patch tri-axial accelerometer were summarized into minute-level mean amplitude deviation (MAD), a measure of movement intensity with gravitational units [17]. MAD is strongly correlated with activity counts [18], heart rate [17], and PA intensity [17]. A recent study has also validated MAD from the Zio® XT Patch against total activity counts measured using the ActiGraph wrist accelerometer [6]. Second, minute-level MAD measurements were screened for periods of wear and non-wear based on the simultaneously measured ECG data. Third, days with more than 144 (10%) non-wear minutes were excluded and participants with fewer than three valid days were excluded from further analysis. Finally, minute-level data were summarized into participant-level total mean amplitude deviation (TMAD), which is the daily total MAD averaged over all valid days. Higher TMAD can therefore be interpreted as higher levels of PA [17,18]. TMAD was natural-log-transformed due to non-normal distributions and then analyzed continuously (LTMAD). Processing of minute-level activity data was performed using the arctools R package [19].

2.4. Cognitive Test Factor Scores

Cognitive test performance was defined by factor scores for global cognition, executive function, memory, and language at visit 6. Participants completed a neuropsychological test battery with tests administered by trained psychometrists [20]. Executive function tests included the Trail Making Test parts A and B [21] and Digit Symbol Substitution Test [22]. Memory tests included delayed word recall and logical memory from the Wechsler Memory Scale—Revised [23] and incidental learning from the Wechsler Adult Intelligence Scale III [24]. Language tests included semantic and phonemic fluency [25] and Boston Naming tests [26]. From these individual cognitive tests, cognitive factor scores for global cognition, executive function, memory, and language were derived using confirmatory factor analysis [20]. Confirmatory factor analysis is a latent variable approach that uses all available cognitive test data to generate factor scores with a common scale while accounting for the common covariation among cognitive tests [20]. Missing cognitive test data were addressed by using maximum likelihood with robust standard errors [20]. Advantages of confirmatory factor analysis include: (1) use of all available test data, (2) allowing individual tests to have unequal weights, and (3) accounting for measurement error of individual tests [20]. The full details of the cognitive factor score derivation in ARIC are described elsewhere [20].

2.5. Mild Cognitive Impairment or Dementia Status

Participants were classified as having dementia, mild cognitive impairment (MCI), or unimpaired cognition at visit 6. Classifications were algorithmically based on criteria from the National Institute on Aging—Alzheimer’s Association workgroups [27,28] and from the 5th Edition Diagnostic and Statistical Manual of Mental Disorders [29]. This algorithm used information from the Mini Mental State Exam [30], Clinical Dementia Rating Scale Sum of Boxes [31], cognitive tests, and Functional Activities Questionnaire [32] to define participants as having highly likely or probable unimpaired cognition, MCI, dementia, or an indeterminate status [33].
Participants were defined as having MCI following at least one cognitive test < 1.5 standard deviations below the mean, a cognitive test decline below the 10th or 20th percentiles for one or two tests, respectively, a Clinical Dementia Rating Scale Sum of Boxes score > 0.5 but ≤3, and a Functional Activities Questionnaire score ≤ 5 [33]. Participants were defined as having dementia following at least two cognitive tests < 1.5 standard deviations below the mean, a cognitive test decline below the 10th or 20th percentiles for one or two tests, respectively, a Clinical Dementia Rating Scale Sum of Boxes score > 3, and a Functional Activities Questionnaire score > 5 [33]. Mini Mental State Examination scores < 21 for White participants or < 19 for Black participants also defined a dementia classification [33]. Participants were classified as cognitively unimpaired (i.e., normal cognition) if they did not meet the criteria for MCI or dementia [33]. Data were reviewed by a panel of clinicians for participants classified as having MCI or dementia that was highly likely or probable or who had an uncertain status. The full details of MCI and dementia classifications in ARIC are described elsewhere [33].

2.6. Other Covariates

The following covariates were measured at visit 1: age (years), sex (male, female), race/center, and education (grade school, high school without degree, high school graduate, vocational school, at least some college, or graduate/professional school). Covariates measured at visit 6 included: smoking status (current, former, never), alcohol status (current, former, never), body mass index (BMI; kilograms/meters2), systolic and diastolic blood pressure (mmHg), history of diabetes, history of heart failure, depressive symptoms (Center for Epidemiologic Studies Depression Scale score, which ranges from 0–60 with higher scores indicating higher depressive symptoms) [34], and cardiac medications (beta blocker, digoxin, calcium channel blocker, or anti-arrhythmic). Each medication was individually included as a covariate.

2.7. Statistical Methods

To provide basic summaries of the analytic sample, participants were categorized into PA and HRV tertiles as there are no accepted clinical cut-offs for these measures. Variables were summarized as tertile-specific means and standard deviations or as counts and proportions, and differences between tertiles were tested using F-tests or chi-squared tests for continuous or categorical variables, respectively.
The objective of this study was to evaluate associations between PA or HRV measured from a long-term ECG monitor with cognitive test performance and dementia status. To accomplish this objective, separate linear regression models estimated the mean cross-sectional difference in global cognition, memory, executive function, or language factor scores per 1-unit increment in LTMAD, log SDNN, or log rMSSD. Separate multinomial logistic regression models estimated the odds of MCI or dementia versus unimpaired cognition per 1-unit increment in LTMAD, log SDNN, or log rMSSD. To visually evaluate differences in PA by dementia status, diurnal curves of MAD over 24 h were plotted by dementia status. The final adjusted models included age, sex, race/center, education, smoking, alcohol, systolic and diastolic blood pressure, BMI, diabetes, heart failure, depressive symptoms, and each cardiac medication.
The models described above were fit with additional sample exclusions or adjustments in sensitivity analyses. First, LTMAD, log SDNN, and log rMSSD were included in the same adjusted models to determine whether there was an independent effect of PA above and beyond HRV or vice versa. Second, individuals with a history of stroke and/or non-permanent atrial fibrillation (i.e., intermittent atrial fibrillation) or who were taking beta blockers or calcium channel blockers were excluded, as these conditions and medications might confound the associations between PA or HRV with cognitive function. Third, those with MCI or dementia were excluded from the cognitive test score models to evaluate whether results were driven by participants with cognitive impairment. All analyses were conducted using Stata statistical software version 17 (StataCorp, College Station, TX, USA), and p-values < 0.05 were considered to be statistically significant.

3. Results

3.1. Sample Characteristics

Of the N = 2616 participants who attended ARIC visit 6 and wore the Zio® XT Patch, 1590 participants were included in the analysis (Figure 1). The overall sample characteristics of these 1590 participants are described in Table 1 and Table 2. Participants were, on average, aged 78.8 (range: 72–94) years, 58% were female, and 32% were Black. Participants exhibiting higher PA were younger, less likely to be Black, and more likely to be male, current drinkers, and former smokers compared to those with lower PA. This group was also associated with higher education attainments, lower body mass index and systolic blood pressure, and lower prevalence of diabetes, heart failure, and depressive symptoms (Table 1). Participants with higher HRV were less likely to be Black, more likely to be male, had lower BMI, and lower prevalence of diabetes than those with lower HRV (Table 2).
TMAD was weakly correlated with SDNN and with rMSSD (Pearson’s correlation = 0.22 or −0.08, respectively). The two HRV measures (i.e., SDNN and rMSSD) were moderately correlated (Pearson’s correlation = 0.48) (Figure S1).

3.2. Physical Activity and Cognitive Function

The first objective of this study was to evaluate associations between PA measured from a long-term ECG monitor with cognitive test performance. In fully adjusted models, each 1-unit increment in LTMAD was significantly associated with a 0.30 increase in global cognition (95% CI: 0.16, 0.44) and a 0.38 increase in executive function factor scores (95% CI: 0.22, 0.53). There were no associations with memory or language factor scores (Table 3).
An additional objective of this study was to evaluate associations between PA and the odds of MCI/dementia. When looking at the diurnal curves of PA in Figure 2, participants without cognitive impairment (blue line) had the highest peak in activity. This figure displays differences in patterns of PA over 24 h by dementia status. This group also exhibited higher daytime activity than those with MCI (green line) or dementia (gray line). Participants with MCI and dementia had blunted diurnal patterns of activity, with those with dementia exhibiting the greatest attenuation in activity (Figure 2). In fully adjusted models, each 1-unit increment in LTMAD was associated with a 62% decrease in the odds of MCI (OR = 0.38, 95% CI: 0.22, 0.67) or a 75% decrease in the odds of dementia (OR = 0.25, 95% CI: 0.08, 0.74) versus unimpaired cognition (Table 4).

3.3. Heart Rate Variability and Cognitive Function

The second objective of this study was to evaluate associations between HRV measured from a long-term ECG monitor and cognitive test performance and MCI/dementia. There were no significant associations between log SDNN or log rMSSD and cognitive function. SDNN and rMSSD were not significantly associated with cognitive test performance (Table 3) nor with MCI or dementia (Table 4).

3.4. Independent Effects of Physical Activity and Heart Rate Variability Measures

The first sensitivity analysis aimed to evaluate whether PA or HRV was independently associated with cognitive function. When including LTMAD, log SDNN, and log rMSSD together in the same model, associations for higher LTMAD with higher global cognition and executive function factor scores and lower odds of MCI or dementia remained significant. Further, a 1-unit increment in LTMAD was associated with a 0.15 increase in memory factor scores (95% CI: 0.04, 0.33). Associations with log SDNN or log rMSSD and cognitive factor scores or dementia status remained non-significant (Tables S1 and S2).

3.5. Exclusion of Stroke, Intermittent Atrial Fibrillation, Beta Blockers, and Calcium Channel Blockers

The second sensitivity analysis further controlled for possible confounding effects associated with chronic conditions or disease status. When excluding N = 170 participants with any history of stroke or intermittent atrial fibrillation and N = 675 taking either beta blockers or calcium channel blockers, associations between LTMAD, on one hand, and global cognition, executive function factor scores, dementia, on the other, remained significant (Tables S3 and S4). Further, each 1-unit increment in log SDNN was associated with a 0.59 increase in executive function factor scores (95% CI: 0.12, 1.07) (Table S3).

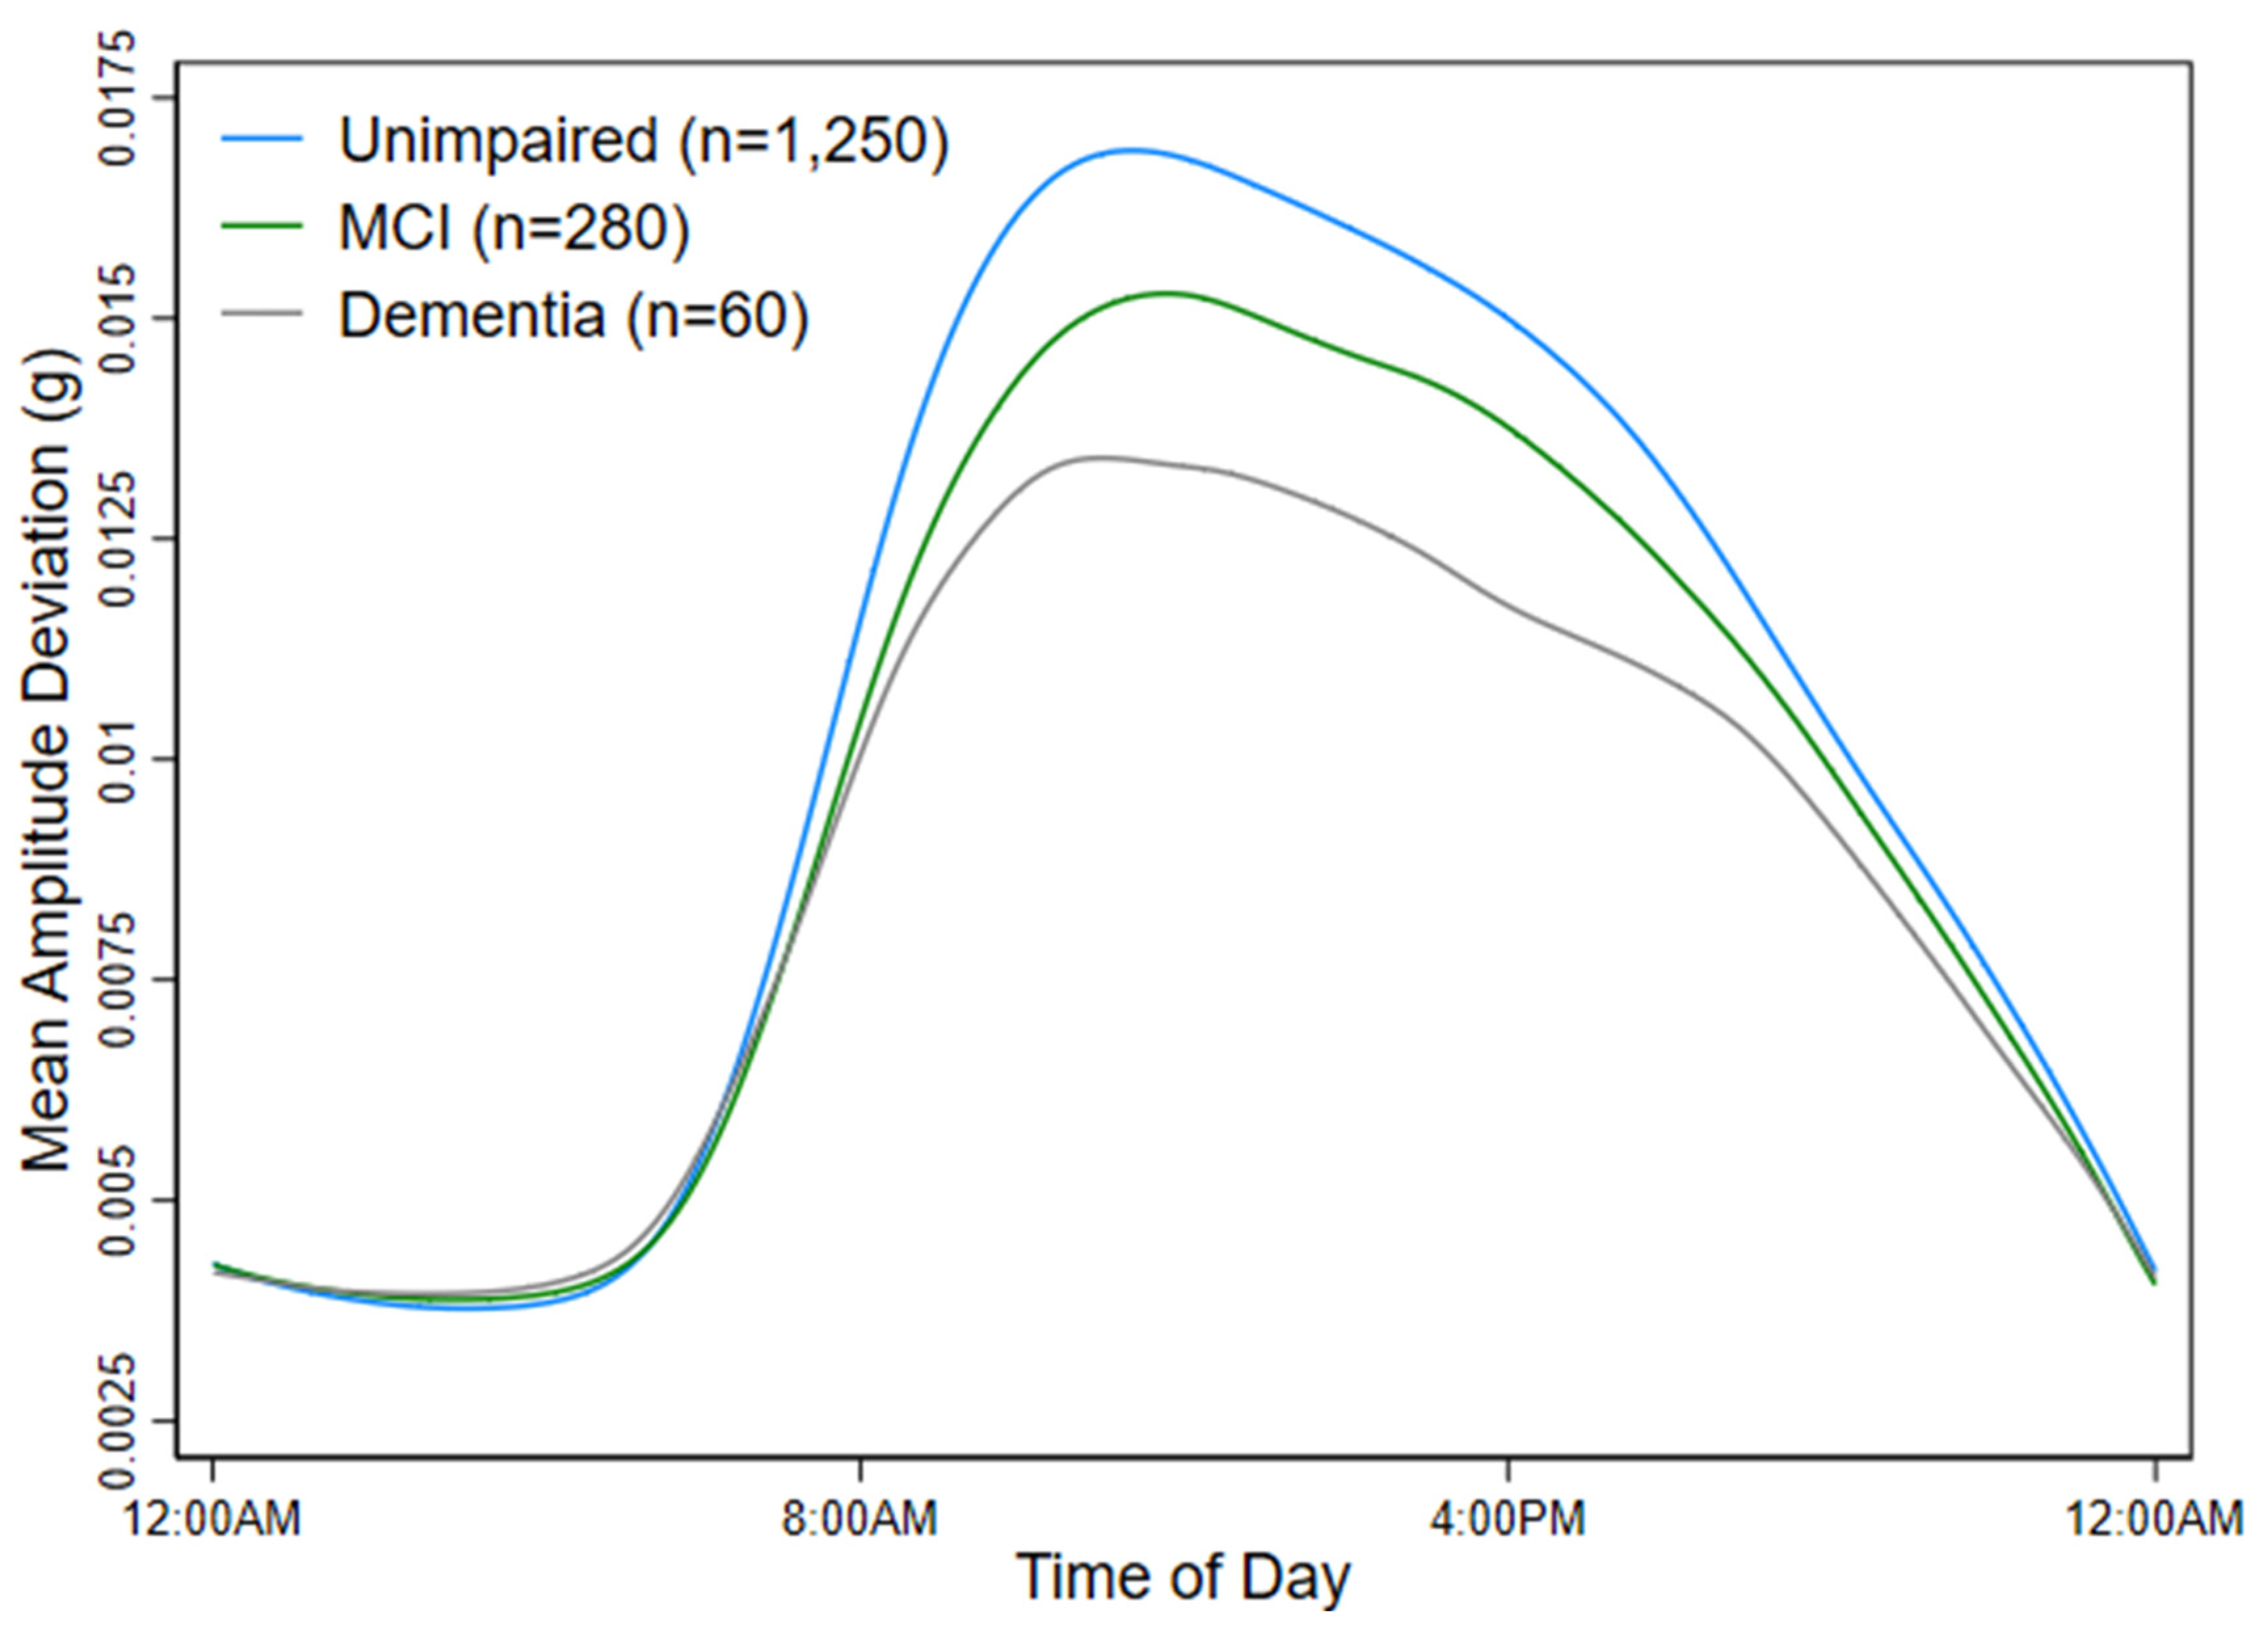
3.6. Sensitivity Analyses Restricted by Cognitive Status

The final sensitivity analysis evaluated whether associations were driven by participants with cognitive impairment. When excluding N = 340 participants with MCI or dementia, associations between LTMAD and executive function factor scores remained robust, but global cognition findings were non-significant (p = 0.09). Associations between log SDNN or log rMSSD and cognitive factor scores remained non-significant (Table S5).

4. Discussion

In a community-based sample of older adults, higher levels of free-living PA derived from an accelerometer embedded in a wearable ECG monitor worn by participants for two weeks was cross-sectionally associated with a 0.30 increase in global cognition factor scores, a 0.38 increase in executive function factor scores, and a 62% or 75% decrease in the odds of MCI or dementia. By contrast, time domain measures of HRV derived from the 2-week ECG raw data were not associated with cognitive performance and MCI/dementia. These findings raise the possibility of using accelerometers embedded within wearable ECG monitors as a tool to obtain digital phenotyping of dementia. These findings also challenge previously reported associations between lower HRV and poorer cognitive function based on short-term heart rate data.
Higher PA levels measured using the Zio® XT Patch were cross-sectionally associated with a 0.30–0.38 increase in executive function and global cognition factor scores, as well as a 62% decrease in the odds of MCI or a 75% decrease in the odds of dementia. These findings were largely robust across multiple sensitivity analyses. This is consistent with prior research documenting an association between higher PA and better cognitive performance [35] and lower risk of dementia [1,2,3], as well as research reporting that individuals living with MCI/dementia exhibit differences in objectively measured PA patterns [36]. Potential mechanisms explaining these associations include higher PA leading to increased brain neurotrophic factors [35,37] and cerebral blood flow [35,37] or decreased inflammation [35], stress overactivity [35], and cardiovascular risk factors [2,38]. In addition, it is important to acknowledge that emerging evidence suggests that associations between cognition and PA might be bidirectional [39]. However, we are unable to establish claims about temporality from this cross-sectional study. While this work supports the potential utility of accelerometers embedded in long-term wearable ECG monitors for the routine measurement of free-living PA, future longitudinal studies are needed to determine whether these data can be used to predict cognitive decline or dementia.
In our analyses, HRV was not related to cognitive test performance or odds of MCI/dementia. Previous works using short-term measurements of HRV suggest that higher values of certain indices are associated with better cognition, but other studies report null results [9,12,40]. The non-significant findings in our study might be due to the measurement of free-living HRV over a longer ECG monitoring period of 14 days which more accurately represents an individual’s HRV compared with shorter ECG recordings of several minutes to 24 h [15]. Further, our study focused on only two time-domain measures that are relatively constant over time [7,41]. Frequency-domain measures (i.e., high frequency, low frequency, etc.) which divide total HRV into certain frequency categories and represent different physiological systems [9] might be more strongly related to cognitive function. Future studies are needed to evaluate whether other patterns of long-term HRV are related to cognitive function.
In sensitivity analyses excluding those with a history of stroke, atrial fibrillation, beta blockers, or calcium channel blockers, we found that higher HRV, specifically SDNN, was associated with a 0.59 increase in executive function factor scores. These results align with studies finding associations between higher HRV and better executive function [9,11,12,40,42]. HRV is influenced by both components of the autonomic nervous system [7] and represents an individual’s ability to adapt to changes in their environment (i.e., faster heart rate with stressor) [9]. Certain diseases and medications can impact HRV, including stroke [43], atrial fibrillation [44], and cardiac medications [45]. Having a history of stroke or atrial fibrillation is also associated with a cognitive decline and risk of dementia [46]. As such, these factors might have hidden (i.e., confounded) the association between HRV and cognitive function when analyzing the whole sample. The mechanisms linking HRV with cognitive function should be evaluated in future work, while also considering potential differences in associations caused by certain cardiovascular diseases or medications.
This study suggests the possible utility of accelerometers embedded in wearable ECG monitors as a tool to assess cognitive function and provide digital phenotyping of dementia. This has important public health implications, as many wearable ECG monitors are already commonly used in the clinical setting. Further, the measure of PA used in this study was a simple summary of the total amount of activity, adding to the feasibility of using these data. We have previously shown that this measure of total amount of PA is highly correlated with total activity counts from the ActiGraph accelerometer [6]. Although the summary measures of HRV were not related to cognitive function in this study, it is possible that more detailed metrics of long-term HRV are associated with cognitive function. Specifically, it might be necessary to examine HRV by time of day. Higher daytime HRV is associated with positive health outcomes [7,8], whereas higher overnight HRV is linked with negative health outcomes [47]. It might also be important to consider whether bouts of high HRV but low PA, or vice versa, are informative of cognitive function. This could include combining minute-level ECG and accelerometry data to generate time-varying profiles of PA and HRV. Beyond exploring additional HRV measures, replication of these findings in longitudinal cohorts with more ethnically diverse samples is needed, as the findings from this cross-sectional study do not inform on whether PA measured from this ECG monitor can predict cognitive decline or dementia.

Limitations and Strengths

It is important to consider these results in the context of the study’s limitations. First, we are not able to establish temporality from these cross-sectional analyses. There is a possibility for reverse causation, where those with lower cognitive function might be less active and therefore have lower HRV. Second, we do not have information available on the context of activities that the participants were performing, information which would help interpret the PA and HRV data. Third, there is possible selection bias, as participants must have had both Zio® XT Patch and cognitive function data to be included in this analysis. If individuals with dementia or low cognitive test performance and worse PA or HRV did not wear the ECG device, then we would expect this bias to be conservative (i.e., attenuated findings).
This study also has strengths. First, the ARIC study is a well-characterized cohort with a large sample of White and Black older adults. Second, ARIC conducts a comprehensive neuropsychological test battery and rigorous ascertainment of dementia, allowing us to examine associations across multiple cognitive domains and by dementia status. Third, we evaluated PA and HRV measured by a common clinical device in the free-living environment over 14 days.

5. Conclusions

Higher free-living PA measured over two weeks by a wearable continuous ECG monitor is positively associated with cognitive performance and MCI/dementia. By contrast, long-term time-domain measures of HRV are not associated with cognitive performance or MCI/dementia. Our findings suggest the potential of accelerometers embedded in wearable continuous ECG monitors as a promising tool for digital phenotyping of dementia. Future research is needed to evaluate more detailed digital measures of PA and HRV and to evaluate whether these indices can predict cognitive decline or dementia.

Supplementary Materials

The following supporting information can be downloaded at: https://www.mdpi.com/article/10.3390/s24134060/s1, Supplementary Materials include supplementary methods, figures, and tables. Supplementary methods: Heart rate variability data processing. Supplementary Figure S1: Correlations among log TMAD (LTMAD), log SDNN, and log rMSSD. Supplementary Table S1: Cross-sectional differences in cognitive factor scores by LTMAD, log SDNN, or log rMSSD adjusted for LTMAD, log SDNN, and log rMSSD together. Supplementary Table S2: Cross-sectional odds of MCI or dementia compared to unimpaired cognition by LTMAD, log SDNN, or log rMSSD adjusted for LTMAD, log SDNN, and log rMSSD together. Supplementary Table S3: Cross-sectional differences in cognitive factor scores by LTMAD, log SDNN, or log rMSSD excluding participants with a history of stroke, any atrial fibrillation, and use of beta blockers or calcium channel blockers. Supplementary Table S4: Cross-sectional odds of MCI or dementia compared to unimpaired cognition by LTMAD, log SDNN, or log rMSSD excluding participants with a history of stroke, any atrial fibrillation, and use of beta blockers or calcium channel blockers. Supplementary Table S5: Cross-sectional differences in cognitive factor scores by LTMAD, log SDNN, or log rMSSD among cognitively unimpaired participants. References [48,49,50,51,52,53] have been cited in the Supplementary Materials.

Author Contributions

Conceptualization, E.Z.S., A.A.W., J.A.S. and L.Y.C.; methodology, H.-T.W. and L.Y.C.; formal analysis, F.R.M., A.A.W., J.A.S. and L.Y.C.; investigation, E.Z.S., J.A.D., A.P.S., J.A.S. and L.Y.C.; writing—original draft preparation, F.R.M., A.A.W., J.A.S. and L.Y.C.; writing—review & editing, F.R.M., H.-T.W., L.E., M.R.R., E.Z.S., J.A.D., C.C., A.P.S., A.A.W., J.A.S. and L.Y.C.; supervision, A.A.W., J.A.S. and L.Y.C. All authors have read and agreed to the published version of the manuscript.

Funding

FRM was supported by Grant Number T32 HL007024 from the National Heart, Lung, and Blood Institutes, National Institutes of Health. JAD was supported by Grant Number K01 AG054693 from the National Institute on Aging, National Institutes of Health. AAW was supported by Grant Number K01 AG076967 from the National Institute on Aging, National Institutes of Health. APS was supported by R01 AG075883 from the National Institute on Aging, National Institutes of Health. FRM, AAW, and JAS were supported by Grant Number U01 AG057545 from the National Institute on Aging, National Institutes of Health. HTW, MRR, and LYC were supported by Grant Number R01 HL158022 from the National Heart, Lung, and Blood Institutes, National Institutes of Health. LYC was supported by Grant Number R01 HL126637 from the National Heart, Lung, and Blood Institutes, National Institutes of Health. The Atherosclerosis Risk in Communities Study is carried out as a collaborative study supported by National Heart, Lung, and Blood Institute contracts (75N92022D00001, 75N92022D00002, 75N92022D00003, 75N92022D00004, 75N92022D00005). The ARIC Neurocognitive Study is supported by U01 HL096812, U01 HL096814, U01 HL096899, U01 HL096902, and U01 HL096917 from the NIH (NHLBI, NINDS, NIA and NIDCD).

Institutional Review Board Statement

The study was conducted according to the guidelines of the Declaration of Helsinki and approved by the Institutional Review Board at each Atherosclerosis Risk in Communities study site.

Informed Consent Statement

Informed consent was obtained from all subjects involved in the study.

Data Availability Statement

Researchers with an approved manuscript proposal form may request data from the Atherosclerosis Risk in Communities Coordinating Center.

Acknowledgments

The authors thank the staff and participants of the ARIC study for their important contributions.

Conflicts of Interest

Adam Spira received payment for serving as a consultant for Merck, received honoraria from Springer Nature Switzerland AG for guest editing special issues of Current Sleep Medicine Reports, and is a paid consultant to Sequoia Neurovitality, BellSant, Inc., and Amissa, Inc. There are no other conflicts of interest to disclose.

References

  1. Zhang, X.; Li, Q.; Cong, W.; Mu, S.; Zhan, R.; Zhong, S.; Zhao, M.; Zhao, C.; Kang, K.; Zhou, Z. Effect of physical activity on risk of Alzheimer’s disease: A systematic review and meta-analysis of twenty-nine prospective cohort studies. Ageing Res. Rev. 2023, 92, 102127. [Google Scholar] [CrossRef] [PubMed]
  2. Vítor, J.; Melita, C.; Rodrigues, M.; de Sousa, D.A.; Costa, J.; Ferro, J.M.; Verdelho, A. Physical activity in vascular cognitive impairment: Systematic review with meta-analysis. J. Stroke Cerebrovasc. Dis. 2023, 32, 107133. [Google Scholar] [CrossRef]
  3. Livingston, G.; Huntley, J.; Sommerlad, A.; Ames, D.; Ballard, C.; Banerjee, S.; Brayne, C.; Burns, A.; Cohen-Mansfield, J.; Cooper, C.; et al. Dementia prevention, intervention, and care: 2020 report of the Lancet Commission. Lancet 2020, 396, 413–446. [Google Scholar] [CrossRef]
  4. Liu, F.; Wanigatunga, A.A.; Schrack, J.A. Assessment of Physical Activity in Adults Using Wrist Accelerometers. Epidemiol. Rev. 2022, 43, 65–93. [Google Scholar] [CrossRef]
  5. Maher, C.; Szeto, K.; Arnold, J. The use of accelerometer-based wearable activity monitors in clinical settings: Current practice, barriers, enablers, and future opportunities. BMC Health Serv. Res. 2021, 21, 1064. [Google Scholar] [CrossRef] [PubMed]
  6. Davoudi, A.; Urbanek, J.K.; Etzkorn, L.; Parikh, R.; Soliman, E.Z.; Wanigatunga, A.A.; Gabriel, K.P.; Coresh, J.; Schrack, J.A.; Chen, L.Y. Validation of a Zio XT Patch Accelerometer for the Objective Assessment of Physical Activity in the Atherosclerosis Risk in Communities (ARIC) Study. Sensors 2024, 24, 761. [Google Scholar] [CrossRef]
  7. Shaffer, F.; Ginsberg, J.P. An Overview of Heart Rate Variability Metrics and Norms. Front. Public Health 2017, 5, 290215. [Google Scholar] [CrossRef]
  8. Nicolini, P.; Ciulla, M.M.; Malfatto, G.; Abbate, C.; Mari, D.; Rossi, P.D.; Pettenuzzo, E.; Magrini, F.; Consonni, D.; Lombardi, F. Autonomic Dysfunction in Mild Cognitive Impairment: Evidence from Power Spectral Analysis of Heart Rate Variability in a Cross-Sectional Case-Control Study. PLoS ONE 2014, 9, e96656. [Google Scholar] [CrossRef] [PubMed]
  9. Forte, G.; Favieri, F.; Casagrande, M. Heart Rate Variability and Cognitive Function: A Systematic Review. Front. Neurosci. 2019, 13, 436204. [Google Scholar] [CrossRef]
  10. Imbimbo, C.; Spallazzi, M.; Ferrari-Pellegrini, F.; Villa, A.; Zilioli, A.; Mutti, C.; Parrino, L.; Lazzeroni, D. Heart rate variability and cognitive performance in adults with cardiovascular risk. Cereb. Circ. Cogn. Behav. 2022, 3, 100136. [Google Scholar] [CrossRef]
  11. Meessen, J.; Sütterlin, S.; Gauggel, S.; Forkmann, T. Learning by heart—The relationship between resting vagal tone and metacognitive judgments: A pilot study. Cogn. Process. 2018, 19, 557–561. [Google Scholar] [CrossRef] [PubMed]
  12. Magnon, V.; Vallet, G.T.; Benson, A.; Mermillod, M.; Chausse, P.; Lacroix, A.; Bouillon-Minois, J.-B.; Dutheil, F. Does heart rate variability predict better executive functioning? A systematic review and meta-analysis. Cortex 2022, 155, 218–236. [Google Scholar] [CrossRef] [PubMed]
  13. de Vilhena Toledo, M.A.; Junqueira, L.F. Cardiac autonomic modulation and cognitive status in Alzheimer’s disease. Clin. Auton. Res. 2010, 20, 11–17. [Google Scholar] [CrossRef] [PubMed]
  14. Liu, K.Y.; Elliott, T.; Knowles, M.; Howard, R. Heart rate variability in relation to cognition and behavior in neurodegenerative diseases: A systematic review and meta-analysis. Ageing Res. Rev. 2022, 73, 101539. [Google Scholar] [CrossRef] [PubMed]
  15. Kleiger, R.E.; Stein, P.K.; Bigger, J.T. Heart rate variability: Measurement and clinical utility. Ann. Noninvasive Electrocardiol. 2005, 10, 88–101. [Google Scholar] [CrossRef] [PubMed]
  16. Wright, J.D.; Folsom, A.R.; Coresh, J.; Sharrett, A.R.; Couper, D.; Wagenknecht, L.E.; Mosley, T.H.; Ballantyne, C.M.; Boerwinkle, E.A.; Rosamond, W.D.; et al. The ARIC (Atherosclerosis Risk in Communities) Study: JACC Focus Seminar 3/8. J. Am. Coll. Cardiol. 2021, 77, 2939–2959. [Google Scholar] [CrossRef] [PubMed]
  17. Vähä-Ypyä, H.; Vasankari, T.; Husu, P.; Suni, J.; Sievänen, H. A universal, accurate intensity-based classification of different physical activities using raw data of accelerometer. Clin. Physiol. Funct. Imaging 2015, 35, 64–70. [Google Scholar] [CrossRef] [PubMed]
  18. Karas, M.; Muschelli, J.; Leroux, A.; Urbanek, J.K.; Wanigatunga, A.A.; Bai, J.; Crainiceanu, C.M.; Schrack, J.A. Comparison of Accelerometry-Based Measures of Physical Activity: Retrospective Observational Data Analysis Study. JMIR mHealth uHealth 2022, 10, e38077. [Google Scholar] [CrossRef] [PubMed]
  19. Karas, M.; Schrack, J.; Urbanek, J. arctools: Processing and Physical Activity Summaries of Minute Level Activity Data 2021. Available online: https://cran.r-project.org/package=arctools/arctools.pdf (accessed on 1 June 2023).
  20. Gross, A.L.; Power, M.C.; Albert, M.S.; Deal, J.A.; Gottesman, R.F.; Griswold, M.; Wruck, L.M.; Mosley, T.H., Jr.; Coresh, J.; Sharrett, A.R. Application of latent variable methods to the study of cognitive decline when tests change over time. Epidemiology 2015, 26, 878–887. [Google Scholar] [CrossRef]
  21. Reitan, R.M. Validity of the Trail Making Test as an Indicator of Organic Brain Damage. Percept. Mot. Skills 1958, 8, 271. [Google Scholar] [CrossRef]
  22. Wechsler, D. Wechsler Adult Intelligence Scale-Revised; Psychological Corporation: New York, NY, USA, 1981; Volume 1. [Google Scholar]
  23. Wechsler, D. Wechsler Memory Scale-Revised; Psychological Corporation: San Antonio, TX, USA, 1987. [Google Scholar]
  24. Ryan, J.; Lopez, S. Understanding psychological assessment. Perspectives on individual differences. In Wechsler Adult Intelligence Scale-III; Dorfman, W., Hersen, M., Eds.; Kluwer Academic/Plenum Publishers: New York, NY, USA, 2001; p. 23. [Google Scholar]
  25. Benton, A.; Hamsher, K. Multilingual Aphasia Examination; University of Iowa: Iowa Cita, IA, USA, 1976. [Google Scholar]
  26. Williams, B.W.; Mack, W.; Henderson, V.W. Boston Naming Test in Alzheimer’s disease. Neuropsychologia 1989, 27, 1073–1079. [Google Scholar] [CrossRef] [PubMed]
  27. Albert, M.S.; DeKosky, S.T.; Dickson, D.; Dubois, B.; Feldman, H.H.; Fox, N.C.; Gamst, A.; Holtzman, D.M.; Jagust, W.J.; Petersen, R.C.; et al. The diagnosis of mild cognitive impairment due to Alzheimer’s disease: Recommendations from the National Institute on Aging-Alzheimer’s Association workgroups on diagnostic guidelines for Alzheimer’s disease. Alzheimer’s Dement. 2011, 7, 270–279. [Google Scholar] [CrossRef] [PubMed]
  28. McKhann, G.M.; Knopman, D.S.; Chertkow, H.; Hyman, B.T.; Jack, C.R., Jr.; Kawas, C.H.; Klunk, W.E.; Koroshetz, W.J.; Manly, J.J.; Mayeux, R.; et al. The diagnosis of dementia due to Alzheimer’s disease: Recommendations from the National Institute on Aging-Alzheimer’s Association workgroups on diagnostic guidelines for Alzheimer’s disease. Alzheimer’s Dement. 2011, 7, 263–269. [Google Scholar] [CrossRef] [PubMed]
  29. American Psychiatric Association. Diagnostic and Statistical Manual of Mental Disorders, 5th ed.; American Psychiatric Publishing: Washington, DC, USA, 2013. [Google Scholar]
  30. Folstein, M.F.; Folstein, S.E.; McHugh, P.R. “Mini-mental state”: A practical method for grading the cognitive state of patients for the clinician. J. Psychiatr. Res. 1975, 12, 189–198. [Google Scholar] [CrossRef] [PubMed]
  31. Morris, J.C. The Clinical Dementia Rating (CDR): Current Version and Scoring Rules. Neurology 1993, 43, 2412–2414. [Google Scholar] [CrossRef]
  32. Pfeffer, R.I.; Kurosaki, T.T.; Harrah, C.H.; Chance, J.M.; Filos, S. Measurement of Functional Activities in Older Adults in the Community. J. Gerontol. 1982, 37, 323–329. [Google Scholar] [CrossRef] [PubMed]
  33. Knopman, D.S.; Gottesman, R.F.; Sharrett, A.R.; Wruck, L.M.; Windham, B.G.; Coker, L.; Schneider, A.L.C.; Hengrui, S.; Alonso, A.; Coresh, J.; et al. Mild cognitive impairment and dementia prevalence: The Atherosclerosis Risk in Communities Neurocognitive Study. Alzheimer’s Dement. 2016, 2, 1–11. [Google Scholar] [CrossRef] [PubMed]
  34. Radloff, L.S. The CES-D scale: A self-report depression scale for research in the general population. Appl. Psychol. Meas. 1977, 1, 385–401. [Google Scholar] [CrossRef]
  35. Phillips, C. Lifestyle Modulators of Neuroplasticity: How Physical Activity, Mental Engagement, and Diet Promote Cognitive Health during Aging. Neural Plast. 2017, 2017, 3589271. [Google Scholar] [CrossRef]
  36. Varma, V.R.; Watts, A. Daily Physical Activity Patterns During the Early Stage of Alzheimer’s Disease. J. Alzheimers Dis. 2017, 55, 659–667. [Google Scholar] [CrossRef]
  37. De la Rosa, A.; Olaso-Gonzalez, G.; Arc-Chagnaud, C.; Millan, F.; Salvador-Pascual, A.; García-Lucerga, C.; Blasco-Lafarga, C.; Garcia-Dominguez, E.; Carretero, A.; Correas, A.G.; et al. Physical exercise in the prevention and treatment of Alzheimer’s disease. J. Sport Health Sci. 2020, 9, 394–404. [Google Scholar] [CrossRef] [PubMed]
  38. Rennie, K.L. Effects of Moderate and Vigorous Physical Activity on Heart Rate Variability in a British Study of Civil Servants. Am. J. Epidemiol. 2003, 158, 135–143. [Google Scholar] [CrossRef] [PubMed]
  39. Allan, J.L.; McMinn, D.; Daly, M. A bidirectional relationship between executive function and health behavior: Evidence, implications, and future directions. Front. Neurosci. 2016, 10, 210626. [Google Scholar] [CrossRef] [PubMed]
  40. Lin, F.; Ren, P.; Wang, X.; Anthony, M.; Tadin, D.; Heffner, K.L. Cortical thickness is associated with altered autonomic function in cognitively impaired and non-impaired older adults. J. Physiol. 2017, 595, 6969–6978. [Google Scholar] [CrossRef] [PubMed]
  41. Hautala, A.J.; Karjalainen, J.; Kiviniemi, A.M.; Kinnunen, H.; Makikallio, T.H.; Huikuri, H.V.; Tulppo, M.P. Physical activity and heart rate variability measured simultaneously during waking hours. Am. J. Physiol.-Heart Circ. Physiol. 2010, 298, H874–H880. [Google Scholar] [CrossRef] [PubMed]
  42. Critchley, H.D. Neural mechanisms of autonomic, affective, and cognitive integration. J. Comp. Neurol. 2005, 493, 154–166. [Google Scholar] [CrossRef] [PubMed]
  43. Aftyka, J.; Staszewski, J.; Dębiec, A.; Pogoda-Wesołowska, A.; Żebrowski, J. Heart rate variability as a predictor of stroke course, functional outcome, and medical complications: A systematic review. Front. Physiol. 2023, 14, 1115164. [Google Scholar] [CrossRef] [PubMed]
  44. Khan, A.A.; Junejo, R.T.; Thomas, G.N.; Fisher, J.P.; Lip, G.Y.H. Heart rate variability in patients with atrial fibrillation and hypertension. Eur. J. Clin. Investig. 2021, 51, e13361. [Google Scholar] [CrossRef] [PubMed]
  45. Saleem, S.; Khandoker, A.H.; Alkhodari, M.; Hadjileontiadis, L.J.; Jelinek, H.F. Investigating the effects of beta-blockers on circadian heart rhythm using heart rate variability in ischemic heart disease with preserved ejection fraction. Sci. Rep. 2023, 13, 5828. [Google Scholar] [CrossRef]
  46. Lo, J.W.; Crawford, J.D.; Desmond, D.W.; Bae, H.-J.; Lim, J.-S.; Godefroy, O.; Roussel, M.; Kang, Y.; Jahng, S.; Köhler, S.; et al. Long-Term Cognitive Decline After Stroke: An Individual Participant Data Meta-Analysis. Stroke 2022, 53, 1318–1327. [Google Scholar] [CrossRef]
  47. Eguchi, K.; Schwartz, J.E.; Pickering, T.G.; Hoshide, S.; Ishikawa, J.; Shimada, K.; Kario, K. Increased heart rate variability during sleep is a predictor for future cardiovascular events in patients with type 2 diabetes. Hypertens. Res. 2010, 33, 737–742. [Google Scholar] [CrossRef]
  48. Malik, J.; Soliman, E.Z.; Wu, H.T. An adaptive QRS detection algorithm for ultra-long-term ECG recordings. J. Electrocardiol. 2020, 60, 165–171. [Google Scholar] [CrossRef] [PubMed]
  49. Johnson, A.E.W.; Behar, J.; Andreotti, F.; Clifford, G.D.; Oster, J. Multimodal heart beat detection using signal quality indices. Physiol. Meas. 2015, 36, 1665–1677. [Google Scholar] [CrossRef] [PubMed]
  50. Su, L.; Wu, H.T. Extract Fetal ECG from Single-Lead Abdominal ECG by De-Shape Short Time Fourier Transform and Nonlocal Median. Front. Appl. Math. Stat. 2017, 3. [Google Scholar] [CrossRef]
  51. Xu, X.; Schuckers, S.; CHIME Study Group. Collaborative Home Infant Monitoring Evaluation. Automatic detection of artifacts in heart period data. J. Electrocardiol. 2001, 34, 205–210. [Google Scholar] [CrossRef]
  52. Petrėnas, A.; Marozas, V.; Sörnmo, L. Low-complexity detection of atrial fibrillation in continuous long-term monitoring. Comput. Biol. Med. 2015, 65, 184–191. [Google Scholar] [CrossRef]
  53. The Task Force of the European Society of Cardiology, The North American Society of Pacing. Heart rate variability: Standards of measurement, physiological interpretation and clinical use. Task Force of the European Society of Cardiology and the North American Society of Pacing and Electrophysiology. Circulation 1996, 93, 1043–1065. [Google Scholar] [CrossRef]
Figure 1. Flowchart of sample selection. Note: PA = physical activity, AF = atrial fibrillation, BMI = body mass index.
Sensors 24 04060 g001
Figure 2. Diurnal patterns of MAD by dementia, mild cognitive impairment, or cognitively unimpaired status.
Sensors 24 04060 g002
Table 1. Sample characteristics overall and by tertiles (low, medium, high) of LTMAD.
Overall
(N = 1590)
Low LTMAD
(N = 530)
Medium LTMAD
(N = 530)
High LTMAD
(N = 530)
Age (years), mean (SD)78.8 (4.5)80.5 (5.0)78.8 (4.3)77.1 (3.4)
Female, %58655948
Black, %32422926
Education, %
Grade school3523
Some high school7967
High school graduate28302726
Vocational school1091110
At least some college34303833
Grad/prof school18171622
BMI (kg/m2), mean (SD)28.4 (5.4)29.9 (6.2)28.5 (5.2)26.8 (4.0)
Alcohol use, %
Current52425360
Former28312923
Ever20271816
Smoking, %
Current8986
Former50455252
Never43464142
BP (mm Hg), mean (SD)
Systolic134.6 (18.7)135.5 (19.6)135.4 (18.6)133.0 (17.9)
Diastolic67.7 (10.4)67.2 (10.3)67.7 (10.7)68.3 (10.3)
Diabetes, %30383023
Heart Failure, %61252
Cardiac medications, %50595042
CES-D, mean (SD)2.5 (2.8)3.2 (3.1)2.5 (2.8)2.0 (2.2)
TMAD, mean (SD)16.6 (4.7)12.0 (1.7)16.0 (1.2)21.9 (3.6)
SDNN (ms), mean (SD)125.3 (39.9)119.0 (42.3)123.3 (37.2)133.7 (38.5)
rMSSD (ms), mean (SD)47.2 (46.9)52.1 (52.4)43.8 (38.7)45.6 (48.2)
Cognitive status, %
Unimpaired79728084
MCI17221714
Dementia4632
LTMAD = natural log of total mean amplitude deviation; SDNN = standard deviation of normal-to-normal RR intervals; rMSSD = root mean squared successive deviation of normal-to-normal RR intervals; BMI = body mass index; BP = blood pressure; CES-D = Center for Epidemiologic Studies Depression Scale; MCI = mild cognitive impairment.
Table 2. Sample characteristics overall and by tertiles (low, medium, high) of log SDNN.
Overall
(N = 1590)
Low SDNN
(N = 530)
Medium SDNN (N = 530)High SDNN
(N = 530)
Age (years), mean (SD)78.8 (4.5)78.8 (4.5)78.7 (4.4)78.8 (4.4)
Female, %58696044
Black, %32363426
Education, %
Grade school3343
Some high school7886
High school graduate28292726
Vocational school1011109
At least some college34323435
Grad/prof school18161721
BMI (kg/m2), mean (SD)28.4 (5.4)29.2 (6.0)28.2 (5.1)27.8 (4.8)
Alcohol use, %
Current52495056
Former28283125
Ever20231919
Smoking, %
Current81067
Former50485149
Never43434343
BP (mm Hg), mean (SD)
Systolic134.6 (18.7)135.1 (19.4)135.2 (18.5)133.7 (18.3)
Diastolic67.7 (10.4)68.8 (10.9)67.3 (9.9)67.0 (10.4)
Diabetes, %30373024
Heart Failure, %6954
Cardiac medications, %50594944
CES-D, mean (SD)2.5 (2.8)2.8 (3.0)2.4 (2.7)2.4 (2.6)
TMAD, mean (SD)16.6 (4.7)15.1 (3.9)16.9 (4.5)17.9 (5.3)
SDNN (ms), mean (SD)125.3 (39.9)89.0 (15.9)119.8 (9.9)167.1 (36.3)
rMSSD (ms), mean (SD)47.2 (46.9)32.2 (21.3)41.6 (28.0)67.8 (68.5)
Cognitive status, %
Unimpaired79797979
MCI17181718
Dementia4444
TMAD = total mean amplitude deviation; SDNN = standard deviation of normal-to-normal RR intervals; rMSSD = root mean squared successive deviation of normal-to-normal RR intervals; BMI = body mass index; BP = blood pressure; CES-D = Center for Epidemiologic Studies Depression Scale; MCI = mild cognitive impairment.
Table 3. Cross-sectional differences in cognitive test scores by LTMAD, log SDNN, or log rMSSD over 24 h.
Global Cognition
β (95% CI)
Executive Function
β (95% CI)
Memory
β (95% CI)
Language
β (95% CI)
LTMAD0.30
(0.16, 0.44)
0.38
(0.22, 0.53)
0.14
(−0.04, 0.32)
0.15
(−0.02, 0.32)
Log SDNN0.03
(−0.24, 0.30)
0.19
(−0.10, 0.48)
−0.21
(−0.56, 0.13)
−0.15
(−0.47, 0.17)
Log rMSSD−0.12
(−0.2, 0.010)
−0.08
(−0.2, 0.06)
−0.16
(−0.3, 0.004)
−0.11
(−0.26, 0.05)
Linear regression model adjusted for: age, sex, race/center, education, smoking, drinking, systolic and diastolic blood pressure, body mass index, diabetes, heart failure, depressive symptoms, and cardiac medications; N = 1590.
Table 4. Cross-sectional odds ratio of MCI or dementia compared to unimpaired cognition by 1-unit increment in LTMAD, log SDNN, or log rMSSD over 24 h.
Unimpaired (N = 1250)Mild Cognitive Impairment (N = 280)
OR (95% CI)
Dementia (N = 60)
OR (95% CI)
LTMADREF0.38 (0.22, 0.67) a0.25 (0.08, 0.74)
Log SDNN REF0.84 (0.30, 2.36)3.39 (0.40, 28.37)
Log rMSSDREF1.40 (0.87, 2.27)1.24 (0.46, 3.35)
Multinomial logistic regression model adjusted for: age, sex, race/center, education, smoking, drinking, systolic and diastolic blood pressure, body mass index, diabetes, heart failure, depressive symptoms, and cardiac medications; N = 1590. a. 1-unit increase in LTMAD (i.e., more physical activity) is associated with a 62% decrease in the odds of MCI relative to unimpaired cognition.
Disclaimer/Publisher’s Note: The statements, opinions and data contained in all publications are solely those of the individual author(s) and contributor(s) and not of MDPI and/or the editor(s). MDPI and/or the editor(s) disclaim responsibility for any injury to people or property resulting from any ideas, methods, instructions or products referred to in the content.

