
Mangrove Species Classification from Unmanned Aerial Vehicle Hyperspectral Images Using Object-Oriented Methods Based on Feature Combination and Optimization

Abstract
:1. Introduction
2. Materials and Methods
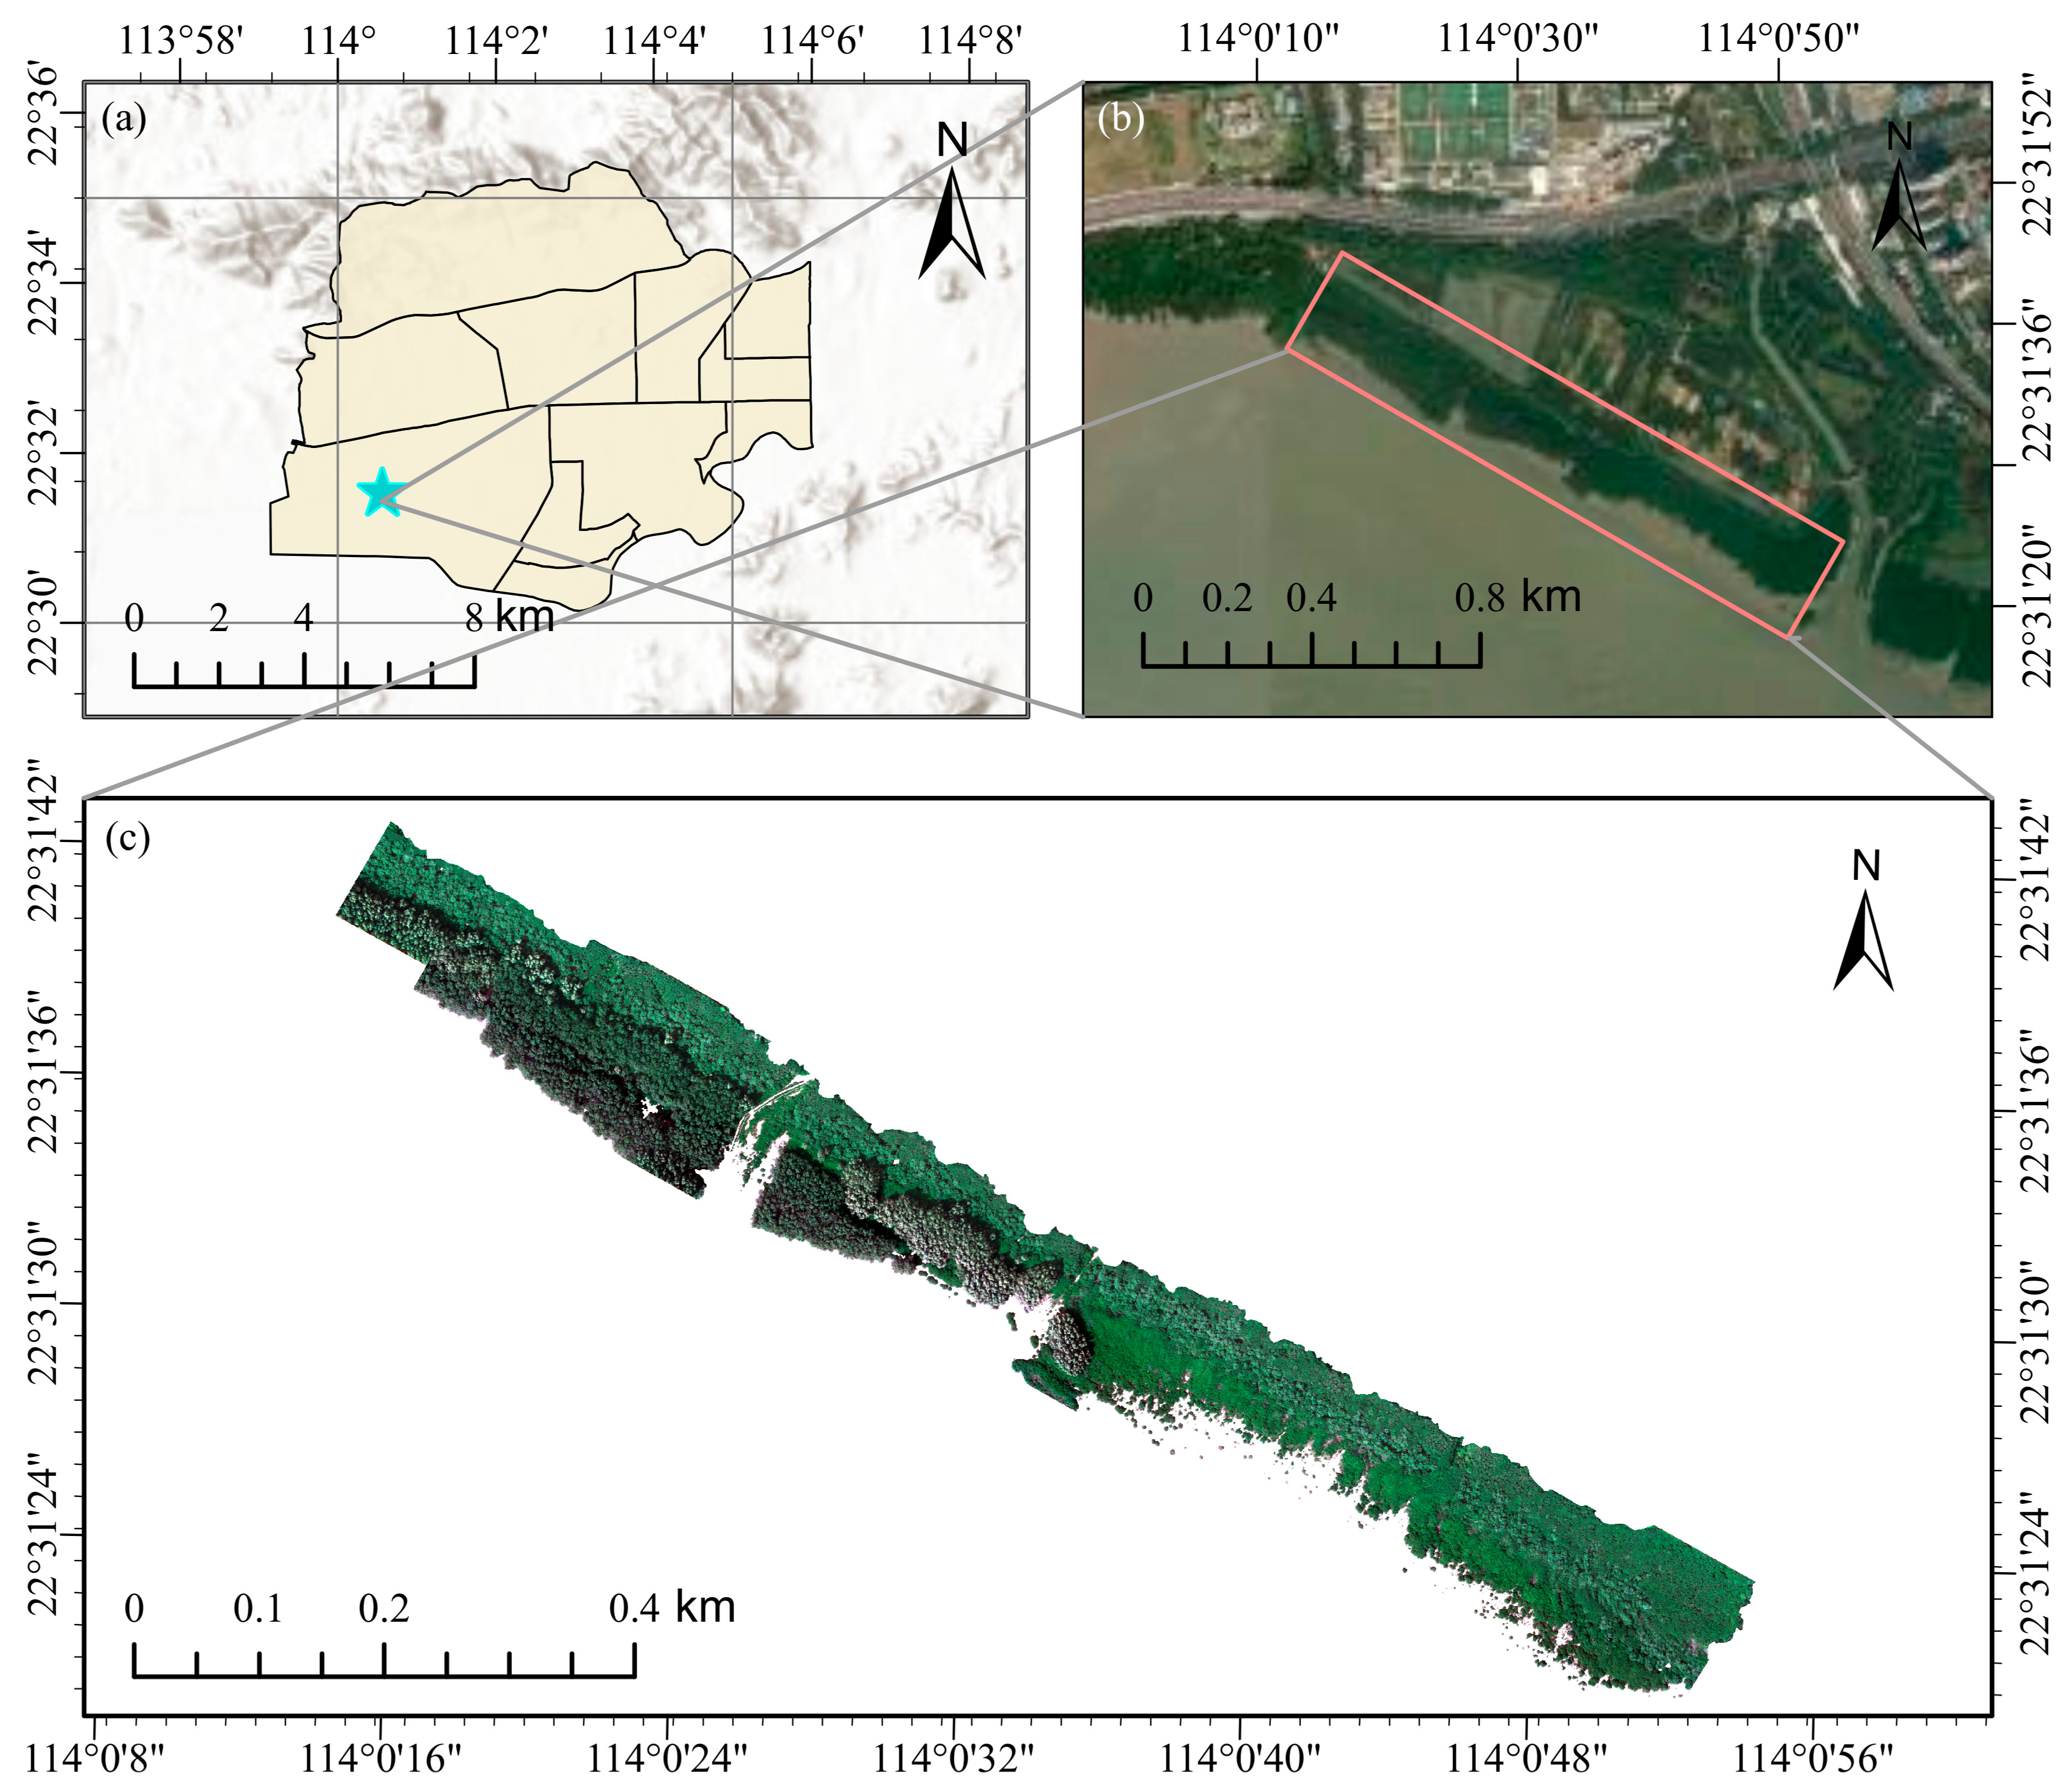
2.1. Overview of the Study Area
2.2. UAV Hyperspectral Image Data
2.3. Field Survey and Sample Collection
2.4. Spectral Transformation
2.5. Vegetation Index
2.6. Texture Features
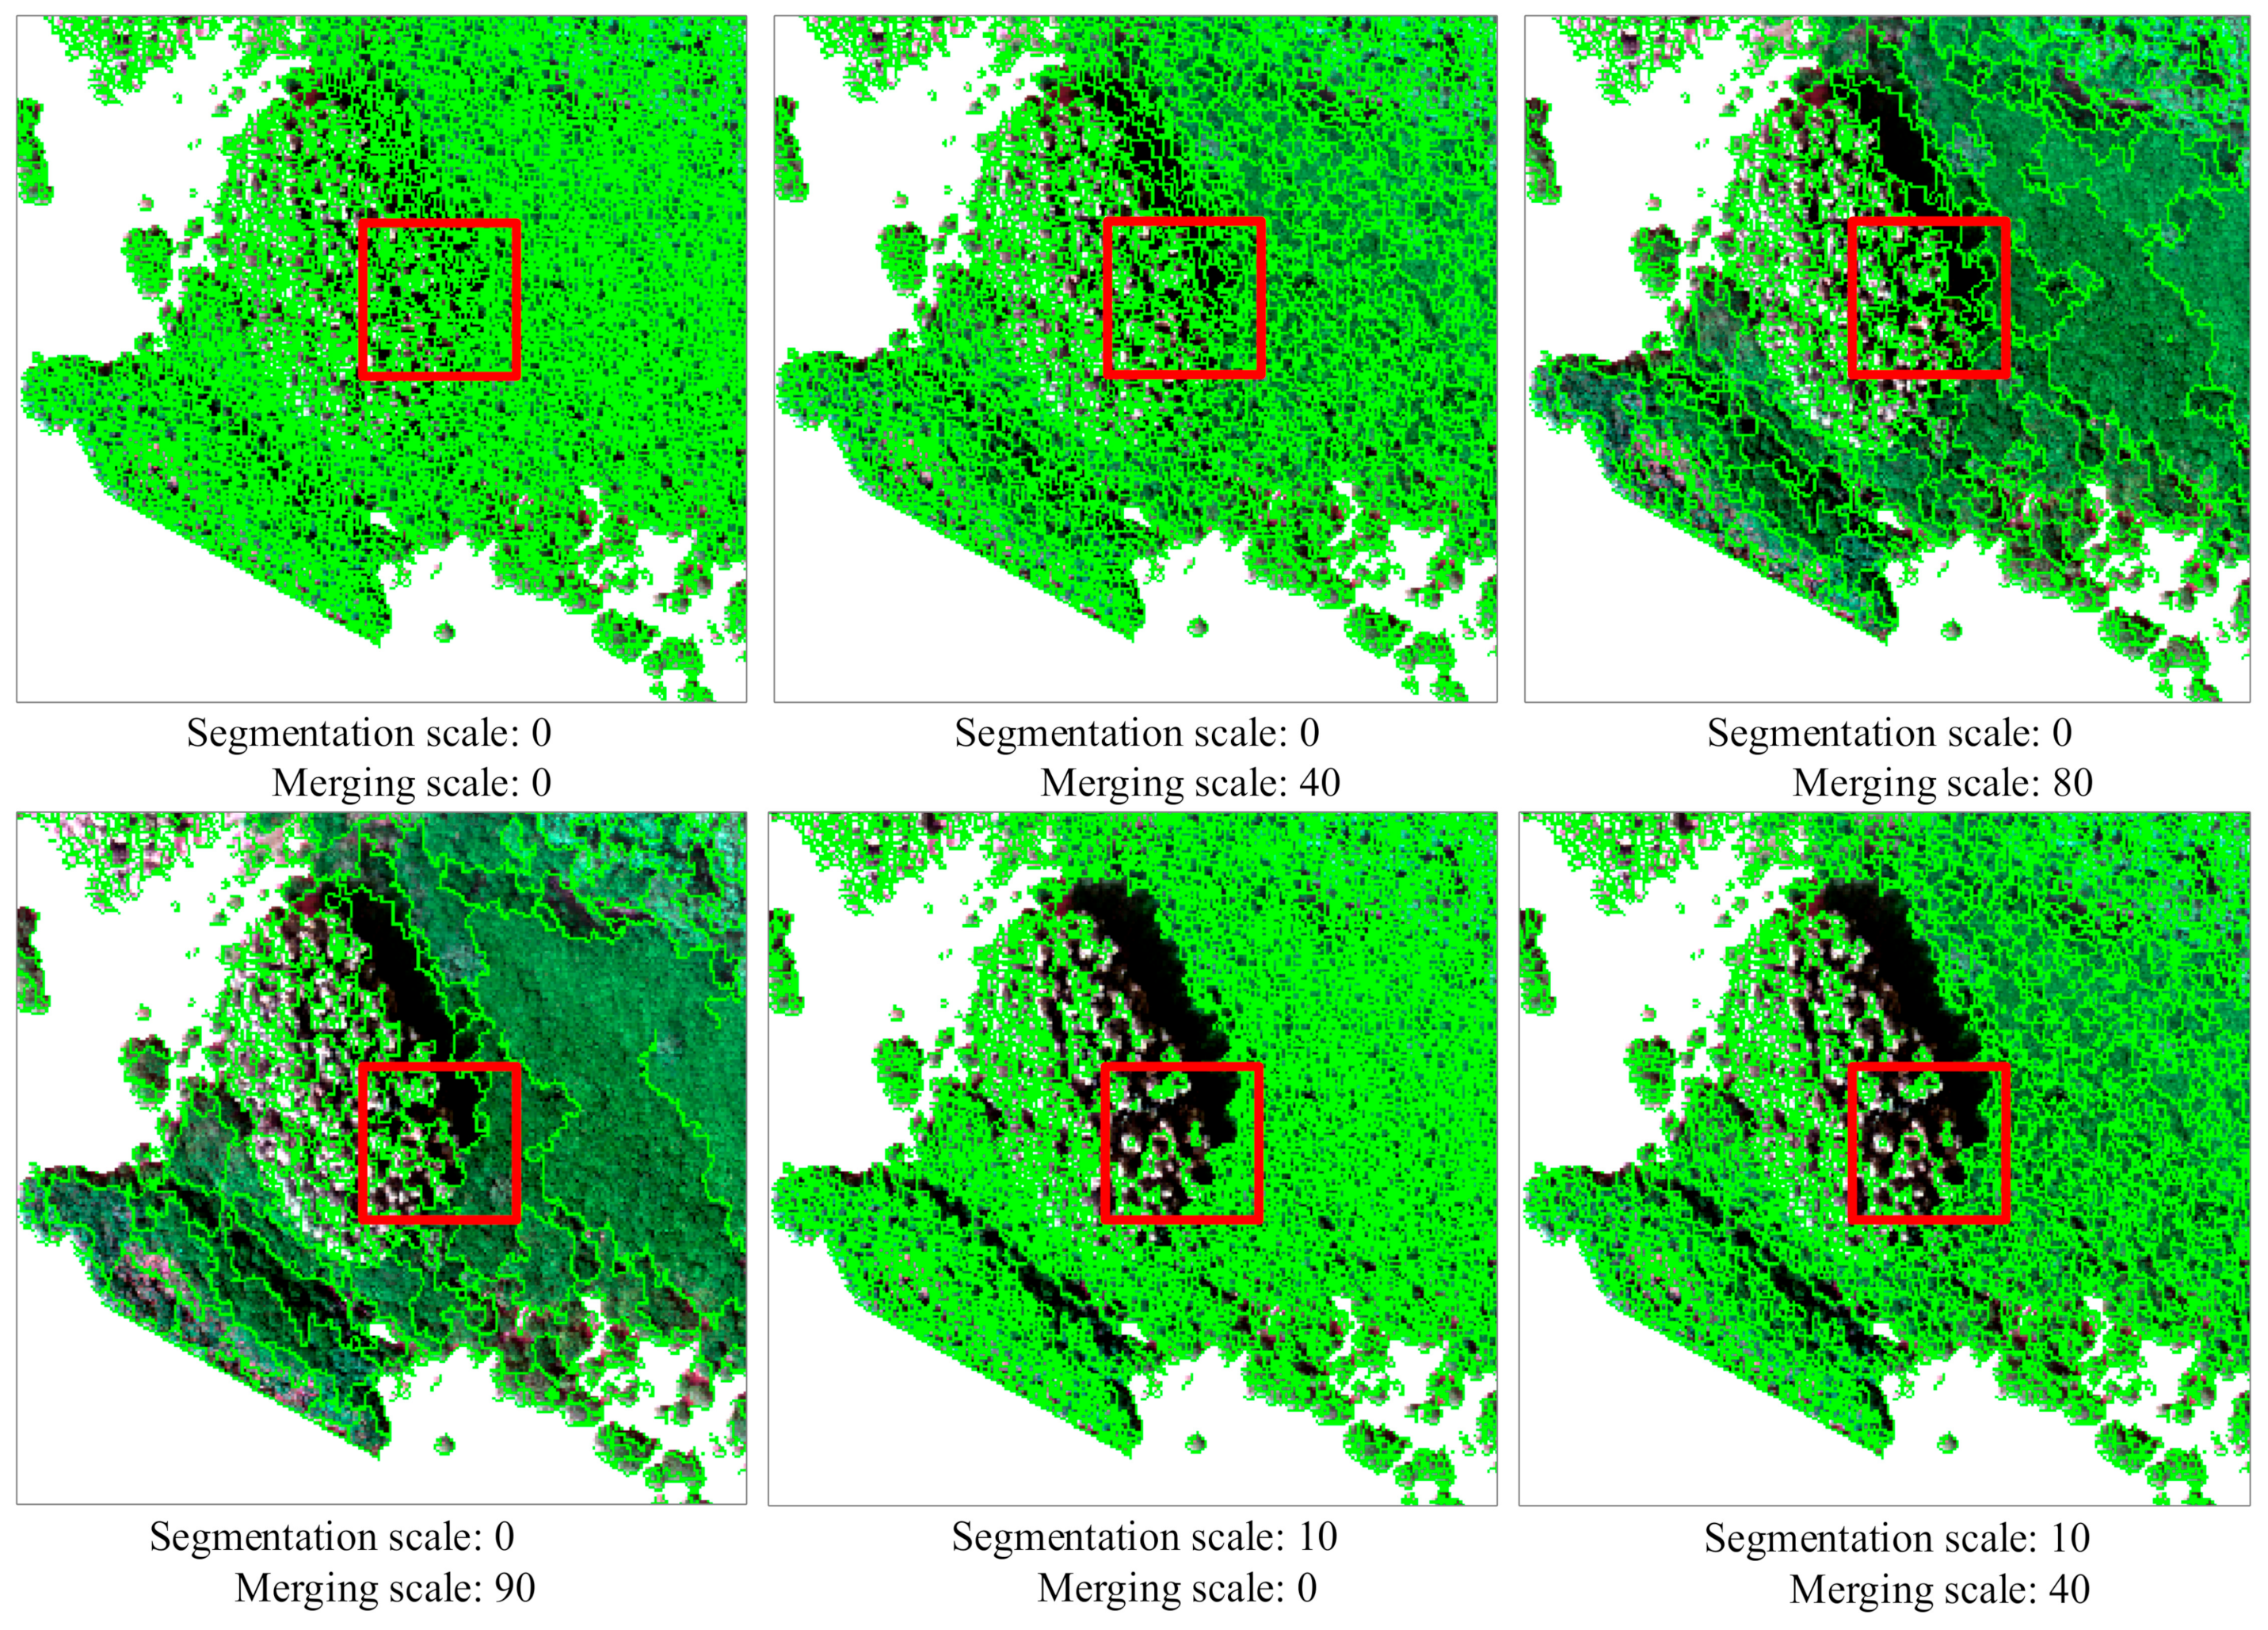
2.7. Multi-Scale Segmentation
2.8. Research Methods and Accuracy Assessment
2.8.1. Classification Methods
2.8.2. Accuracy Assessment
3. Results
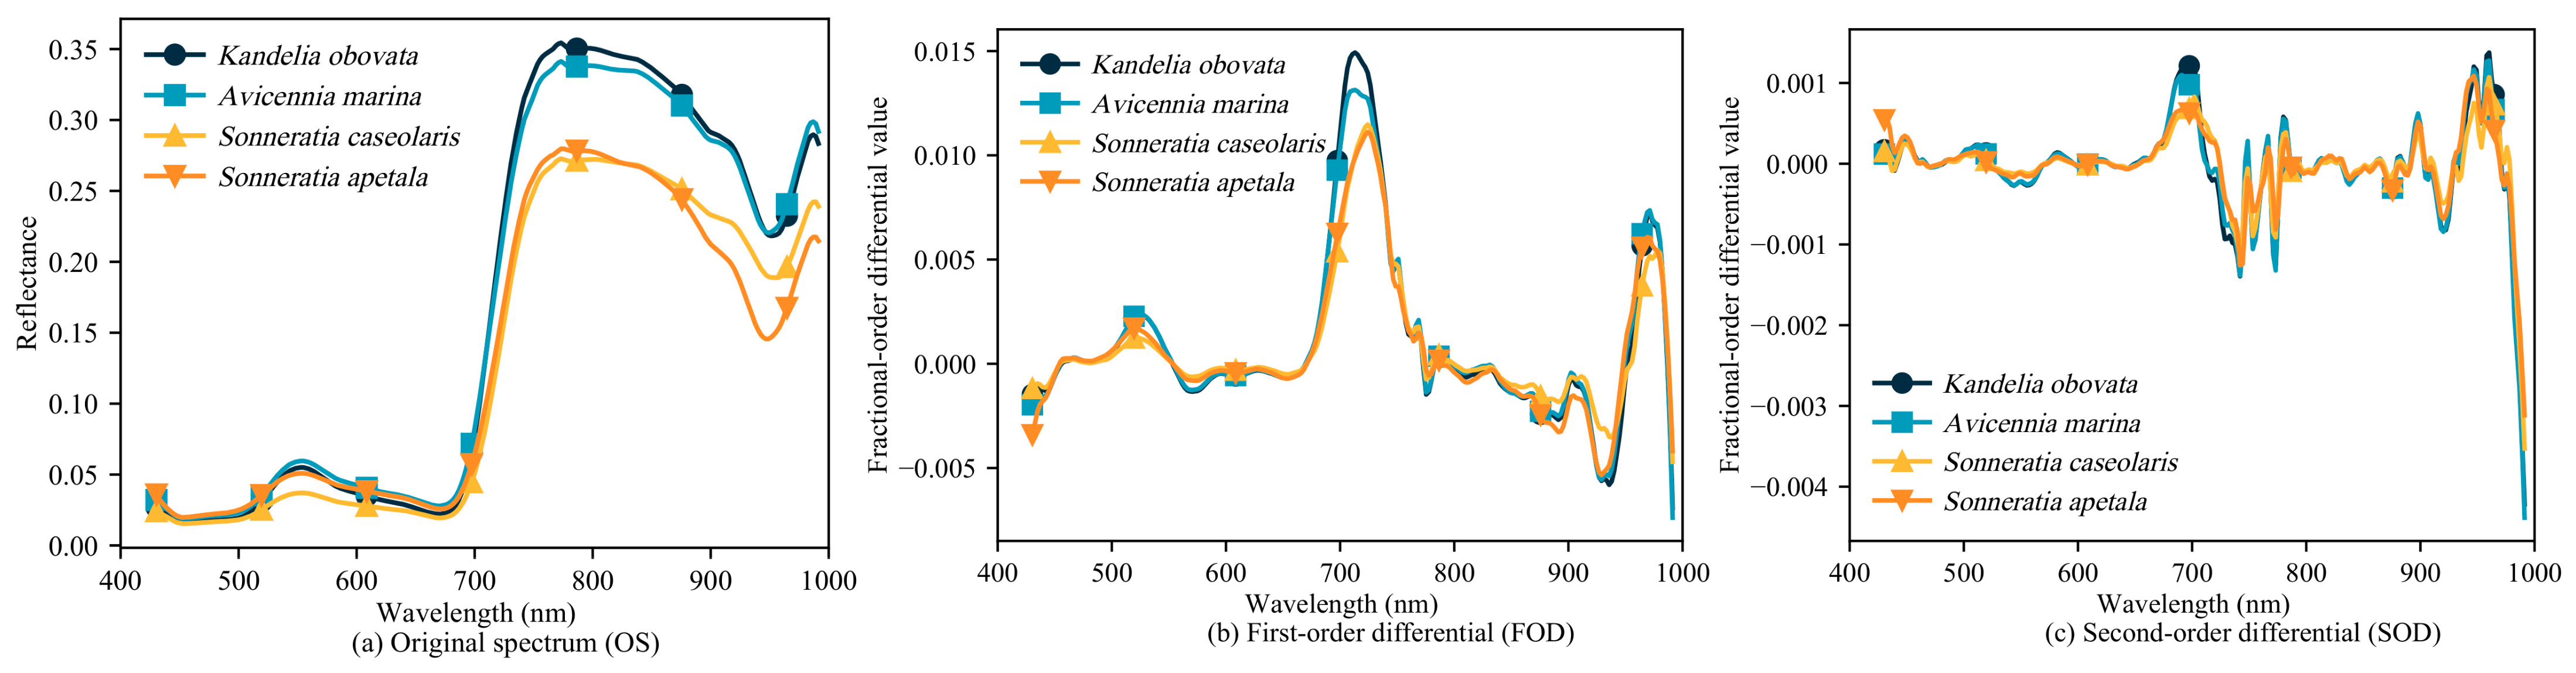
3.1. Spectral Feature Analysis
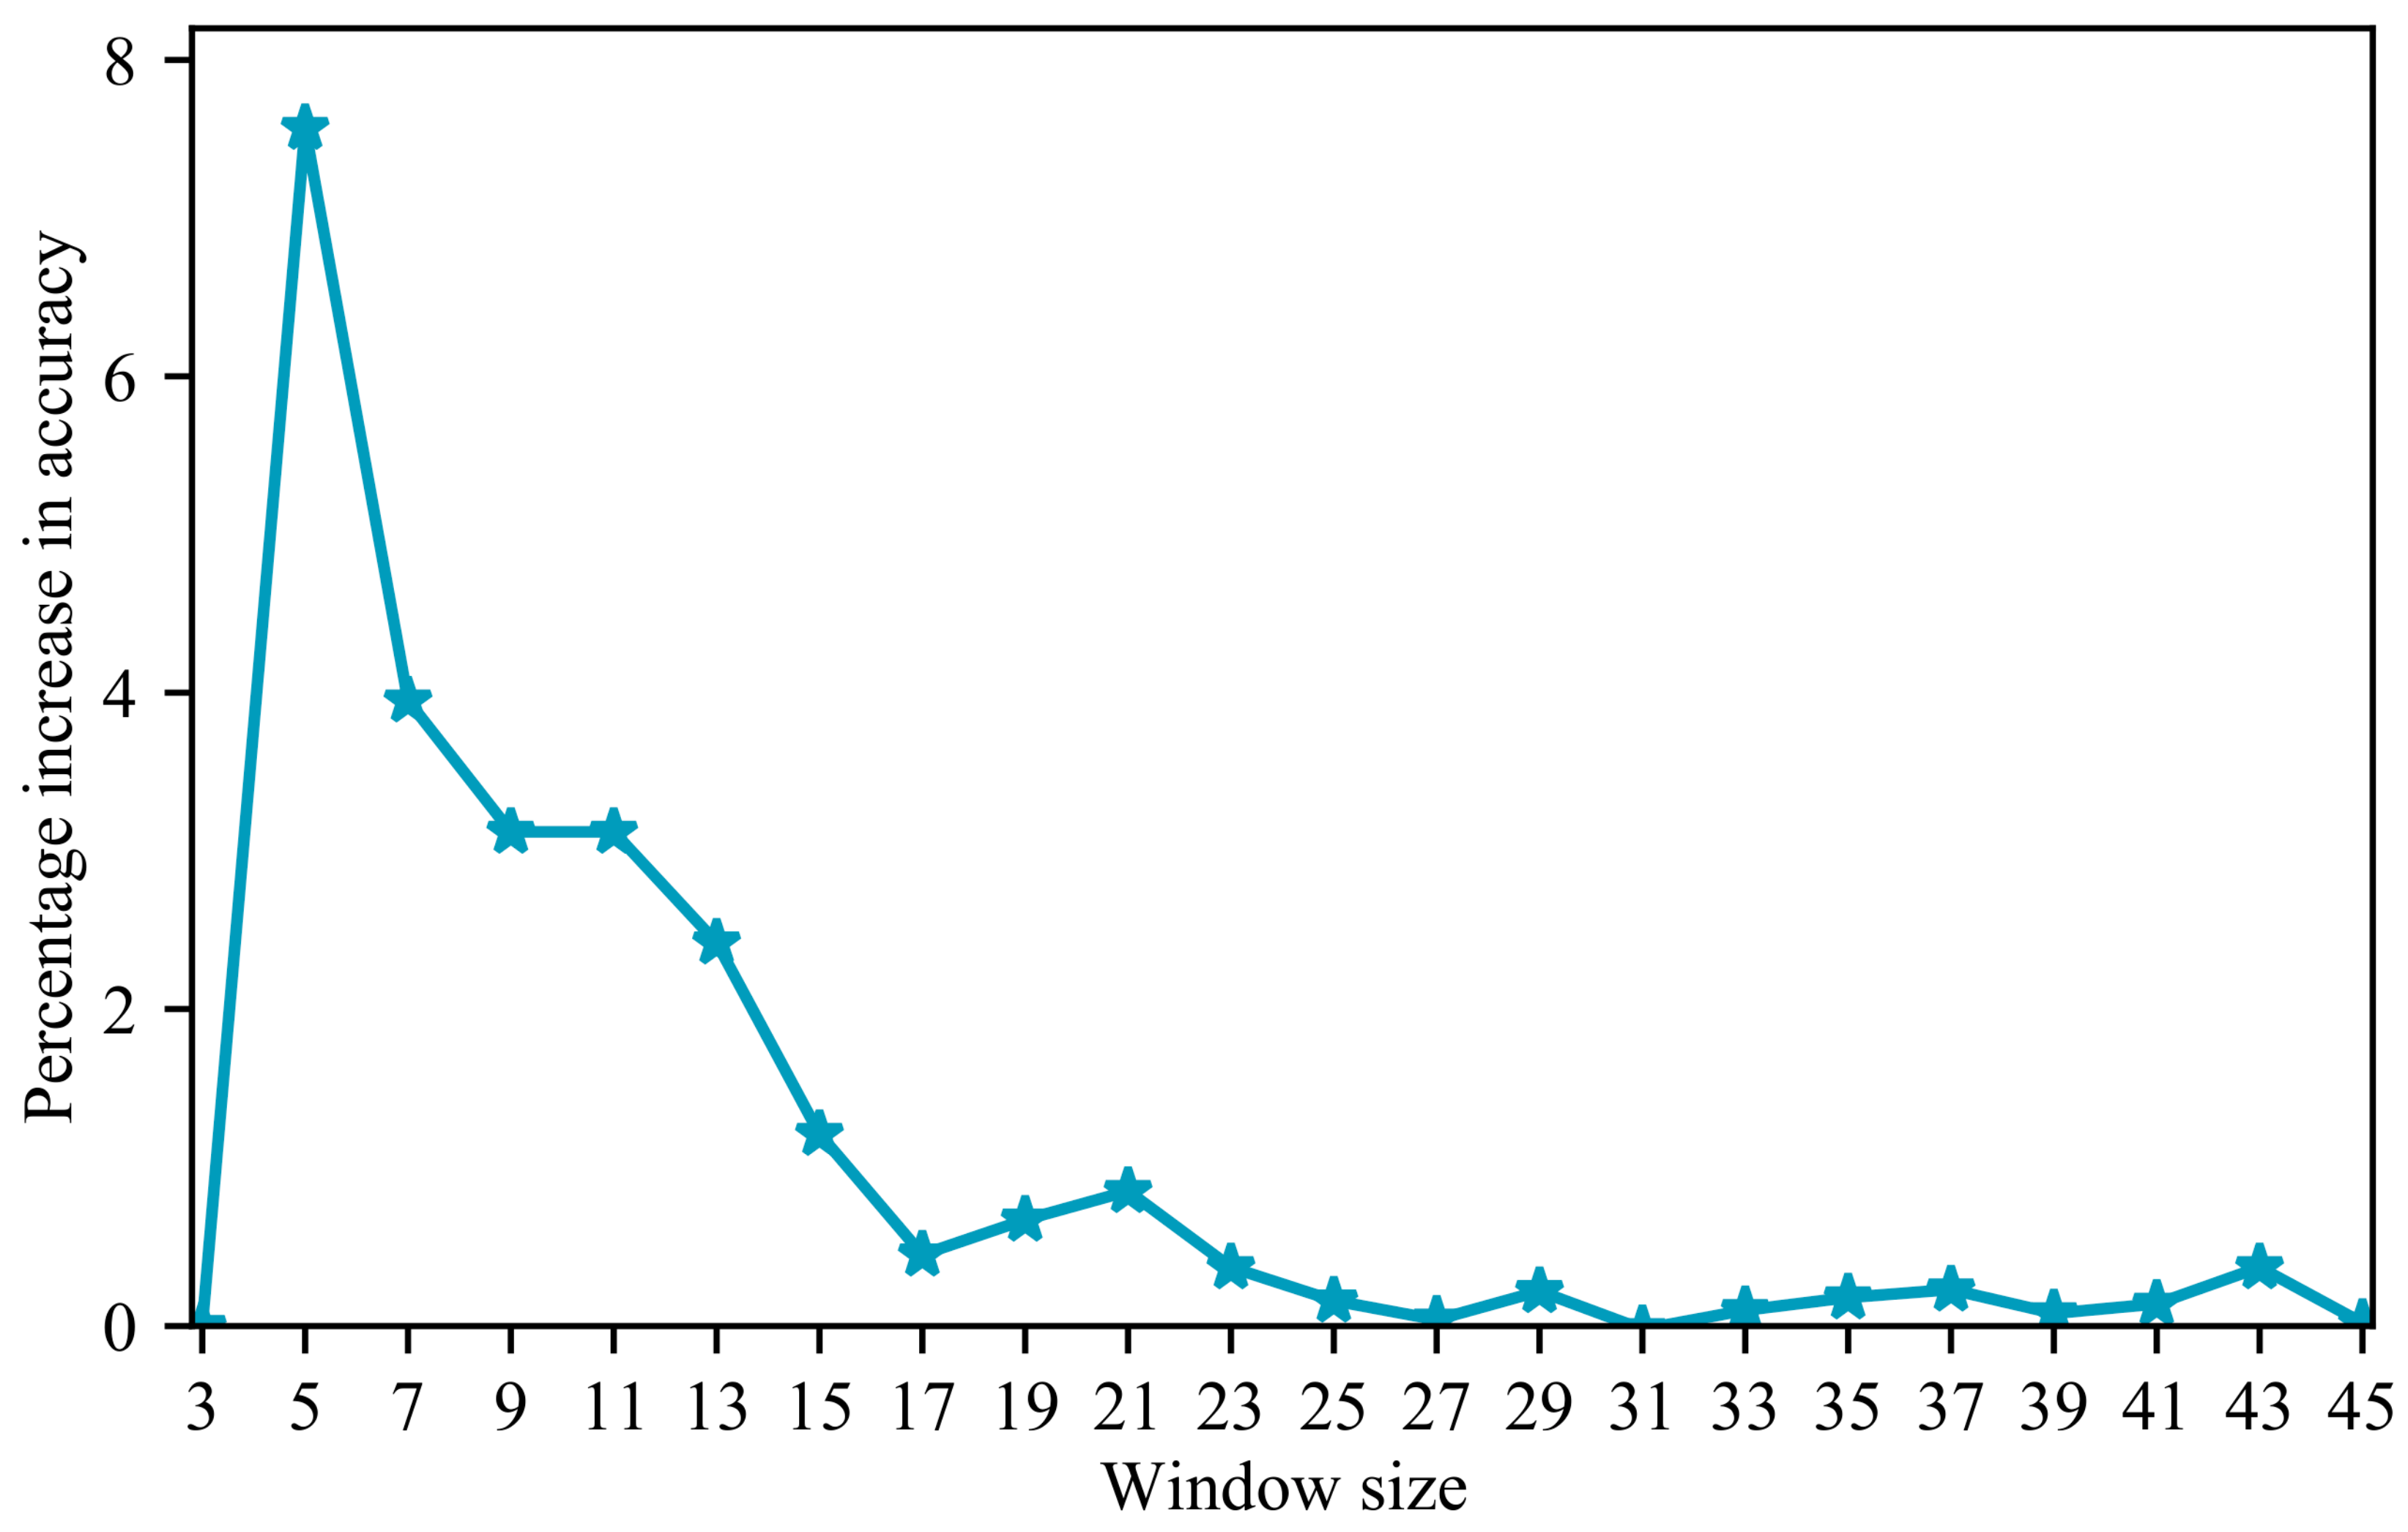
3.2. Optimal Texture Window Sizes
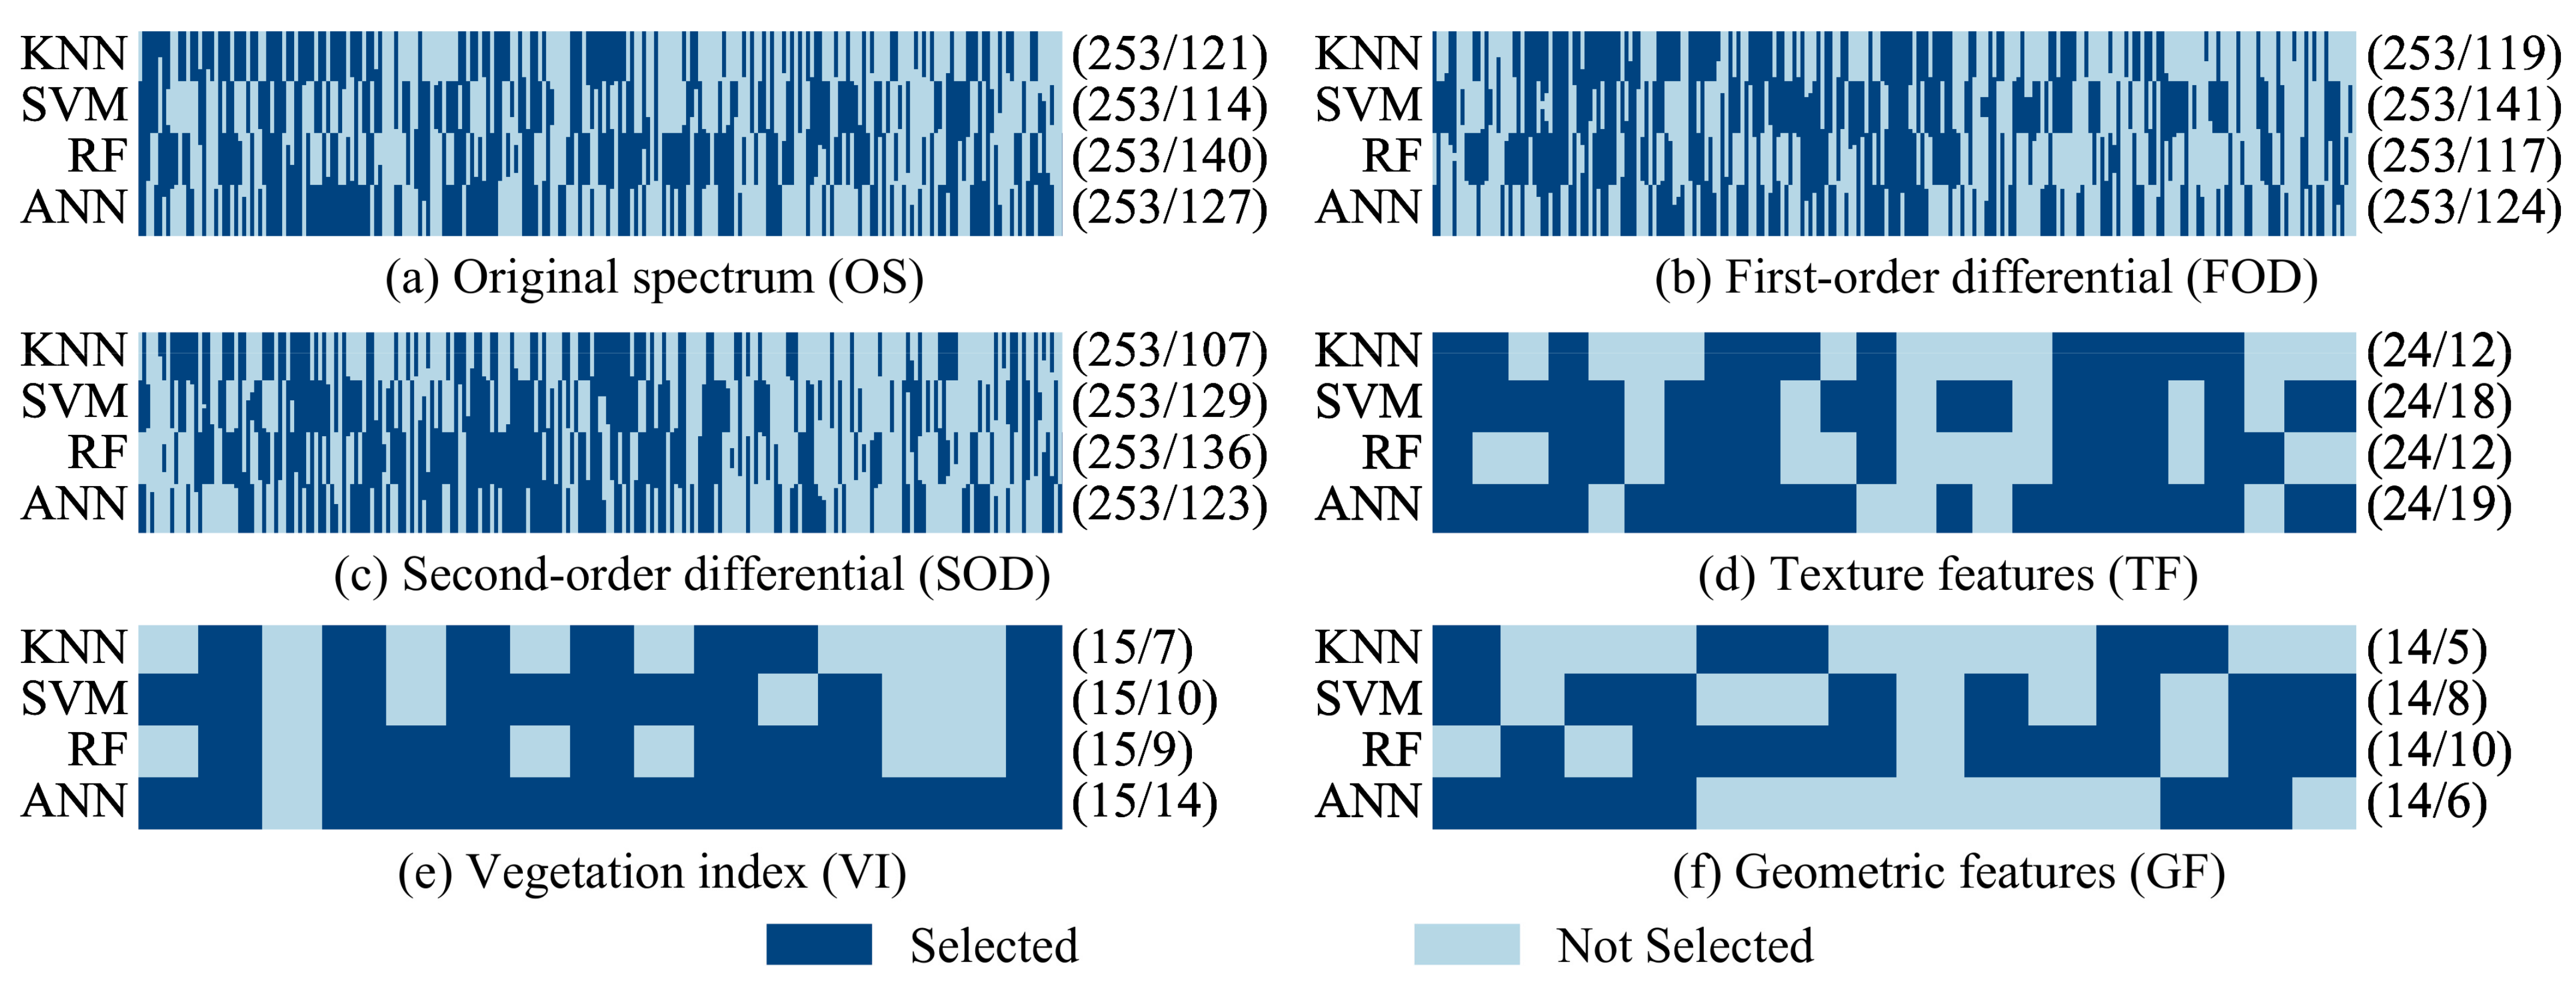
3.3. Optimal Feature Selection
3.4. Classification of Single Feature Variables
3.5. Classification of Combined Feature Variables
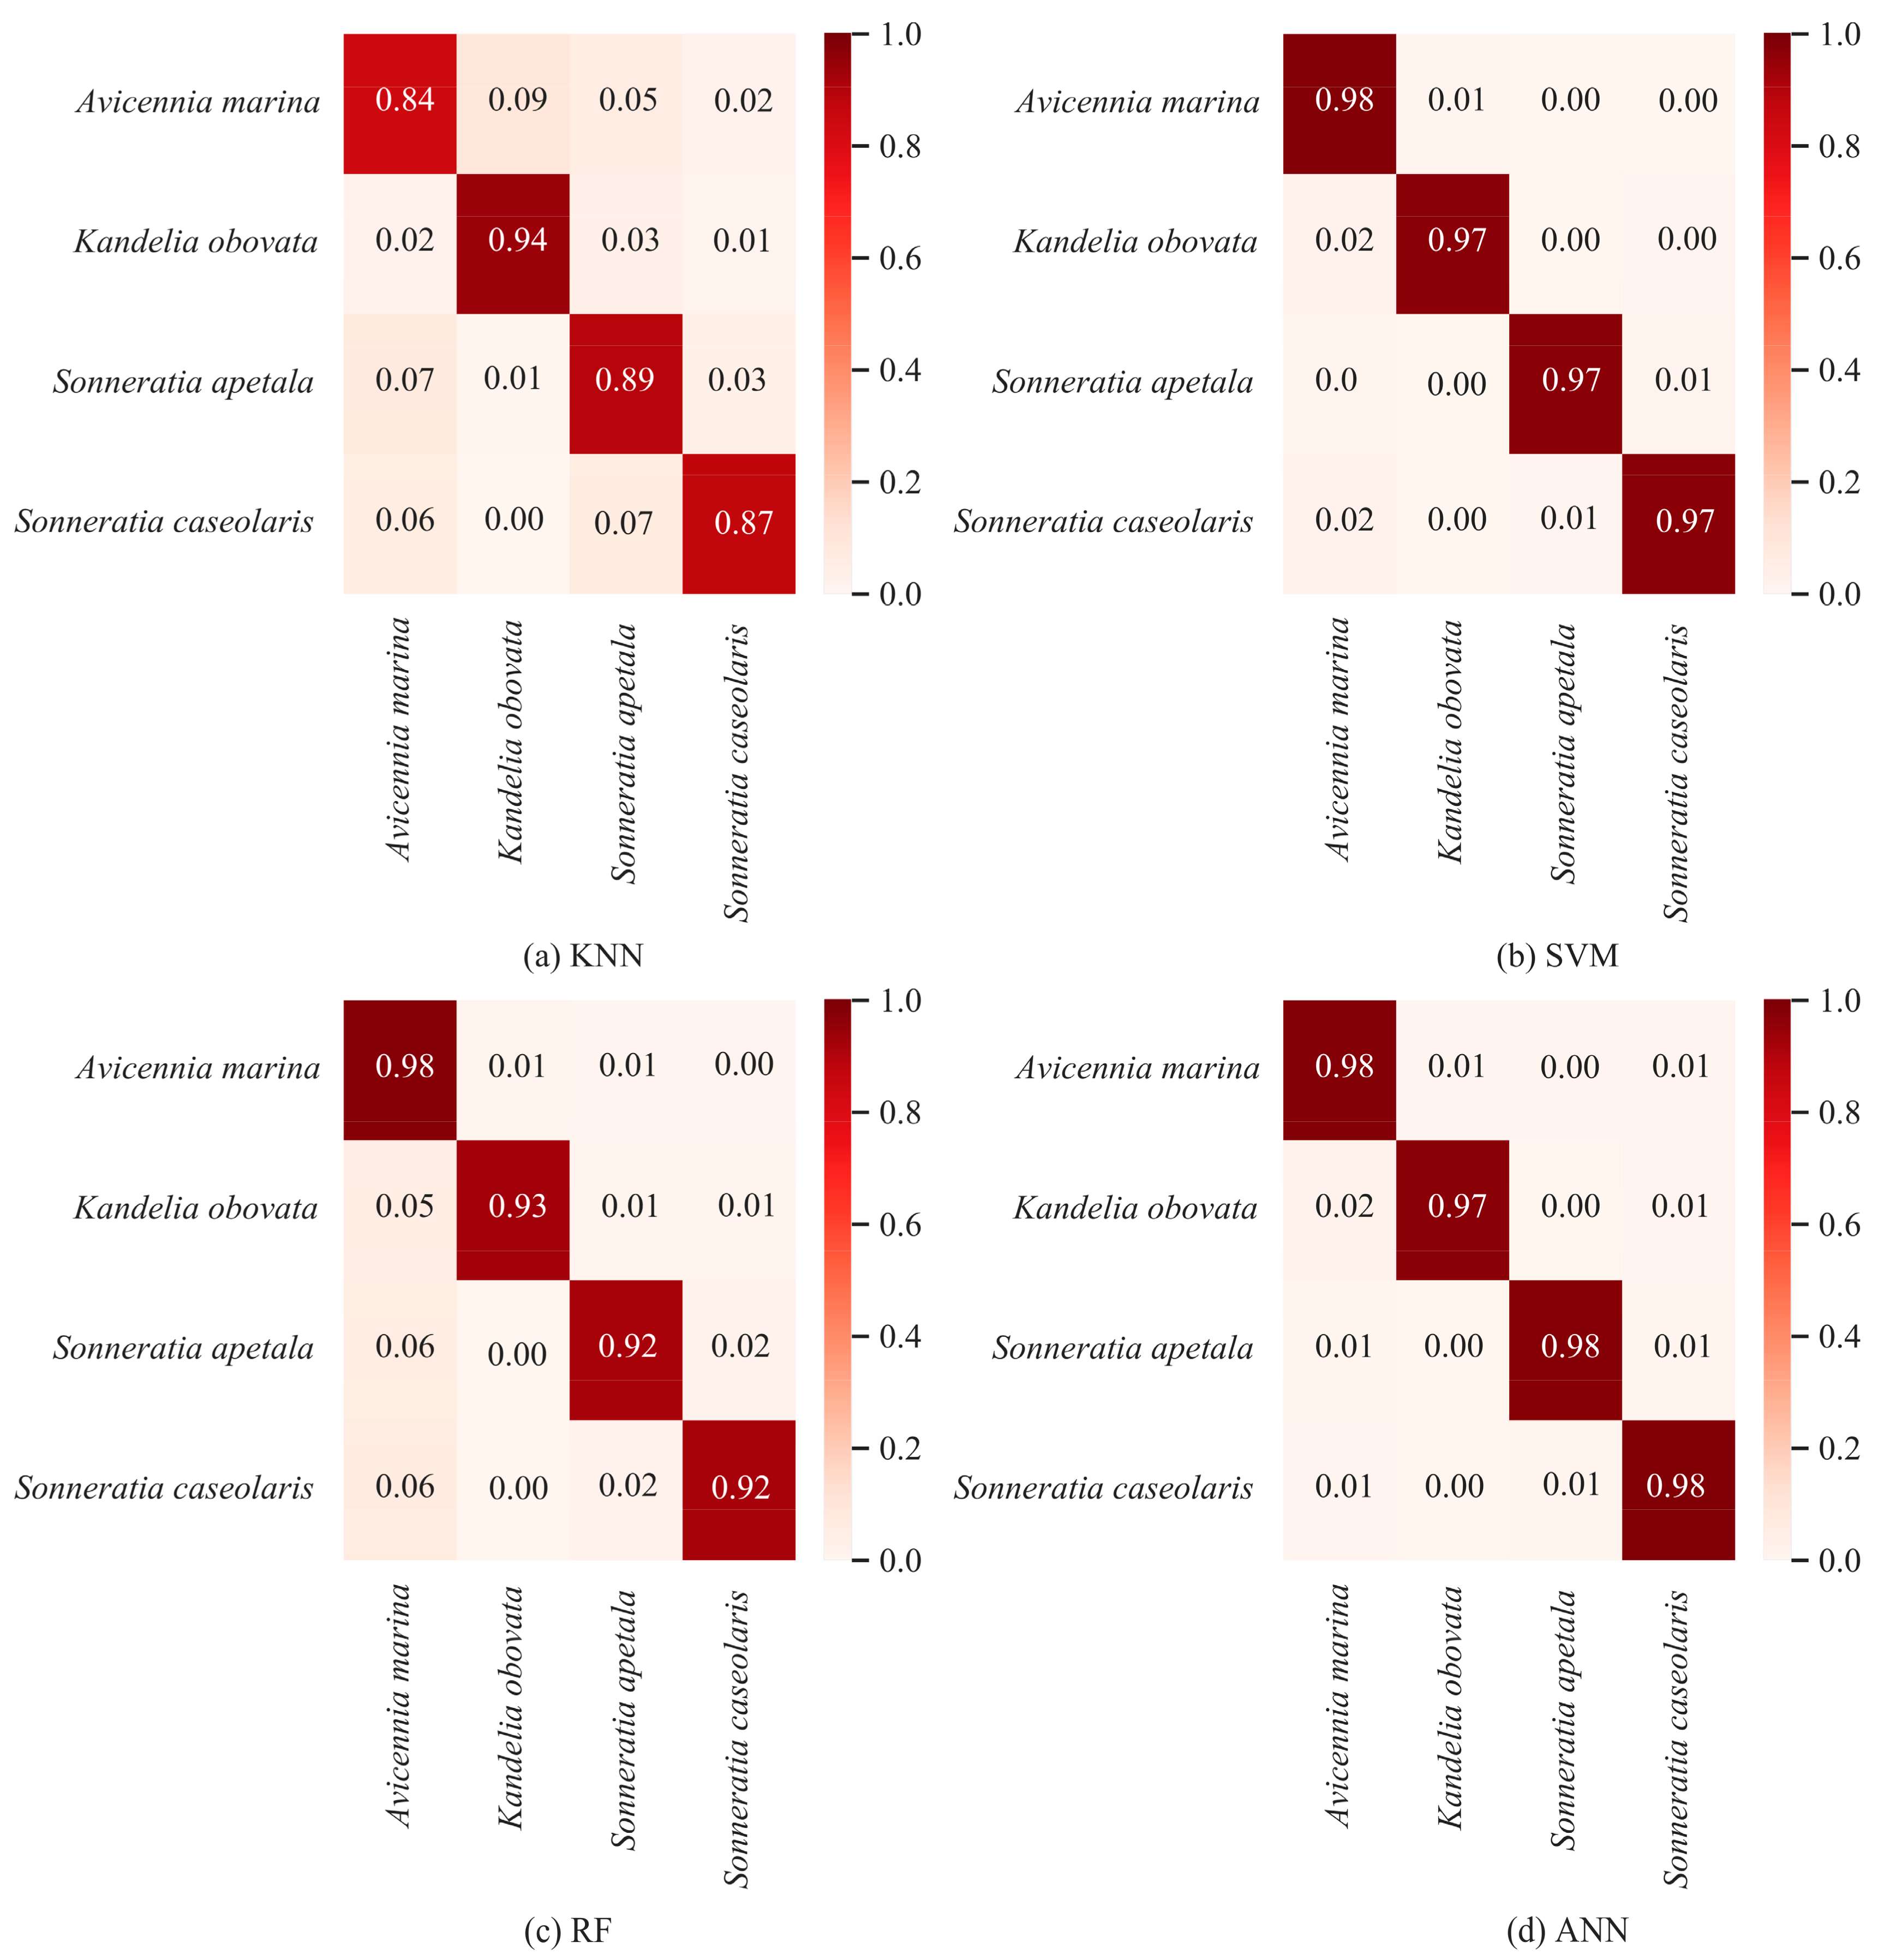
3.6. Comparison of Different Classification Methods
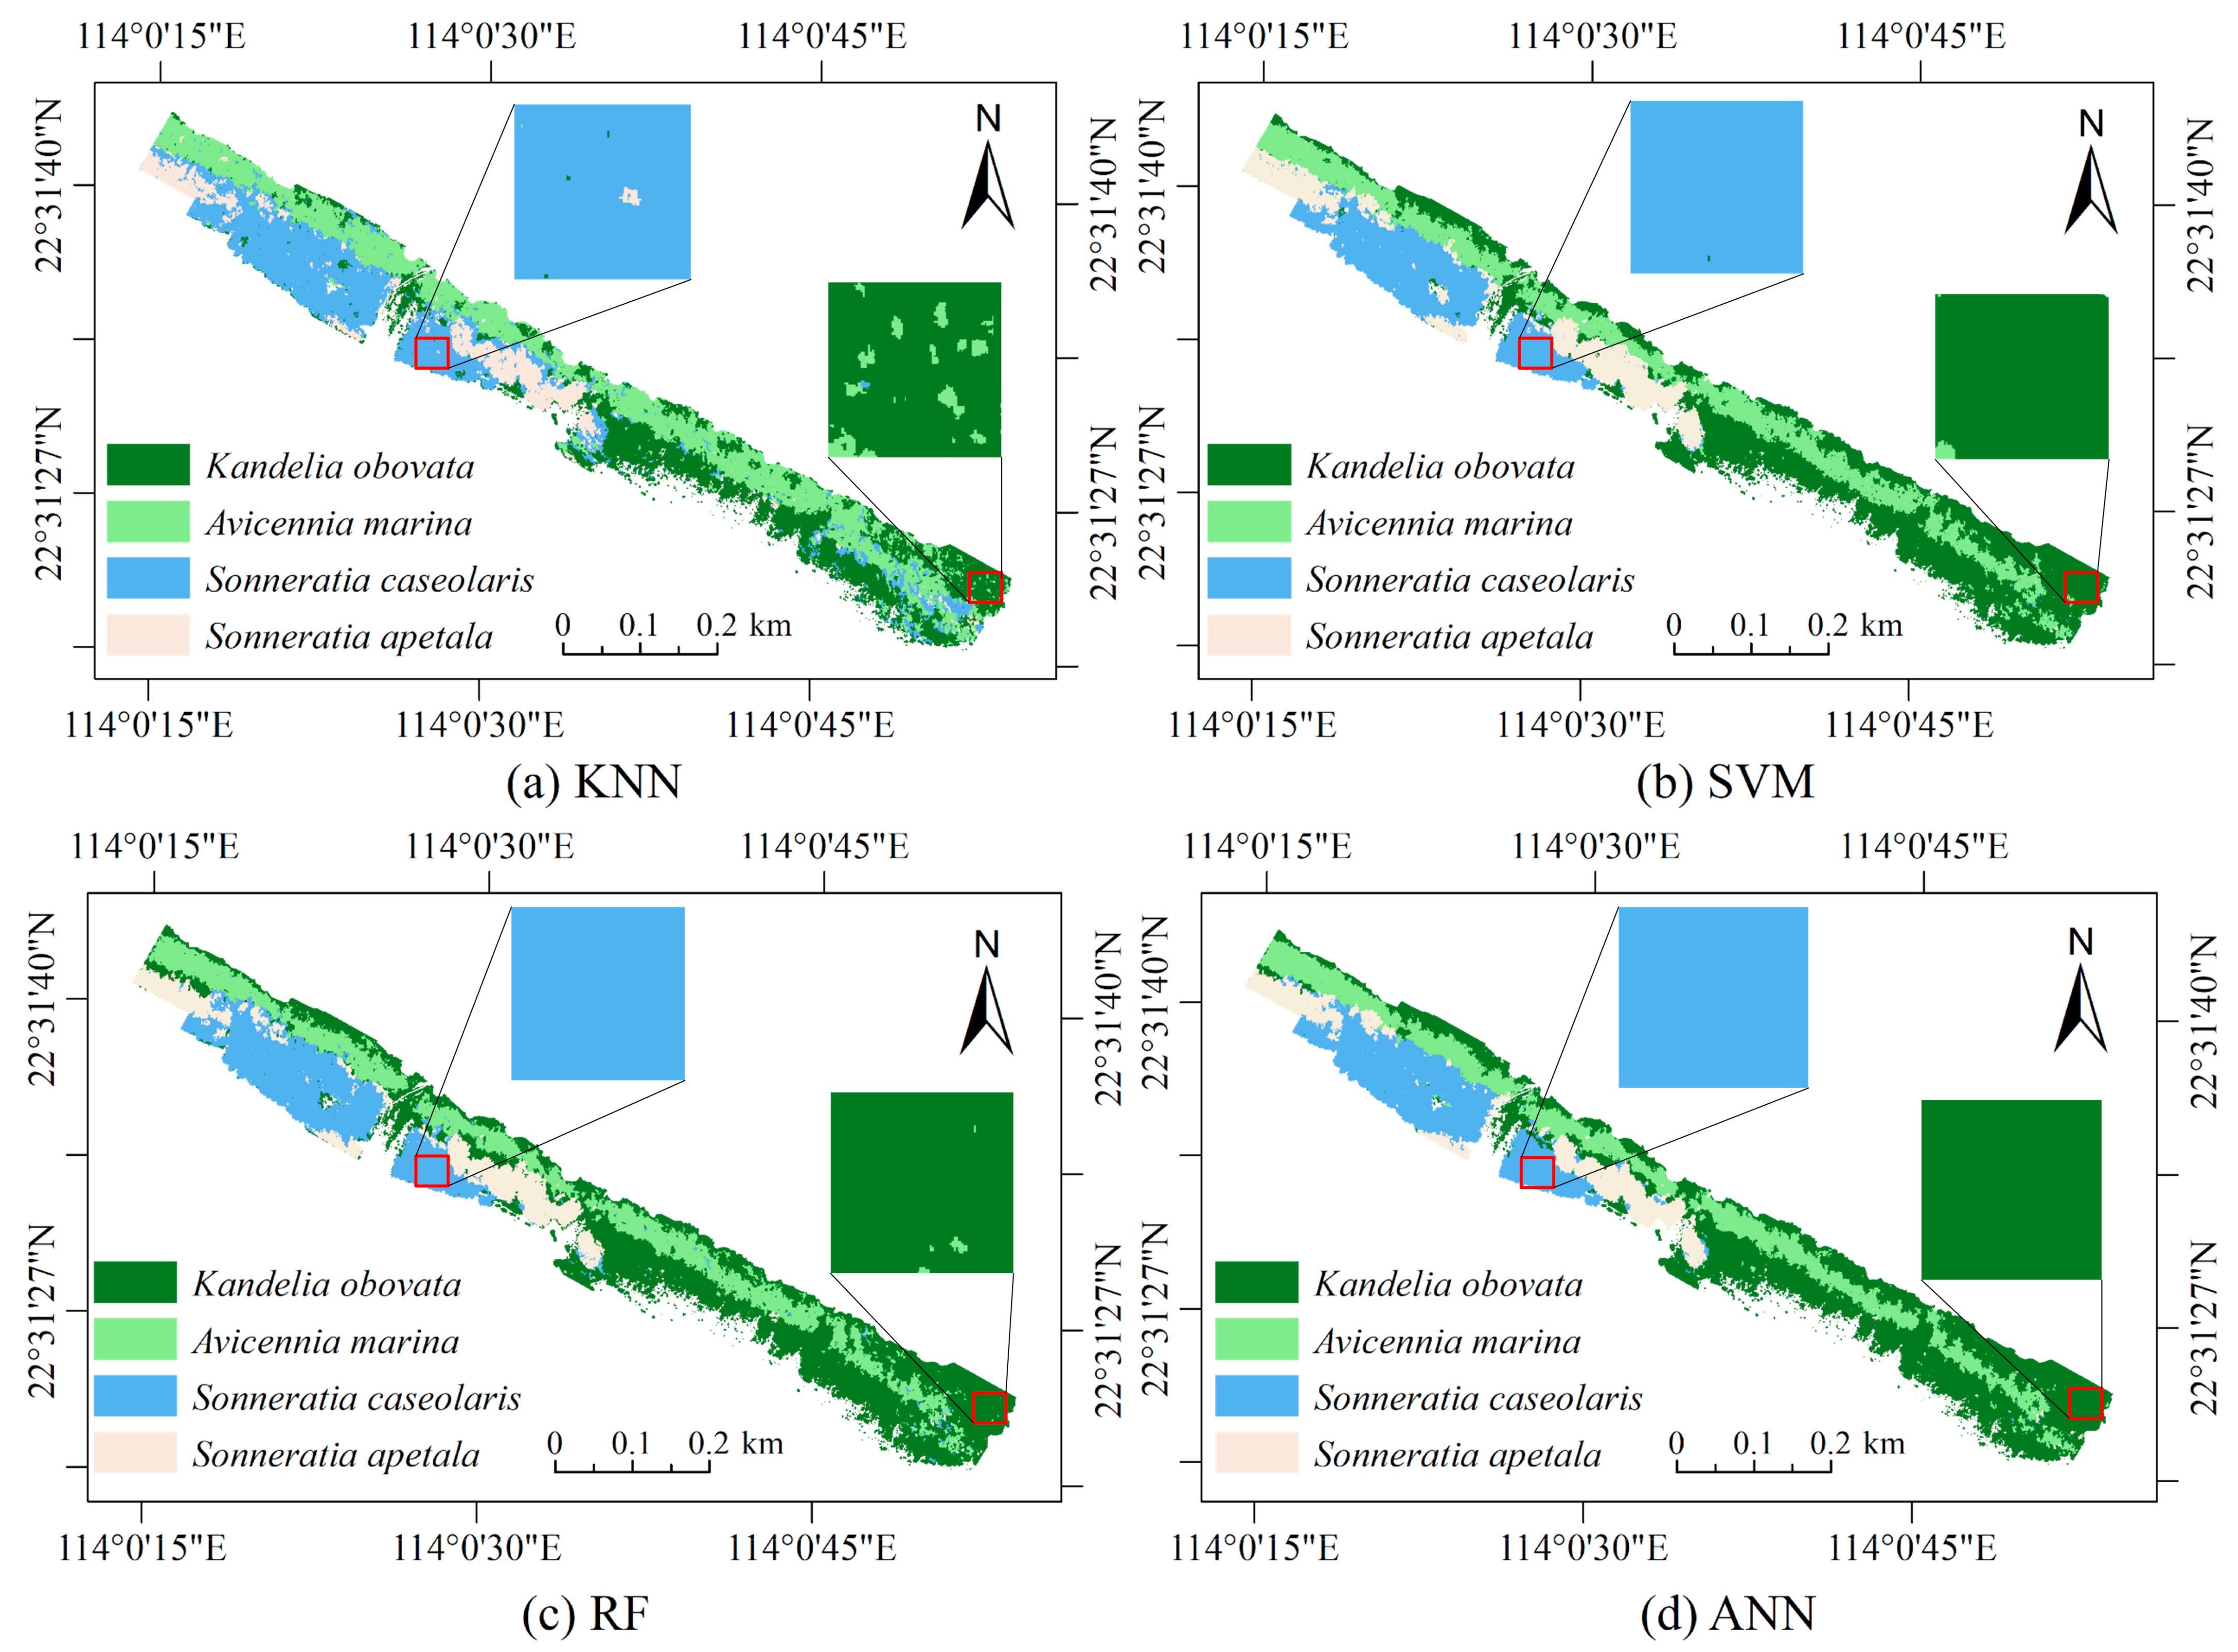
3.7. Visualization of Classification Results
4. Discussion
4.1. Effect of Texture Window on Classification Results
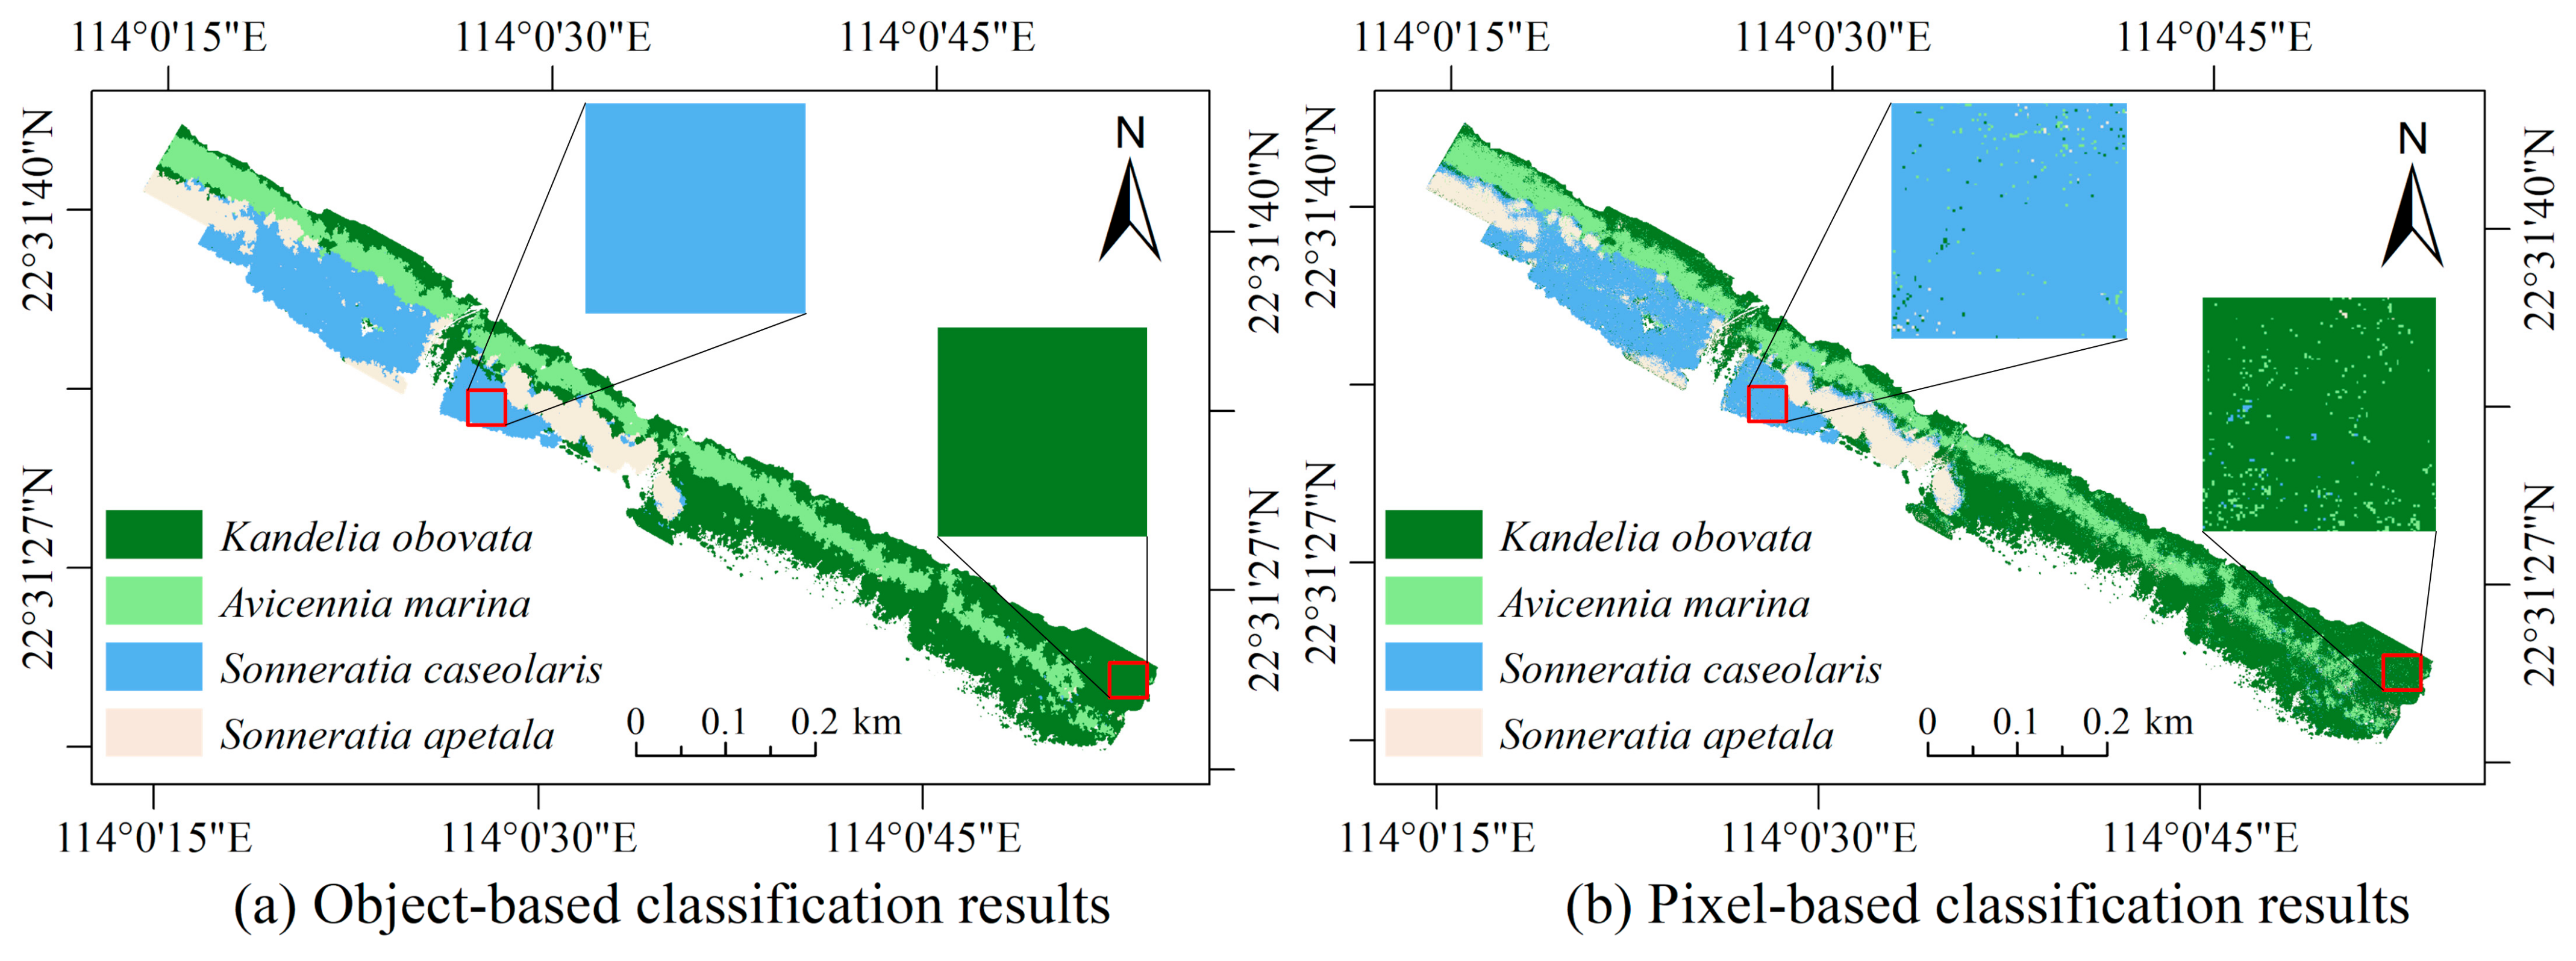
4.2. Comparison of Object-Based and Pixel-Based Classification
4.3. Impact of Sample Numbers
4.4. Running Time Analysis
4.5. Limitations and Outlook
5. Conclusions
Author Contributions
Funding
Institutional Review Board Statement
Informed Consent Statement
Data Availability Statement
Acknowledgments
Conflicts of Interest
References
- Maurya, K.; Mahajan, S.; Chaube, N. Remote sensing techniques: Mapping and monitoring of mangrove ecosystem—A review. Complex Intell. Syst. 2021, 7, 2797–2818. [Google Scholar] [CrossRef]
- Alongi, D. Mangrove forests: Resilience, protection from tsunamis, and responses to global climate change. Estuar. Coast. Shelf Sci. 2008, 76, 1–13. [Google Scholar] [CrossRef]
- Purwanto, A.; Wikantika, K.; Deliar, A.; Darmawan, S. Decision Tree and Random Forest Classification Algorithms for Mangrove Forest Mapping in Sembilang National Park, Indonesia. Remote Sens. 2022, 15, 16. [Google Scholar] [CrossRef]
- Cummings, C.A.; Todhunter, P.; Rundquist, B. Using the Hazus-MH flood model to evaluate community relocation as a flood mitigation response to terminal lake flooding: The case of Minnewaukan, North Dakota, USA. Appl. Geogr. 2012, 32, 889–895. [Google Scholar] [CrossRef]
- Jiang, Y.; Zhang, L.; Yan, M.; Qi, J.; Fu, T.; Fan, S.; Chen, B. High-Resolution Mangrove Forests Classification with Machine Learning Using Worldview and UAV Hyperspectral Data. Remote Sens. 2021, 13, 1529. [Google Scholar] [CrossRef]
- Toosi, N.; Soffianian, A.; Fakheran, S.; Pourmanafi, S.; Ginzler, C.; Waser, L. Land Cover Classification in Mangrove Ecosystems Based on VHR Satellite Data and Machine Learning—An Upscaling Approach. Remote Sens. 2020, 12, 2684. [Google Scholar] [CrossRef]
- Thomas, N.; Lucas, R.; Bunting, P.; Hardy, A.; Rosenqvist, A.; Simard, M. Distribution and drivers of global mangrove forest change, 1996–2010. PLos ONE 2017, 12, e179302. [Google Scholar] [CrossRef] [PubMed]
- Wang, X.; Tan, L.; Fan, J. Performance Evaluation of Mangrove Species Classification Based on Multi-Source Remote Sensing Data Using Extremely Randomized Trees in Fucheng Town, Leizhou City, Guangdong Province. Remote Sens. 2023, 15, 1386. [Google Scholar] [CrossRef]
- Hati, J.P.; Samanta, S.; Chaube, N.; Misra, A.; Giri, S.; Pramanick, N.; Gupta, K.; Majumdar, S.; Chanda, A.; Mukhopadhyay, A.; et al. Mangrove classification using airborne hyperspectral AVIRIS-NG and comparing with other spaceborne hyperspectral and multispectral data. Egypt. J. Remote Sens. Space Sci. 2020, 24, 273–281. [Google Scholar]
- Giri, C. Observation and Monitoring of Mangrove Forests Using Remote Sensing: Opportunities and Challenges. Remote Sens. 2016, 8, 783. [Google Scholar] [CrossRef]
- Pham, T.; Yokoya, N.; Bui, D.; Yoshino, K.; Friess, D. Remote Sensing Approaches for Monitoring Mangrove Species, Structure, and Biomass: Opportunities and Challenges. Remote Sens. 2019, 11, 230. [Google Scholar] [CrossRef]
- Sahadevan, A.S.; Joseph, C.; Gopinath, G.; Ramakrishnan, R.; Gupta, P. Monitoring the rapid changes in mangrove vegetation of coastal urban environment using polynomial trend analysis of temporal satellite data. Reg. Stud. Mar. Sci. 2021, 46, 101871. [Google Scholar] [CrossRef]
- Cao, J.; Liu, K.; Zhuo, L.; Liu, L.; Zhu, Y.; Peng, L. Combining UAV-based hyperspectral and LiDAR data for mangrove species classification using the rotation forest algorithm. Int. J. Appl. Earth Obs. 2021, 102, 102414. [Google Scholar] [CrossRef]
- Nam, V.N.; Sasmito, S.; Murdiyarso, D.; Purbopuspito, J.; Mackenzie, R. Carbon stocks in artificially and naturally regenerated mangrove ecosystems in the Mekong Delta. Wetl. Ecol. Manag. 2016, 24, 231–244. [Google Scholar] [CrossRef]
- Zhang, T.; Bi, Y.; Zhu, X.; Gao, X. Identification and Classification of Small Sample Desert Grassland Vegetation Communities Based on Dynamic Graph Convolution and UAV Hyperspectral Imagery. Sensors 2023, 23, 2856. [Google Scholar] [CrossRef] [PubMed]
- Shafi, U.; Mumtaz, R.; García-Nieto, J.; Hassan, S.A.; Zaidi, S.A.R.; Iqbal, N. Precision Agriculture Techniques and Practices: From Considerations to Applications. Sensors 2019, 19, 3796. [Google Scholar] [CrossRef] [PubMed]
- Zou, Z.; Shi, Z.; Guo, Y.; Ye, J. Object Detection in 20 Years: A Survey. Proc. IEEE 2019, 111, 257–276. [Google Scholar] [CrossRef]
- Navarro, A.; Young, M.; Allan, B.M.; Carnell, P.; Macreadie, P.; Ierodiaconou, D. The application of Unmanned Aerial Vehicles (UAVs) to estimate above-ground biomass of mangrove ecosystems. Remote Sens. Environ. 2020, 242, 111747. [Google Scholar] [CrossRef]
- Ghorbanian, A.; Zaghian, S.; Asiyabi, R.M.; Amani, M.; Mohammadzadeh, A.; Jamali, S. Mangrove Ecosystem Mapping Using Sentinel-1 and Sentinel-2 Satellite Images and Random Forest Algorithm in Google Earth Engine. Remote Sens. 2021, 13, 2565. [Google Scholar] [CrossRef]
- Lee, C.K.F.; Duncan, C.; Nicholson, E.; Fatoyinbo, T.E.; Lagomasino, D.; Thomas, N.; Worthington, T.A.; Murray, N.J. Mapping the Extent of Mangrove Ecosystem Degradation by Integrating an Ecological Conceptual Model with Satellite Data. Remote Sens. 2021, 13, 2047. [Google Scholar] [CrossRef]
- Ruwaimana, M.; Satyanarayana, B.; Otero, V.; Muslim, A.M.; Syafiq, A.M.; Ibrahim, S.; Raymaekers, D.; Koedam, N.; Dahdouh-Guebas, F. The advantages of using drones over space-borne imagery in the mapping of mangrove forests. PLoS ONE 2018, 13, e200288. [Google Scholar] [CrossRef] [PubMed]
- Yao, H.; Qin, R.; Chen, X. Unmanned Aerial Vehicle for Remote Sensing Applications—A Review. Remote Sens. 2019, 11, 1443. [Google Scholar] [CrossRef]
- Tian, Y.; Hu, H.; Zhou, G.; Zhang, Q.; Jin, T.; Yali, Z.; Lin, J. Aboveground mangrove biomass estimation in Beibu Gulf using machine learning and UAV remote sensing. Sci. Total Environ. 2021, 781, 146816. [Google Scholar] [CrossRef]
- Onishi, M.; Ise, T. Explainable identification and mapping of trees using UAV RGB image and deep learning. Sci. Rep. 2021, 11, 903. [Google Scholar] [CrossRef] [PubMed]
- Santos, A.A.D.; Junior, J.M.; Araújo, M.S.; Di Martini, D.R.; Tetila, E.; Siqueira, H.L.; Aoki, C.; Eltner, A.; Matsubara, E.; Pistori, H.; et al. Assessment of CNN-Based Methods for Individual Tree Detection on Images Captured by RGB Cameras Attached to UAVs. Sensors 2019, 19, 3595. [Google Scholar] [CrossRef] [PubMed]
- Franklin, S. Pixel- and object-based multispectral classification of forest tree species from small unmanned aerial vehicles. J. Unmanned Veh. Syst. 2018, 6, 195–211. [Google Scholar] [CrossRef]
- Zhang, T.; Bi, Y.; Xuan, C. Convolutional transformer attention network with few-shot learning for grassland degradation monitoring using UAV hyperspectral imagery. Int. J. Remote Sens. 2024, 45, 2109–2135. [Google Scholar] [CrossRef]
- Zimudzi, E.; Sanders, I.; Rollings, N.; Omlin, C. Remote sensing of mangroves using unmanned aerial vehicles: Current state and future directions. J. Spat. Sci. 2019, 66, 195–212. [Google Scholar] [CrossRef]
- Qin, H.; Zhou, W.; Yao, Y.; Wang, W. Individual tree segmentation and tree species classification in subtropical broadleaf forests using UAV-based LiDAR, hyperspectral, and ultrahigh-resolution RGB data. Remote Sens. Environ. 2022, 280, 113143. [Google Scholar] [CrossRef]
- He, Z.; Shi, Q.; Liu, K.; Cao, J.; Zhan, W.; Cao, B. Object-Oriented Mangrove Species Classification Using Hyperspectral Data and 3-D Siamese Residual Network. IEEE Geosci. Remote Sens. 2020, 17, 2150–2154. [Google Scholar] [CrossRef]
- Wendelberger, K.S.; Gann, D.; Richards, J. Using Bi-Seasonal WorldView-2 Multi-Spectral Data and Supervised Random Forest Classification to Map Coastal Plant Communities in Everglades National Park. Sensors 2018, 18, 829. [Google Scholar] [CrossRef] [PubMed]
- Zhang, H.; Xia, Q.; Dai, S.; Zheng, Q.; Zhang, Y.; Deng, X. Mangrove forest mapping from object-oriented multi-feature ensemble classification using Sentinel-2 images. Front. Mar. Sci. 2023, 10, 1243116. [Google Scholar] [CrossRef]
- Du, B.; Mao, D.; Wang, Z.; Qiu, Z.; Yan, H.; Feng, K.; Zhang, Z. Mapping Wetland Plant Communities Using Unmanned Aerial Vehicle Hyperspectral Imagery by Comparing Object/Pixel-Based Classifications Combining Multiple Machine-Learning Algorithms. IEEE J. Sel. Top. Appl. Earth Obs. Remote Sens. 2021, 14, 8249–8258. [Google Scholar] [CrossRef]
- Norris, G.S.; Larocque, A.; Leblon, B.; Barbeau, M.A.; Hanson, A. Comparing Pixel- and Object-Based Approaches for Classifying Multispectral Drone Imagery of a Salt Marsh Restoration and Reference Site. Remote Sens. 2024, 16, 1049. [Google Scholar] [CrossRef]
- Zhang, R.; Jia, M.; Wang, Z.; Zhou, Y.; Wen, X.; Tan, Y.; Cheng, L. A Comparison of Gaofen-2 and Sentinel-2 Imagery for Mapping Mangrove Forests Using Object-Oriented Analysis and Random Forest. IEEE J. Sel. Top. Appl. Earth Obs. Remote Sens. 2021, 14, 4185–4193. [Google Scholar] [CrossRef]
- Zhou, R.; Yang, C.; Li, E.; Cai, X.; Yang, J.; Xia, Y. Object-Based Wetland Vegetation Classification Using Multi-Feature Selection of Unoccupied Aerial Vehicle RGB Imagery. Remote Sens. 2021, 13, 4910. [Google Scholar] [CrossRef]
- Manna, S.; Raychaudhuri, B. Mapping distribution of Sundarban mangroves using Sentinel-2 data and new spectral metric for detecting their health condition. Geocarto Int. 2020, 35, 434–452. [Google Scholar] [CrossRef]
- Ou, J.; Tian, Y.; Zhang, Q.; Xie, X.; Zhang, Y.; Tao, J.; Lin, J. Coupling UAV Hyperspectral and LiDAR Data for Mangrove Classification Using XGBoost in China’s Pinglu Canal Estuary. Forests 2023, 14, 1838. [Google Scholar] [CrossRef]
- Cao, J.; Liu, K.; Liu, L.; Zhu, Y.; Li, J.; He, Z. Identifying Mangrove Species Using Field Close-Range Snapshot Hyperspectral Imaging and Machine-Learning Techniques. Remote Sens. 2018, 10, 2047. [Google Scholar] [CrossRef]
- Zhang, J.; Rivard, B.; Sánchez-Azofeifa, A.; Castro-Esau, K. Intra- and inter-class spectral variability of tropical tree species at La Selva, Costa Rica: Implications for species identification using HYDICE imagery. Remote Sens. Environ. 2006, 105, 129–141. [Google Scholar] [CrossRef]
- Li, C.; Wang, Y.; Ma, C.; Ding, F.; Li, Y.; Chen, W.; Li, J.; Xiao, Z. Hyperspectral Estimation of Winter Wheat Leaf Area Index Based on Continuous Wavelet Transform and Fractional Order Differentiation. Sensors 2021, 21, 8497. [Google Scholar] [CrossRef] [PubMed]
- Hong, Y.; Guo, L.; Chen, S.; Linderman, M.; Mouazen, A.; Yu, L.; Chen, Y.; Liu, Y.; Liu, Y.; Cheng, H.; et al. Exploring the potential of airborne hyperspectral image for estimating topsoil organic carbon: Effects of fractional-order derivative and optimal band combination algorithm. Geoderma 2020, 365, 114228. [Google Scholar] [CrossRef]
- Lee, M.; Golzarian, M.; Kim, I. A new color index for vegetation segmentation and classification. Precis. Agric. 2020, 22, 179–204. [Google Scholar] [CrossRef]
- Behera, M.D.; Barnwal, S.; Paramanik, S.; Das, P.; Bhattyacharya, B.K.; Jagadish, B.; Roy, P.; Ghosh, S.; Behera, S. Species-Level Classification and Mapping of a Mangrove Forest Using Random Forest—Utilisation of AVIRIS-NG and Sentinel Data. Remote Sens. 2021, 13, 2027. [Google Scholar] [CrossRef]
- Li, Y.; Fu, B.; Sun, X.; Fan, D.; Wang, Y.; He, H.; Gao, E.; He, W.; Yao, Y. Comparison of Different Transfer Learning Methods for Classification of Mangrove Communities Using MCCUNet and UAV Multispectral Images. Remote Sens. 2022, 14, 5533. [Google Scholar] [CrossRef]
- Fu, B.; He, X.; Yao, H.; Liang, Y.; Deng, T.; He, H.; Fan, D.; Lan, G.; He, W. Comparison of RFE-DL and stacking ensemble learning algorithms for classifying mangrove species on UAV multispectral images. Int. J. Appl. Earth Obs. Geoinf. 2022, 112, 102890. [Google Scholar] [CrossRef]
- Karimzadeh, S.; Kamran, K.V.; Mahdavifard, M. A multisensor satellite image classification for the detection of mangrove forests in Qeshm Island (Southern Iran). Appl. Geomat. 2022, 15, 177–188. [Google Scholar] [CrossRef]
- Xing, H.; Niu, J.; Feng, Y.; Hou, D.; Wang, Y.; Wang, Z. A coastal wetlands mapping approach of Yellow River Delta with a hierarchical classification and optimal feature selection framework. Catena 2023, 223, 106897. [Google Scholar] [CrossRef]
- Hong, L.; Zhang, M. Object-oriented multiscale deep features for hyperspectral image classification. Int. J. Remote Sens. 2020, 41, 5549–5572. [Google Scholar] [CrossRef]
- Deng, H.; Zhang, W.; Zheng, X.; Zhang, H. Crop Classification Combining Object-Oriented Method and Random Forest Model Using Unmanned Aerial Vehicle (UAV) Multispectral Image. Agriculture 2024, 14, 548. [Google Scholar] [CrossRef]
- Xiao, H.; Li, Z.; Zhou, Y.; Gao, Z. High-Density Functional Near-Infrared Spectroscopy and Machine Learning for Visual Perception Quantification. Sensors 2023, 23, 8696. [Google Scholar] [CrossRef] [PubMed]
- Tang, X.; Dou, Z.; Cui, L.; Liu, Z.; Gao, C.; Wang, J.; Li, J.; Lei, Y.; Zhao, X.; Zhai, X.; et al. Hyperspectral prediction of mangrove leaf stoichiometries in different restoration areas based on machine learning models. J. Appl. Remote Sens. 2022, 16, 34525. [Google Scholar] [CrossRef]
- Zhong, H.; Lin, W.; Liu, H.; Ma, N.; Liu, K.; Cao, R.; Wang, T.; Ren, Z. Identification of tree species based on the fusion of UAV hyperspectral image and LiDAR data in a coniferous and broad-leaved mixed forest in Northeast China. Front. Plant Sci. 2022, 13, 964769. [Google Scholar] [CrossRef] [PubMed]
- Reddy, P.; Panozzo, J.; Guthridge, K.; Spangenberg, G.; Rochfort, S. Single Seed Near-Infrared Hyperspectral Imaging for Classification of Perennial Ryegrass Seed. Sensors 2023, 23, 1820. [Google Scholar] [CrossRef] [PubMed]
- Barburiceanu, S.; Terebes, R.; Meza, S. 3D Texture Feature Extraction and Classification Using GLCM and LBP-Based Descriptors. Appl. Sci. 2021, 11, 2332. [Google Scholar] [CrossRef]
- Xiao, Y.; Dong, Y.; Huang, W.; Liu, L.; Ma, H. Wheat Fusarium Head Blight Detection Using UAV-Based Spectral and Texture Features in Optimal Window Size. Remote Sens. 2021, 13, 2437. [Google Scholar] [CrossRef]
- Saboori, M.; Torahi, A.A.; Bakhtyari, H.R.R. Combining multi-scale textural features from the panchromatic bands of high spatial resolution images with ANN and MLC classification algorithms to extract urban land uses. Int. J. Remote Sens. 2019, 40, 8608–8634. [Google Scholar] [CrossRef]
- Duan, M.; Song, X.; Li, Z.; Zhang, X.; Ding, X.; Cui, D. Identifying soil groups and selecting a high-accuracy classification method based on multi-textural features with optimal window sizes using remote sensing images. Ecol. Inform. 2024, 81, 102563. [Google Scholar] [CrossRef]
- Luo, C.; Qi, B.; Liu, H.; Guo, D.; Lu, L.; Fu, Q.; Shao, Y. Using Time Series Sentinel-1 Images for Object-Oriented Crop Classification in Google Earth Engine. Remote Sens. 2021, 13, 561. [Google Scholar] [CrossRef]
- Zhu, J.; Yao, J.; Yu, Q.; He, W.; Xu, C.; Qin, G.; Zhu, Q.; Fan, D.; Zhu, H. A Fast and Automatic Method for Leaf Vein Network Extraction and Vein Density Measurement Based on Object-Oriented Classification. Front. Plant Sci. 2020, 11, 499. [Google Scholar] [CrossRef] [PubMed]


| No. | Kandelia obovata | Avicennia marina | Sonneratia caseolaris | Sonneratia apetala |
|---|---|---|---|---|
| RGB images | 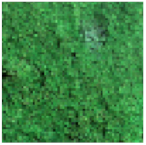 | 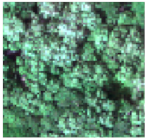 | 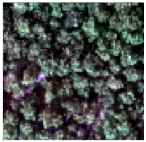 | 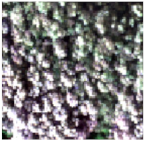 |
| Features | Smooth color tone with no obvious textural features. | Light green in color with rougher textural features. | The color is dark with obvious textural features. | The color is bright with obvious textural features. |
| No. | Class Name | Training | Test | Total |
|---|---|---|---|---|
| 0 | Kandelia obovata | 795 | 1856 | 2651 |
| 1 | Avicennia marina | 390 | 813 | 1203 |
| 2 | Sonneratia caseolaris | 469 | 1096 | 1565 |
| 3 | Sonneratia apetala | 459 | 1167 | 1626 |
| Total | 2113 | 4932 | 7045 | |
| Vegetation Indices | Abbreviation | Formula |
|---|---|---|
| Normalized Difference Vegetation Index | NDVI | |
| Blue Green Pigment Index 2 | BGI2 | |
| Renormalized Difference Vegetation Index | RDVI | |
| Transformed Chlorophyll Absorption in Reflectance Index | TCARI | |
| Green Optimized Soil Adjusted Vegetation Index | GOSAVI | |
| TCARI/GOSAVI Ratio | TCARIOSAVI | |
| Modified Chlorophyll Absorption in Reflectance Index 2 | MCARI2 | |
| Photochemical Reflectance Index | PRI | |
| Transformed Difference Vegetation Index | TDVI | |
| Carotenoid Reflectance Index 2 | CRI2 | |
| Plant Senescing Reflectance Index | PSRI | |
| Green Leaf Index | GLI | |
| Red Edge Normalized Difference Vegetation Index | RENDVI | |
| Structure Insensitive Pigment Index | SIPI | |
| Nonlinear Vegetation Index | NLI |
| No Feature Selection | Feature Selection | |||||||
|---|---|---|---|---|---|---|---|---|
| Feature Variables | KNN | SVM | RF | ANN | KNN | SVM | RF | ANN |
| OS | 71.74 | 95.07 | 80.03 | 91.91 | 74.13 | 95.72 | 80.49 | 91.91 |
| FOD | 85.87 | 95.13 | 91.30 | 95.76 | 88.79 | 95.88 | 92.86 | 96.21 |
| SOD | 86.21 | 93.07 | 92.01 | 95.34 | 90.51 | 94.32 | 92.76 | 96.47 |
| TF | 85.02 | 96.88 | 89.07 | 90.75 | 87.53 | 97.04 | 90.09 | 91.61 |
| VI | 72.51 | 88.93 | 77.01 | 74.53 | 75.04 | 89.03 | 78.61 | 75.18 |
| GF | 36.84 | 37.53 | 35.73 | 38.48 | 37.43 | 39.17 | 35.87 | 39.33 |
| No. | Feature Combinations | OA | AA | Kappa |
|---|---|---|---|---|
| 1 | OS + FOD | 95.68 | 95.55 | 0.9404 |
| 2 | FOD + TF | 96.88 | 96.75 | 0.9569 |
| 3 | OS + FOD + TF | 97.38 | 97.26 | 0.9639 |
| 4 | OS + SOD + TF | 96.67 | 96.41 | 0.9541 |
| 5 | OS + FOD + TF + VI | 97.45 | 97.29 | 0.9648 |
| 6 | OS + FOD + TF + GF | 97.40 | 97.25 | 0.9642 |
| 7 | FOD + TF + VI | 97.22 | 97.07 | 0.9617 |
| 8 | FOD + TF + GF | 97.22 | 97.06 | 0.9617 |
| 9 | FOD + TF + VI + GF | 97.51 | 97.38 | 0.9656 |
| 10 | OS + FOD + TF + VI + GF | 97.59 | 97.43 | 0.9667 |
| Class | KNN | SVM | RF | ANN |
|---|---|---|---|---|
| 0 | 84.32 | 98.38 | 97.79 | 98.28 |
| 1 | 94.10 | 97.17 | 92.74 | 97.17 |
| 2 | 88.78 | 97.17 | 91.97 | 97.81 |
| 3 | 87.23 | 97.00 | 91.95 | 98.46 |
| OA | 87.61 (87.36) | 97.59 (97.26) | 94.28 (93.85) | 98.03 (97.96) |
| AA | 88.61 (88.37) | 97.43 (97.17) | 93.61 (93.29) | 97.93 (97.98) |
| Kappa | 0.8306 (0.8279) | 0.9667 (0.9622) | 0.9207 (0.9151) | 0.9729 (0.9720) |
| Object-Based | Pixel-Based | |||||||
|---|---|---|---|---|---|---|---|---|
| Class | KNN | SVM | RF | ANN | KNN | SVM | RF | ANN |
| 0 | 84.32 | 98.38 | 97.79 | 98.28 | 82.77 | 97.40 | 96.64 | 97.78 |
| 1 | 94.10 | 97.17 | 92.74 | 97.17 | 89.46 | 96.65 | 92.81 | 97.49 |
| 2 | 88.78 | 97.17 | 91.97 | 97.81 | 88.04 | 95.11 | 91.57 | 95.92 |
| 3 | 87.23 | 97.00 | 91.95 | 98.46 | 86.42 | 95.53 | 93.95 | 95.97 |
| OA | 87.61 | 97.59 | 94.28 | 98.03 | 85.93 | 96.33 | 94.23 | 96.89 |
| AA | 88.61 | 97.43 | 93.61 | 97.93 | 86.67 | 96.17 | 93.75 | 96.79 |
| Kappa | 0.8306 | 0.9667 | 0.9207 | 0.9729 | 0.8078 | 0.9494 | 0.9203 | 0.9572 |
| Time | KNN | SVM | RF | ANN |
|---|---|---|---|---|
| Training time (s) | 0.004 | 0.153 | 7.490 | 2.000 |
| Verification time (s) | 0.516 | 0.652 | 0.380 | 0.016 |
Disclaimer/Publisher’s Note: The statements, opinions and data contained in all publications are solely those of the individual author(s) and contributor(s) and not of MDPI and/or the editor(s). MDPI and/or the editor(s) disclaim responsibility for any injury to people or property resulting from any ideas, methods, instructions or products referred to in the content. |
© 2024 by the authors. Licensee MDPI, Basel, Switzerland. This article is an open access article distributed under the terms and conditions of the Creative Commons Attribution (CC BY) license (https://creativecommons.org/licenses/by/4.0/).
Share and Cite
Ye, F.; Zhou, B. Mangrove Species Classification from Unmanned Aerial Vehicle Hyperspectral Images Using Object-Oriented Methods Based on Feature Combination and Optimization. Sensors 2024, 24, 4108. https://doi.org/10.3390/s24134108
Ye F, Zhou B. Mangrove Species Classification from Unmanned Aerial Vehicle Hyperspectral Images Using Object-Oriented Methods Based on Feature Combination and Optimization. Sensors. 2024; 24(13):4108. https://doi.org/10.3390/s24134108
Chicago/Turabian StyleYe, Fankai, and Baoping Zhou. 2024. "Mangrove Species Classification from Unmanned Aerial Vehicle Hyperspectral Images Using Object-Oriented Methods Based on Feature Combination and Optimization" Sensors 24, no. 13: 4108. https://doi.org/10.3390/s24134108