
Method for Underground Mining Shaft Sensor Data Collection

 , ,
, ,  , and
, and
Abstract
:1. Introduction
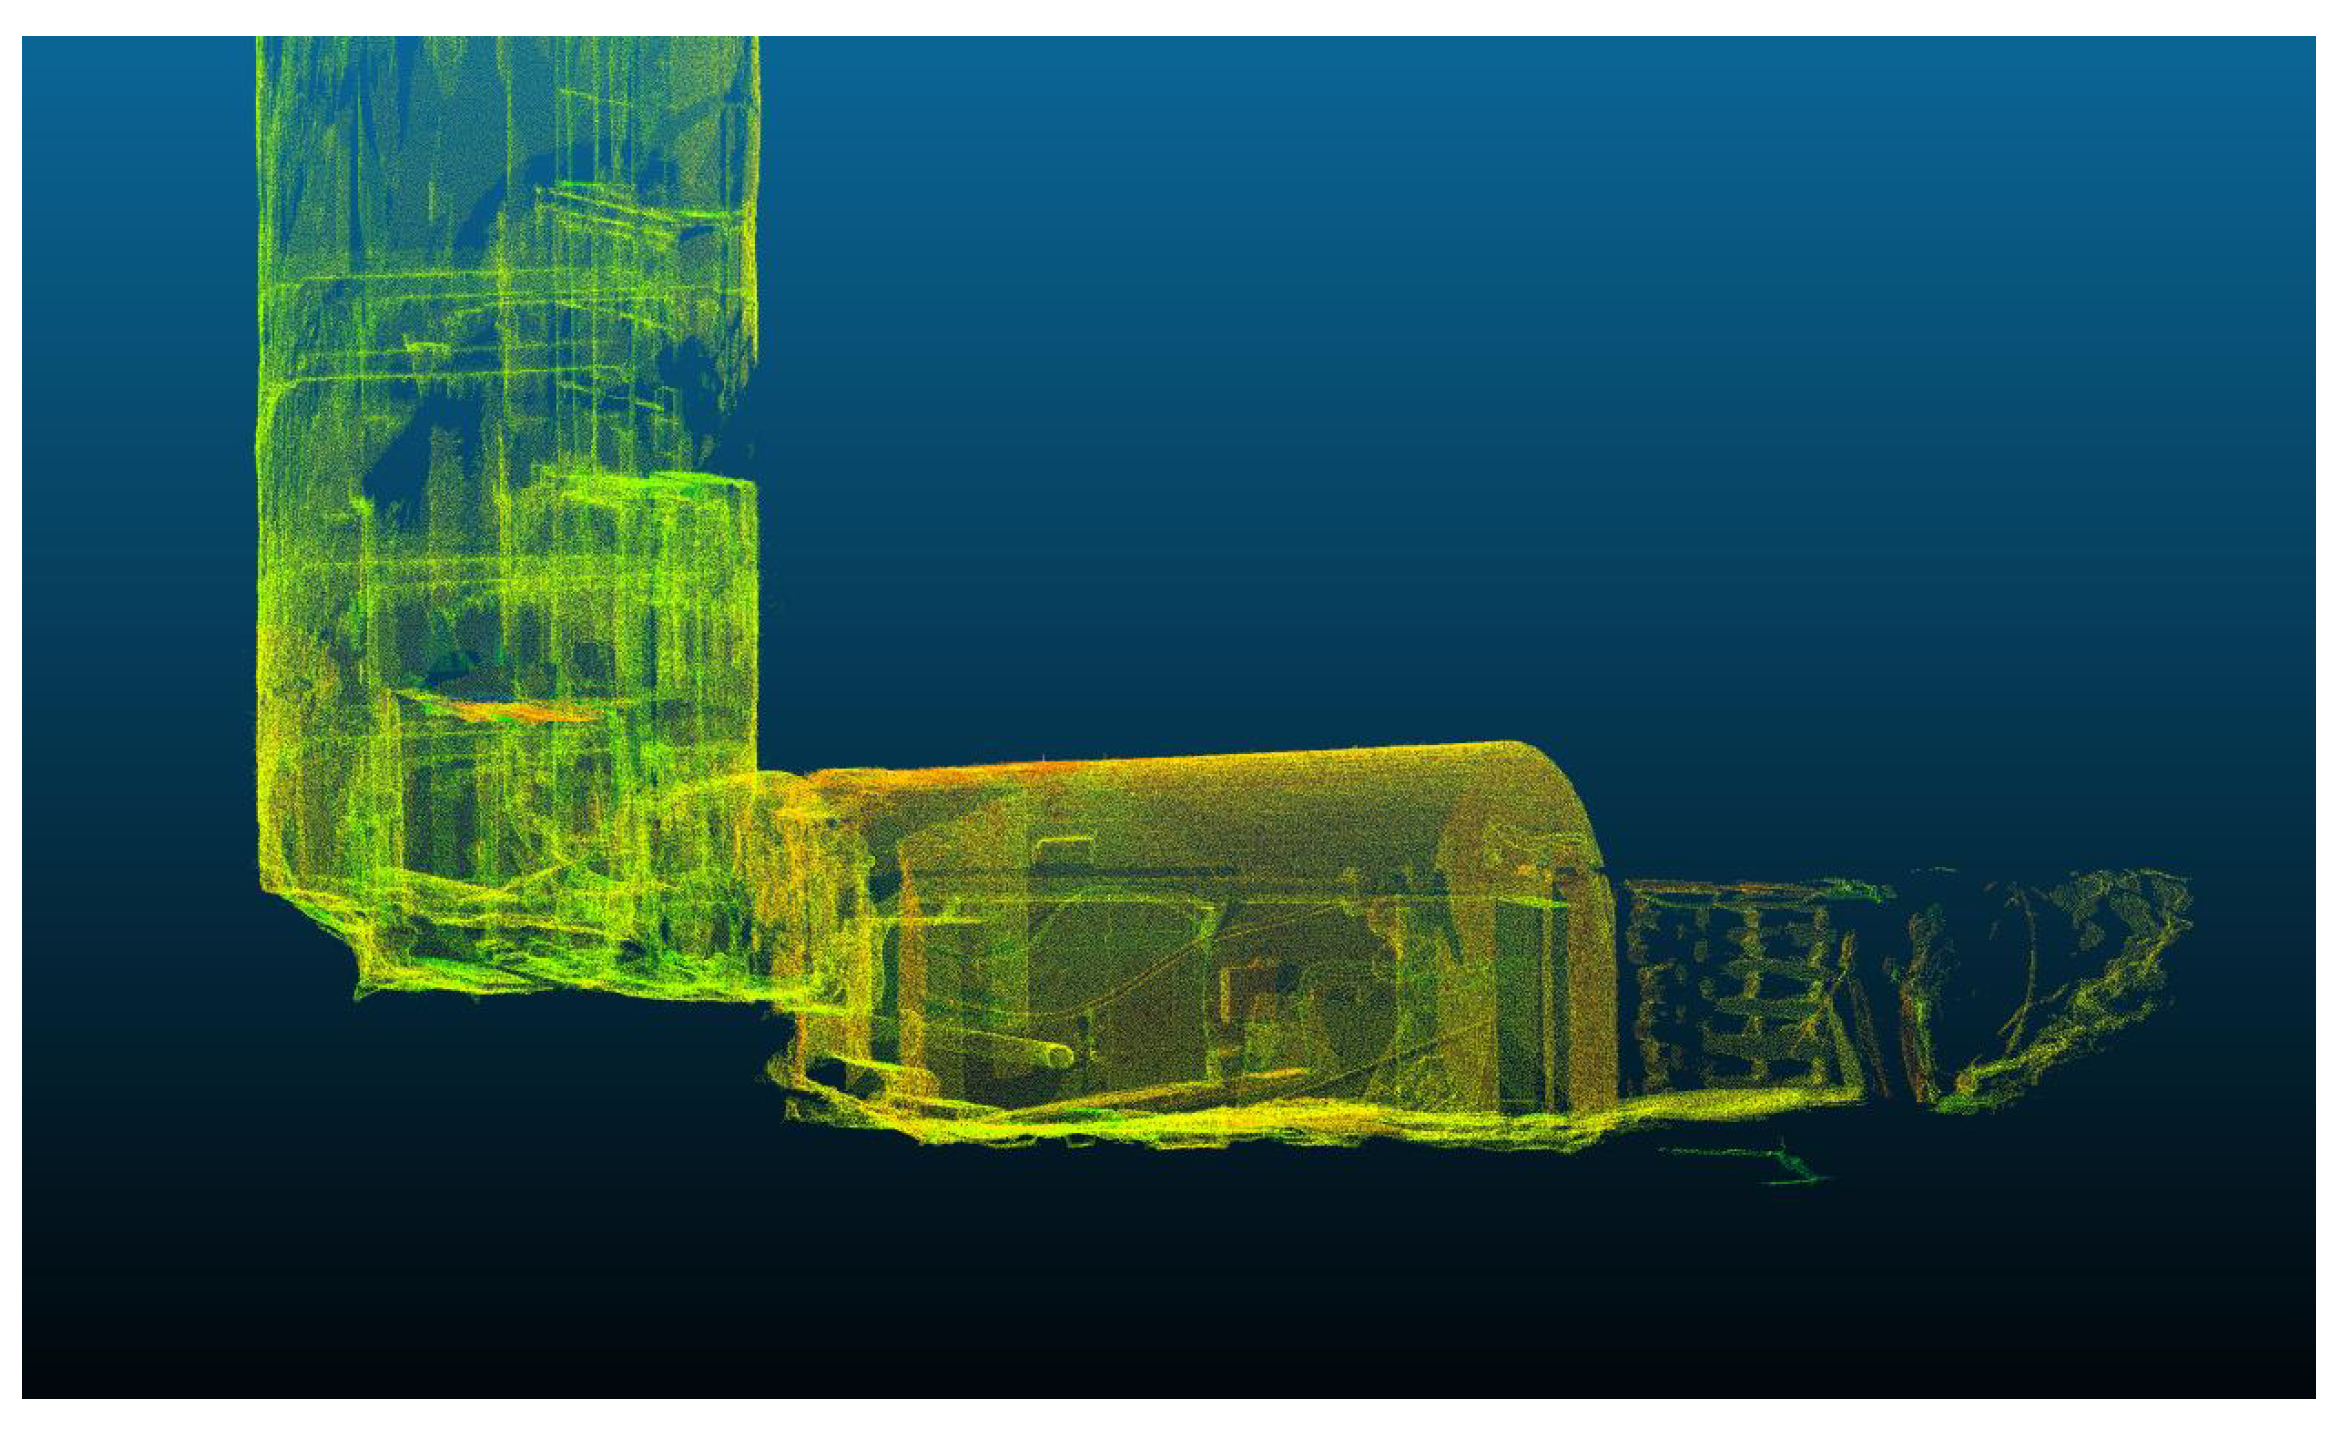
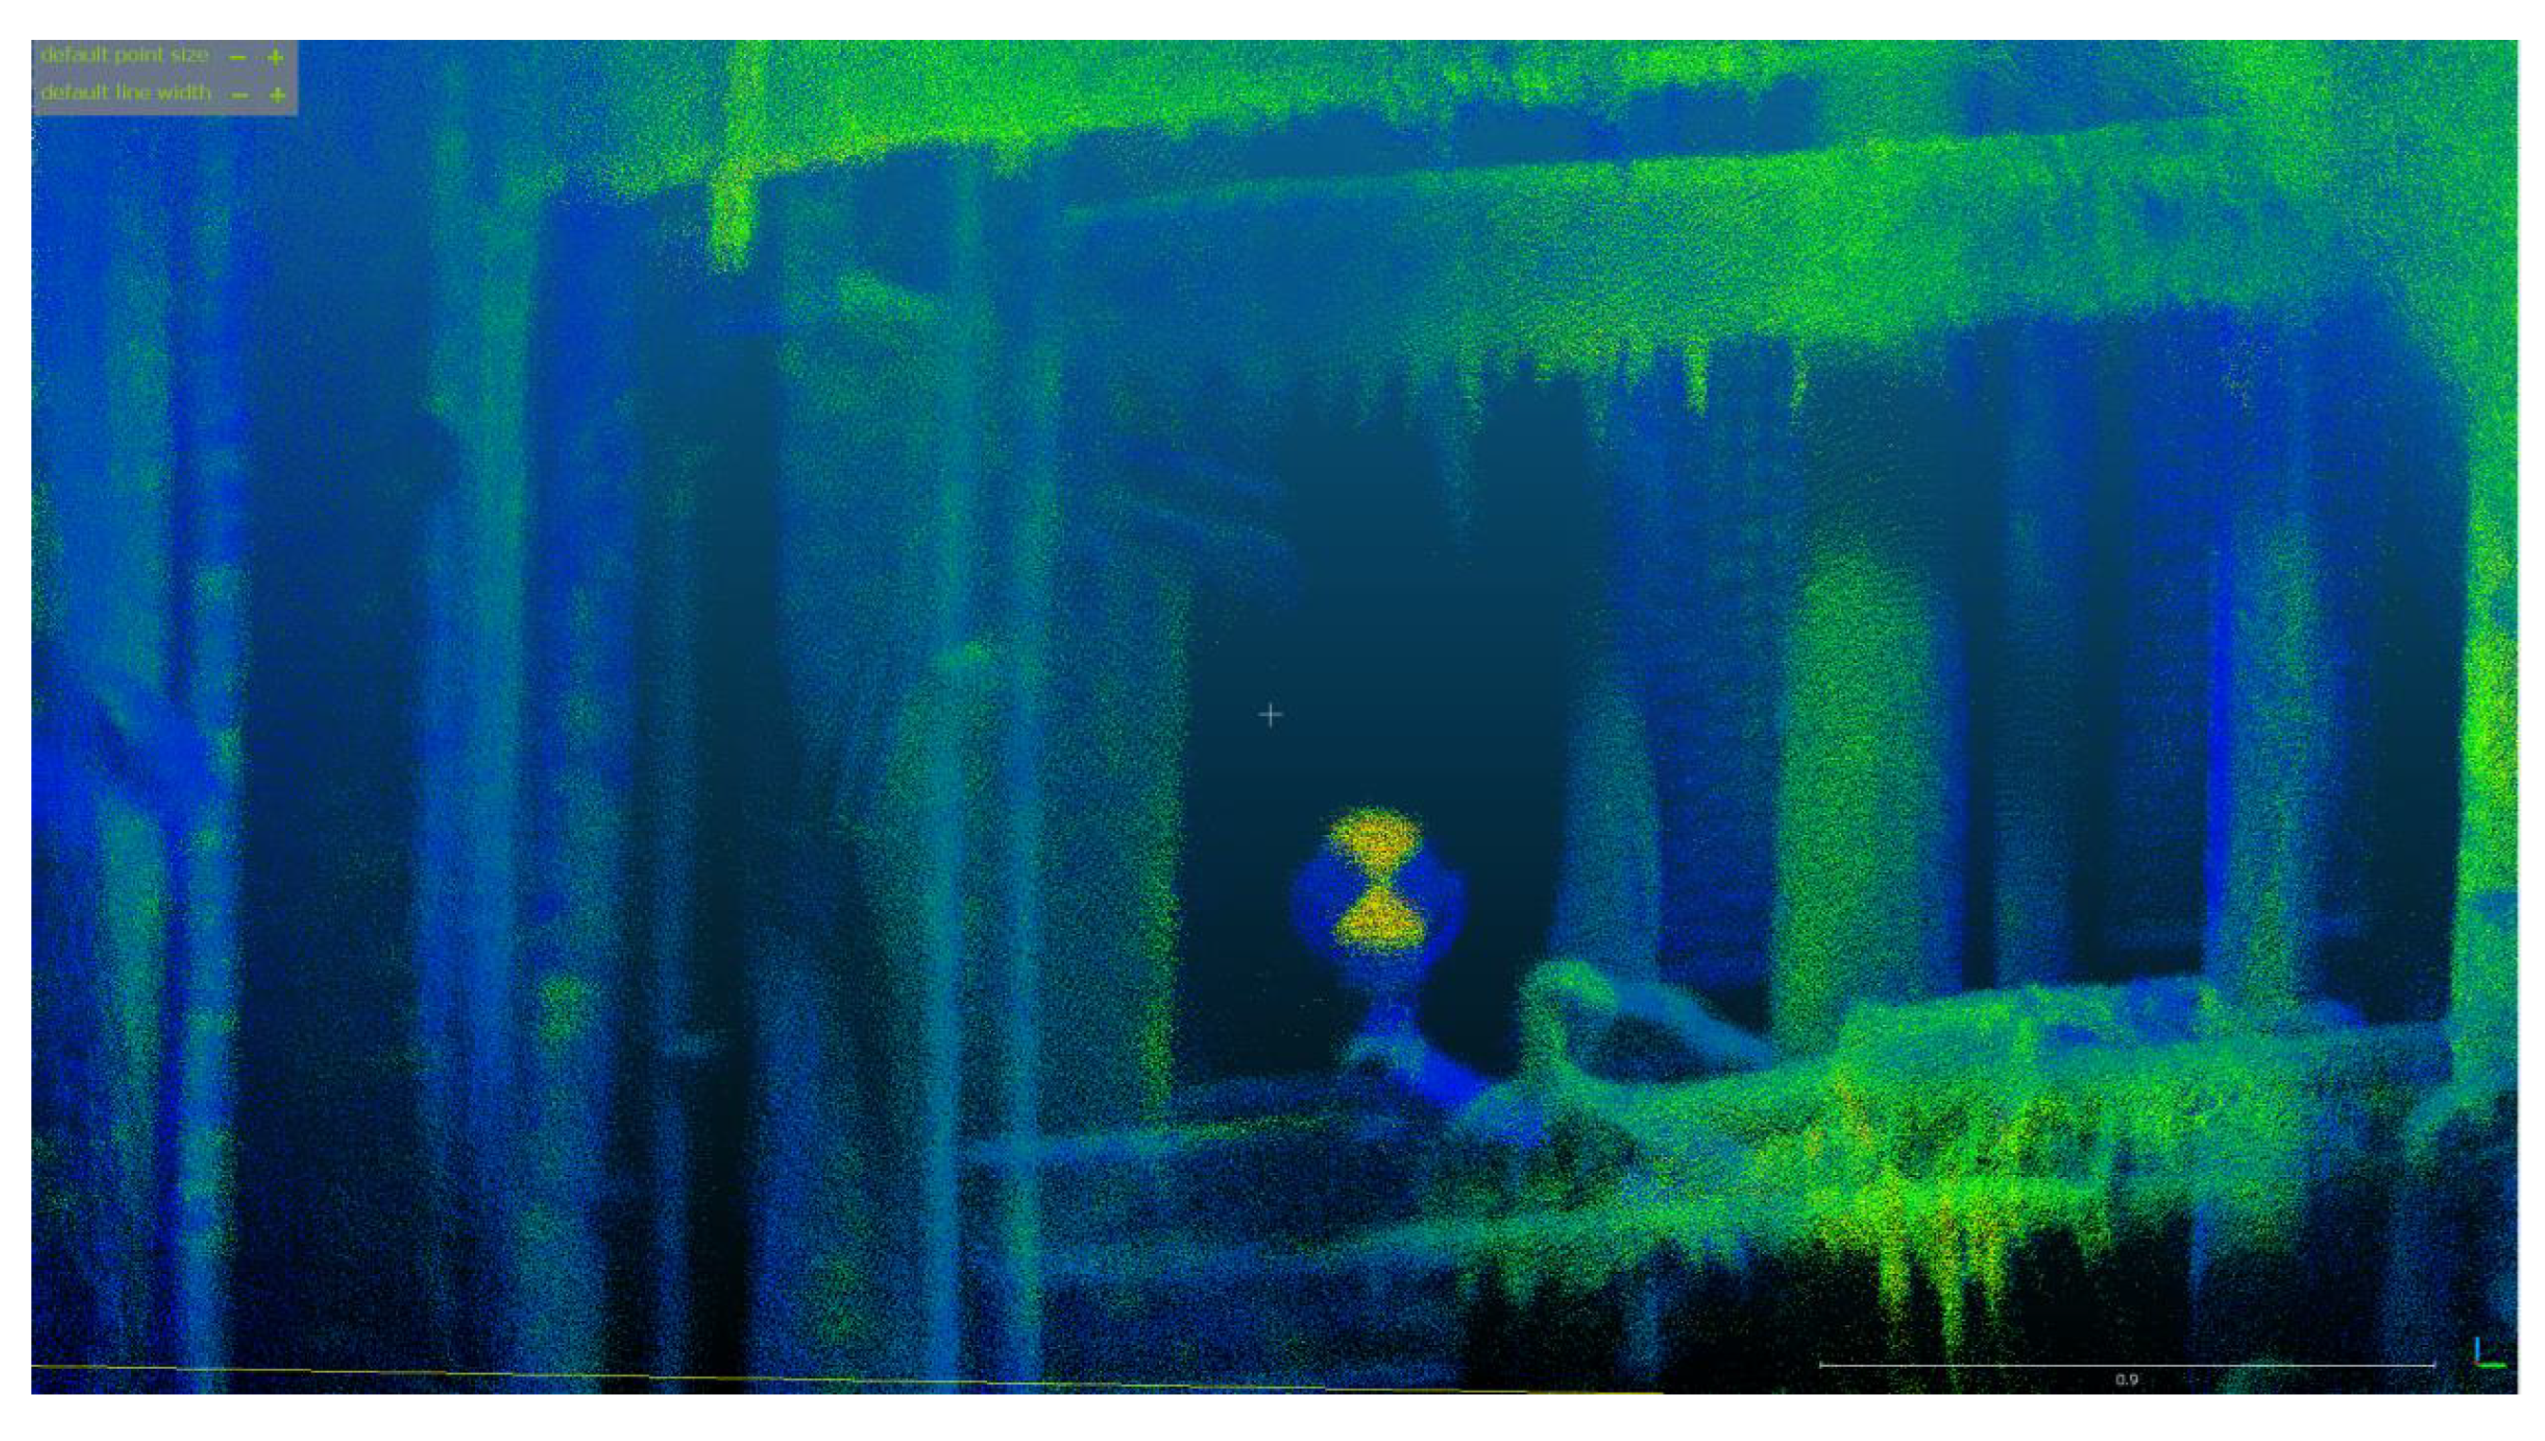
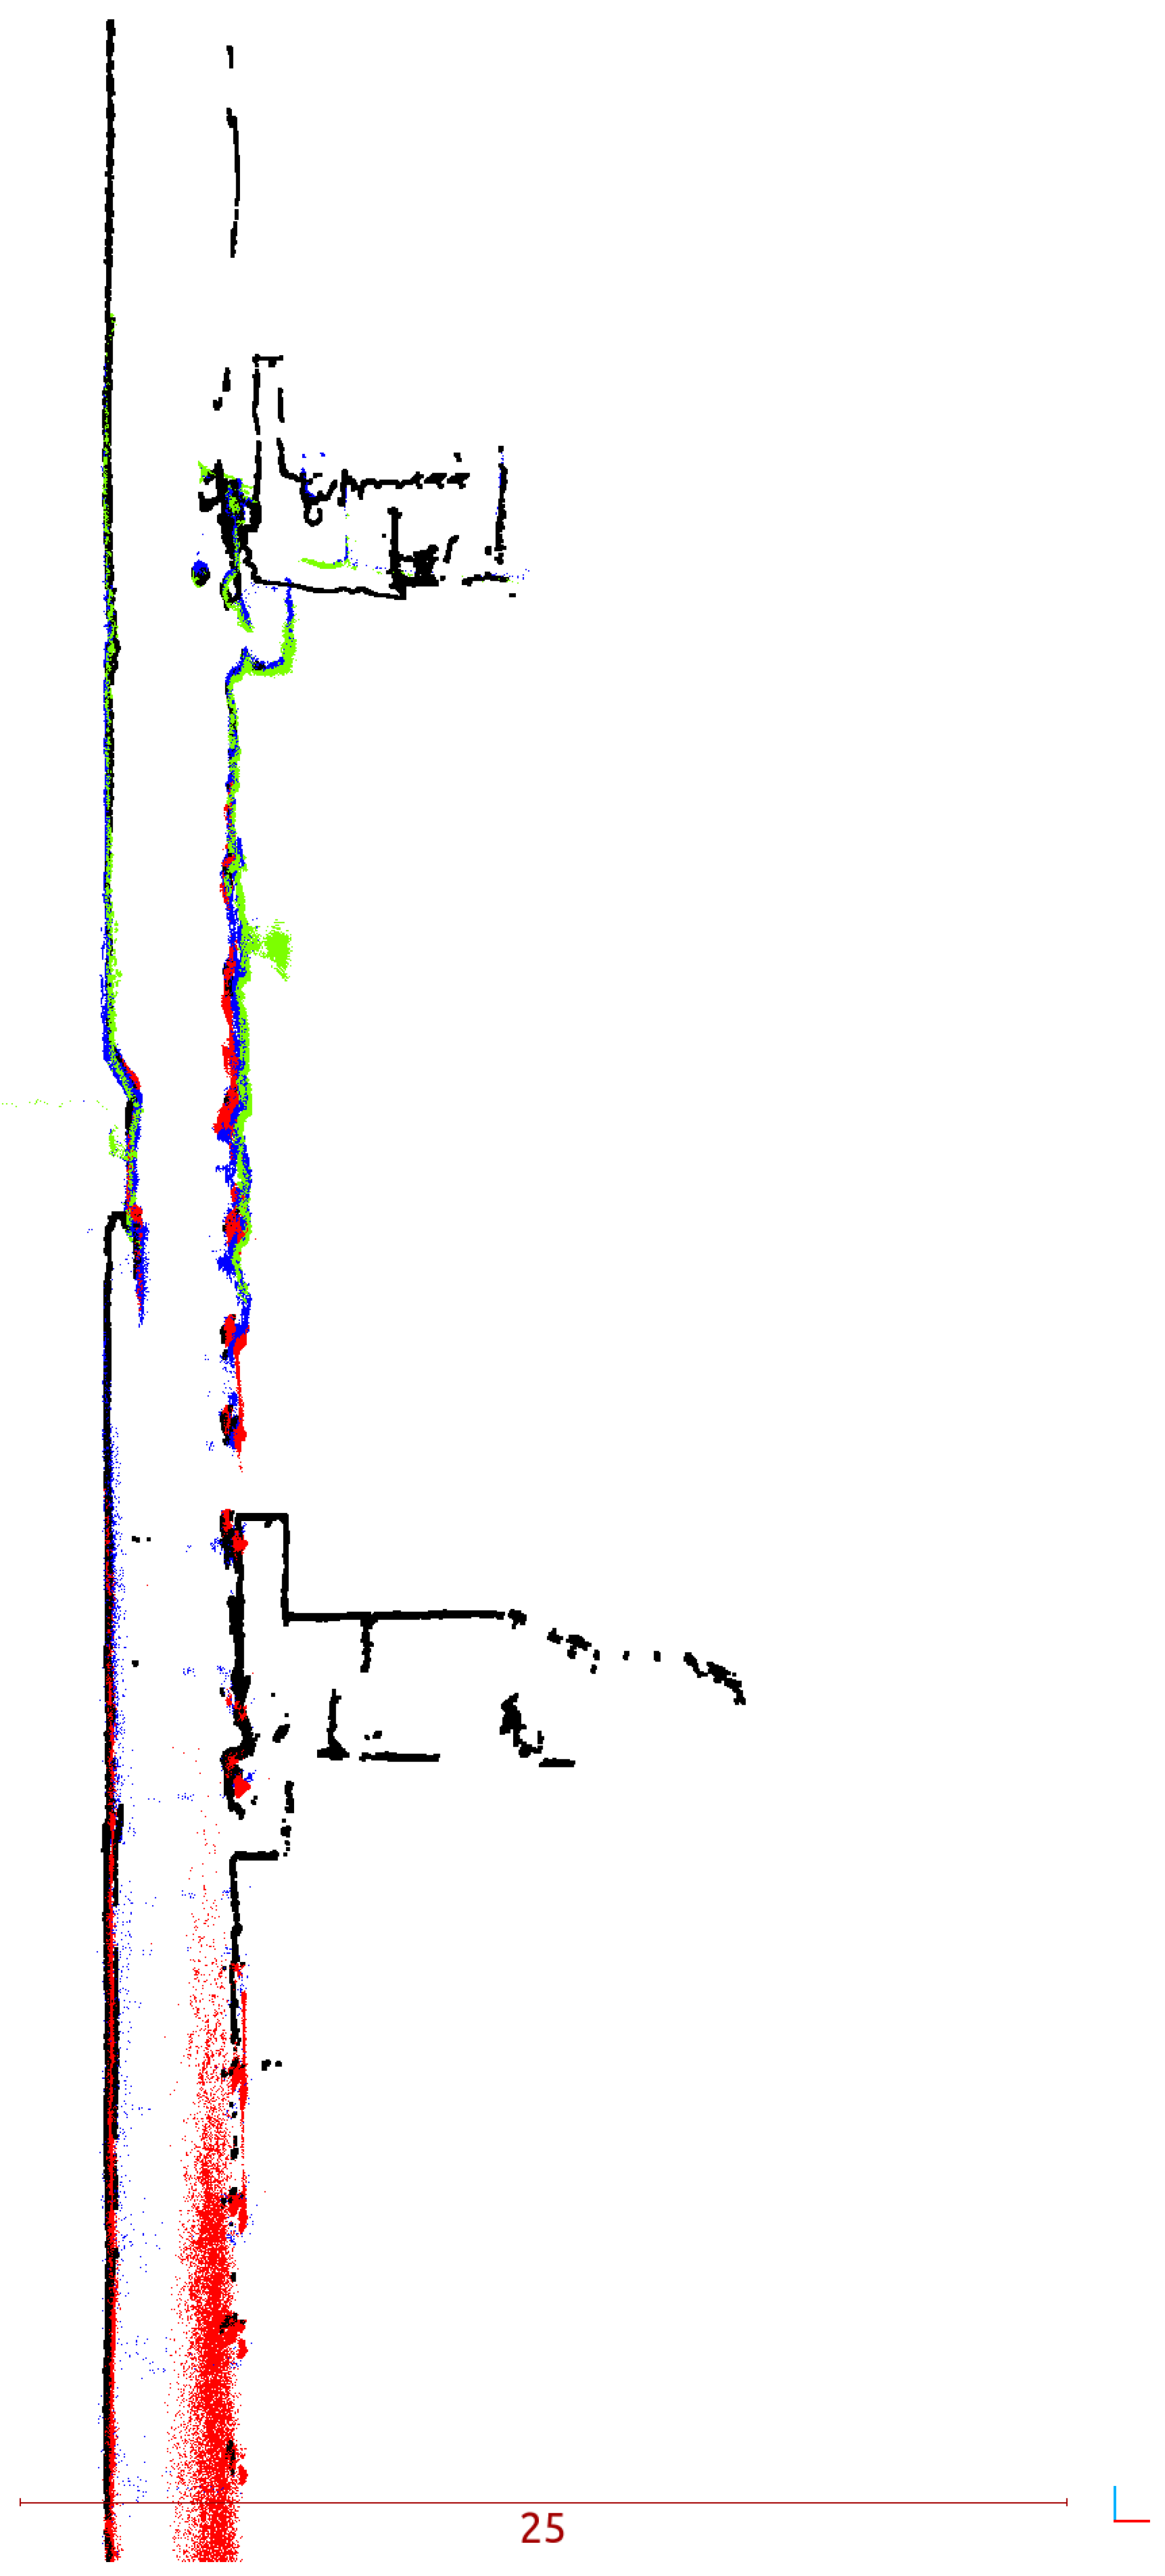
- vertically oriented 3D point cloud (dangerous operation for not qualified personnel),
- highly accurate ground truth obtained with geodetic survey,
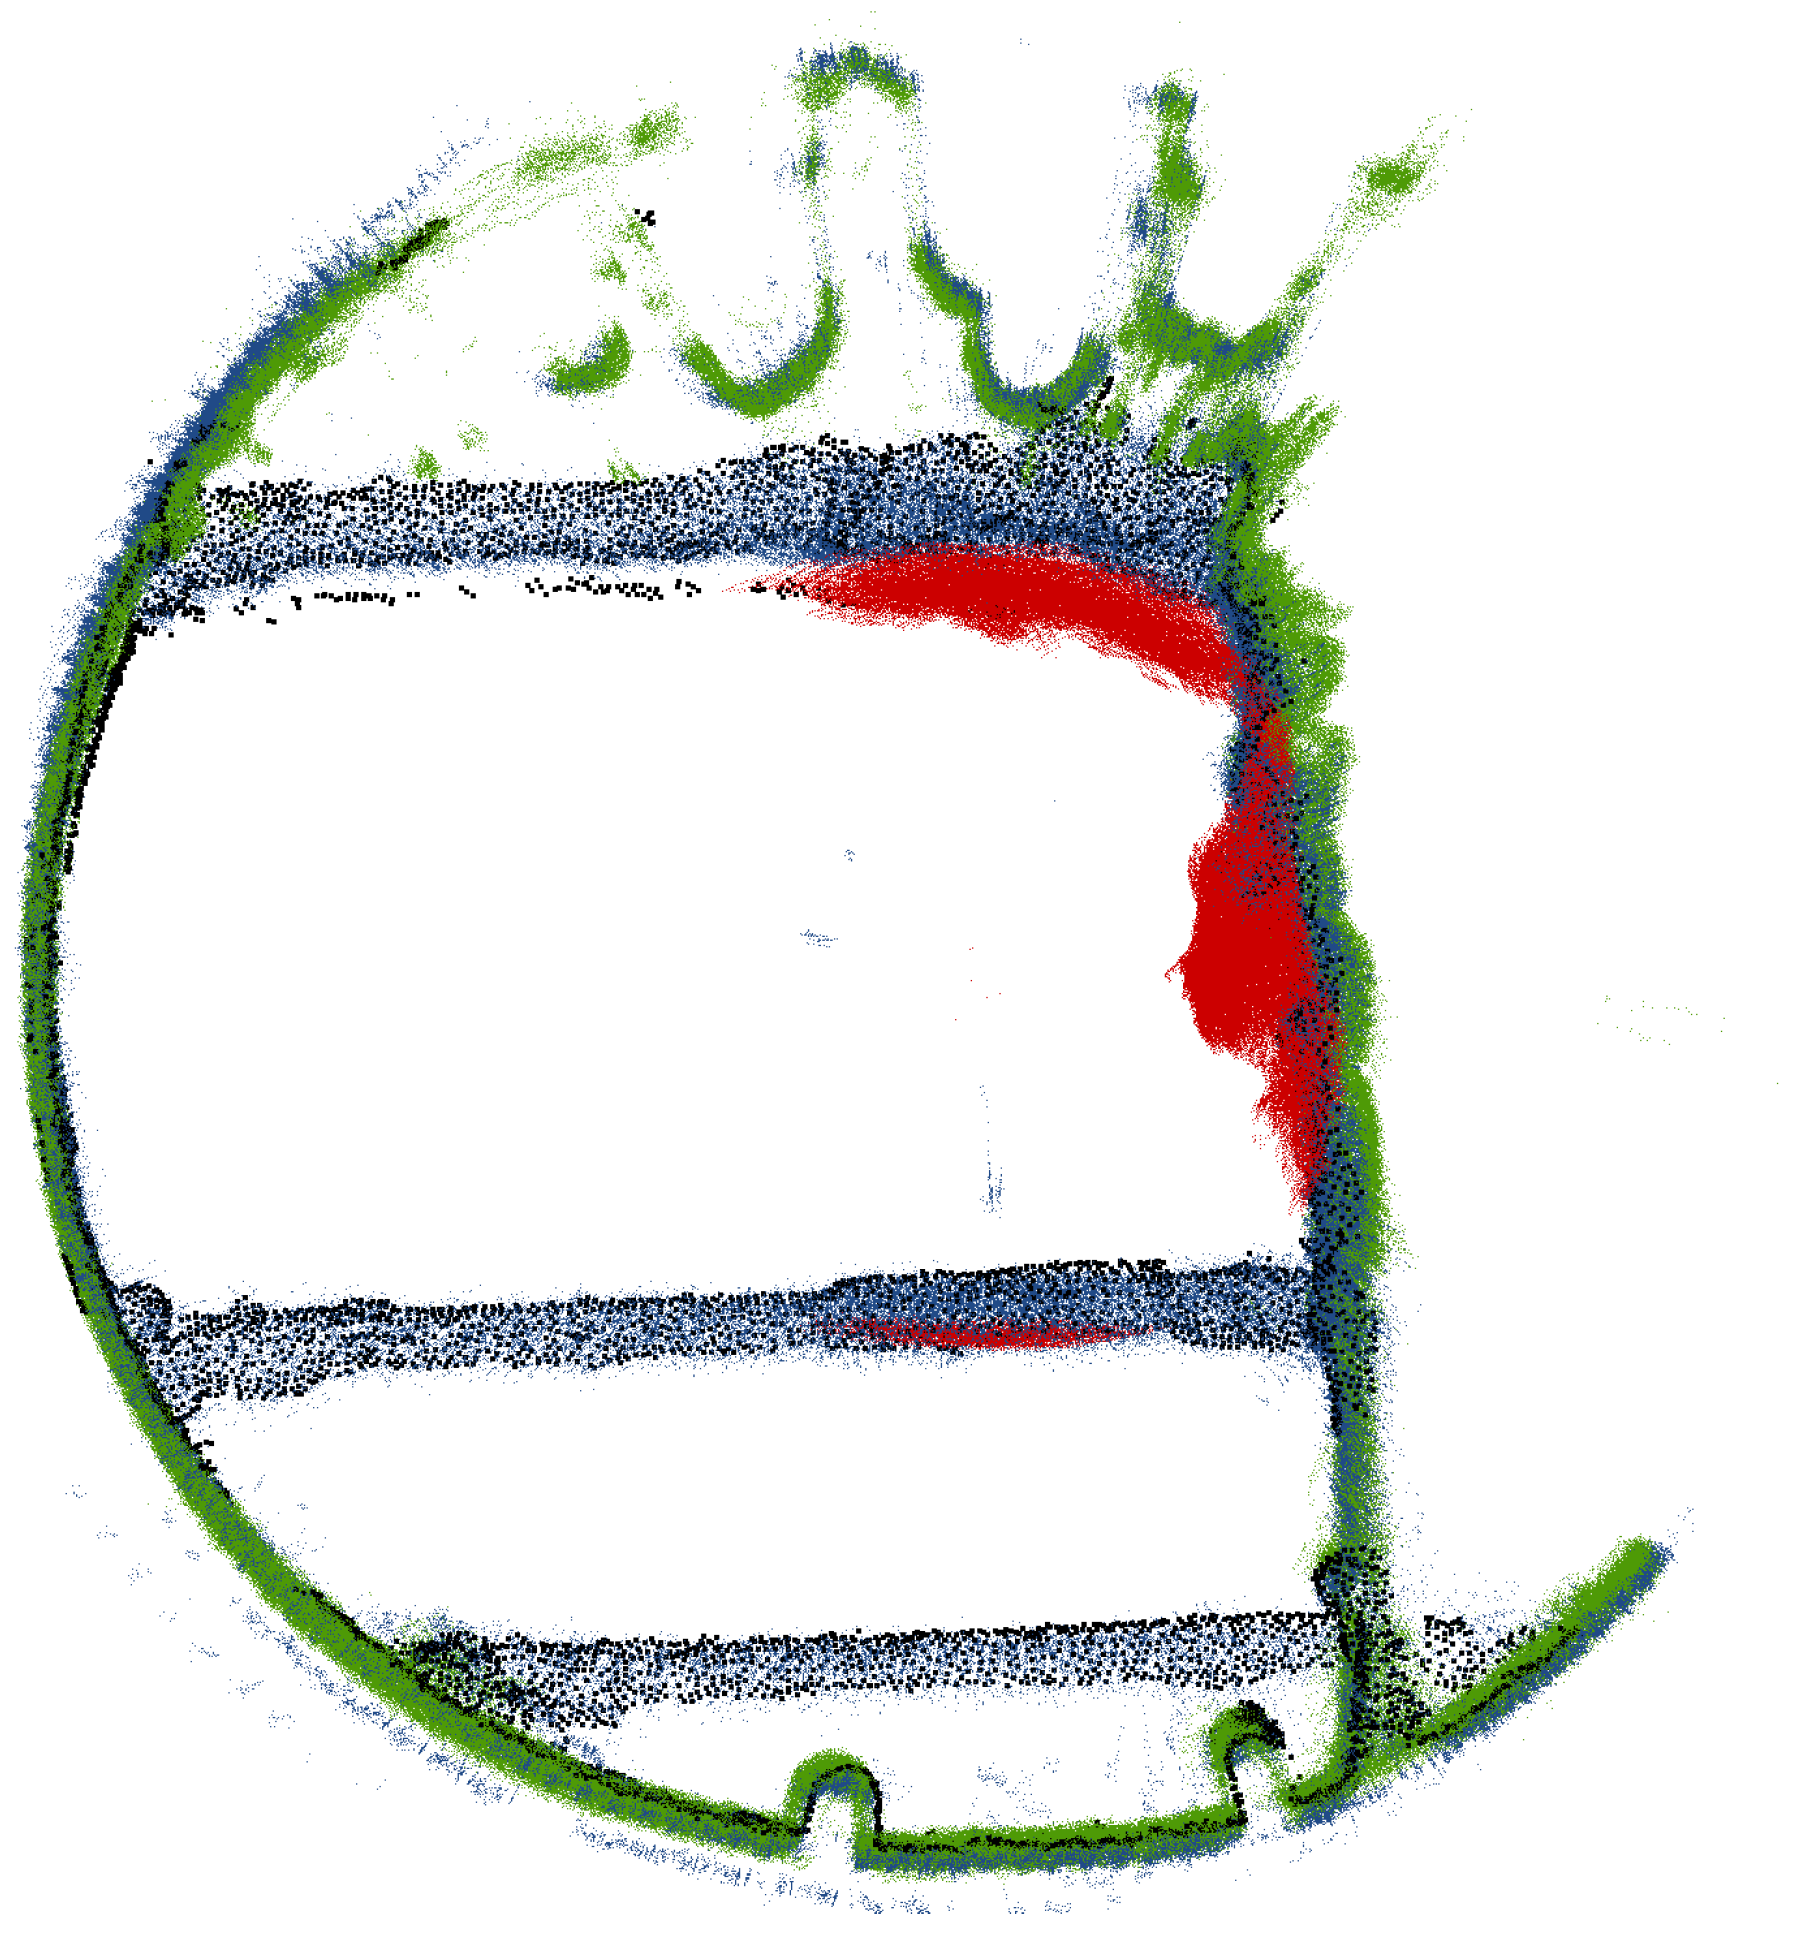
- mixed LiDAR data (repetitive scanning pattern, non repetitive scanning pattern).
Motivation
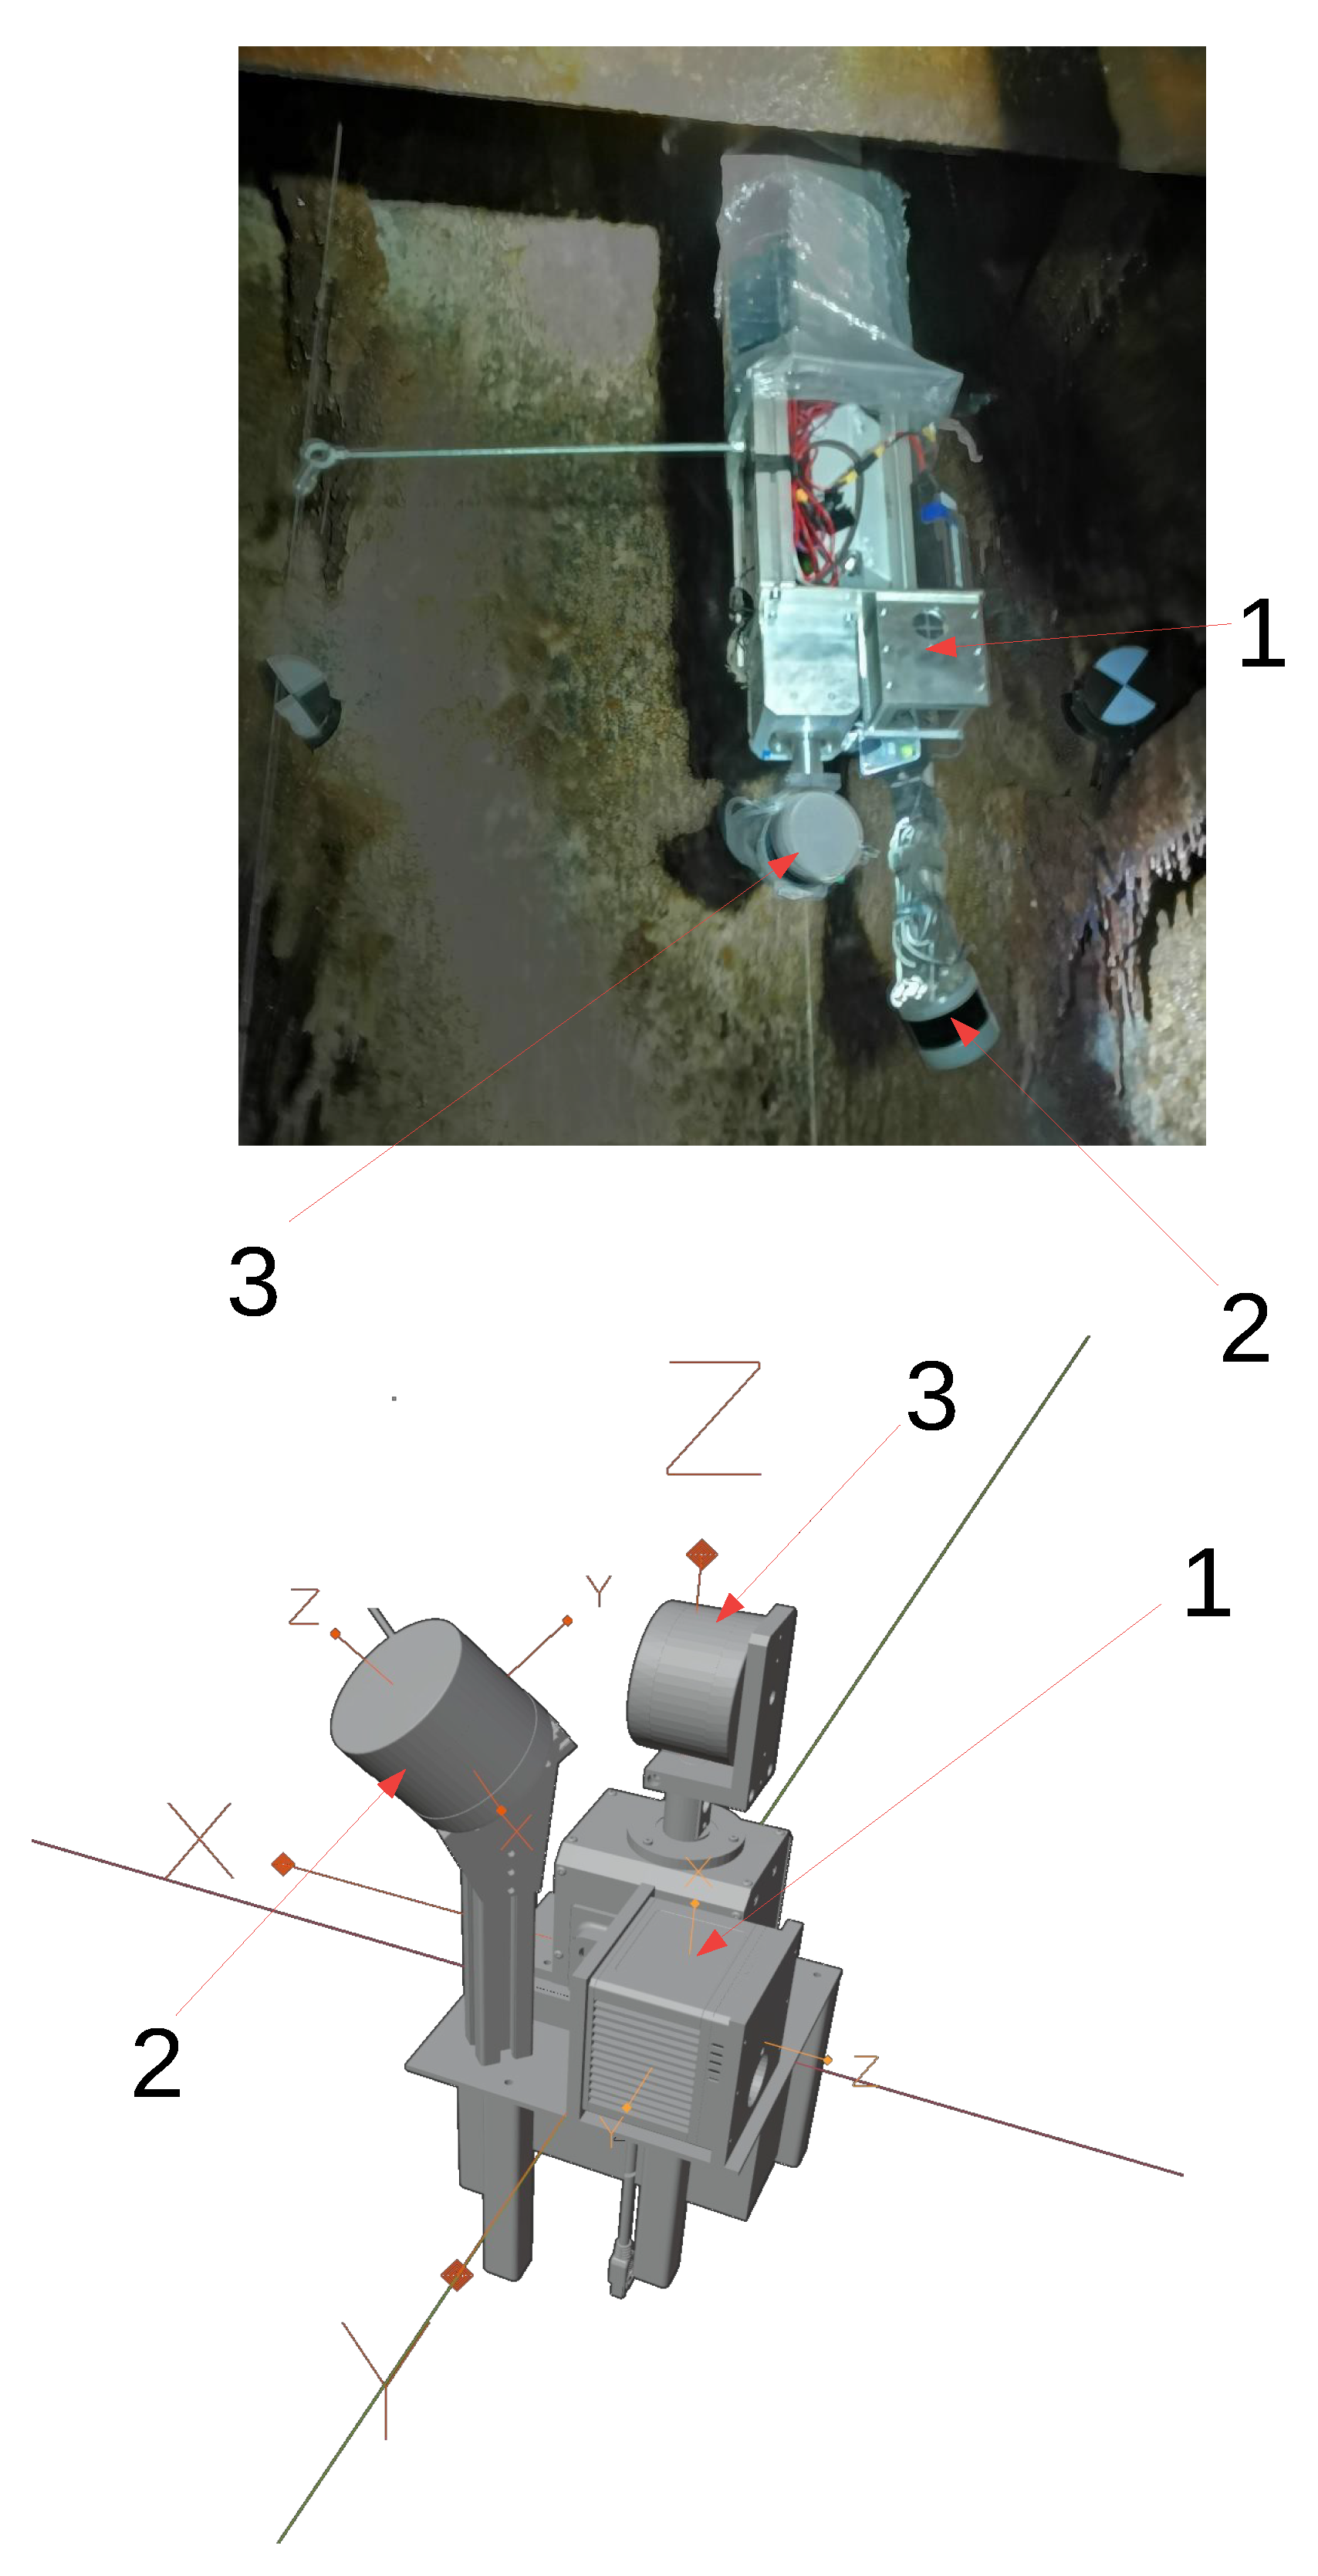
2. Methods
- Livox TELE-15
- Velodyne Puck VLP-16 assembled to rotating turntable
- Velodyne Ultra Puck VLP-32c
3. Materials and Data Sources
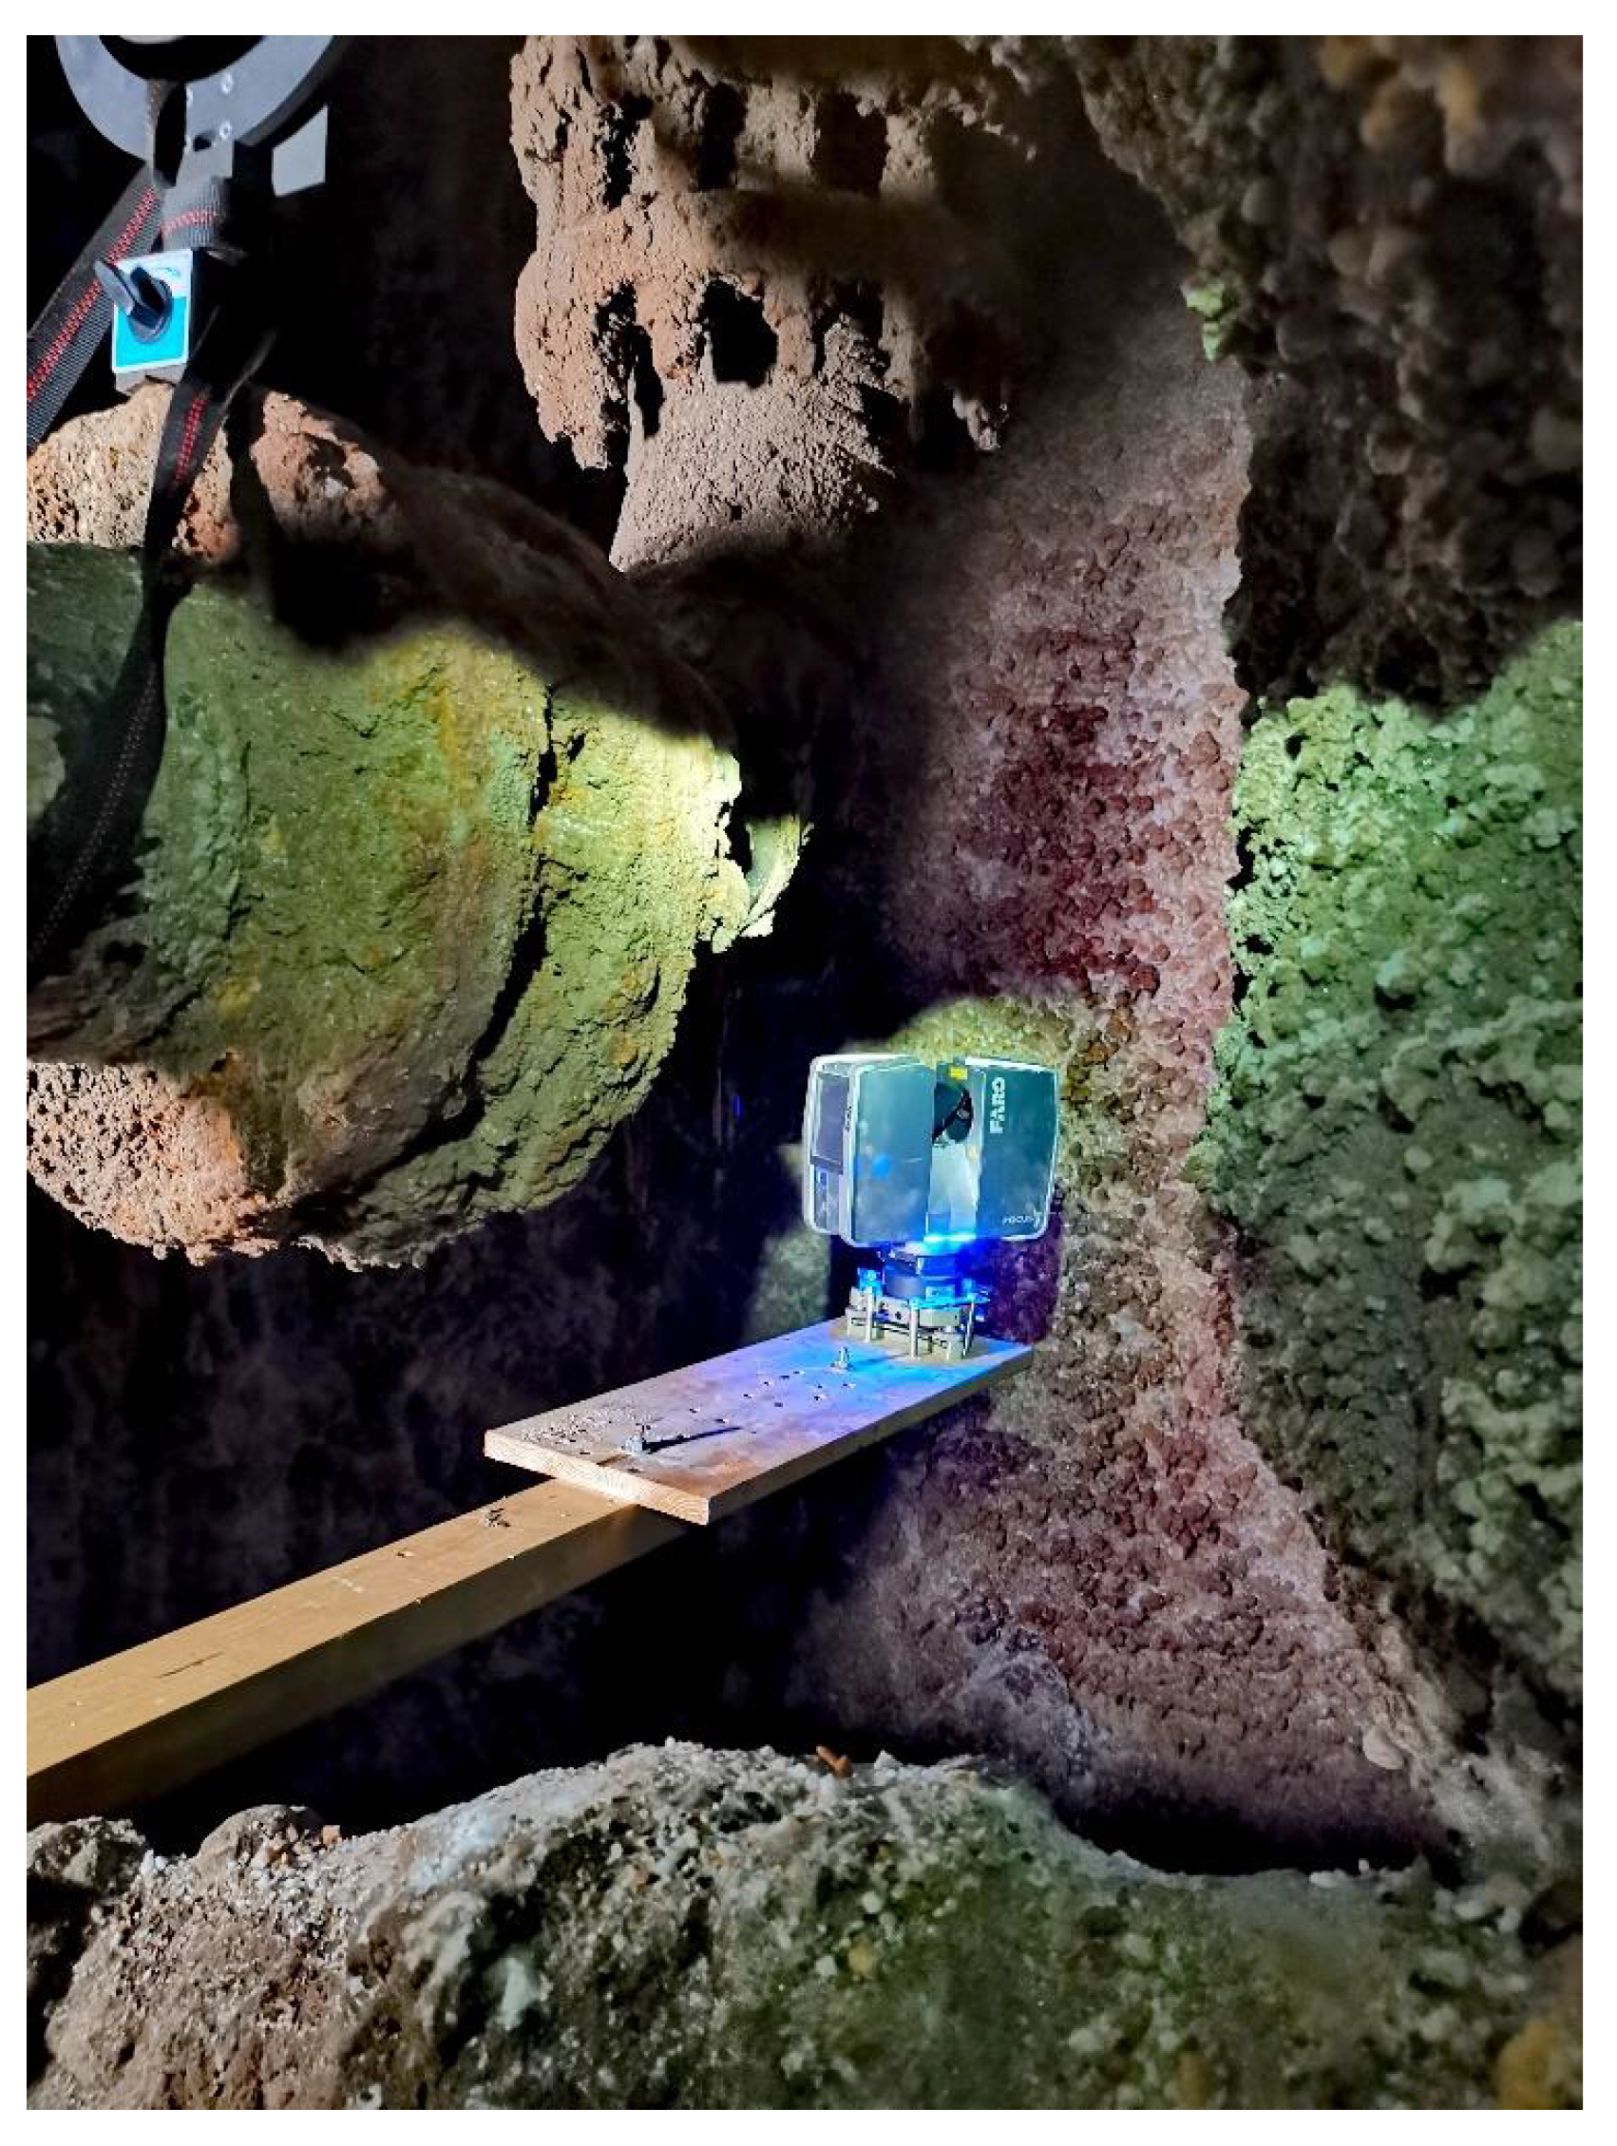
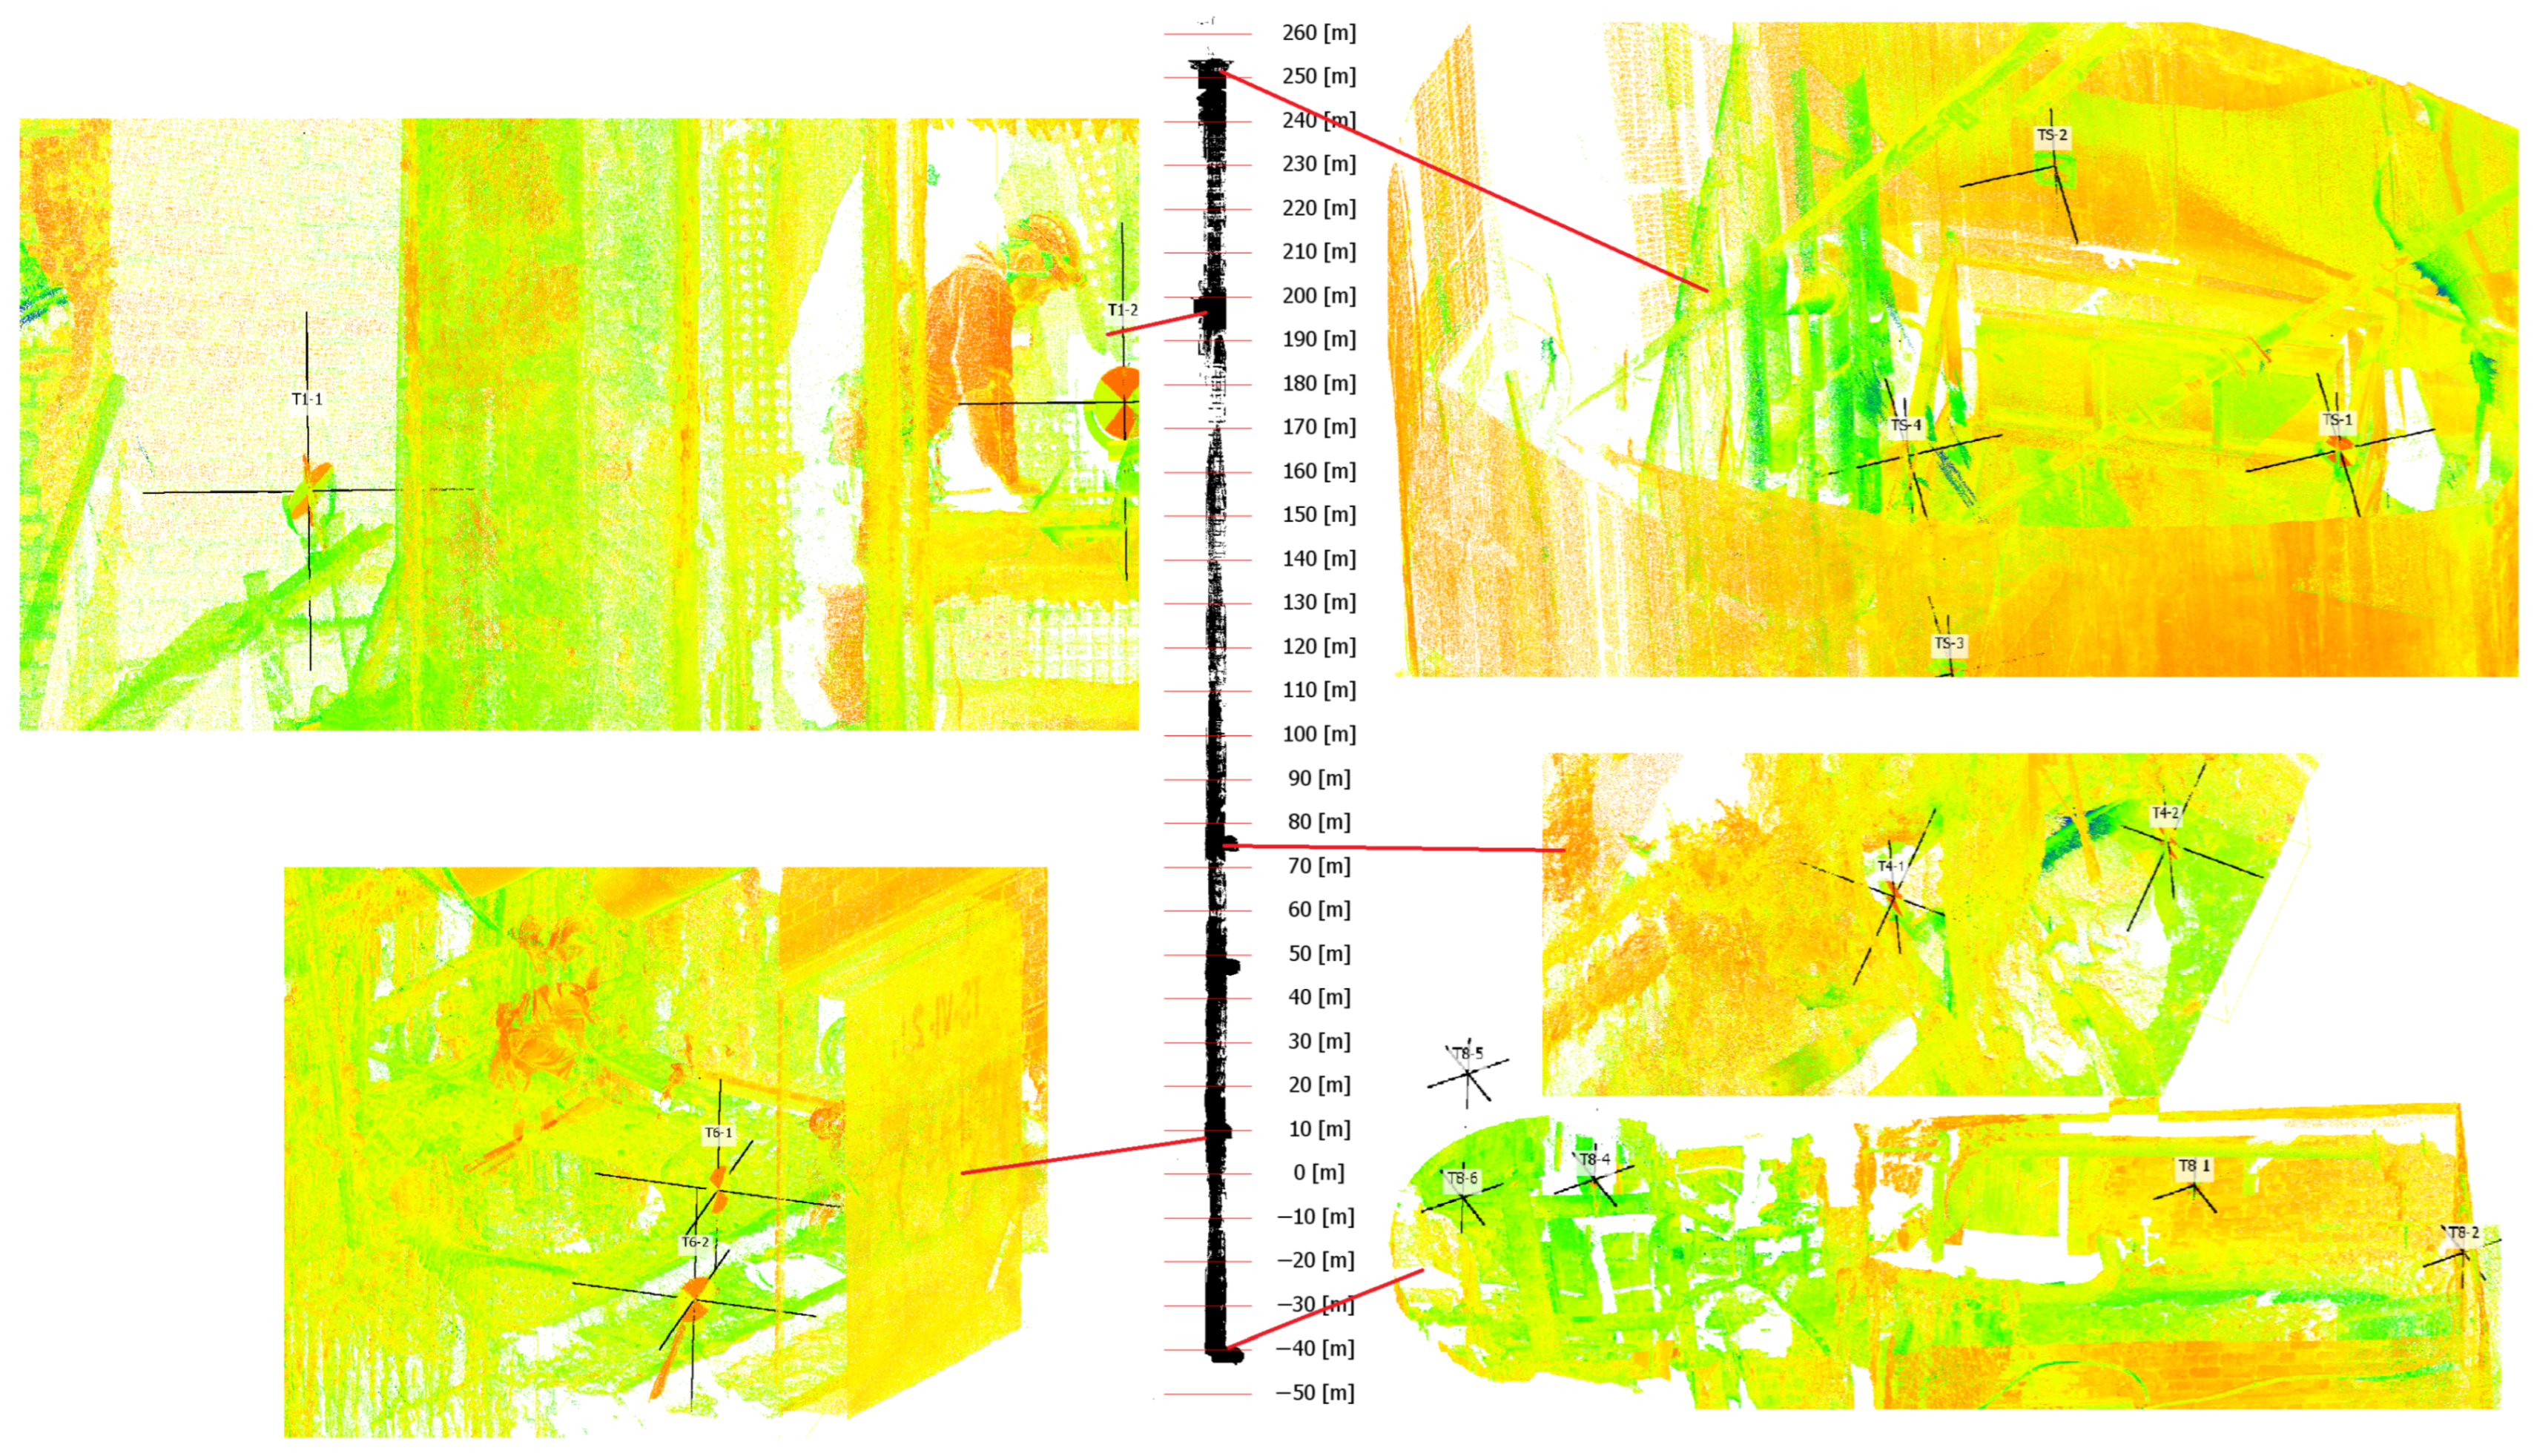
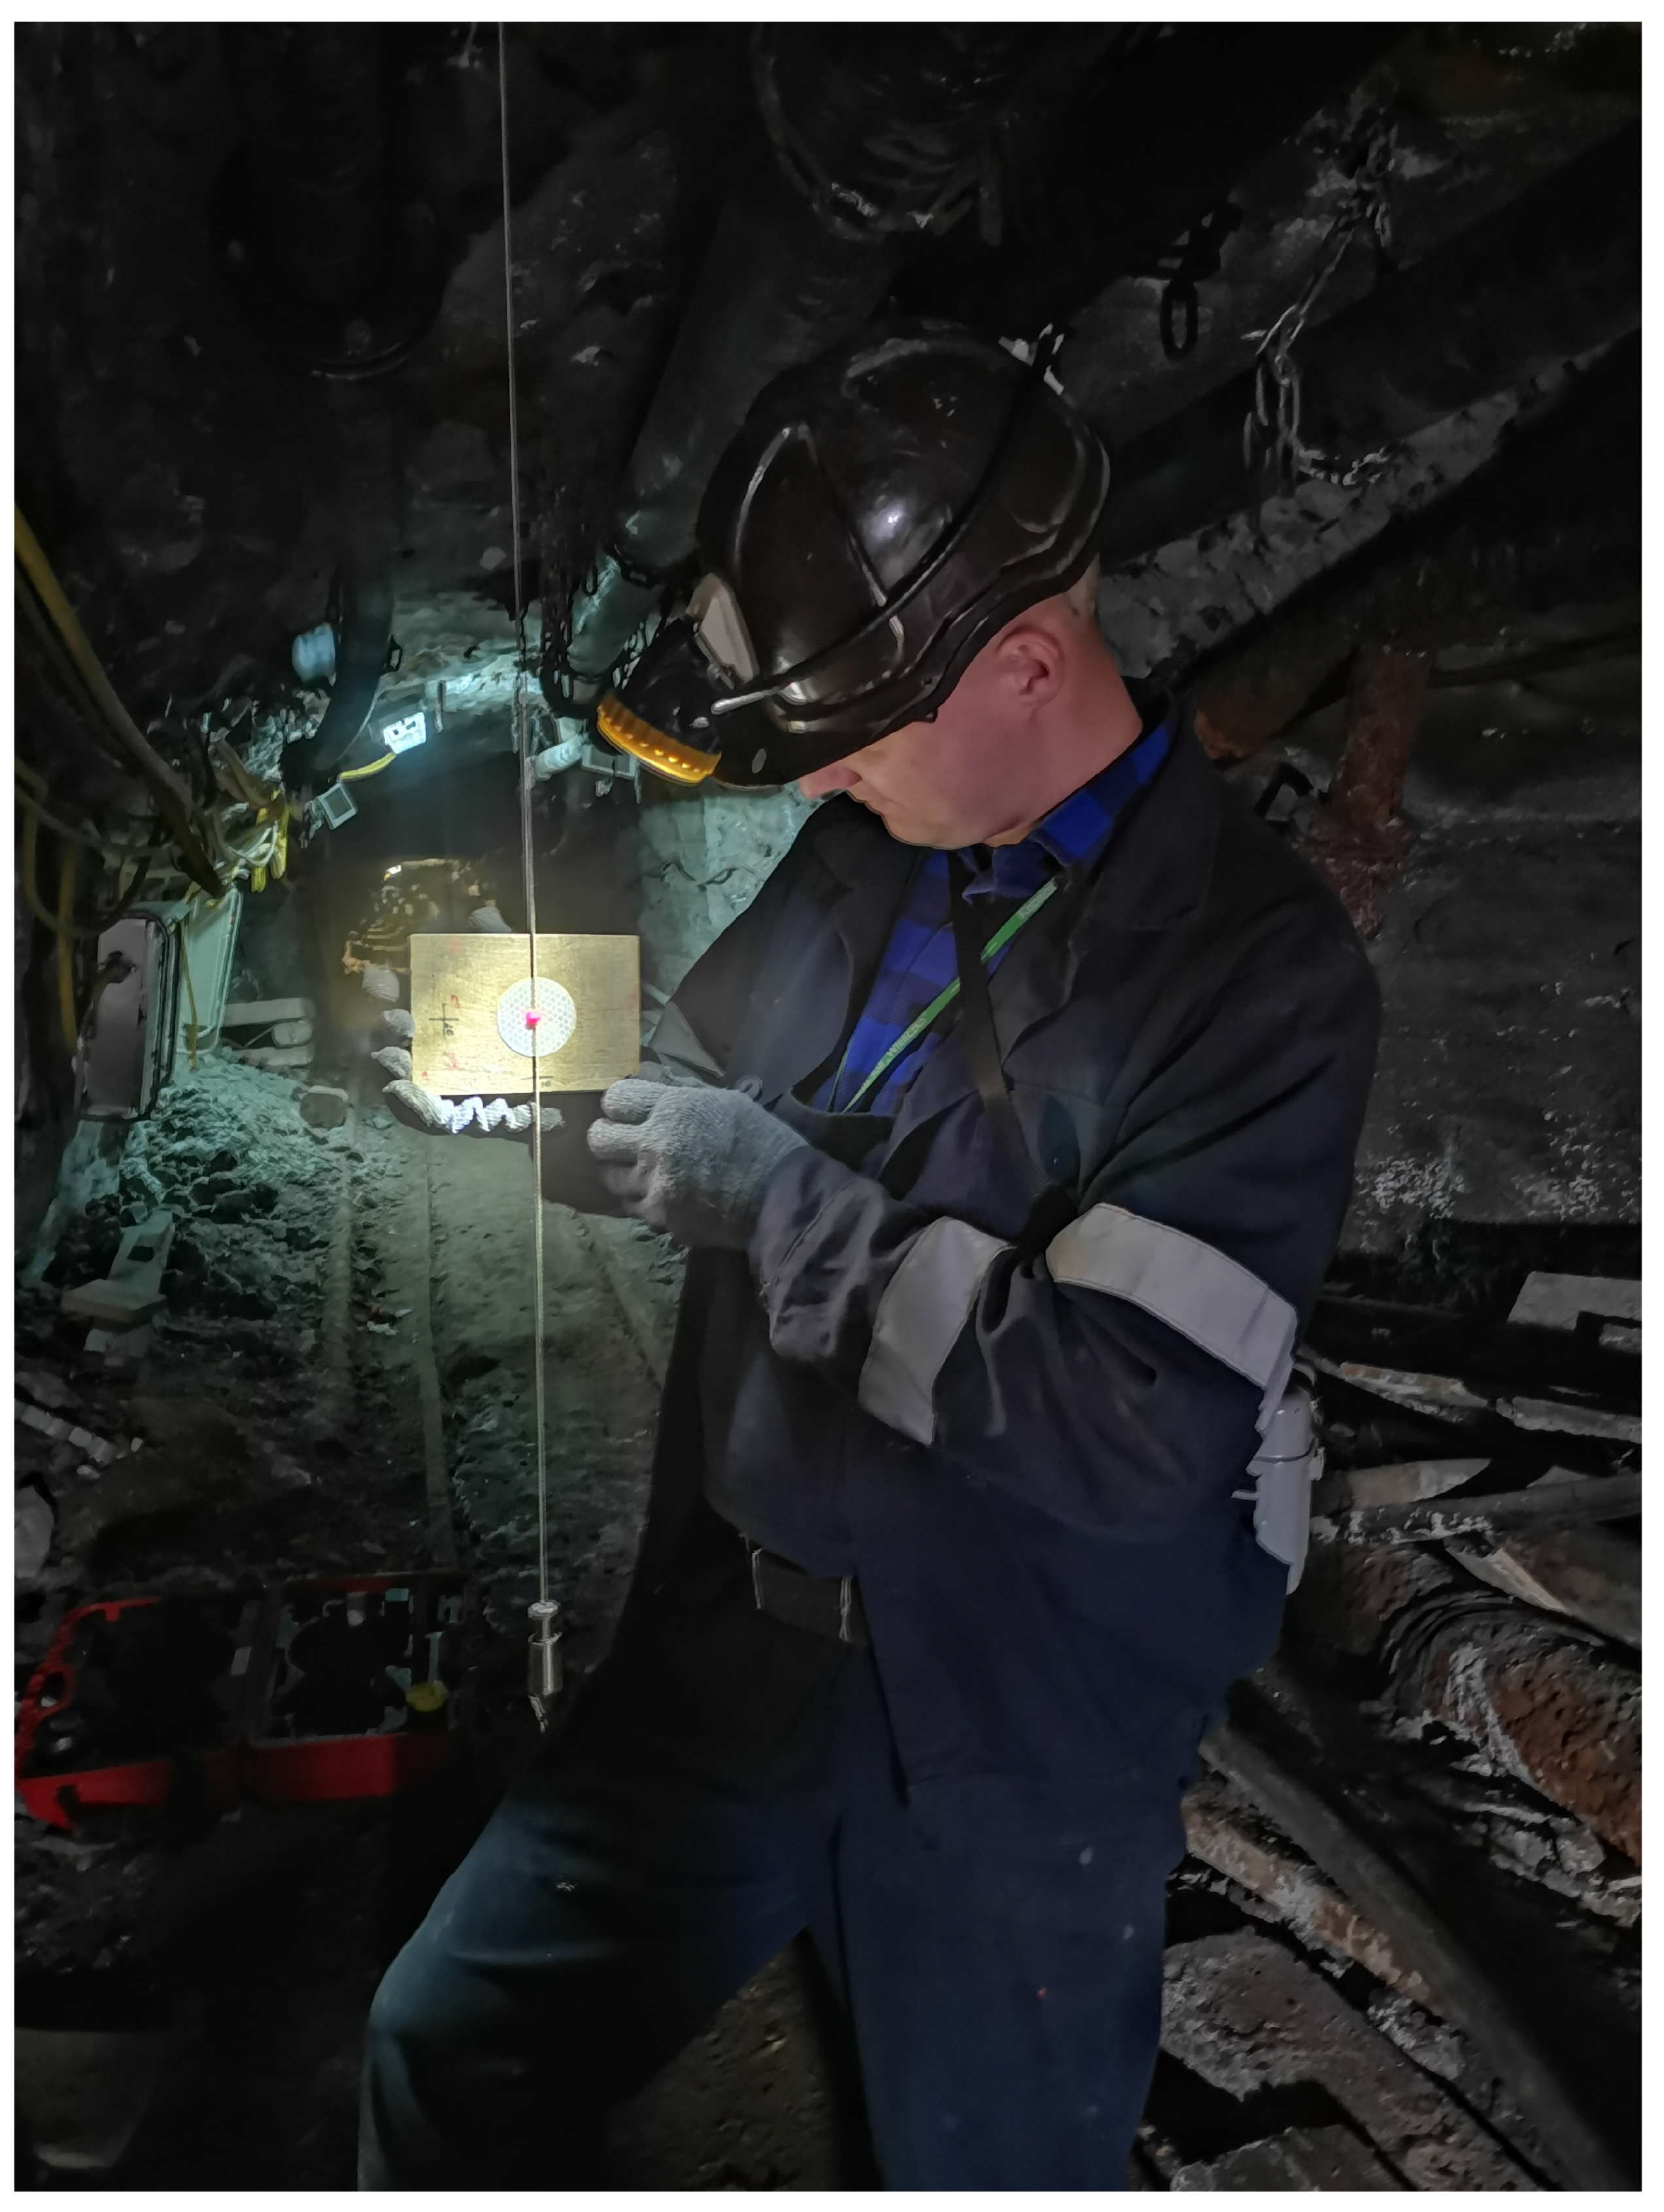
3.1. Ground Truth
3.2. Data Structure
- VLP16: 845 million points.
- VLP32c: 2.30 billion points.
- TELE-15: 970 million points.
- ‘/imu’—Datastream provided by XSens IMU with hardware timestamp.
- ‘/velodyne_rot’—Datastream provided by VLP-16, transformed by rotation, with hardware timestamp.
- ‘/velodyne’—Datastream provided by VLP-32C, in the local coordinate system, with hardware timestamp.
- ‘/livox’—Datastream provided by TELE-15, in the local coordinate system, with hardware timestamp.
- ‘/tf’—Dynamic transformation (rotation) of the VLP16.
- ‘/tf_static’—Static transformation carrying CAD calibration.
3.3. Electronic Design
4. Results and Analysis
5. Discussion
6. Potential Applications
7. Conclusions
Author Contributions
Funding
Institutional Review Board Statement
Informed Consent Statement
Data Availability Statement
Conflicts of Interest
Abbreviations
| AI | Artificial intelligence |
| GPS | Global positioning system |
| TLS | Terrestrial laser scanner |
| IMU | Inertial measurement unit |
| LiDAR | Light detection and ranging |
| PPS | Pulse per second |
| ROS | Robot operating system |
| SDK | Software development kit |
| UDP | User datagram protocol |
References
- Leung, K.Y.K.; Lühr, D.; Houshiar, H.; Inostroza, F.; Borrmann, D.; Adams, M.; Nüchter, A.; del Solar, J.R. Chilean Underground Mine Dataset. Int. J. Robot. Res. (IJRR) 2017, 36, 16–23. Available online: https://dataset.amtc.cl/ (accessed on 20 April 2024). [CrossRef]
- Baek, J.; Park, J.; Cho, S.; Lee, C. 3D Global Localization in the Underground Mine Environment Using Mobile LiDAR Mapping and Point Cloud Registration. Sensors 2022, 22, 2873. [Google Scholar] [CrossRef] [PubMed]
- Chen, M.; Yan, W.; Feng, Y.; Wang, S.; Liang, Q. Large-Scale Underground Mine Positioning and Mapping with LiDAR-Based Semantic Intersection Detection. Min. Metall. Explor. 2023, 40, 2007–2021. [Google Scholar] [CrossRef]
- Chen, C.; Zhou, J.; Zhou, T.; Yong, W. Evaluation of vertical shaft stability in underground mines: Comparison of three weight methods with uncertainty theory. Nat. Hazards 2021, 109, 1457–1479. [Google Scholar] [CrossRef]
- Tranzatto, M.; Miki, T.; Dharmadhikari, M.; Bernreiter, L.; Kulkarni, M.; Mascarich, F.; Andersson, O.; Khattak, S.; Hutter, M.; Siegwart, R.; et al. CERBERUS in the DARPA Subterranean Challenge. Sci. Robot. 2022, 7, eabp9742. [Google Scholar] [CrossRef]
- Rogers, J.G.; Gregory, J.M.; Fink, J.; Stump, E. Test Your SLAM! The SubT-Tunnel dataset and metric for mapping. In Proceedings of the 2020 IEEE International Conference on Robotics and Automation (ICRA), Paris, France, 31 May–31 August 2020; pp. 955–961. [Google Scholar] [CrossRef]
- Rogers, J.G.; Schang, A.; Nieto-Granda, C.; Ware, J.; Carter, J.; Fink, J.; Stump, E. The DARPA SubT Urban Circuit Mapping Dataset and Evaluation Metric. In Experimental Robotics. ISER 2020; Siciliano, B., Laschi, C., Khatib, O., Eds.; Springer Proceedings in Advanced Robotics; Springer: Cham, Switzerland, 2021; Volume 19. [Google Scholar]
- Zhao, S.; Singh, D.; Sun, H.; Jiang, R.; Gao, Y.; Wu, T.; Karhade, J.; Whittaker, C.; Higgins, I.; Xu, J.; et al. SubT-MRS: A subterranean, multi-robot, multi-spectral and multi-degraded dataset for robust SLAM. arXiv 2023, arXiv:2307.07607. [Google Scholar] [CrossRef]
- Li, G.; Zhu, C.; He, M.; Zuo, Y.; Gong, F.; Xue, Y.; Feng, G. Intelligent method for parameters optimization of cable in soft rock tunnel base on longitudinal wave velocity. Tunn. Undergr. Space Technol. 2023, 133, 104905. [Google Scholar] [CrossRef]
- Adamek, A.; Będkowski, J. Automated Mobile System for Mapping Mine Shafts. 2021. Available online: https://www.gim-international.com/content/article/automated-mobile-system-for-mapping-mine-shafts (accessed on 20 April 2024).
- Dong, Z.; Liang, F.; Yang, B.; Xu, Y.; Zang, Y.; Li, J.; Wang, Y.; Dai, W.; Fan, H.; Hyyppä, J.; et al. Registration of large-scale terrestrial laser scanner point clouds: A review and benchmark. ISPRS J. Photogramm. Remote Sens. 2020, 163, 327–342. [Google Scholar] [CrossRef]
- Jeong, J.; Cho, Y.; Shin, Y.S.; Roh, H.; Kim, A. Complex urban dataset with multi-level sensors from highly diverse urban environments. Int. J. Robot. Res. 2019, 38, 642–657. [Google Scholar] [CrossRef]
- Maddern, W.; Pascoe, G.; Linegar, C.; Newman, P. 1 year, 1000 km: The Oxford RobotCar dataset. Int. J. Robot. Res. 2017, 36, 3–15. [Google Scholar] [CrossRef]
- Zlot, R.; Bosse, M. Efficient Large-scale Three-dimensional Mobile Mapping for Underground Mines. J. Field Robot. 2014, 31, 758–779. [Google Scholar] [CrossRef]
- Zlot, R. Efficient and Versatile 3D Laser Mapping for Challenging Environments. In Proceedings of the ICPRAM 2014—3rd International Conference on Pattern Recognition Applications and Methods, Loire Valley, France, 6–8 March 2014. [Google Scholar]
- Bai, C.; Xiao, T.; Chen, Y.; Wang, H.; Zhang, F.; Gao, X. Faster-LIO: Lightweight Tightly Coupled Lidar-Inertial Odometry Using Parallel Sparse Incremental Voxels. IEEE Robot. Autom. Lett. 2022, 7, 4861–4868. [Google Scholar] [CrossRef]
- Liu, Z.; Zhang, F.; Hong, X. Low-Cost Retina-like Robotic Lidars Based on Incommensurable Scanning. IEEE/ASME Trans. Mechatronics 2022, 27, 58–68. [Google Scholar] [CrossRef]
- Będkowski, J.; Pełka, M. Affordable Robotic Mobile Mapping System Based on Lidar with Additional Rotating Planar Reflector. Sensors 2023, 23, 1551. [Google Scholar] [CrossRef]
- Pełka, M. Mine Mapping Dataset. 2023. Available online: https://github.com/michalpelka/mine-mapping-dataset#extrinisic-calibration---experimental (accessed on 20 April 2024).
- Gharineiat, Z.; Tarsha Kurdi, F.; Campbell, G. Review of automatic processing of topography and surface feature identification LiDAR data using machine learning techniques. Remote Sens. 2022, 14, 4685. [Google Scholar] [CrossRef]
- Mirzaei, K.; Arashpour, M.; Asadi, E.; Masoumi, H.; Bai, Y.; Behnood, A. 3D point cloud data processing with machine learning for construction and infrastructure applications: A comprehensive review. Adv. Eng. Inform. 2022, 51, 101501. [Google Scholar] [CrossRef]


| Ground Control Point ID | x [m] | y [m] | z [m] | Uncertainty [sigma] |
|---|---|---|---|---|
| TS-1 | −86,345.352 | 22,671.020 | 249.098 | 5 mm |
| TS-2 | −86,346.390 | 22,672.932 | 249.391 | 5 mm |
| TS-3 | −86,347.665 | 22,669.905 | 249.503 | 5 mm |
| TS-4 | −86,347.457 | 22,671.858 | 248.701 | 5 mm |
| T1-1 | −86,347.239 | 22,668.482 | 196.697 | 7 mm |
| T1-2 | −86,347.484 | 22,671.017 | 196.918 | 7 mm |
| T4-1 | −86,346.082 | 22,672.304 | 75.892 | 10 mm |
| T4-2 | −86,345.222 | 22,673.541 | 74.974 | 10 mm |
| T6-1 | −86,345.387 | 22,673.960 | 8.564 | 14 mm |
| T6-2 | −86,344.347 | 22,674.161 | 8.564 | 14 mm |
| T8-1 | −86,345.550 | 22,678.609 | −41.371 | 20 mm |
| T8-2 | −86,343.015 | 22,680.587 | −41.152 | 20 mm |
| T8-4 | −86,347.258 | 22,671.981 | −40.004 | 20 mm |
| T8-5 | −86,347.847 | 22,670.668 | −38.436 | 20 mm |
| T8-6 | −86,346.088 | 22,669.629 | −38.438 | 20 mm |
| Sensor | Type | Extrinsic Calibration | Output |
|---|---|---|---|
| Livox Tele-15 | LiDAR | x, y, z, intensity | |
| VLP-32c | LiDAR | x, y, z, intensity | |
| VLP-16 rotation base | LiDAR | x, y, z, intensity | |
| IMU | Inertial Measurement Unit | accelerations, rotation velocities |
| Sensor | Basic Information |
|---|---|
| Livox TELE-15 | Range: up to 500 m |
| Range Precision: up to 2 cm | |
| Laser Wavelength: 905 nm | |
| Laser Safety: Class 1 | |
| Number of lasers (channels): 1 | |
| Scanning pattern: non repetitive | |
| documentation | https://www.livoxtech.com/tele-15/specs (accessed on 20 April 2024) |
| Velodyne VLP-16 | Range: up to 100 m |
| Range Precision: up to 3 cm | |
| Laser Wavelength: 903 nm | |
| Laser Safety: Class 1 | |
| Number of lasers (channels): 16 | |
| Scanning pattern: repetitive | |
| documentation | https://velodynelidar.com/products/puck/ (accessed on 20 April 2024) |
| Velodyne VLP-32c | Range: up to 200 m |
| Range Precision: up to 3 cm | |
| Laser Wavelength: 903 nm | |
| Laser Safety: Class 1 | |
| Number of lasers (channels): 32 | |
| Scanning pattern: repetitive | |
| documentation | https://velodynelidar.com/products/ultra-puck/ (accessed on 20 April 2024) |
| Xsens MTi-30 | Angular resolution 0.05 deg |
| Repeatability: 0.2 deg | |
| Static accuracy(roll/pitch): 0.5 deg | |
| Static accuracy(heading): 1 deg | |
| Dynamic accuracy: 2 deg RMS | |
| documentation | https://shop-us.xsens.com/shop/mti-10-series/mti-30-ahrs/ (accessed on 20 April 2024) |
| Sensor | Basic Information |
|---|---|
| FARO Focus 3D | Range on white surface: |
| up to 150 m | |
| Range on black surface: | |
| up to 50 m | |
| Range precision on white surface: | |
| up to 0.1 mm | |
| Range precision on black surface: | |
| up to 0.7 mm | |
| Angular accuracy: 19 arcsec | |
| Accuracy of 3D point at | |
| 10 m: 2 mm | |
| Accuracy of 3D point at | |
| 25 m: 3.5 mm | |
| Laser Wavelength: 1553.5 nm | |
| Laser Safety: Class 1 | |
| documentation | https://www.faro.com/en/Resource-Library/Brochure/FARO-Focus-Premium (accessed on 20 April 2024) |
| Stationary Scan | Number of 3D Points | Elevation min [m] | Elevation max [m] |
|---|---|---|---|
| Surface | 48,494,798 | 192.57 | 254.2 |
| Level 1 | 48,116,790 | 178.72 | 254.18 |
| Level 4 | 24,305,044 | 38.66 | 112.31 |
| Level 5 | 40,505,015 | −4.62 | 112.28 |
| Level 6 | 63,493,077 | −41.26 | 58.65 |
| Level 8 | 48,870,208 | −43.37 | −7.39 |
Disclaimer/Publisher’s Note: The statements, opinions and data contained in all publications are solely those of the individual author(s) and contributor(s) and not of MDPI and/or the editor(s). MDPI and/or the editor(s) disclaim responsibility for any injury to people or property resulting from any ideas, methods, instructions or products referred to in the content. |
© 2024 by the authors. Licensee MDPI, Basel, Switzerland. This article is an open access article distributed under the terms and conditions of the Creative Commons Attribution (CC BY) license (https://creativecommons.org/licenses/by/4.0/).
Share and Cite
Adamek, A.; Będkowski, J.; Kamiński, P.; Pasek, R.; Pełka, M.; Zawiślak, J. Method for Underground Mining Shaft Sensor Data Collection. Sensors 2024, 24, 4119. https://doi.org/10.3390/s24134119
Adamek A, Będkowski J, Kamiński P, Pasek R, Pełka M, Zawiślak J. Method for Underground Mining Shaft Sensor Data Collection. Sensors. 2024; 24(13):4119. https://doi.org/10.3390/s24134119
Chicago/Turabian StyleAdamek, Artur, Janusz Będkowski, Paweł Kamiński, Rafał Pasek, Michał Pełka, and Jan Zawiślak. 2024. "Method for Underground Mining Shaft Sensor Data Collection" Sensors 24, no. 13: 4119. https://doi.org/10.3390/s24134119
APA StyleAdamek, A., Będkowski, J., Kamiński, P., Pasek, R., Pełka, M., & Zawiślak, J. (2024). Method for Underground Mining Shaft Sensor Data Collection. Sensors, 24(13), 4119. https://doi.org/10.3390/s24134119