Article

An Inertial-Based Wearable System for Monitoring Vital Signs during Sleep

1
PD Neurotechnology Ltd., 45500 Ioannina, Greece
2
Department of Physiology, Faculty of Medicine, School of Health Sciences, University of Ioannina, 45110 Ioannina, Greece
3
University Hospital of Ioannina and Faculty of Medicine, School of Health Sciences, University of Ioannina, 45110 Ioannina, Greece
*
Author to whom correspondence should be addressed.
Sensors 2024, 24(13), 4139; https://doi.org/10.3390/s24134139
Submission received: 26 April 2024 / Revised: 17 June 2024 / Accepted: 22 June 2024 / Published: 26 June 2024
(This article belongs to the Section Physical Sensors)

Abstract

:
This study explores the feasibility of a wearable system to monitor vital signs during sleep. The system incorporates five inertial measurement units (IMUs) located on the waist, the arms, and the legs. To evaluate the performance of a novel framework, twenty-three participants underwent a sleep study, and vital signs, including respiratory rate (RR) and heart rate (HR), were monitored via polysomnography (PSG). The dataset comprises individuals with varying severity of sleep-disordered breathing (SDB). Using a single IMU sensor positioned at the waist, strong correlations of more than 0.95 with the PSG-derived vital signs were obtained. Low inter-participant mean absolute errors of about 0.66 breaths/min and 1.32 beats/min were achieved, for RR and HR, respectively. The percentage of data available for analysis, representing the time coverage, was 98.3% for RR estimation and 78.3% for HR estimation. Nevertheless, the fusion of data from IMUs positioned at the arms and legs enhanced the inter-participant time coverage of HR estimation by over 15%. These findings imply that the proposed methodology can be used for vital sign monitoring during sleep, paving the way for a comprehensive understanding of sleep quality in individuals with SDB.

1. Introduction

Monitoring of vital signs provides valuable insights into a person’s overall health. Substantial evidence indicates that the prediction of potentially severe adverse clinical events, such as cardiac arrest [1] and respiratory failure [2], relies on the identification of abnormalities in vital signs. The respiratory rate (RR) and the heart rate (HR) are considered to be the most significant vital signs in assessing physiological deterioration [3] and determining the need for admission to the Intensive Care Unit (ICU) [4]. Furthermore, the continuous monitoring allows healthcare professionals to assess disease trends and treatment outcomes [5], as well as to reduce the occurrence of post-surgical complications [6]. For decades, assessing vital signs required the use of cumbersome and expensive equipment, causing patient discomfort and limiting their use in certain applications such as ambulatory monitoring or home care settings [7].
In the era of wearables, a wide range of sensors have become essential for non-intrusive remote patient monitoring [8]. The main technologies utilized for continuous monitoring of cardiorespiratory parameters include the electrocardiogram (ECG) [9,10,11], the photoplethysmogram [12,13,14], and the respiratory inductance plethysmography [15]. The aforementioned signals are considered the gold standard in monitoring vital signs and usually they are collected through the use of patches, textile sensors, chest straps, and wristbands, with the latter gaining greater popularity thanks to the commercial progress of fitness trackers [16]. Indirect measurement of both cardiac and respiratory changes can also be achieved by monitoring body motion. Body movements due to the ejection of blood into the great vessels with each heartbeat and breathing have been recorded with multiple types of sensors, including both wearables and non-wearables, which are capable of measuring displacement, acceleration, or angular velocity [17]. For instance, the ballistocardiogram (BCG) records the displacement of the body’s center of mass (resulting from blood circulation and heart displacement) throughout the cardiac cycle [18]. BCG is used mainly in sleep assessment to monitor vital signs, with sensors integrated into objects like mattresses, pillows, and beds [19]. In the case of wearable sensors, the seismocardiogram (SCG) and the gyrocardiogram (GCG) capture the compression waves of the heart contraction by attaching an accelerometer and a gyroscope, respectively, to various body locations (e.g., chest, arms, head, or feet) [20,21]. When inertial sensors are placed near the chest, the accelerations and angular velocities they measure are also affected by the expansion and contraction of the lungs, thus allowing breathing monitoring [22].
The initial attempt to track human vital signs via inertial sensors was conducted in 2006 by Reinvuo et al. [23], who utilized a sensor belt equipped with a dual-axis accelerometer to measure RR. In 2013, Bieber et al. [24] achieved HR monitoring when a wrist-worn three-axis (3D) accelerometer was positioned near the chest. Since then, considerable research has been conducted to explore the potential use of SCG and GCG to monitor vital signs. The majority of studies have thoroughly explored the effectiveness of inertial sensors in situations with minimal motion, such as when individuals are in reclined or seated postures [25,26,27,28,29,30], as well as during sleep monitoring [31,32,33,34,35]. However, there is a limited body of research that has examined the reliability of inertial sensors in ambulatory recordings [36,37,38,39], and among clinical populations, such as ICU patients following hospitalization [40] and individuals with sleep-disordered breathing (SDB) [41,42].
Apart from analyzing sensor type and positioning [43,44,45], there has been significant research conducted to create methodological frameworks aimed at improving the precision of estimating cardiorespiratory parameters. The key concepts of the most widely-used methodologies to increase the signal-to-noise ratio (SNR) involve choosing the optimal axis, combining axes, or performing a subsequent fusion of estimated rates. Simple axis selection strategies include choosing the dorso-ventral axis, which exhibits the strongest cardiorespiratory modulations [30,42], or the one with the highest auto-correlation [41] or frequency power [32] within the expected modulation range. Fusion methods involve various techniques, ranging from basic approaches like calculating the magnitude [35] or averaging normalized waveforms [36] to employing more advanced signal decomposition methods, such as principal component analysis (PCA) and singular spectrum analysis, on axes [29,31] or quaternions [25]. Various techniques for merging estimated rates from different sensors or axes comprise the utilization of a Kalman filter [37] or a weighted average, considering factors such as the amplitude of the maximum spectral peak [28,34], and the similarity with previous estimates [26].
In this study, the feasibility of an inertial-based wearable system to monitor vital signs during sleep is investigated. The system incorporates five inertial measurement units (IMUs) located on the waist, the arms, and the legs. Only a few studies have employed multiple IMUs, but mostly on the torso, to mitigate movement artifacts in ambulatory recordings. This work presents a novel signal processing pipeline that allows the fusion of the most informative axes in a dynamic manner. The methodology is founded upon the application of an SNR-dependent spectral average that has been previously employed in ECG-derived respiration signals [10,13,46]. In this study, a weighted-function is used to amplify SNR for spectra with dominant rate close to previous estimations. The efficacy of the suggested approach is assessed in terms of error and percentage of data discarded due to low SNR in individuals with varying severity of SDB. A comparative analysis with prior research is undertaken, considering factors such as the presence of SDB, the number of sensors and their placement, as well as the fusion methodologies (both intra- and inter-IMU) employed to derive vital signs.

2. Materials and Methods

2.1. Dataset

A total of 23 participants underwent a sleep study in order to examine the feasibility of an IMU-based estimation of vital signs. The studied population is composed of individuals with varying severity of apnea–hypopnea index (AHI), defined as the total number of apneas and hypopneas per hour of sleep. Participants with an AHI of less than 5 events per hour are classified as individuals without obstructive sleep apnea (OSA). An AHI of at least 5 events per hour, but fewer than 15, is the threshold to diagnose mild OSA. Patients with moderate OSA experience 15 to 30 episodes per hour, while in severe OSA, a person will experience 30 or more episodes in an hour. Eligible candidates were adults and were expected to be free from other significant medical conditions that might impact their suitability for the study. The demographic characteristics of the eligible subjects are displayed in Table 1.
The participants completed an overnight polysomnography (PSG) at the Centre of Sleep Disorders located at “Evangelismos” Hospital in Athens, Greece. Vital signs, including RR, f RR ( k ) , and HR, f HR ( k ) , were monitored via PSG at a sampling period of Δ k = 6 s. Additionally, a body-worn IMU system (see description in Section 2.2) was employed to estimate these vital indicators.

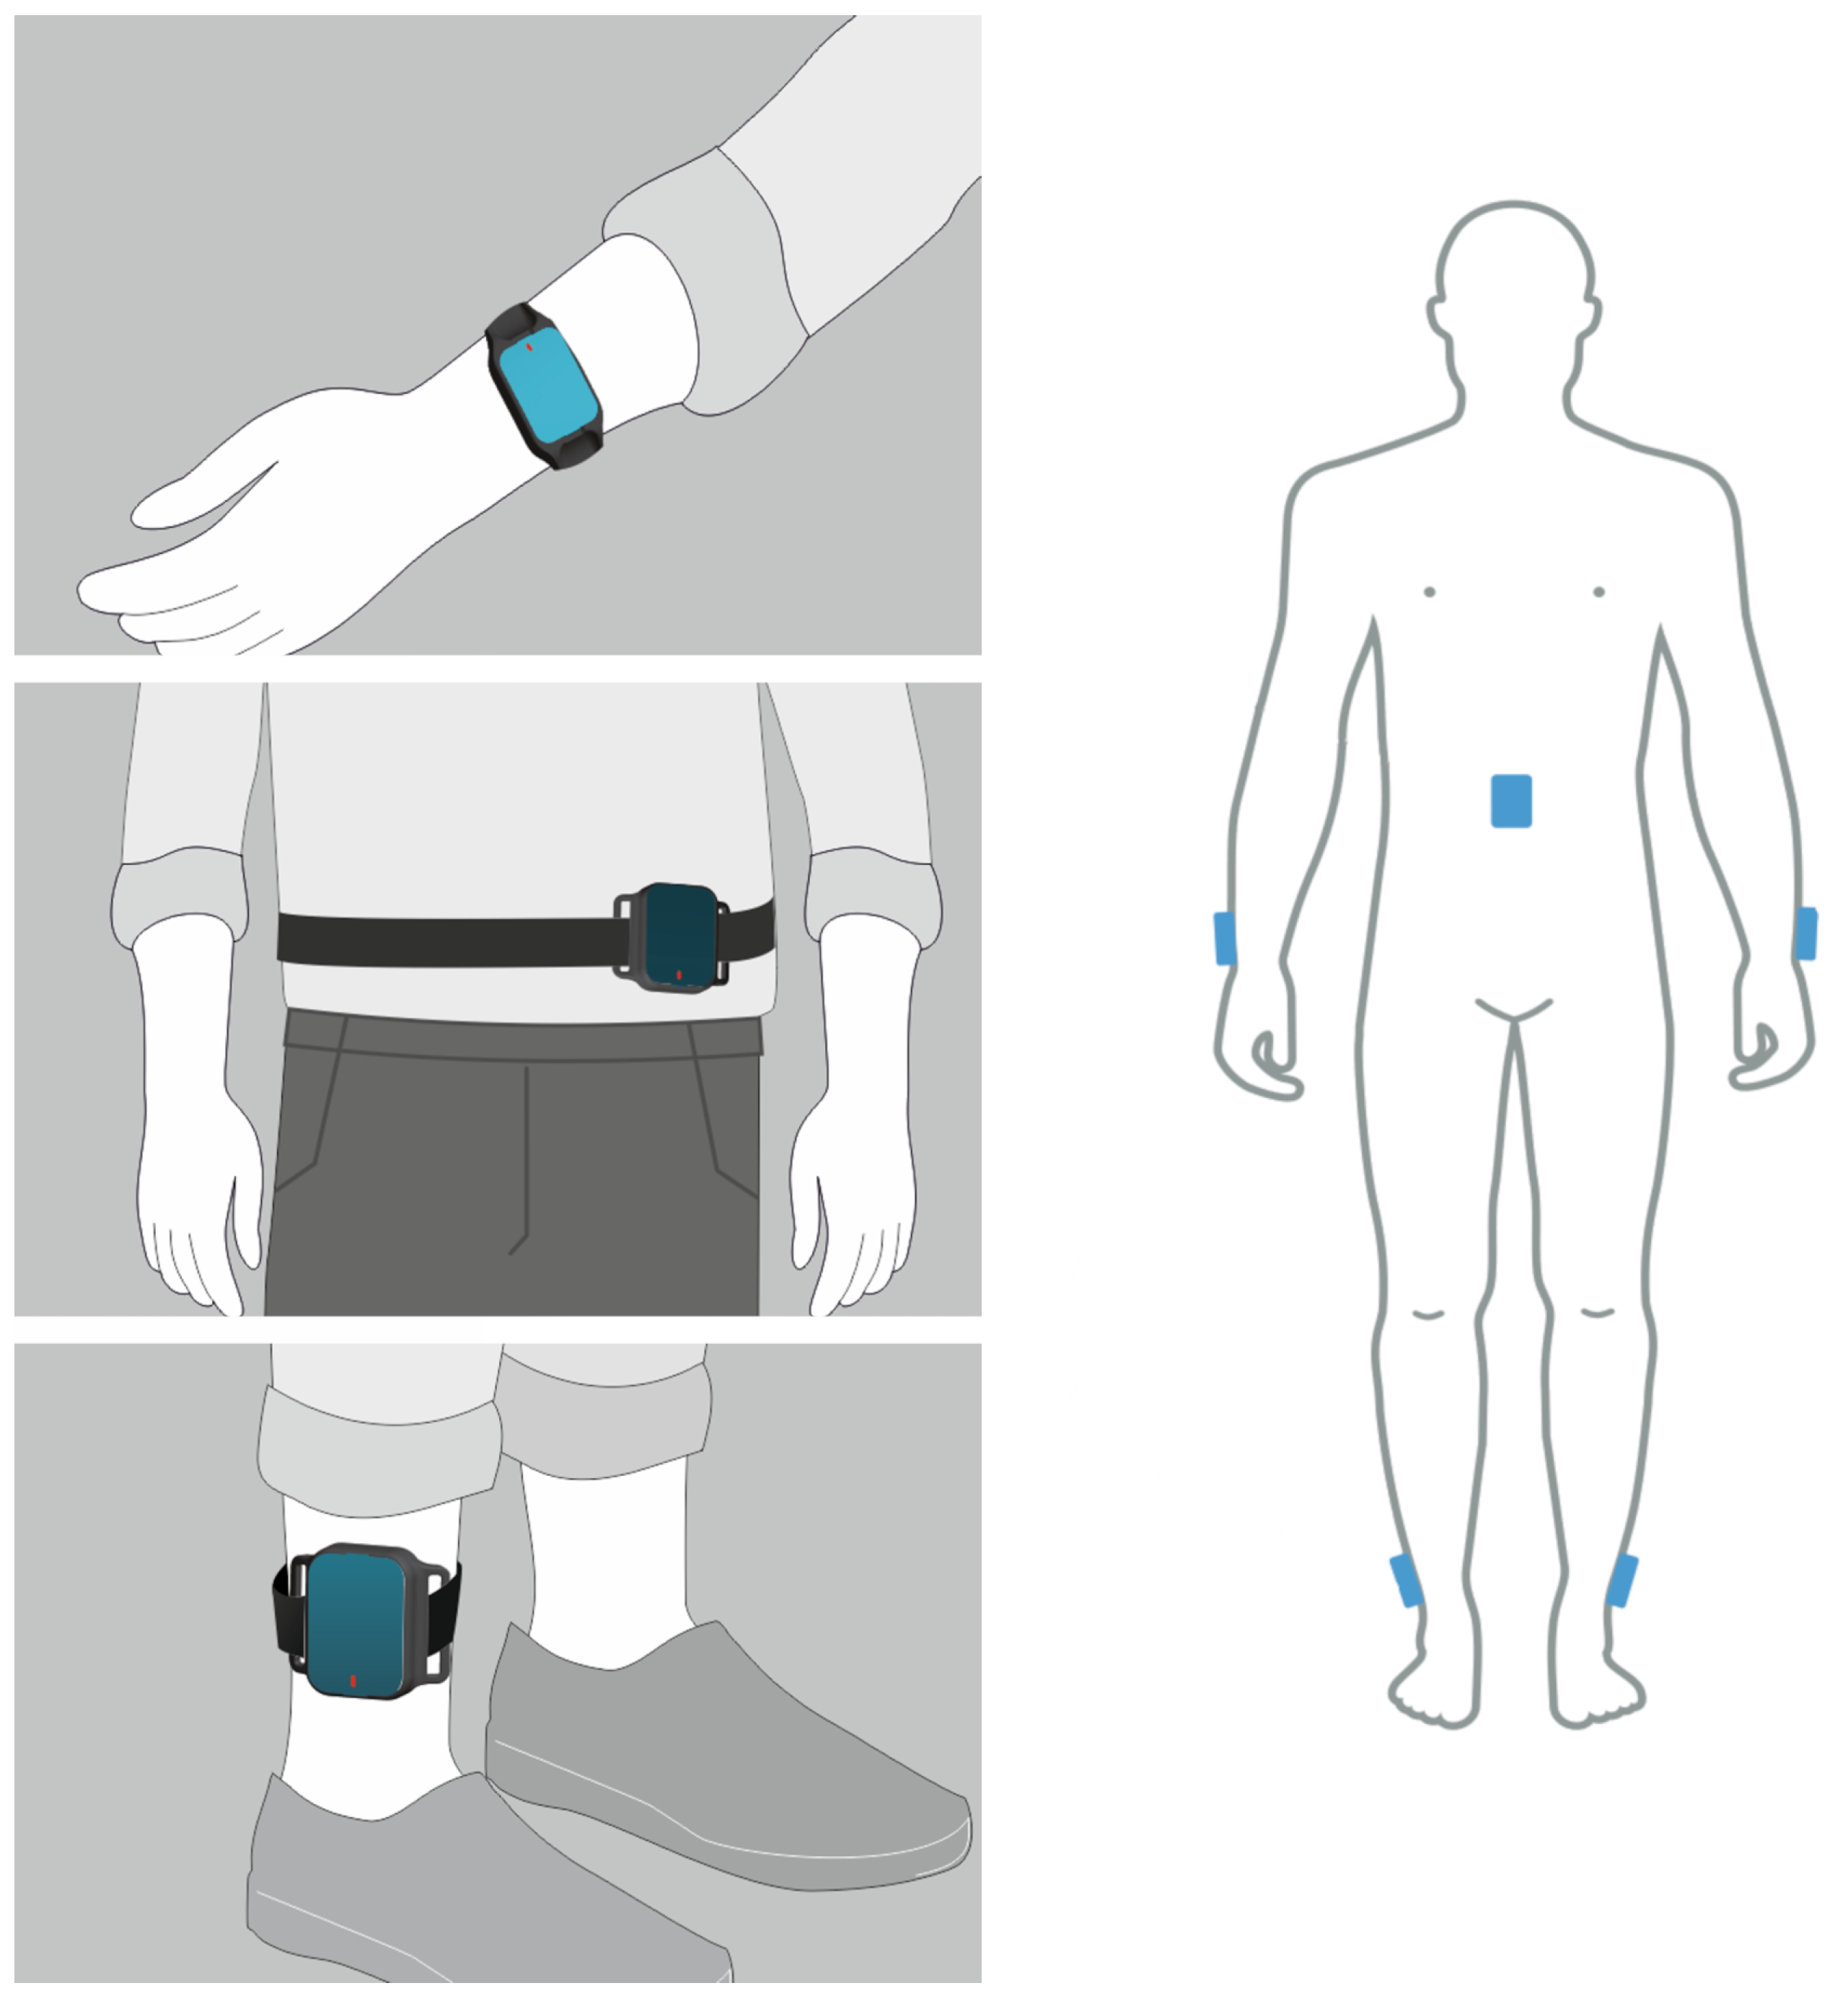
2.2. IMU-Based Wearable System

The body-worn IMU system that was employed to collect motion data was the PDMonitor® system. The PDMonitor® is a class IIa CE-marked medical device, developed by PD Neurotechnology Ltd., and was designed for continuous home monitoring of patients who have been diagnosed with Parkinson’s Disease (PD). The system consists of five 9-degree IMU sensors that collect motion data at 59.5 Hz sampling frequency. Each IMU sensor is an LSM9DS1 from ST Microelectronics with linear acceleration full scale of ±4 g, a magnetic field full scale of ±4 gauss, and an angular rate of ±500 dps. The monitoring devices were placed on the waist, wrists, and ankles, as illustrated in Figure 1. More details about PDMonitor® can be found in [47,48].

2.3. IMU-Derived Vital Signs

In this study, a novel signal processing framework for estimating the dominant rate f ^ m ( k ) associated with respiratory ( m = RR ) and cardiac ( m = HR ) modulation from IMU-based spectra is presented. The framework employed in this study relies exclusively on data obtained from 3D accelerometers and gyroscopes ( J = 6 axes), since magnetic field variations in unstructured environments can reduce the quality of body motion data [43]. First, the J motion signals undergo band-pass filtering in two frequency ranges associated with respiratory ([0.08, 0.6] Hz) and cardiac ([0.7, 1.7] Hz) activity during sleep. For each motion signal, power spectrum estimation is carried out using the Welch periodogram every Δ k s (k:th occurrence) in T k = 30 s symmetrical windows. Utilizing the position of the maximum peak to determine the dominant rate may show considerable fluctuations across spectra and axes due to the presence of noise and motion artifacts. In order to reduce the variance, only spectra exhibiting a high SNR should be taken into account. Such spectra can be identified by computing the power in a narrow symmetrical band around the maximum peak (typically 2 δ = 0.2 Hz). The distance between the maximum peak and previous rate position is used as a weight to amplify SNR for spectra with a dominant rate that deviates less than δ Hz. For the k:th instance, considering stationarity of the dominant rate in an interval of length T k + ( L 1 ) · Δ k s, up to L = 6 spectra can be averaged [10]. Only spectra with SNR > 0.5 participate in the calculation of the averaged spectrum. Note that the resulting spectrum is an average from zero up to L × J power spectra. The dominant rate is defined based on the position of the local maximum that is located closer to the previous estimation ( f ^ m ( k 1 ) ). The block diagram for deriving vital signs from motion signals is illustrated in Figure 2.

2.4. Performance Evaluation
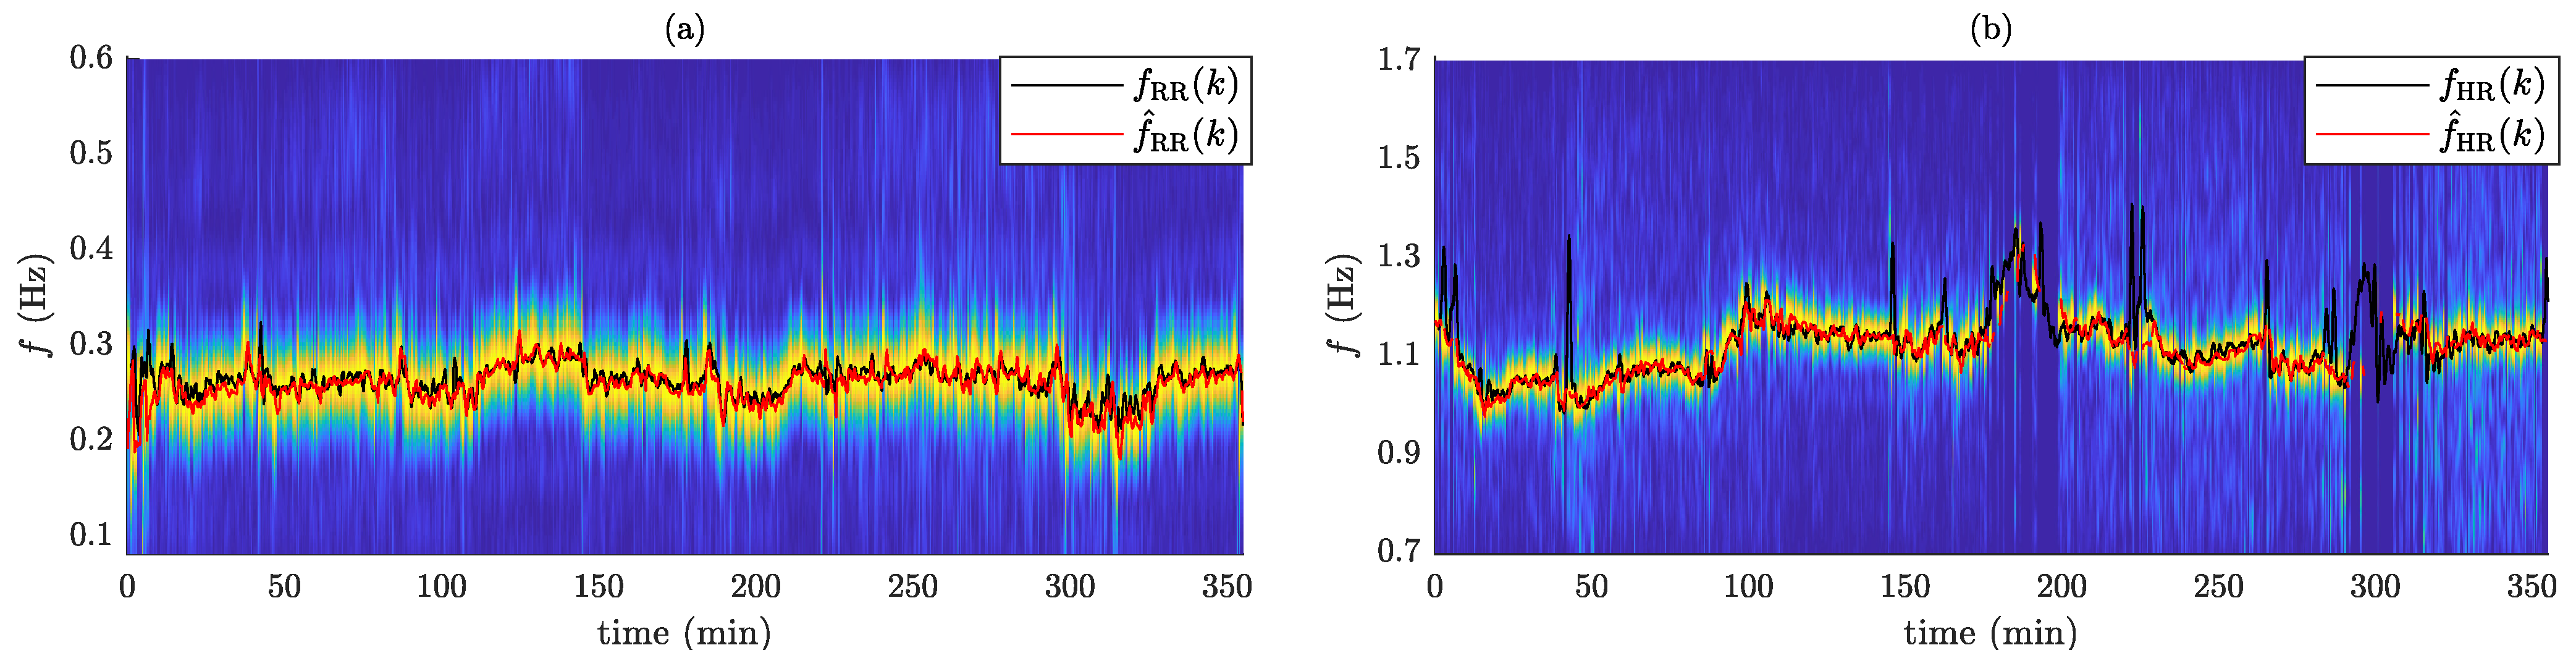
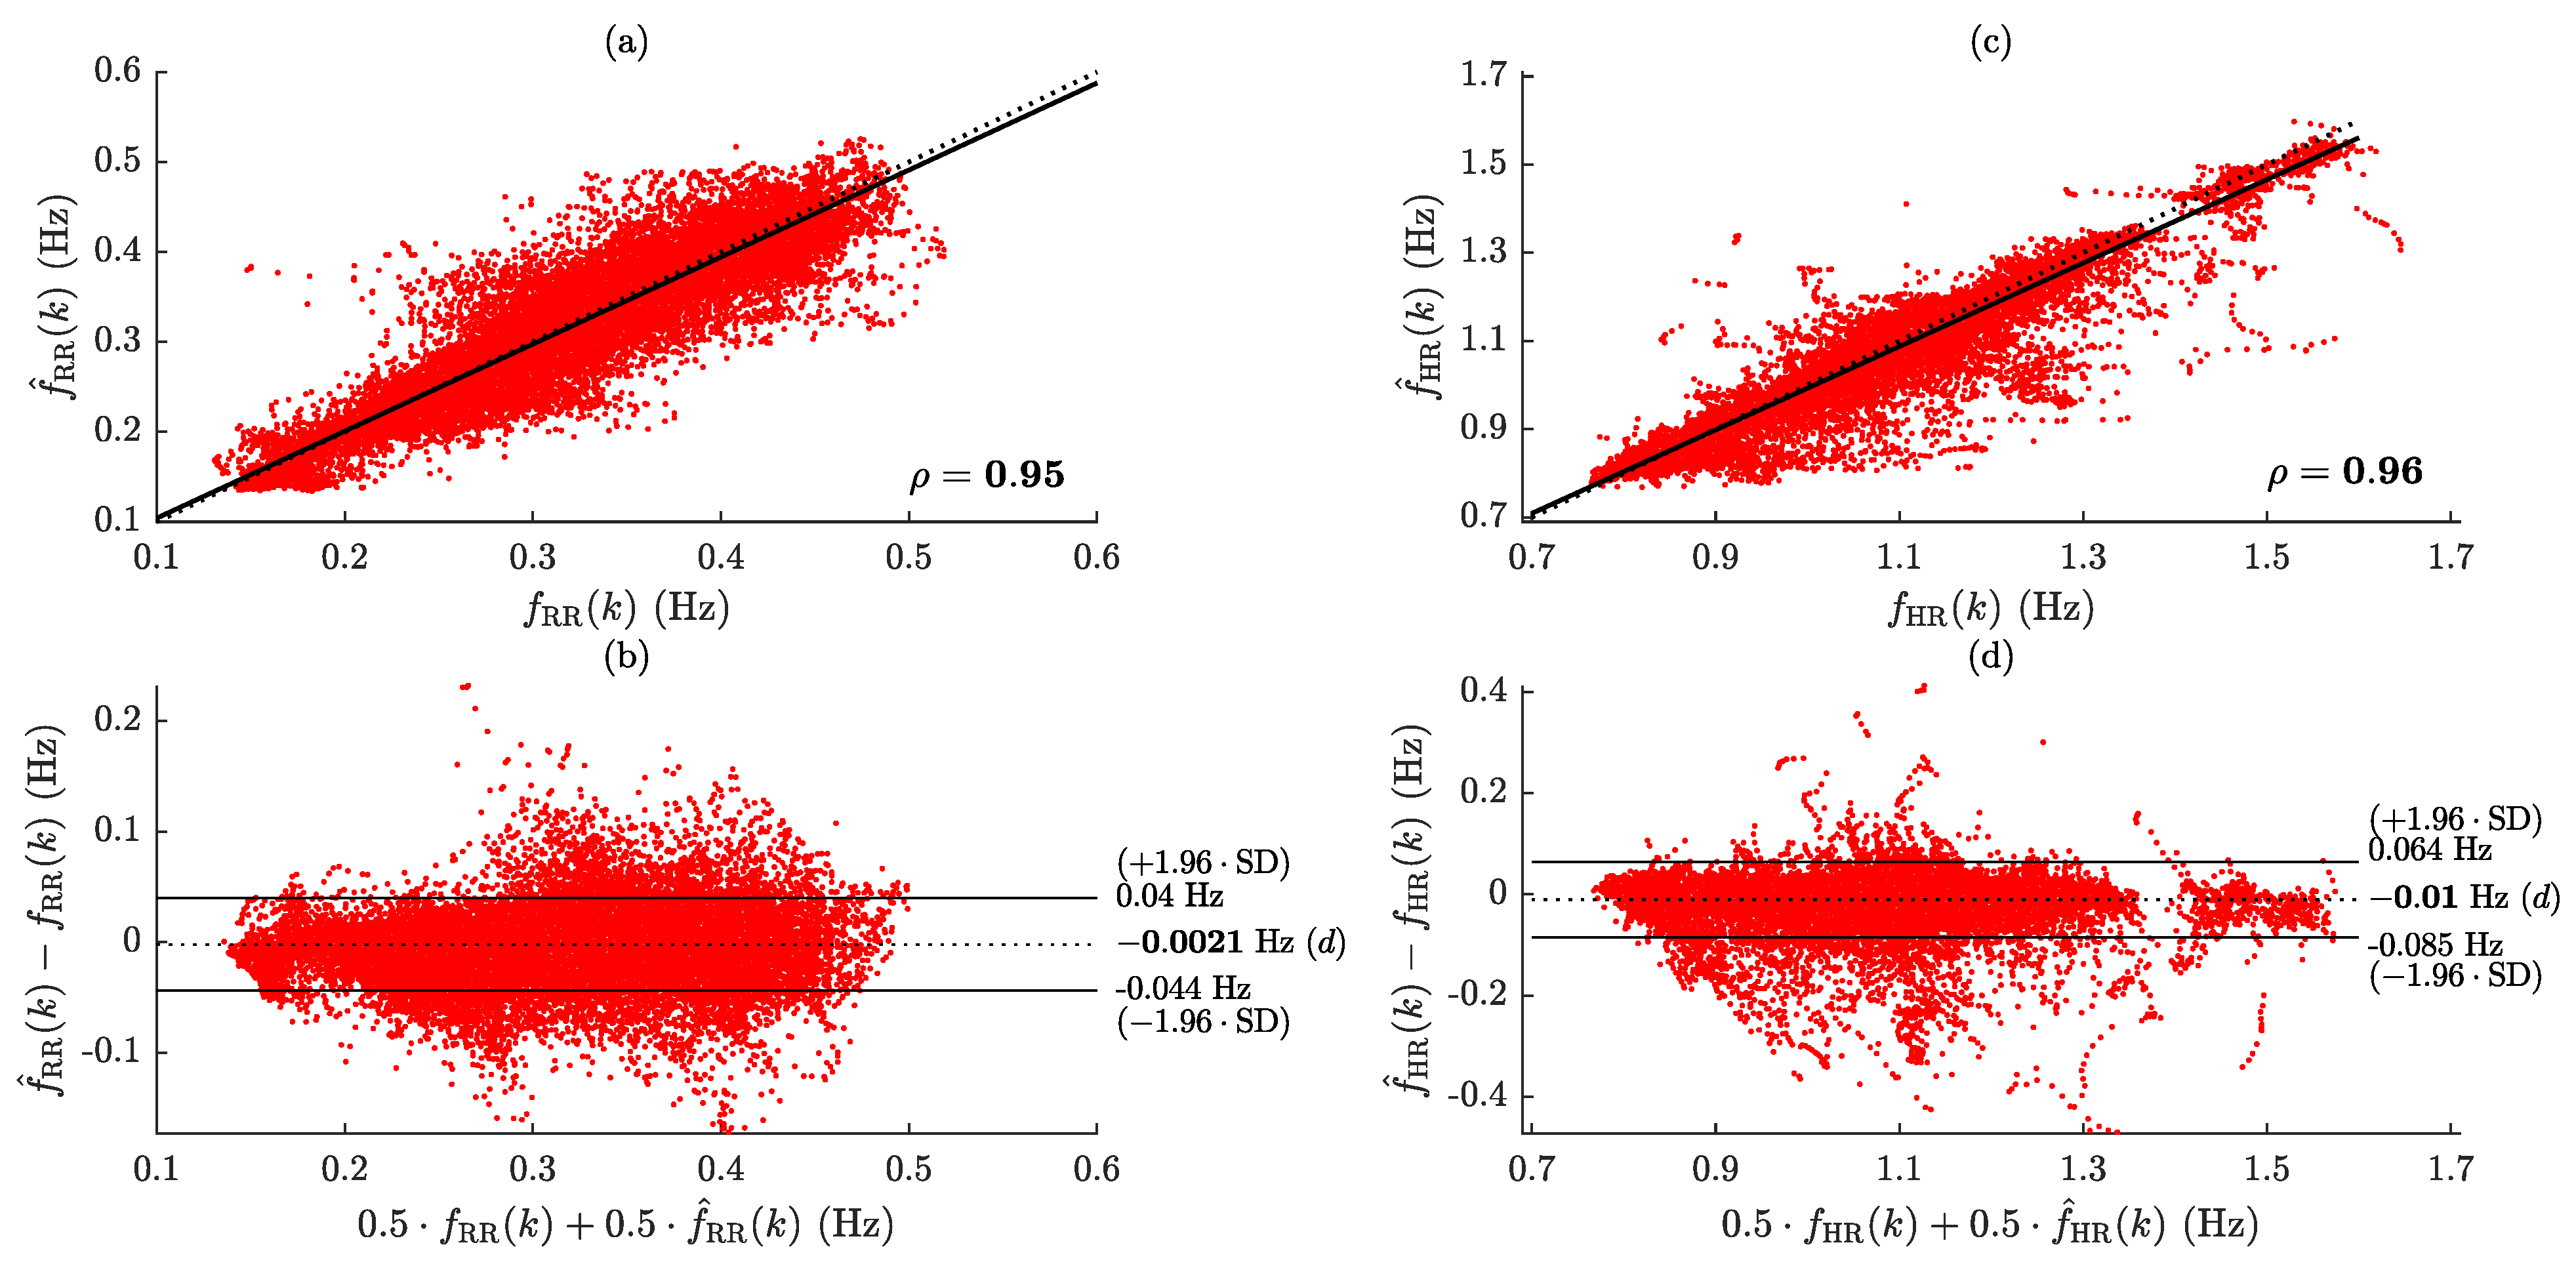
The feasibility of the proposed methodology to estimate the RR and the HR from an IMU-based wearable system is evaluated by assessing the Mean Absolute Error (MAE) for each participant in comparison to the reference vital signs obtained through PSG. The calculation of the time coverage ( T C ), which refers to the proportion of time intervals with high-quality estimations, is also performed for each participant in order to facilitate performance comparison. The quantification of the bivariate association between the estimated and reference vital signs is accomplished by employing Spearman’s Correlation ( ρ ) for all pairs of measurements. Mean of the differences (d) and limits of agreement (LoAs) from 1.96 · SD to + 1.96 · SD are also calculated using all pairs of measurements. The statistical significance of the bias was assessed by conducting a one-sample t-test for d versus a zero-mean distribution.
First, performance evaluation, including correlation and Bland–Altman plots, as well as the median and interquartile range (IQR) of the MAE and T C metrics, was carried out for the IMU sensor placed on the waist ( IMU W ). Furthermore, the influence of the AHI on the median MAE and T C metrics was quantified with Spearman’s correlation. Then, a Kruskal–Wallis nonparametric one-way analysis of variance was conducted to determine differences in median MAE and T C between various combinations of IMUW with IMUs placed on the arms (IMUA) and/or the legs (IMUL). The combinations being analyzed are the one with the IMUW and IMUA (IMUWA), the one with the IMUW and IMUL (IMUWL), and the one with all sensors together (IMUWAL). To identify which IMU combination originates from distinct distributions, multi-comparison tests (post hoc analysis) with Bonferroni correction were carried out using the Wilcoxon signed rank test. In this study, the significance threshold was set to ( p < 0.05 ).

3. Results

Figure 3 shows an example of RR and HR estimation for a subject wearing the waist IMU sensor. The performance metrics acquired for the waist-worn IMU sensor ( IMU W ) are presented in Table 2. Regarding the evaluation of the error, MAE = 0.011 (0.008) Hz, i.e., 0.66 (0.48) min−1, and MAE = 0.022 (0.014) Hz, i.e., 1.32 (0.84) min−1, were obtained for RR and HR, respectively. The time coverage for RR estimation was high in almost all subjects, with a value of T C = 98.3 ( 3.6 ) % , while HR estimation was not feasible in two out of twenty-three participants, resulting in a time coverage of T C = 78.3 ( 26.2 ) % . A strong correlation was found between the AHI and the error in estimating RR ( ρ = 0.69 ), as well as with the time coverage of HR estimation ( ρ = 0.52 ). Correlation and Bland–Altman plots for evaluating IMU W performance are illustrated in Figure 4. Results show that the estimations exhibit an excellent correlation with the references, yielding ρ = 0.95 (RR) and ρ = 0.96 (HR). The present method also yielded accurate results in terms of error. A statistically significant bias of less than −0.13 min−1 and −0.6 min−1 were found for RR and HR, respectively. The LoAs for RR span from 0.044 to 0.040 Hz ( 2.64 to 2.40 min−1), while for HR, they extend from 0.085 to 0.064 Hz ( 5.10 to 3.84 min−1).
Table 3 provides a summary of performance metrics from previous research in sleep studies. The vast majority of the studies utilized 3D accelerometers, with only one study integrating the accelerometer with a 3D gyroscope. Most research provides correlation and MAE values, but only a few of them include information about the portion of data that were discarded. Most studies found correlation coefficients higher than ρ > 0.9 for both RR and HR. In terms of error, various studies have documented an RR that exceeds an MAE of 1.5 breaths/min. A particular study involving three individuals revealed a mean error of 0.95 beats/min for HR, though with an SD close to 3.5 beats/min. Time coverage metrics were only reported in studies focused on deploying sensors on the wrist. These metrics varied, with a range of 25.7 % in extensive clinical populations ( AHI > 5 ) to more than 48.3 % in smaller datasets consisting of individuals without OSA ( AHI < 5 ).
The influence of integrating information from several IMUs on the performance metrics is depicted in Figure 5. The results indicate that incorporating more IMUs positioned at the extremities does not result in a significant change in the MAE. However, there is a considerable increase in the time coverage for both RR and HR. More precisely, when all sensors were used, the estimation of RR attained a value of T C = 99.5 ( 1.0 ) % , while the estimation of HR reached T C = 94.1 ( 11.2 ) % . Nevertheless, it is evident from the presence of certain outliers in MAE and T C distributions that incorporate additional IMUs may not always yield advantageous results for all individuals. This is due the fact that IMUs positioned at the extremities are more susceptible to movement artifacts than the IMU placed around the waist.

4. Discussion

This study examines the feasibility of a wearable system using IMUs to track vital signs while a person is asleep. The system integrates five IMUs positioned on the waist, arms, and legs. The study introduces a new weighted function designed to enhance SNR for spectra with a dominant rate close to previous estimations. This approach allows the integration of information across multiple axes and IMU sensors. The effectiveness of this approach is evaluated in individuals with varying severity of SDB.
Performance metrics for previous works involving recordings during sleep provide valuable insights into the feasibility and efficiency of the current methodology. For a comprehensive evaluation of its effectiveness, such metrics are summarized in Table 3. Results indicate that employing a sole IMU sensor positioned at the waist demonstrates robust performance, as evidenced by its high correlation ( ρ 0.95 ) with reference rates derived from PSG. Similar results have been reported in most of the previous studies [32,33,41]. Regarding MAE, the current approach, i.e., MAE = 0.66 ( 0.48 ) min 1 , yielded an improvement of nearly 1 breath/min in estimating RR compared to [35,42]. However, there was only one study with a limited number of participants that reported a slightly better mean error for HR [34]. Nonetheless, the standard deviation was approximately 3.5 beats/min, compared to the 0.84 beats/min achieved in this study, i.e., MAE = 1.32 ( 0.84 ) min 1 . The estimation of RR showed a high time coverage in the majority of subjects ( T C = 98.3 % ), in contrast to HR estimation, which achieved lower values ( T C = 78.3 % ). Much lower time coverage values ( T C < 50 % ) were reported in previous studies that analyzed healthy individuals [32] and patients with SDB [41], for both RR and HR estimation.
It should be noted that performance can be influenced by medical conditions, including the severity of SDB. Results showed that AHI exhibits a strong positive correlation with the error in estimating RR ( ρ = 0.69 ), and a negative association with the time coverage of HR estimation ( ρ = 0.52 ). This implies that participants with higher AHIs have lower data quality, leading to an elevated MAE and a decrease in T C . While data from SDB patients were examined in just two studies, only one of them documented an AHI of 5.8 ( 4.2 ) [42]. This is the first study reporting a much higher AHI of 27.5 ( 33.0 ) . This implies that the proposed methodology can be used for vital sign monitoring during sleep in healthy subjects as well as in a clinical sample of subjects with SDB.
Besides clinical characteristics, sensor placement can also have an impact on the performance. An accurate estimation of vital signs requires the IMU to be placed near the chest [24,32]. For instance, HR monitoring with devices positioned at the extremities is constrained by limited time coverage [41]. On the contrary, estimating RR using IMUs placed in close proximity to the chest and abdomen could lead to similar results [42]. Note that the placement of IMUs on specific body parts may reduce their convenience for regular individual use [49]. For instance, the chest was found to be the least preferred location compared to waist, ankles, and wrists [50,51]. Although the waist might be the most kinematically stable location with minimal variation due to nocturnal movements, placing IMUs at the extremities could improve the performance. In this study, a significant rise in time coverage was found when combining IMUs placed on different body locations (Figure 5). In particular, the median T C was increased by over 15 % when utilizing all IMUs for estimating HR.
Different methodologies have been employed to improve the estimation of vital signs during sleep. In [42], the authors selected the axis perpendicular to the chest surface, considering that participants were lying in a supine position. In [41], the axis with the highest auto-correlation peak was chosen. However, opting for a single axis may prove insufficient when the individual changes sleep positions during overnight recordings. On the contrary, by combining axes, a novel one-dimensional signal can be derived using fusion techniques such as calculating the magnitude [35] or employing PCA [31,33]. Nevertheless, if certain axes are contaminated by artifacts, the fusion of all axes in a non-dynamic fashion could potentially lower the SNR in the resulting signal. Time-frequency approaches to improve the accuracy of detecting the dominant rate were introduced in [32,34]. These approaches relied on spectral amplitude as a foundation, while this study introduced the incorporation of prior estimations to augment the available information for determining the dominant rate.
Another novelty of the current study is the use of multiple IMUs positioned at different body locations to enhance the effectiveness of monitoring vital signs. This innovative aspect extends beyond sleep research, since even in the limited studies employing multiple IMUs, the positioning of sensors was confined to the torso [38,39]. While in this study, cardiorespiratory-induced accelerations and angular velocities across the whole body are combined, in previous studies the additional sensors aimed mainly at acquiring a reference for rejecting motion artifacts in ambulatory recordings. However, the comparison of performance metrics during situations where the subjects were walking or performing activities is not straightforward. The performance can also exhibit considerable fluctuations even when dealing with recordings featuring minimal motion, owing to differences in body position [27].
One drawback of the current study is that the estimation of vital signs requires stationarity of the dominant rate in one-minute-long intervals. Although this duration is suitable for estimating RR, quantification of HR patterns, besides slow variations, is not feasible (Figure 3). Reducing the size of the analysis window will lead to increased MAE values [30]. On the other hand, the utilization of adaptive filtering incorporating the estimated trends of RR and HR, in conjunction with peak detection approaches, has the potential to improve resolution [38]. Another limitation is that the performance of IMU-derived vital signs during sleep may be altered in the case of comorbid medical conditions, including sleep-related movement disorders. For instance, the joint analysis of IMUs placed at the extremities can hinder the performance in the case of periodic limb movements. In this study, employing additional IMUs to the IMU positioned around the waist did not consistently produce favorable outcomes across all participants (Figure 5). Further analyses considering artifact rejection methods based on signal energy at the preprocessing stage and different thresholds for the lowest acceptable SNR in the spectral average operation should be conducted. Moreover, additional studies for assessing the usability and wearability of the current system in home settings should be conducted.
The findings of this study open up the opportunity to explore physiological variations in respiratory patterns and circadian rhythms during sleep, eliminating the need for PSG recordings. This information can be applied to evaluate the probability of experiencing SDB [52,53], construct indices that measure the overall sleep quality [54], and improve actigraphy-based features to better distinguish different sleep stages [32,55].

5. Conclusions

This study demonstrates the feasibility of monitoring RR and HR during sleep using an inertial-based wearable system. A novel weighted function was introduced to enhance SNR for spectra with a dominant rate close to previous estimations. The proposed methodological framework facilitates the integration of information across various axes and IMU sensors distributed across the entire body. Results indicate that employing a single IMU sensor placed at the waist exhibits strong performance, as indicated by its high correlation ( ρ 0.95 ) with reference vital signs obtained from PSG. Across all participants, mean absolute errors of 0.66 breaths/min and 1.32 beats/min were found for RR and HR, respectively. The estimation of RR achieved a high time coverage in the majority of subjects ( 98.3 % ), while HR estimation reached lower values ( 78.3 % ). Nevertheless, the latter improved by over 15 % when combining IMUs positioned at the arms and the legs. The effectiveness of the suggested approach proves to be robust in subjects with varying severity of SDB.

Author Contributions

Conceptualization, S.K. (Spyridon Kontaxis), F.K., S.K. (Spyridon Konitsiotis) and G.R.; Data curation, F.K., A.N. and N.K.; Formal analysis, S.K. (Spyridon Kontaxis) and G.R.; Funding acquisition, S.K. (Spyridon Konitsiotis) and G.R.; Investigation, S.K. (Spyridon Kontaxis) and G.R.; Methodology, S.K. (Spyridon Kontaxis) and G.R.; Project administration, S.K. (Spyridon Konitsiotis) and G.R.; Resources, F.K. and S.K. (Spyridon Konitsiotis); Software, S.K. (Spyridon Kontaxis) and G.R.; Supervision, S.K. (Spyridon Konitsiotis) and G.R.; Validation, S.K. (Spyridon Kontaxis) and G.R.; Visualization, S.K. (Spyridon Kontaxis), A.N. and N.K.; Writing—original draft, S.K. (Spyridon Kontaxis), F.K., A.N. and N.K.; Writing—review and editing, S.K. (Spyridon Kontaxis), F.K., A.N., N.K., S.K. (Spyridon Konitsiotis) and G.R. All authors have read and agreed to the published version of the manuscript.

Funding

This research received no external funding.

Institutional Review Board Statement

The research adhered to the principles outlined in the Helsinki Declaration and received approval from the Scientific Board Ethics Committee of the Athenian “Evangelismos” Hospital (Reference No. 198, 6/6/2022).

Informed Consent Statement

The study’s aims were communicated to all participants, who subsequently supplied their written consent.

Data Availability Statement

The data that support the findings of this study are available from G.R. ([email protected]) upon reasonable request.

Conflicts of Interest

Spyridon Konitsiotis is a co-founder of PD Neurotechnology Ltd. and the rest of co-authors are employees of PD Neurotechnology Ltd. The authors declare no conflicts of interest.

Abbreviations

The following abbreviations are used in this manuscript:
RRRespiratory rate
HRHeart rate
ICUIntensive care unit
ECGElectrocardiogram
BCGBallistocardiogram
SCGSeismocardiogram
GCGGyrocardiogram
SDBSleep-disordered breathing
SNRSignal-to-noise ratio
PCAPrincipal component analysis
IMUInertial measurement units
AHIApnea–hypopnea index
OSAObstructive sleep apnea
PSGPolysomnography
PDParkinson’s disease
MAEMean absolute error
IQRinterquartile range

References

  1. Andersen, L.W.; Holmberg, M.J.; Berg, K.M.; Donnino, M.W.; Granfeldt, A. In-hospital cardiac arrest: A review. JAMA 2019, 321, 1200–1210. [Google Scholar] [CrossRef]
  2. Cretikos, M.A.; Bellomo, R.; Hillman, K.; Chen, J.; Finfer, S.; Flabouris, A. Respiratory rate: The neglected vital sign. Med. J. Aust. 2008, 188, 657–659. [Google Scholar] [CrossRef]
  3. Smith, M.B.; Chiovaro, J.C.; O’Neil, M.; Kansagara, D.; Quiñones, A.R.; Freeman, M.; Motu’apuaka, M.L.; Slatore, C.G. Early warning system scores for clinical deterioration in hospitalized patients: A systematic review. Ann. Am. Thorac. Soc. 2014, 11, 1454–1465. [Google Scholar] [CrossRef]
  4. Barfod, C.; Lauritzen, M.M.P.; Danker, J.K.; Sölétormos, G.; Forberg, J.L.; Berlac, P.A.; Lippert, F.; Lundstrøm, L.H.; Antonsen, K.; Lange, K.H.W. Abnormal vital signs are strong predictors for intensive care unit admission and in-hospital mortality in adults triaged in the emergency department-a prospective cohort study. Scand. J. Trauma Resusc. Emerg. Med. 2012, 20, 1–10. [Google Scholar] [CrossRef]
  5. Brekke, I.J.; Puntervoll, L.H.; Pedersen, P.B.; Kellett, J.; Brabrand, M. The value of vital sign trends in predicting and monitoring clinical deterioration: A systematic review. PLoS ONE 2019, 14, e0210875. [Google Scholar] [CrossRef]
  6. Petit, C.; Bezemer, R.; Atallah, L. A review of recent advances in data analytics for post-operative patient deterioration detection. J. Clin. Monit. Comput. 2018, 32, 391–402. [Google Scholar] [CrossRef]
  7. Joshi, M.; Ashrafian, H.; Aufegger, L.; Khan, S.; Arora, S.; Cooke, G.; Darzi, A. Wearable sensors to improve detection of patient deterioration. Expert Rev. Med. Devices 2019, 16, 145–154. [Google Scholar] [CrossRef]
  8. Huhn, S.; Axt, M.; Gunga, H.C.; Maggioni, M.A.; Munga, S.; Obor, D.; Sié, A.; Boudo, V.; Bunker, A.; Sauerborn, R.; et al. The impact of wearable technologies in health research: Scoping review. JMIR Mhealth Uhealth 2022, 10, e34384. [Google Scholar] [CrossRef]
  9. Ramasamy, S.; Balan, A. Wearable sensors for ECG measurement: A review. Sens. Rev. 2018, 38, 412–419. [Google Scholar] [CrossRef]
  10. Bailón, R.; Sornmo, L.; Laguna, P. A robust method for ECG-based estimation of the respiratory frequency during stress testing. IEEE. Trans. Biomed. Eng. 2006, 53, 1273–1285. [Google Scholar] [CrossRef]
  11. Varon, C.; Morales, J.; Lázaro, J.; Orini, M.; Deviaene, M.; Kontaxis, S.; Testelmans, D.; Buyse, B.; Borzée, P.; Sörnmo, L.; et al. A Comparative Study of ECG-derived Respiration in Ambulatory Monitoring using the Single-lead ECG. Sci. Rep. 2020, 10, 5704. [Google Scholar] [CrossRef]
  12. Knight, S.; Lipoth, J.; Namvari, M.; Gu, C.; Hedayati, M.; Syed-Abdul, S.; Spiteri, R.J. The accuracy of wearable photoplethysmography sensors for telehealth monitoring: A scoping review. Telemed. J. e-Health 2023, 29, 813–828. [Google Scholar] [CrossRef]
  13. Lázaro, J.; Gil, E.; Bailón, R.; Mincholé, A.; Laguna, P. Deriving respiration from photoplethysmographic pulse width. Med. Biol. Eng. Comput. 2013, 51, 233–242. [Google Scholar] [CrossRef]
  14. Charlton, P.H.; Allen, J.; Bailón, R.; Baker, S.; Behar, J.A.; Chen, F.; Clifford, G.D.; Clifton, D.A.; Davies, H.J.; Ding, C.; et al. The 2023 wearable photoplethysmography roadmap. Physiol. Meas. 2023, 44, 111001. [Google Scholar] [CrossRef]
  15. Balasubramaniam, S.L.; Wang, Y.; Ryan, L.; Hossain, J.; Rahman, T.; Shaffer, T.H. Age-related ranges of respiratory inductance plethysmography (RIP) reference values for infants and children. Paediatr. Respir. Rev. 2019, 29, 60–67. [Google Scholar] [CrossRef]
  16. Soon, S.; Svavarsdottir, H.; Downey, C.; Jayne, D.G. Wearable devices for remote vital signs monitoring in the outpatient setting: An overview of the field. BMJ Innov. 2020, 6, 55. [Google Scholar] [CrossRef]
  17. Giovangrandi, L.; Inan, O.T.; Wiard, R.M.; Etemadi, M.; Kovacs, G.T. Ballistocardiography—A method worth revisiting. In Proceedings of the 2011 Annual International Conference of the IEEE Engineering in Medicine and Biology Society, Boston, MA, USA, 30 August–3 September 2011; pp. 4279–4282. [Google Scholar]
  18. Inan, O.T.; Migeotte, P.F.; Park, K.S.; Etemadi, M.; Tavakolian, K.; Casanella, R.; Zanetti, J.; Tank, J.; Funtova, I.; Prisk, G.K.; et al. Ballistocardiography and seismocardiography: A review of recent advances. IEEE J. Biomed. Health Inform. 2014, 19, 1414–1427. [Google Scholar] [CrossRef]
  19. Sadek, I.; Biswas, J.; Abdulrazak, B. Ballistocardiogram signal processing: A review. Health Inf. Sci. Syst. 2019, 7, 10. [Google Scholar] [CrossRef]
  20. Taebi, A.; Solar, B.E.; Bomar, A.J.; Sandler, R.H.; Mansy, H.A. Recent advances in seismocardiography. Vibration 2019, 2, 64–86. [Google Scholar] [CrossRef]
  21. Jafari Tadi, M.; Lehtonen, E.; Saraste, A.; Tuominen, J.; Koskinen, J.; Teräs, M.; Airaksinen, J.; Pänkäälä, M.; Koivisto, T. Gyrocardiography: A new non-invasive monitoring method for the assessment of cardiac mechanics and the estimation of hemodynamic variables. Sci. Rep. 2017, 7, 6823. [Google Scholar] [CrossRef]
  22. Liu, H.; Allen, J.; Zheng, D.; Chen, F. Recent development of respiratory rate measurement technologies. Physiol. Meas. 2019, 40, 07TR01. [Google Scholar] [CrossRef]
  23. Reinvuo, T.; Hannula, M.; Sorvoja, H.; Alasaarela, E.; Myllyla, R. Measurement of respiratory rate with high-resolution accelerometer and EMFit pressure sensor. In Proceedings of the IEEE SAS 2006, Houston, TX, USA, 7–9 February 2006; pp. 192–195. [Google Scholar]
  24. Bieber, G.; Haescher, M.; Vahl, M. Sensor requirements for activity recognition on smart watches. In Proceedings of the PETRA 2013, Island of Rhodes, Greece, 29–31 May 2013; pp. 1–6. [Google Scholar]
  25. Cesareo, A.; Previtali, Y.; Biffi, E.; Aliverti, A. Assessment of breathing parameters using an inertial measurement unit (IMU)-based system. Sensors 2018, 19, 88. [Google Scholar] [CrossRef]
  26. D’Mello, Y.; Skoric, J.; Xu, S.; Roche, P.J.; Lortie, M.; Gagnon, S.; Plant, D.V. Real-time cardiac beat detection and heart rate monitoring from combined seismocardiography and gyrocardiography. Sensors 2019, 19, 3472. [Google Scholar] [CrossRef]
  27. Hughes, S.; Liu, H.; Zheng, D. Influences of sensor placement site and subject posture on measurement of respiratory frequency using triaxial accelerometers. Front. Physiol. 2020, 11, 823. [Google Scholar] [CrossRef]
  28. Schipper, F.; van Sloun, R.J.; Grassi, A.; Derkx, R.; Overeem, S.; Fonseca, P. Estimation of respiratory rate and effort from a chest-worn accelerometer using constrained and recursive principal component analysis. Physiol. Meas. 2021, 42, 045004. [Google Scholar] [CrossRef]
  29. Zhao, C.; Zeng, W.; Hu, D.; Liu, H. Robust heart rate monitoring by a single wrist-worn accelerometer based on signal decomposition. IEEE Sens. J. 2021, 21, 15962–15971. [Google Scholar] [CrossRef]
  30. Romano, C.; Schena, E.; Formica, D.; Massaroni, C. Comparison between chest-worn accelerometer and gyroscope performance for heart rate and respiratory rate monitoring. Biosensors 2022, 12, 834. [Google Scholar] [CrossRef]
  31. Liu, G.Z.; Guo, Y.W.; Zhu, Q.S.; Huang, B.Y.; Wang, L. Estimation of respiration rate from three-dimensional acceleration data based on body sensor network. Telemed. J. e-Health 2011, 17, 705–711. [Google Scholar] [CrossRef]
  32. Kawamoto, K.; Kuriyama, H.; Tajima, S. Actigraphic detection of REM sleep based on respiratory rate estimation. J. Med. Biol. Eng. 2013, 2, 20–25. [Google Scholar] [CrossRef]
  33. Zhang, Z.; Yang, G.Z. Monitoring cardio-respiratory and posture movements during sleep: What can be achieved by a single motion sensor. In Proceedings of the BSN 2015, Cambridge, MA, USA, 9–12 June 2015; pp. 1–6. [Google Scholar]
  34. Hernandez, J.; McDuff, D.; Picard, R.W. Biowatch: Estimation of heart and breathing rates from wrist motions. In Proceedings of the PervasiveHealth 2015, Istanbul, Turkey, 20–23 May 2015; pp. 169–176. [Google Scholar]
  35. Ryser, F.; Hanassab, S.; Lambercy, O.; Werth, E.; Gassert, R. Respiratory analysis during sleep using a chest-worn accelerometer: A machine learning approach. Biomed. Signal Process. Control 2022, 78, 104014. [Google Scholar] [CrossRef]
  36. Lee, H.; Lee, H.; Whang, M. An enhanced method to estimate heart rate from seismocardiography via ensemble averaging of body movements at six degrees of freedom. Sensors 2018, 18, 238. [Google Scholar] [CrossRef]
  37. Yoon, J.W.; Noh, Y.S.; Kwon, Y.S.; Kim, W.K.; Yoon, H.R. Improvement of dynamic respiration monitoring through sensor fusion of accelerometer and gyro-sensor. J. Electr. Eng. Technol. 2014, 9, 334–343. [Google Scholar] [CrossRef]
  38. Cesareo, A.; Biffi, E.; Cuesta-Frau, D.; D’Angelo, M.G.; Aliverti, A. A novel acquisition platform for long-term breathing frequency monitoring based on inertial measurement units. Med. Biol. Eng. Comput. 2020, 58, 785–804. [Google Scholar] [CrossRef]
  39. De Fazio, R.; Greco, M.R.; De Vittorio, M.; Visconti, P. A Differential Inertial Wearable Device for Breathing Parameter Detection: Hardware and Firmware Development, Experimental Characterization. Sensors 2022, 22, 9953. [Google Scholar] [CrossRef]
  40. Jarchi, D.; Rodgers, S.J.; Tarassenko, L.; Clifton, D.A. Accelerometry-based estimation of respiratory rate for post-intensive care patient monitoring. IEEE Sens. J. 2018, 18, 4981–4989. [Google Scholar] [CrossRef]
  41. Zschocke, J.; Kluge, M.; Pelikan, L.; Graf, A.; Glos, M.; Müller, A.; Mikolajczyk, R.; Bartsch, R.P.; Penzel, T.; Kantelhardt, J.W. Detection and analysis of pulse waves during sleep via wrist-worn actigraphy. PLoS ONE 2019, 14, e0226843. [Google Scholar] [CrossRef]
  42. Doheny, E.P.; Lowery, M.M.; Russell, A.; Ryan, S. Estimation of respiration rate and sleeping position using a wearable accelerometer. In Proceedings of the EMBC 2020, Montreal, QC, Canada, 20–24 July 2020; pp. 4668–4671. [Google Scholar]
  43. Massaroni, C.; Nicolò, A.; Lo Presti, D.; Sacchetti, M.; Silvestri, S.; Schena, E. Contact-based methods for measuring respiratory rate. Sensors 2019, 19, 908. [Google Scholar] [CrossRef]
  44. De Fazio, R.; Stabile, M.; De Vittorio, M.; Velázquez, R.; Visconti, P. An overview of wearable piezoresistive and inertial sensors for respiration rate monitoring. Electronics 2021, 10, 2178. [Google Scholar] [CrossRef]
  45. Rahmani, M.H.; Berkvens, R.; Weyn, M. Chest-worn inertial sensors: A survey of applications and methods. Sensors 2021, 21, 2875. [Google Scholar] [CrossRef]
  46. Kontaxis, S.; Lázaro, J.; Corino, V.D.; Sandberg, F.; Bailón, R.; Laguna, P.; Sörnmo, L. ECG-derived respiratory rate in atrial fibrillation. IEEE. Trans. Biomed. Eng. 2019, 67, 905–914. [Google Scholar] [CrossRef]
  47. Kostikis, N.; Rigas, G.; Konitsiotis, S.; Fotiadis, D.I. Configurable offline sensor placement identification for a medical device monitoring Parkinson’s disease. Sensors 2021, 21, 7801. [Google Scholar] [CrossRef]
  48. Antonini, A.; Reichmann, H.; Gentile, G.; Garon, M.; Tedesco, C.; Frank, A.; Falkenburger, B.; Konitsiotis, S.; Tsamis, K.; Rigas, G.; et al. Toward objective monitoring of Parkinson’s disease motor symptoms using a wearable device: Wearability and performance evaluation of PDMonitor®. Front. Neurol. 2023, 14, 1080752. [Google Scholar] [CrossRef]
  49. Ates, H.C.; Nguyen, P.Q.; Gonzalez-Macia, L.; Morales-Narváez, E.; Güder, F.; Collins, J.J.; Dincer, C. End-to-end design of wearable sensors. Nat. Rev. Mater. 2022, 7, 887–907. [Google Scholar] [CrossRef]
  50. Mokhlespour Esfahani, M.I.; Nussbaum, M.A. Preferred placement and usability of a smart textile system vs. inertial measurement units for activity monitoring. Sensors 2018, 18, 2501. [Google Scholar] [CrossRef]
  51. O’Day, J.; Lee, M.; Seagers, K.; Hoffman, S.; Jih-Schiff, A.; Kidziński, Ł.; Delp, S.; Bronte-Stewart, H. Assessing inertial measurement unit locations for freezing of gait detection and patient preference. J. Neuroeng. Rehabil. 2022, 19, 20. [Google Scholar] [CrossRef]
  52. Bricout, A.; Fontecave-Jallon, J.; Pépin, J.L.; Guméry, P.Y. Accelerometry-derived respiratory index estimating apnea-hypopnea index for sleep apnea screening. Comput. Methods Programs Biomed. 2021, 207, 106209. [Google Scholar] [CrossRef]
  53. Bates, A.; Ling, M.J.; Mann, J.; Arvind, D.K. Respiratory rate and flow waveform estimation from tri-axial accelerometer data. In Proceedings of the BSN 2010, Singapore, 7–9 June 2010; pp. 144–150. [Google Scholar]
  54. Chase, J.D.; Busa, M.A.; Staudenmayer, J.W.; Sirard, J.R. Sleep measurement using wrist-worn accelerometer data compared with polysomnography. Sensors 2022, 22, 5041. [Google Scholar] [CrossRef]
  55. Boe, A.J.; McGee Koch, L.L.; O’Brien, M.K.; Shawen, N.; Rogers, J.A.; Lieber, R.L.; Reid, K.J.; Zee, P.C.; Jayaraman, A. Automating sleep stage classification using wireless, wearable sensors. NPJ Digit. Med. 2019, 2, 131. [Google Scholar] [CrossRef]
Figure 1. Placement of the PDMonitor® sensors on the body. The sensors on the waist and the lateral compartments of the legs are attached with Velcro bands and StrapFrames, while wristbands are used to attach the sensors worn on the posterior compartment of the forearm.
Sensors 24 04139 g001
Figure 2. Block diagram for deriving vital signs, f ^ m ( k ) , from motion signals.
Sensors 24 04139 g002
Figure 3. Time-frequency maps for the weigted SNR averaged spectra. (a) RR estimation and (b) HR estimation. The reference rate and the estimated rate are displayed with black solid and red solid lines, respectively.
Sensors 24 04139 g003
Figure 4. Evaluation of IMUW performance using correlation and Bland–Altman plots. (a,b) RR estimation, and (c,d) HR estimation. In bold are marked statistically significant correlation and bias values ( p < 0.05 ).
Sensors 24 04139 g004
Figure 5. The effect of combining different IMUs placed on the waist (W), arms (A), and legs (L) on the performance metrics. (a,b) RR estimation, (c,d) HR estimation. Statistical differences of performance metrics between IMU W and IMU WA , IMU WL , or IMU WAL are marked with an asterisk ( p < 0.05 ).
Sensors 24 04139 g005
Table 1. Demographic data of the participants.
Aggregated DemographicsValues
Number of participants23
Sex (Male/Female)15/8
Age (years)46.6 (14.9)
Body mass index (kg/m2)29.5 (8.1)
AHI (events/hour)27.5 (33.0)
No OSA ( AHI < 5 )6
Mild OSA ( 5 AHI < 15 )9
Moderate OSA ( 15 AHI < 30 )1
Severe OSA ( AHI 30 )7
Values are denoted as numbers or mean (SD); AHI: apnea–hypopnea index; OSA: obstructive sleep apnea.
Table 2. Performance metrics acquired for IMUW.
RRHR
IDMAE (Hz) T C ( % ) MAE (Hz) T C ( % )
1 0.015 94.0 0.019 73.5
2 0.010 98.4 0.013 93.7
3 0.016 98.3 0.017 92.5
4 0.008 98.0 0.011 97.5
5 0.011 98.7 0.013 97.1
6 0.010 99.7 0.024 61.7
7 0.027 98.5 0.025 85.5
8 0.007 98.5 0.028 87.8
9 0.014 95.8 0.015 74.2
10 0.007 99.7 0.027 87.4
11 0.007 99.9 0.017 84.3
12 0.007 98.9 0.015 89.6
13 0.011 94.4 0.021 76.5
14 0.009 99.9 0.010 64.3
15 0.023 89.8 0.037 78.3
16 0.030 95.9 0.050 20.7
17 0.031 90.1 0
18 0.008 100 0.019 62.2
19 0.019 86.9 0.035 67.0
20 0.016 97.7 0
21 0.009 97.5 0.030 79.5
22 0.014 95.5 0.032 62.5
23 0.010 99.0 0.009 98.3
Median 0.011 98.3 0.022 78.3
IQR 0.008     3.6 0.014 26.2
Table 3. Performance metrics reported in sleep studies.
StudySensorLocationParticipantsMethodologyRatePerformance Metrics
[31]ACCChest12, AHI < 5 Axes fusionRR ρ = 0.20
[32]ACCWrist34, AHI < 5 Axis selectionRR ρ = 0.88 , T C = 48.3 %
[33]ACCChest7, AHI < 5 Axes fusionRR
HR
ρ = 0.92  
ρ = 0.93
[34]ACC & GYROWrist3, AHI < 5 Axis selection and rate fusionHR MAE = 0.95 ( 3.48 ) min−1, T C = 85.9 %
[35]ACCChest13, AHI < 5 Axes fusionRR MAE = 1.8 ( 2.2 ) min−1
[41]ACCWrist182, AHI > 5 Axis selectionHR ρ = 0.93 , T C = 25.7 %
[42]ACCChest11, AHI = 5.8 ( 4.2 ) Axis selectionRR MAE = 1.67 ( 0.37 ) min−1
CurrentACC & GYROWaist23, AHI = 27.5 ( 33.0 ) Axes fusionRR
HR
MAE = 0.66 ( 0.48 ) min−1, ρ = 0.95 , T C = 98.3 %  
MAE = 1.32 ( 0.84 ) min−1, ρ = 0.96 , T C = 78.3 %
Values are denoted as numbers and mean (SD) or median (IQR); ACC: 3D accelerometer; GYRO: 3D gyroscope.
Disclaimer/Publisher’s Note: The statements, opinions and data contained in all publications are solely those of the individual author(s) and contributor(s) and not of MDPI and/or the editor(s). MDPI and/or the editor(s) disclaim responsibility for any injury to people or property resulting from any ideas, methods, instructions or products referred to in the content.

