1. Introduction
With the increasing emissions of harmful gases into the environment during the combustion of fossil fuels for power generation and industrial production, air quality has quickly become a concern. NO
x is mainly generated by the exhaust emissions from ships and automotive diesel engines, with the NO
2 concentration in the exhaust gas being about ten times that of nitric oxide (NO). NO
x is defined as the sum of all nitrogen oxides, usually mainly referring to the sum of the nitric oxide compounds NO and NO
2. Both of thes nitrogen oxides have toxicity, with NO being less active, but easily oxidized into NO
2 in the air. The latter has a strong corrosiveness and toxicity, mainly damaging the respiratory tract and human nervous system, seriously endangering human health [
1,
2,
3]. Moreover, NO
2 is more stable in the air and plays an important role in the formation of ozone holes. Therefore, it is necessary to develop NO
2 gas sensors to meet various applications, including diesel vehicle emission monitoring.
There are many techniques reported in the literature for NO
2 gas sensors, including electrochemical sensors, optical sensors, and semiconductor sensors, etc. Semiconductor gas sensors are the most exploited due to their ease of fabrication. Shendage et al. (2017) reported a conductometric NO
2 gas sensor based on WO
3 nanoplates and demonstrated a relatively low response value of 10 at a 100 ppm concentration and a 100 °C operating temperature with detection limit of 5 ppm [
4]. Surbhi Jain et al. (2022) reported a NO
2 gas sensor of Long-Range Surface Plasmons (LRSPs) and demonstrated a high sensitivity (0.2°/ppm) and a limit of detection of 0.38 ppm [
5]. Shengbo Sang et al. reported In
2O
3 nanoparticles modified with GaN for NO
2 detection and exhibited a response as high as 1070.9–1 ppm NO
2 at a working temperature of 100 °C, as well as a low limit of detection (1 ppb) [
6]. Semiconductor gas sensors have some major setbacks such as a low sensitivity and high-temperature operation, leading to more consumption of power and an inferior selectivity. The disadvantages of electrochemical sensors mainly include a short life, the need for regular maintenance, and their high dependence on environmental conditions. Consequently, it is very important to develop NO
2 gas sensors with a high selectivity, long life, and high stability. Fei Yi et al. (2020) proposed a multiplexed NDIR gas-sensing platform consisting of a narrowband infrared detector array as a read-out and demonstrated a NO
2 gas detection limitsof 54 ppm [
7]. Shelly John Mechery et al. reported a fiber-optic-based sensor system for the detection of NO
2 in air samples. A part per billion (ppb)-level detection was achieved with the sensor design [
8]. Mel F. Hainey et al. demonstrated a dual-band metal–dielectric–metal cavity detector. NDIR NO
2 gas sensing exhibited a 10 ppm accuracy and 1 ms response times [
9]. Due to the complex composition of the emitted gases, it is a great challenge to accurately measure the NO
2 concentrations in harsh environments. Optical methods use specific spectral information to identify gases and avoid interference from other gases. Jing Li et al. presented a new strategy based on the linear calibration-free wavelength modulation spectroscopy method to eliminate the effects of water interference by resolving overlapped harmonic signals. NO
2 gas sensing exhibited ppm-level NO
2 detection with a high H
2O interference [
10]. Optical sensors have always been a remarkable area of research, as they are ideal for complex environments.
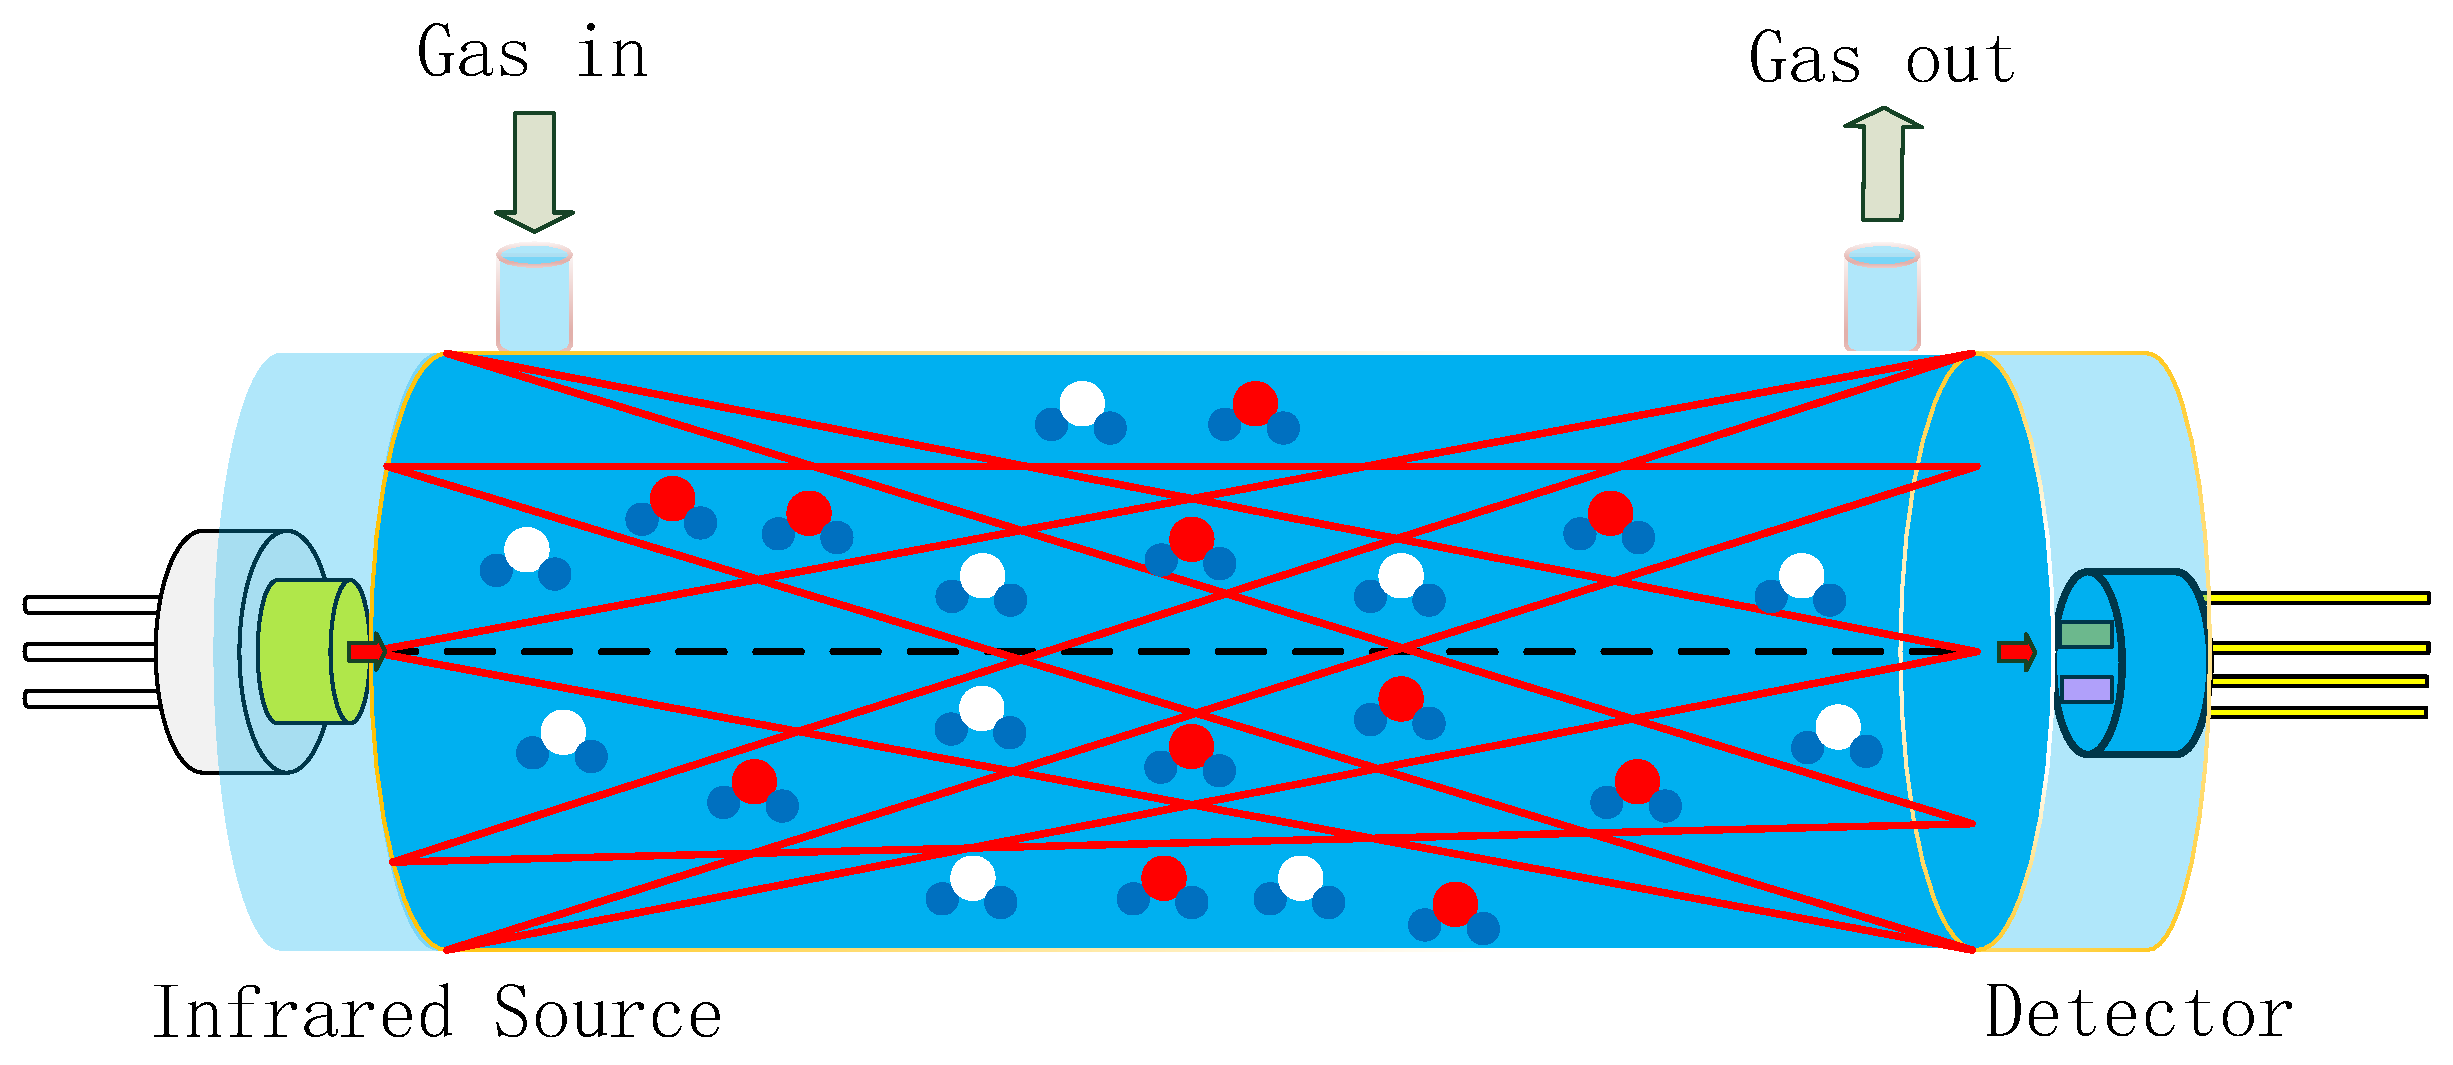
Gas sensors utilizing NDIR technology are highly regarded on the market for their exceptional selectivity, rapid response time, precise accuracy, extended service life, and robust stability when compared to alternative sensor types [
11,
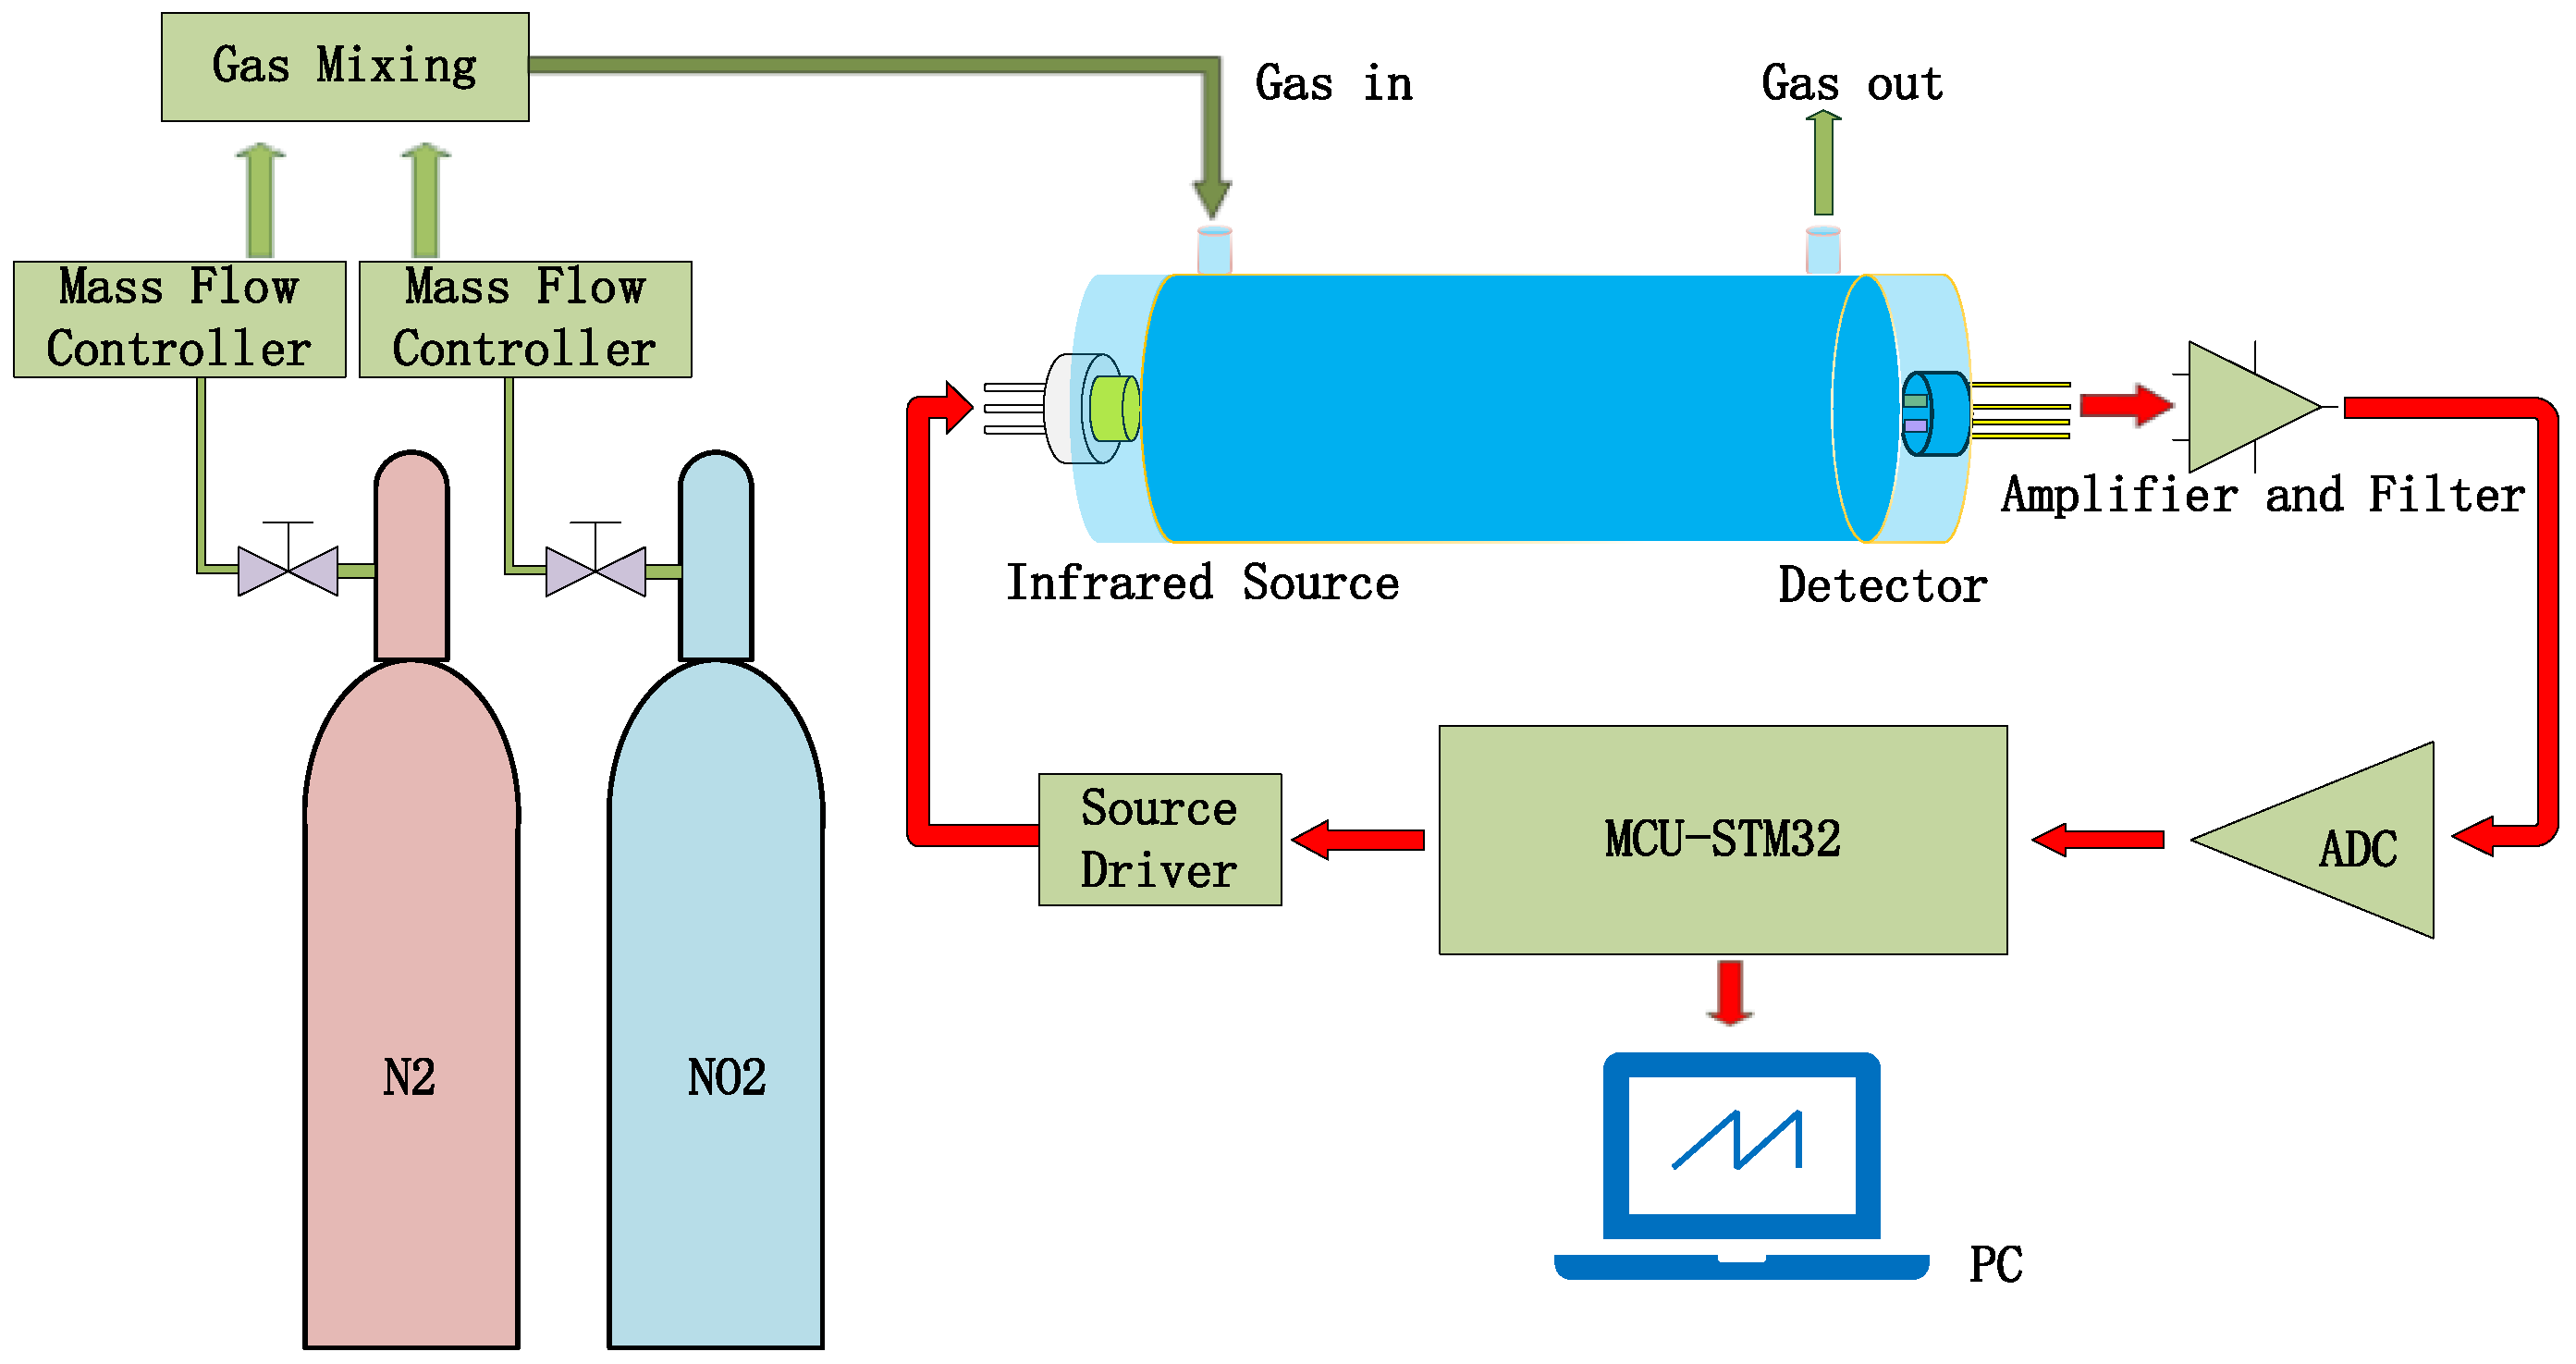
12]. A typical NDIR gas sensor system based on infrared absorption comprises an infrared (IR) emitter, optical gas chamber, IR detector, and signal-processing circuit, as shown in
Figure 1 [
13,
14,
15]. IR emitters include lasers, lamps, and MEMS IR-emitters, etc. [
16]. Our previous work reported on an NDIR multi-gas sensor system for the early thermal runaway warning of automotive batteries [
17]. The major drawback was the detection limit of the NDIR sensor. The detection limit is a measure of the smallest concentration which can be determined with a specified precision. The detection limit of an NDIR sensor is a function of both the voltage signal strength and signal stability. The detection limit of NDIR sensors is influenced by the intensity of the IR emitter, the design of the optical path, and the detector. In this study, NDIR NO
2 gas sensors were developed using a non-coherent MEMS IR emitter with broad spectral coverage as the source, along with a dual-channel pyroelectric detector equipped with two optical filters for the simultaneous measurement of NO
2 and reference signals, within a 1.5 m long white chamber. The white chamber was based on multiple reflections between spherical concave mirrors, which all had the same radius of curvature. The optical set-up featured a high light transmission, where radiation losses were caused only by absorption and scattering on the reflecting surfaces. The optical path was dependent on the adjustment of the mirrors. A long optical path of 1.5 m was implemented in a volume of 3 × 3 × 12 cm
3. Limitations such as the accuracy, detection limit, repeatability, and stability of the sensor were overcome by improvements made to the gas chamber and pyroelectric detector.
2. Non-Dispersive Infrared Gas Sensor Theory
When infrared radiation passes through gas molecules with spectrum absorption characteristics, the gas molecules will absorb part of the infrared radiation. According to the Beer–Lambert law [
18,
19,
20], the concentration of the gas can be calculated by Equation (1):
where
λ is the gas absorption wavelength,
x is the concentration of the gas,
k represents the correlation coefficient of gas absorption, and
l is the optical path length between the light and the detector.
I0(λ) and
I(λ) are the light intensity before and after absorbing the target gas.
The relationship between the voltage of the detector and the gas concentration can be calculated from Equation (2).
FA is defined as the fractional absorbance of the target gas. If
k and
l are constant,
FA can be plotted against
x, as shown in
Figure 2 (where
kl = 0.006, 0.0012, 0.0006, and 0.00012). This relationship implies that long optical path length is more suited for low gas concentrations, which can also be clearly seen in
Figure 2.
where
FA is the fractional absorbance,
V0 is the voltage of the detector in N
2 gas, and
V is the voltage of the detector in target gas.
Due to the influence of factors such as the IR emitter and light path, practical considerations require modifications to the Beer–Lambert Law Equation (3) [
21]:
The SPAN constant depends on the range of concentration measured. The values of kl and c for a particular system are usually determined by taking a number of data points for the FA and the concentration of the target gas.
For a given system where the
kl and
c constants have been determined, the values of ZERO and SPAN can be calculated using the two-point calibration method. Firstly, low-concentration gas is injected into the gas chamber, and the relationship between voltage and concentration is given by Equation (4). Then, a high concentration of gas is passed into the gas chamber, and the relationship between the voltage and the concentration is given by Equation (5). ZERO and SPAN can be calculated by Equations (6) and (7).
where
ILOW is the light intensity after absorbing the low-concentration gas and I
CAL is the light intensity after absorbing the high-concentration gas.
Ugas-LOW and
Uref-LOW are the voltages of the reference channel after absorbing the low-concentration gas.
Ugas-CAL and
Uref-CAL are the voltages of the gas channel after absorbing the high-concentration gas. U
ref-0 is the voltage of reference channel before absorbing the gas,
Ugas-0 is the voltage of the gas channel before absorbing the gas.
xLOW is the low-concentration gas and
xCAL is the high-concentration gas.
Based on the above theory, the actual concentration of the target gas can be derived from Equations (8) and (9):
where
Ugas is the voltage of the gas channel in an unknown gas and
Uref is the voltage of the reference channel in an unknown gas.
4. Results and Discussion
4.1. Performance of Pyroelectric Detector
Fourier transform infrared spectroscopy was used to characterize the properties of the absorbent materials for the pyroelectric detectors developed. The carbon black absorption layer exhibited a broad spectral response. The principle of the pyroelectric detector is that the carbon black absorption layer absorbs infrared light and converts the light signal into a heat signal. Then, the LT layer converts the heat signal into an electrical signal according to the pyroelectric effect. The output voltage of the detector depends on the absorption of the LT pyroelectric detector. A higher absorption of the detector results in a greater output voltage, indicating a greater response. The absorption measurements of the pyroelectric detector over the wavelength range from 2 μm to 10 μm are shown in
Figure 10. The absorption of the LT pyroelectric detector was generally >85%. The absorption of detector in the wavelength range of 4.15 μm–4.30 μm ranged from 94–97%. The experimental results show that carbon dioxide in the air can absorb infrared light.
Table 2 shows the parameters of the LT pyroelectric detector.
As shown in
Figure 11, the test system of detector was used to measure the detector output voltage.
Figure 12a–c show the relationship between the modulating pulse signals, gas channel, and reference channel. In
Figure 12a, the frequency is 10 Hz.
Figure 12b–c show the voltage signals of the detector. The voltage of the gas channel was 1.1 V. The voltage of the reference channel was 2.15 V. The voltage responsivity of the detector was calculated to be 1.28 × 10
5 V/W at a 10 Hz modulation frequency. The noise density of the detector was 40.2 μV/√Hz. The result shows D* 4.19 × 10
8 cm·√Hz/W.
4.2. Calibration and Data Fitting of Gas Sensor
The testing steps for NO
2 gas sensing are shown in
Figure 13. N
2 is used as the reference gas and mixed with NO
2 gas to reduce the concentration of NO
2 gas [
30]. Both gases pass through their respective mass flow controllers before reaching the mixer, which would output the testing gas into the gas-sensing chamber. The output signal of the pyroelectric detector will be collected and processed by the signal-processing circuit.
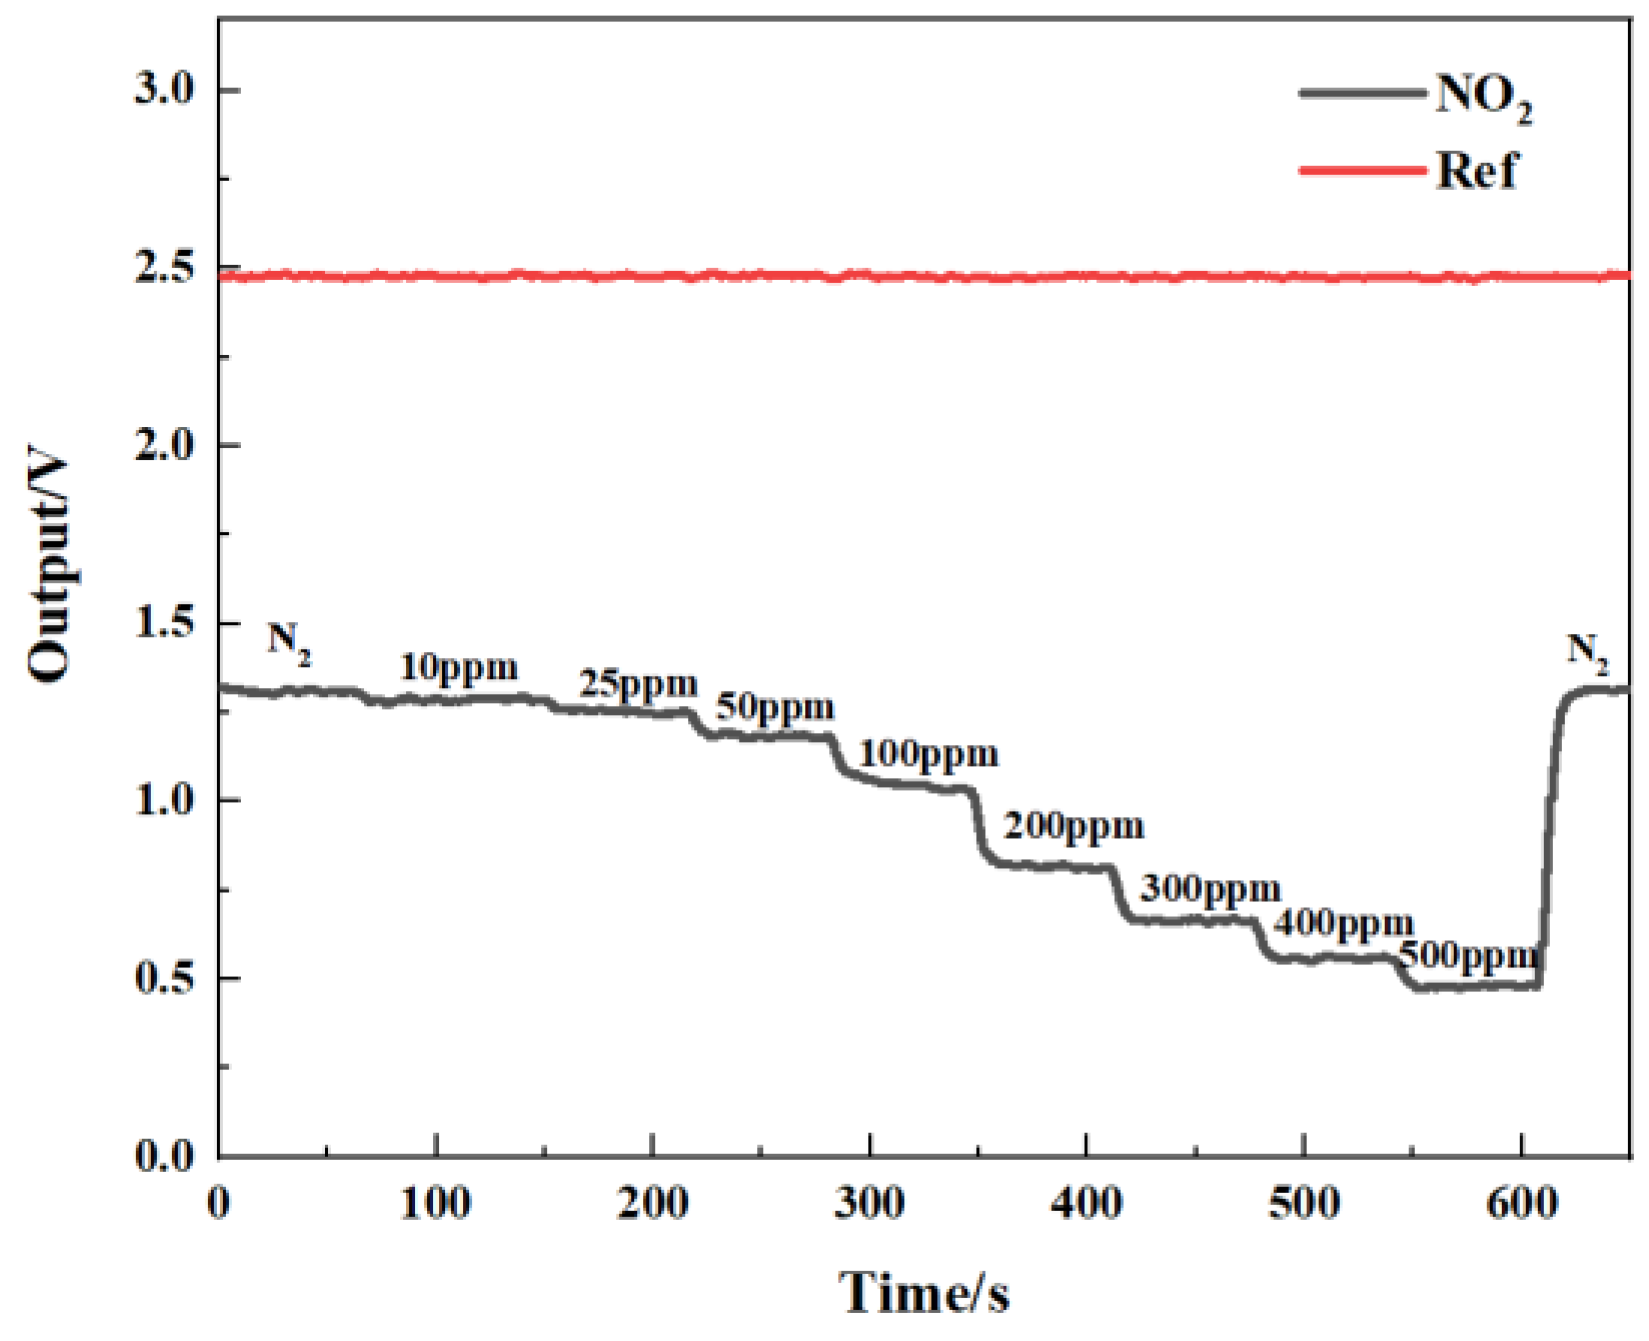
Figure 14 shows the gas-sensing voltage measured by the detection system at a 10 Hz frequency for an NO
2 gas concentration ranging from 0 ppm to 500 ppm. The gases were cycled between the reference gas N
2 and different concentrations of NO
2 gas. The time duration for each gas to run was set at 1 min. When the gas concentration reached the set value, we measured and recorded the voltage ratio of the two channels. The results showed that in general, a higher voltage response was observed for the long optical cell at a higher gas concentration. The voltage response changed by 900 mV due to 500 ppm NO
2. Then, the corresponding relationship between the concentration of NO
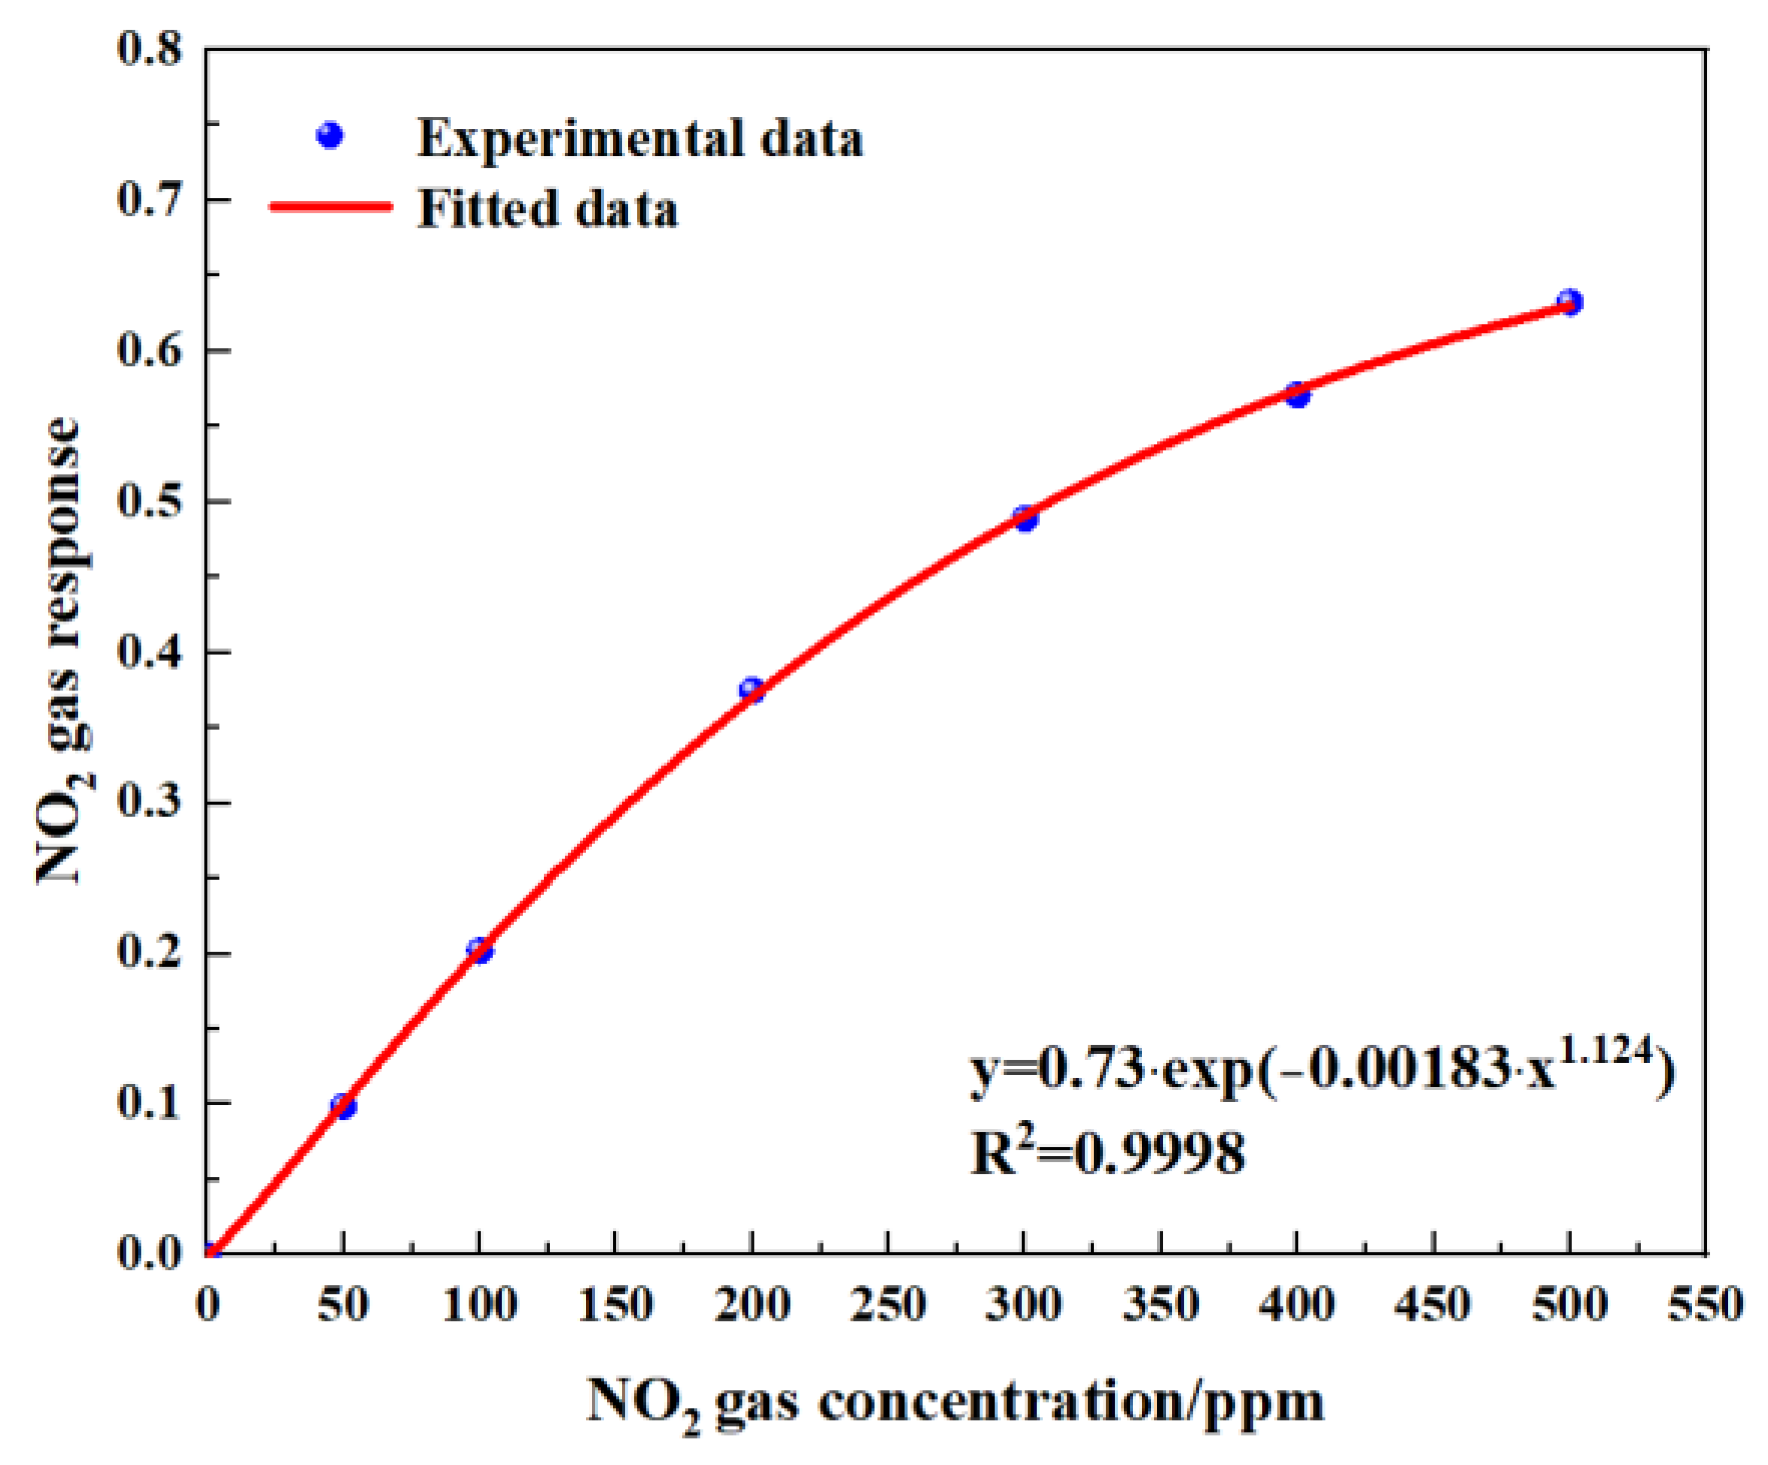
2 and the ratio of the voltage was obtained through data fitting. The experimental data of the NO
2 gas responses in
Figure 15 are fitted using the modified Beer–Lambert equation, and we can obtain:
where
y is the fractional absorbance and
x is the NO
2 concentration.
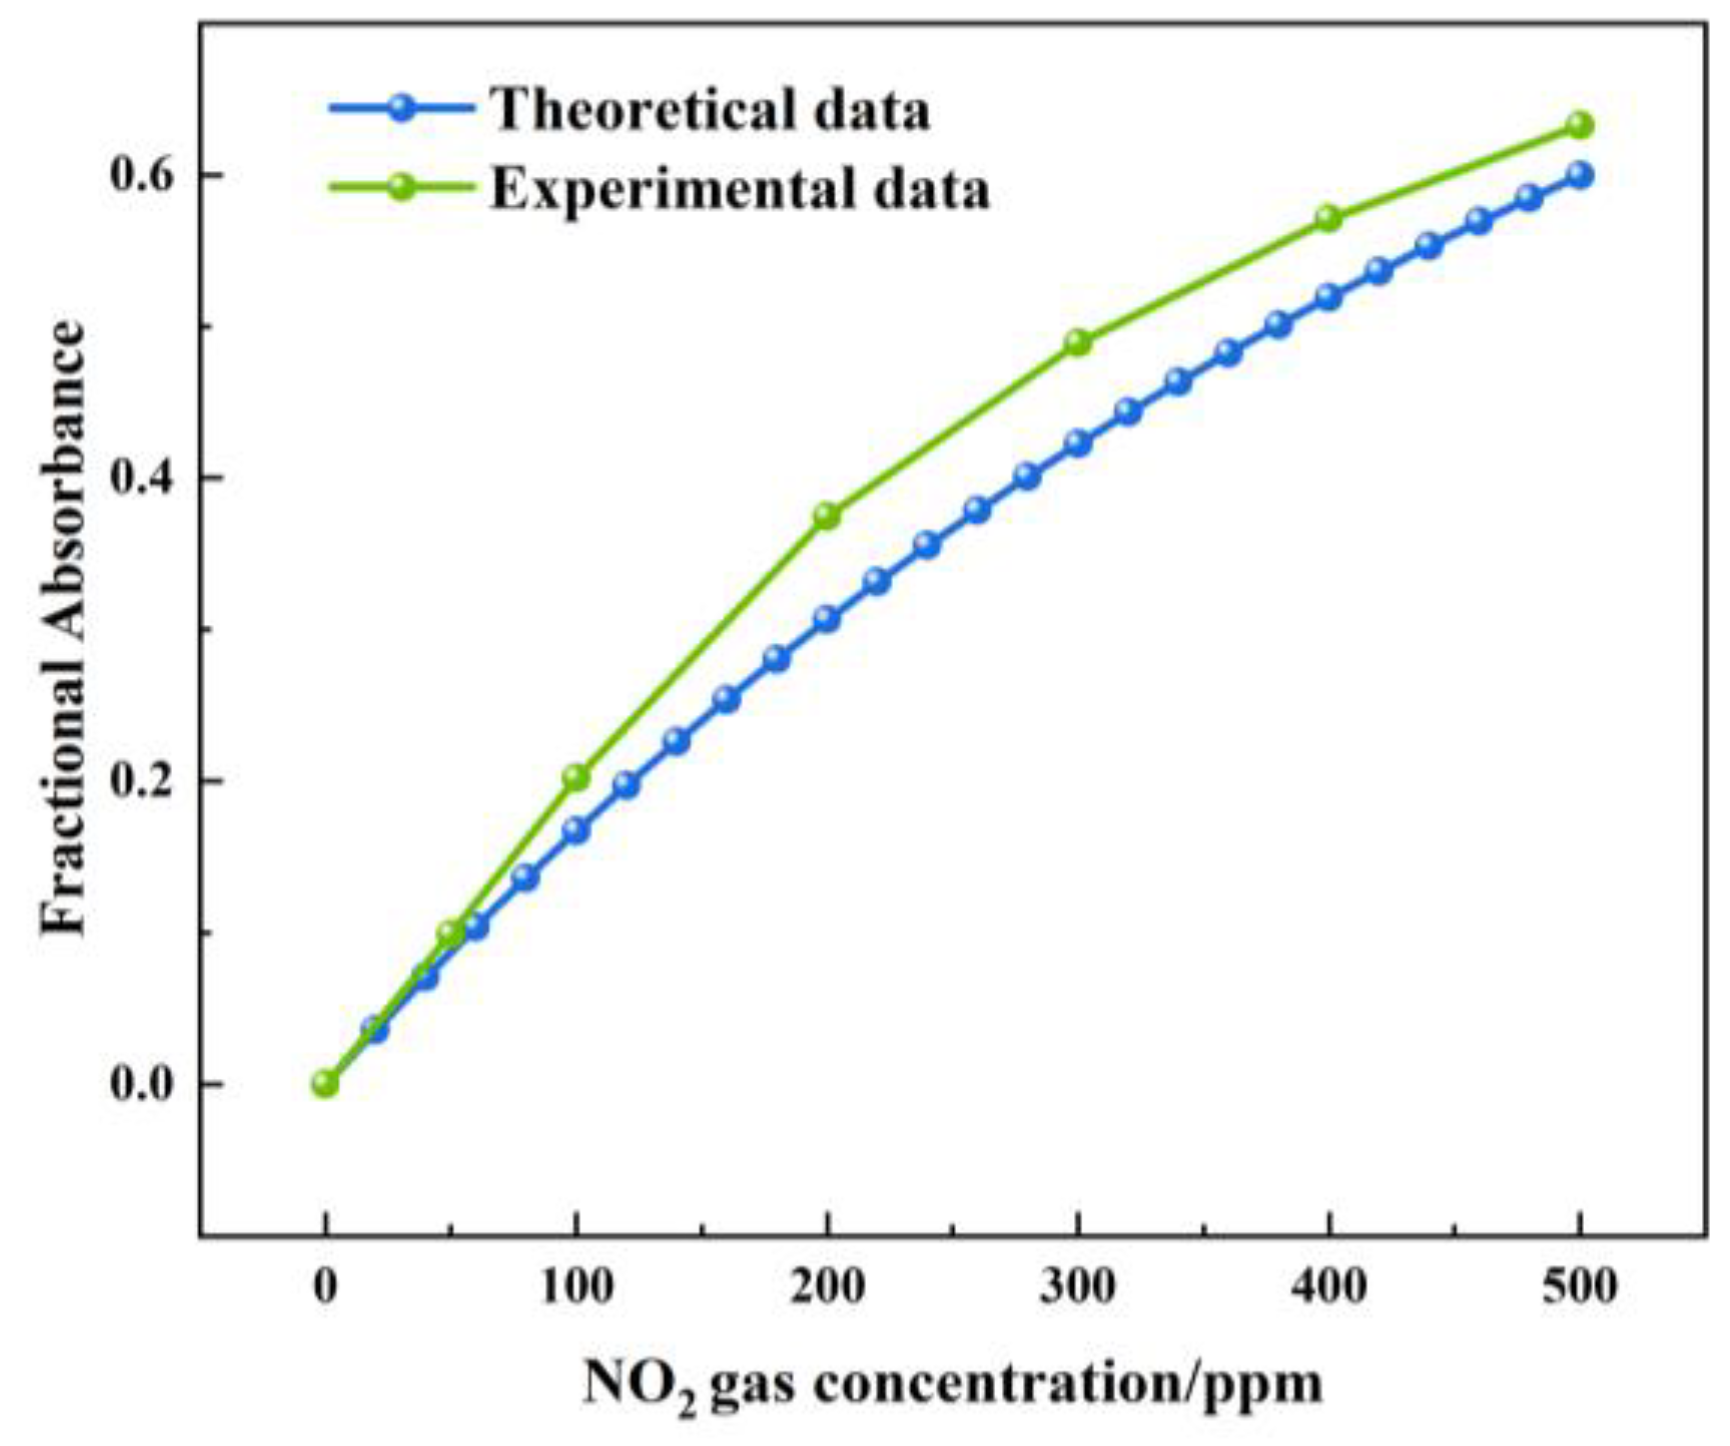
Figure 16 shows the theoretical and actual values of the FA variation with a NOx concentration under a 1.5 m light path length. The theoretical value of the FA variation was between 0 and 0.599. The actual value of the FA variation was between 0 and 0.632. The largest deviation was 0.07, which was observed at a concentration of 200 ppm. The measured value of the FA variation was higher than the theoretical value. The reason was that, when infrared light passed through the gas chamber, a small part of the infrared light was absorbed by the gas chamber.
4.3. Relative Error of Gas Sensor
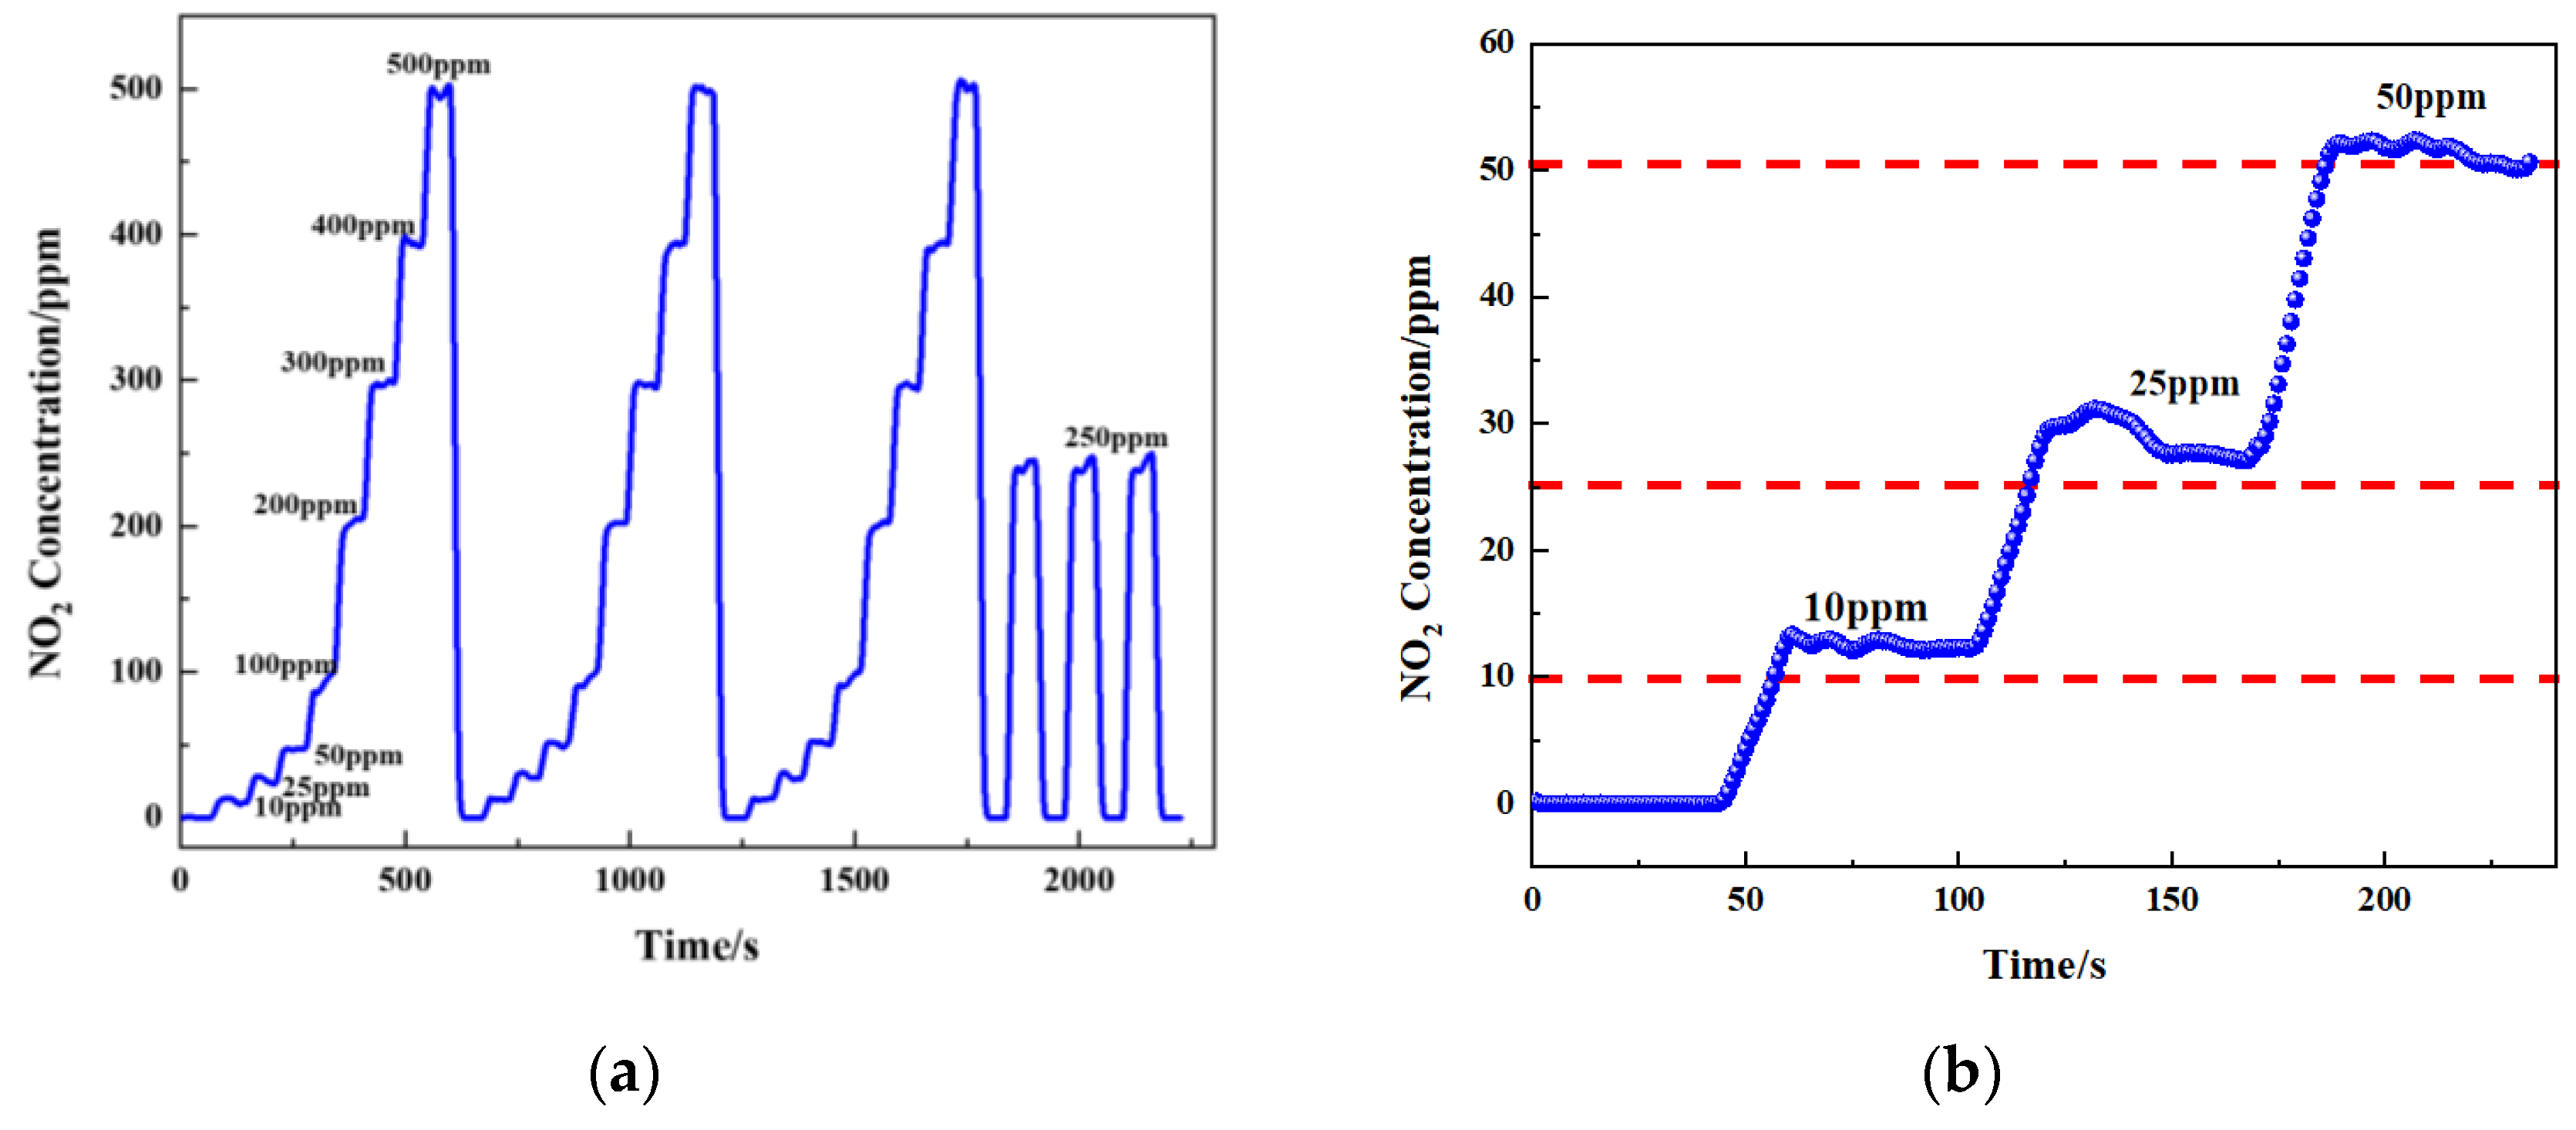
According to the fitted formula, different concentrations of gas were passed in (10 ppm, 25 ppm, 50 ppm, 100 ppm, 200 ppm, 300 ppm, 400 ppm, and 500 ppm), and then the sensor output concentration was detected (
Figure 17a,b). To verify the accuracy of the gas sensor, the measured results are shown in
Table 3. Tests showed that the maximum error of the sensor was less than 10 ppm in the concentration range of 0–500 ppm. The relative error (δ) was calculated using Equation (11).
where
xm and
xs are the measurement concentration and true concentration, respectively. R denotes the full scale.
Table 3 shows the NO
2 concentration between 10 ppm and 500 ppm, and the relative error was between −1.13% and 0.46%. The largest deviation was −1.13%, which was observed at a concentration of 100 ppm, whereas the smallest deviation was 0.26%, which was observed at a concentration of 200 ppm. According to the Beer–Lambert law, monochromatic radiation should ideally be used. When infrared radiation passes through the optical path, the light intensity will change. It will cause differences between the theoretical and actual measurements. The accuracy of the signal-processing circuit also affects the accuracy of the sensor. Therefore, adding a more accurate analog circuit and filter circuit to the signal-processing circuit is helpful to improve the measurement accuracy of the NO
2 gas sensor.
To calculate the limit of the gas sensor, the measurements obtained seven groups of data. The experimental data of the measured NO
2 are shown in
Table 4. The limit of the gas sensor was calculated using Equation (12):
where
MDL is the detection limit of the gas sensor,
n is the number of measurements,
t is the t-distribution, and
S is the standard deviation of the measured value. When seven groups of data were measured,
t(6,0.99) was 3.143 [
31].
Through the calculation of experimental values, the limit of the gas sensor was 2.8 ppm. The detection limit of the NO2 gas sensor depended on the intensity of the light source, the sensitivity of the detector, and the noise of the detector. Although the sensor obtained a low detection limit, it was not the best result. It is necessary to optimize the detection limit of the detector through the data-processing algorithm.
4.4. Linearity of Gas Sensor
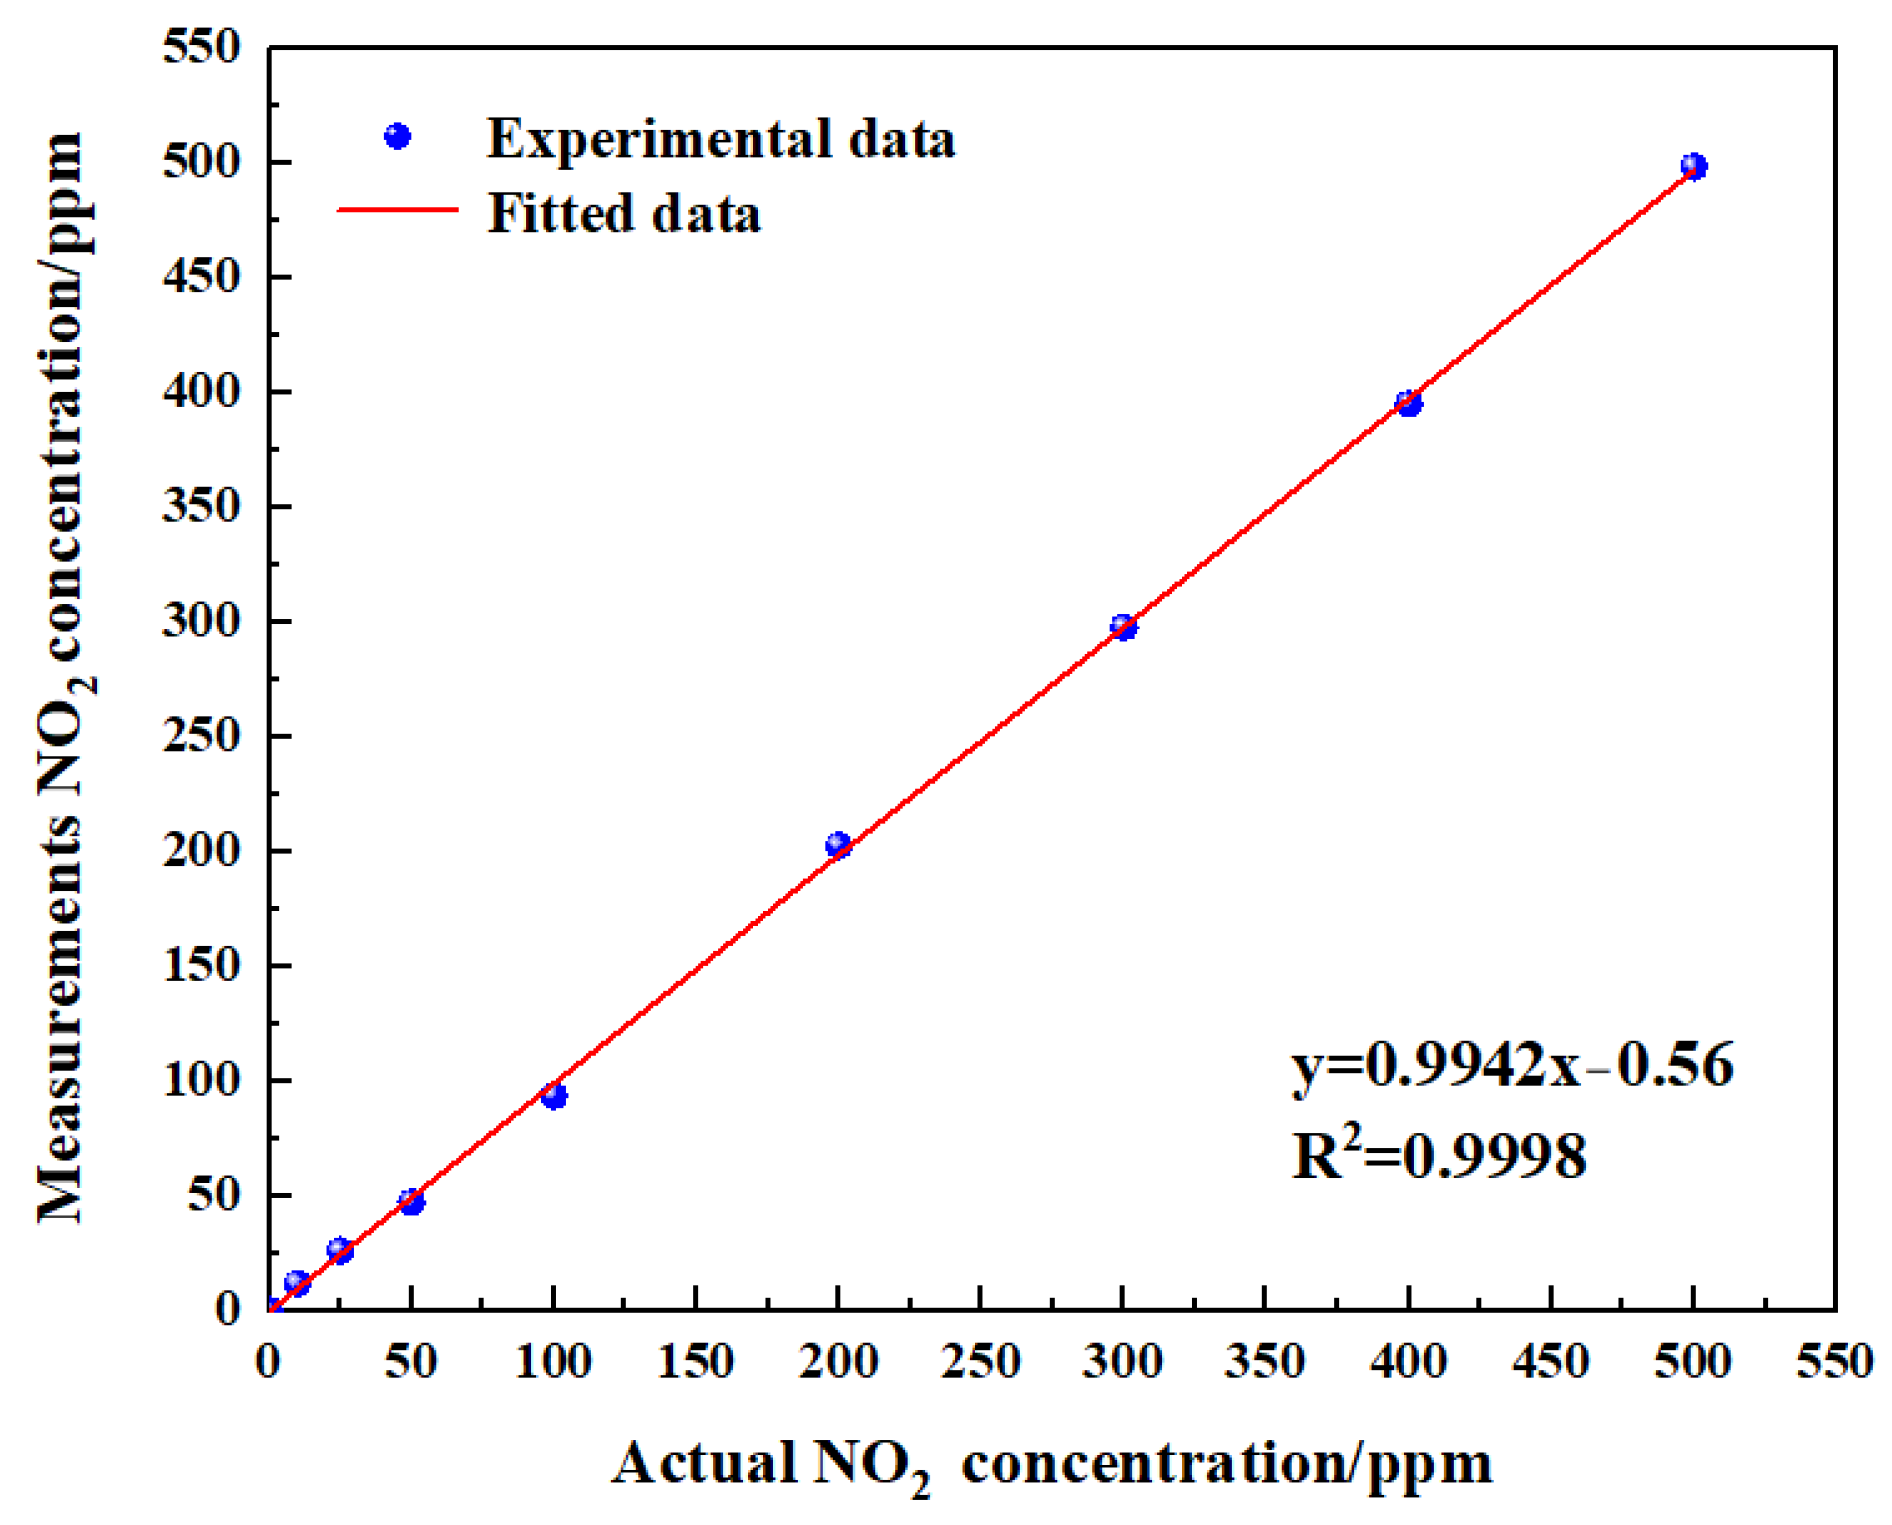
To verify the linearity of the gas sensor, the measurements obtained eight groups of data (
Figure 18). The experimental data of measurement NO
2 are shown in
Table 5. The linearity was calculated using Equation (13):
Through the calculation of the experimental and fitting values, the linearity of the gas sensor was −1.09%. It can be concluded from the test results that the gas sensor had a good linearity. Improving the linearity of the sensor was very critical, as reducing the temperature drift of the sensor and increasing the accuracy of signal processing can effectively improve the linearity of the sensor.
4.5. Repeatability and Stability of Gas Sensor
To verify the repeatability of the gas sensor, the gas sensor was tested six times, and the experimental data of the measured NO
2 are shown in
Table 6. The repeatability was calculated using Equation (14).
The long-term stability of the gas sensor was demonstrated inside the chamber. Initially, the chamber was cleaned by N
2 for 2 min. Subsequently, the concentration of NO
2 in the chamber were set as 500 ppm. The data interval was set to 24 h, and six data points for each gas were collected. The experimental data of NO
2 are shown in
Table 6. Based on
Table 5, the stability
δs for the multi-gas sensor can be calculated through Equation (15).
where
xmax and
xs are the maximum drift concentration and true concentration.
R denotes the full scale.
The repeatability of NO
2 was 0.47% at a concentration of 500 ppm. The instability of the pyroelectric detector and source lead to a difference in the accuracy of each sampling, which might have led to erroneous measurement results. It can be observed from
Table 4 that the stability of the system was 2% at a concentration of 500 ppm. Therefore, the gas sensor had a good repeatability and stability.
It can be seen from the above test results that there were many factors affecting the accuracy, detection limit, and consistency of the NDIR gas sensor. Methods for enhancing sensor performance primarily include improving the performance of pyroelectric detectors, IR emitters, gas chambers, filter algorithm enhancement, and compensation algorithm refinement. To improve sensor accuracy and detection limits, we will focus on enhancing the detector performance and optimizing the signal-filtering algorithm. For pyroelectric infrared detectors, in addition to the design of the sensor structure, the detectivity can be further improved by using thinner LT materials. In addition, thinner infrared-absorbing materials can be used to reduce the heat capacity and further improve the properties of pyroelectric infrared detectors.
Another key measure is implementing a filter algorithm based on FFT to significantly reduce noise levels. The filter’s performance is influenced by the sampling period and MEMS IR emitter modulation frequency. Selecting an appropriate modulation frequency for the MEMS IR emitter ensures the optimal detector performance, while using digital filters based on Fourier transform effectively reduces noise at high frequencies. By combining the MEMS IR emitter modulation frequency with filtering algorithms, we can achieve minimal gas sensor detection limits.
Furthermore, it is important to note that infrared absorbance varies with ambient temperature and humidity conditions. Therefore, we plan to incorporate temperature and humidity compensation algorithms into STM32 to ensure sensor accuracy under varying environmental conditions.
5. Conclusions
In summary, a NO2 gas detection system based on NDIR spectroscopy was designed and implemented. The system included a developed dual-channel pyroelectric detector with D* value of 4.19 × 108 cm·√Hz/W, a long-light-path white chamber, MEMS IR emitter, and a signal-processing circuit board. Then, an inversion model was established between the output voltage of the detector and the concentration based on experimental data. The gas sensor was capable of detecting concentrations in the range of 0–500 ppm with measurement error of less than 5 ppm for NO2. Preliminary experiments indicated that the full-scale relative error of the gas sensor changed by less than 0.46%, with a limit of 2.8 ppm, a linearity of −1.09%, a repeatability of 0.47% at a concentration of 500 ppm, and a stability of 2% at a concentration of 500 ppm. The experimental results demonstrated that the NDIR NO2 gas sensor exhibited a good precision, low detection limit, modest stability, and good repeatability. Subsequently, with further improvement of the pyroelectric detector and optimization of the signal-filtering algorithm, the accuracy and detection limit of the developed NDIR NO2 gas sensor are expected to be improved, which is expected to be applied in the field of emission monitoring and gas analysis instrumentation.

 ,
, 


