
Sub-Aperture Synthetic Aperture Radar Imaging of Fixed-Platform Beam-Steering Radar for Blast Furnace Burden Surface Detection

Abstract
:1. Introduction
- BF is a huge closed reaction vessel, and the installation position, size, number, and motion of the detection device are strictly limited.
- The light intensity inside the BF fluctuates greatly.
- High temperature, high pressure, high dust, and strong noise all have a significant impact on the imaging process.
- The motion characteristics of fixed-platform beam-steering radar are studied, and the target range–azimuth coupled distance history model under the sub-aperture of fixed-platform beam-steering radar is established.
- The azimuthal Doppler variation characteristics of the fixed-platform beam-steering process are analyzed, its spatial–temporal representation is deduced, and the transform domain compensation method is proposed.
- The methods of FMCW sub-aperture FPBS-SAR imaging and the TGMOL-CFAR incoherent noise suppression are proposed, and the imaging method proposed is verified by simulation tests and industrial data.
2. Industrial Beam Steering Radar Signal Modeling and Spatial Variation Characterization
2.1. Beam-Steering Radar SAR Imaging Mechanism Modeling
2.2. Analysis of Accompanying Spatial Variation
2.3. Azimuthal Doppler Characteristics and Azimuthal Resolution
3. FPBS-SAR Imaging Methods
3.1. Radar Echo Model
3.2. Analysis of Echo Signals
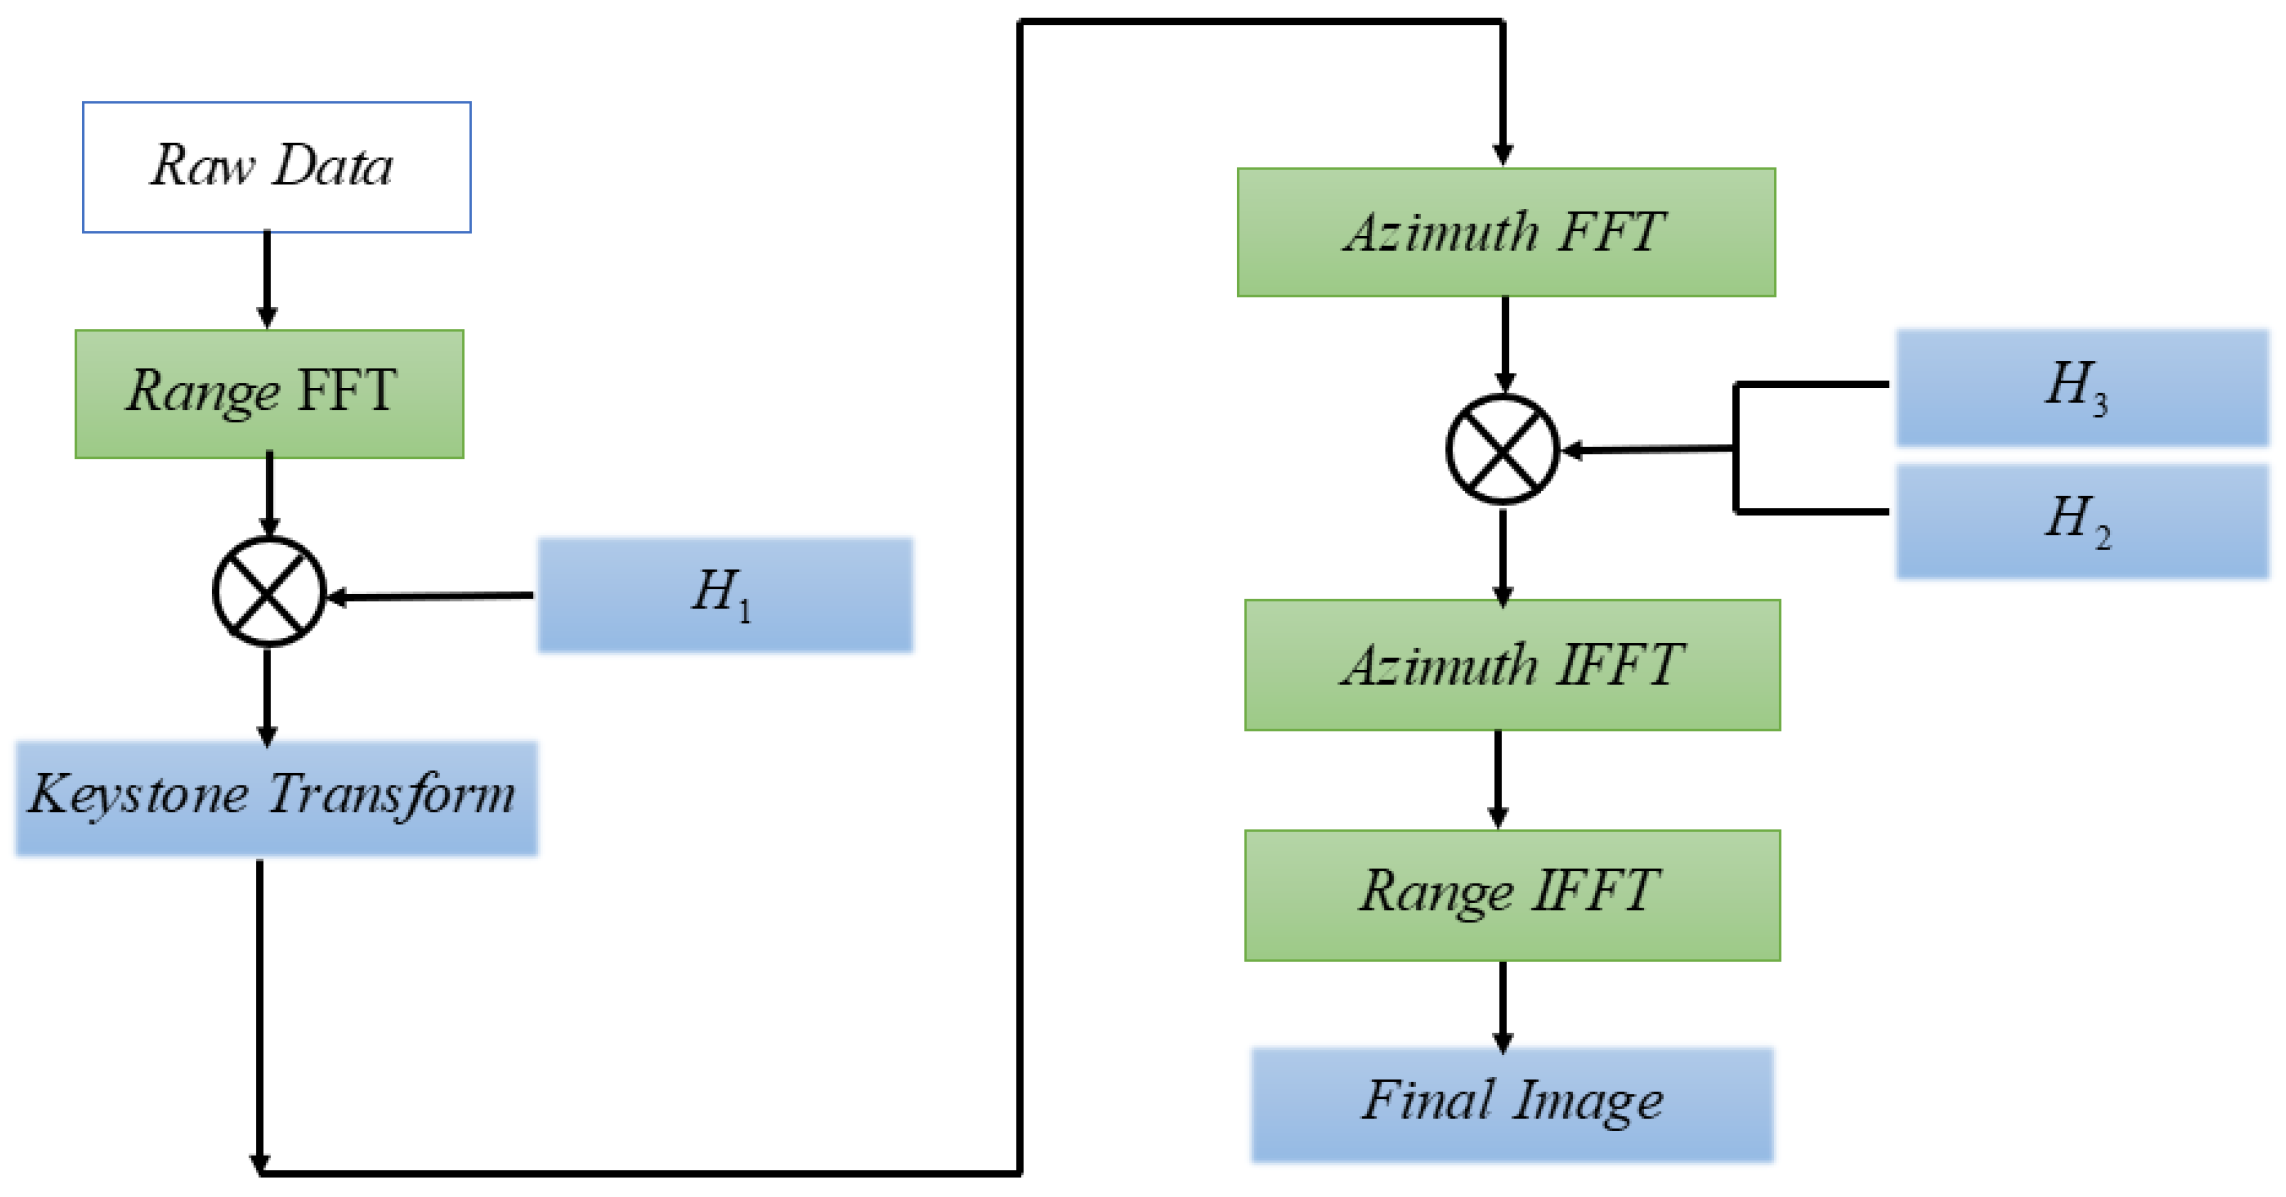
3.3. Methods of Sub-Aperture FPBS-SAR Imaging
3.4. TGMOL-CFAR
4. Experiments
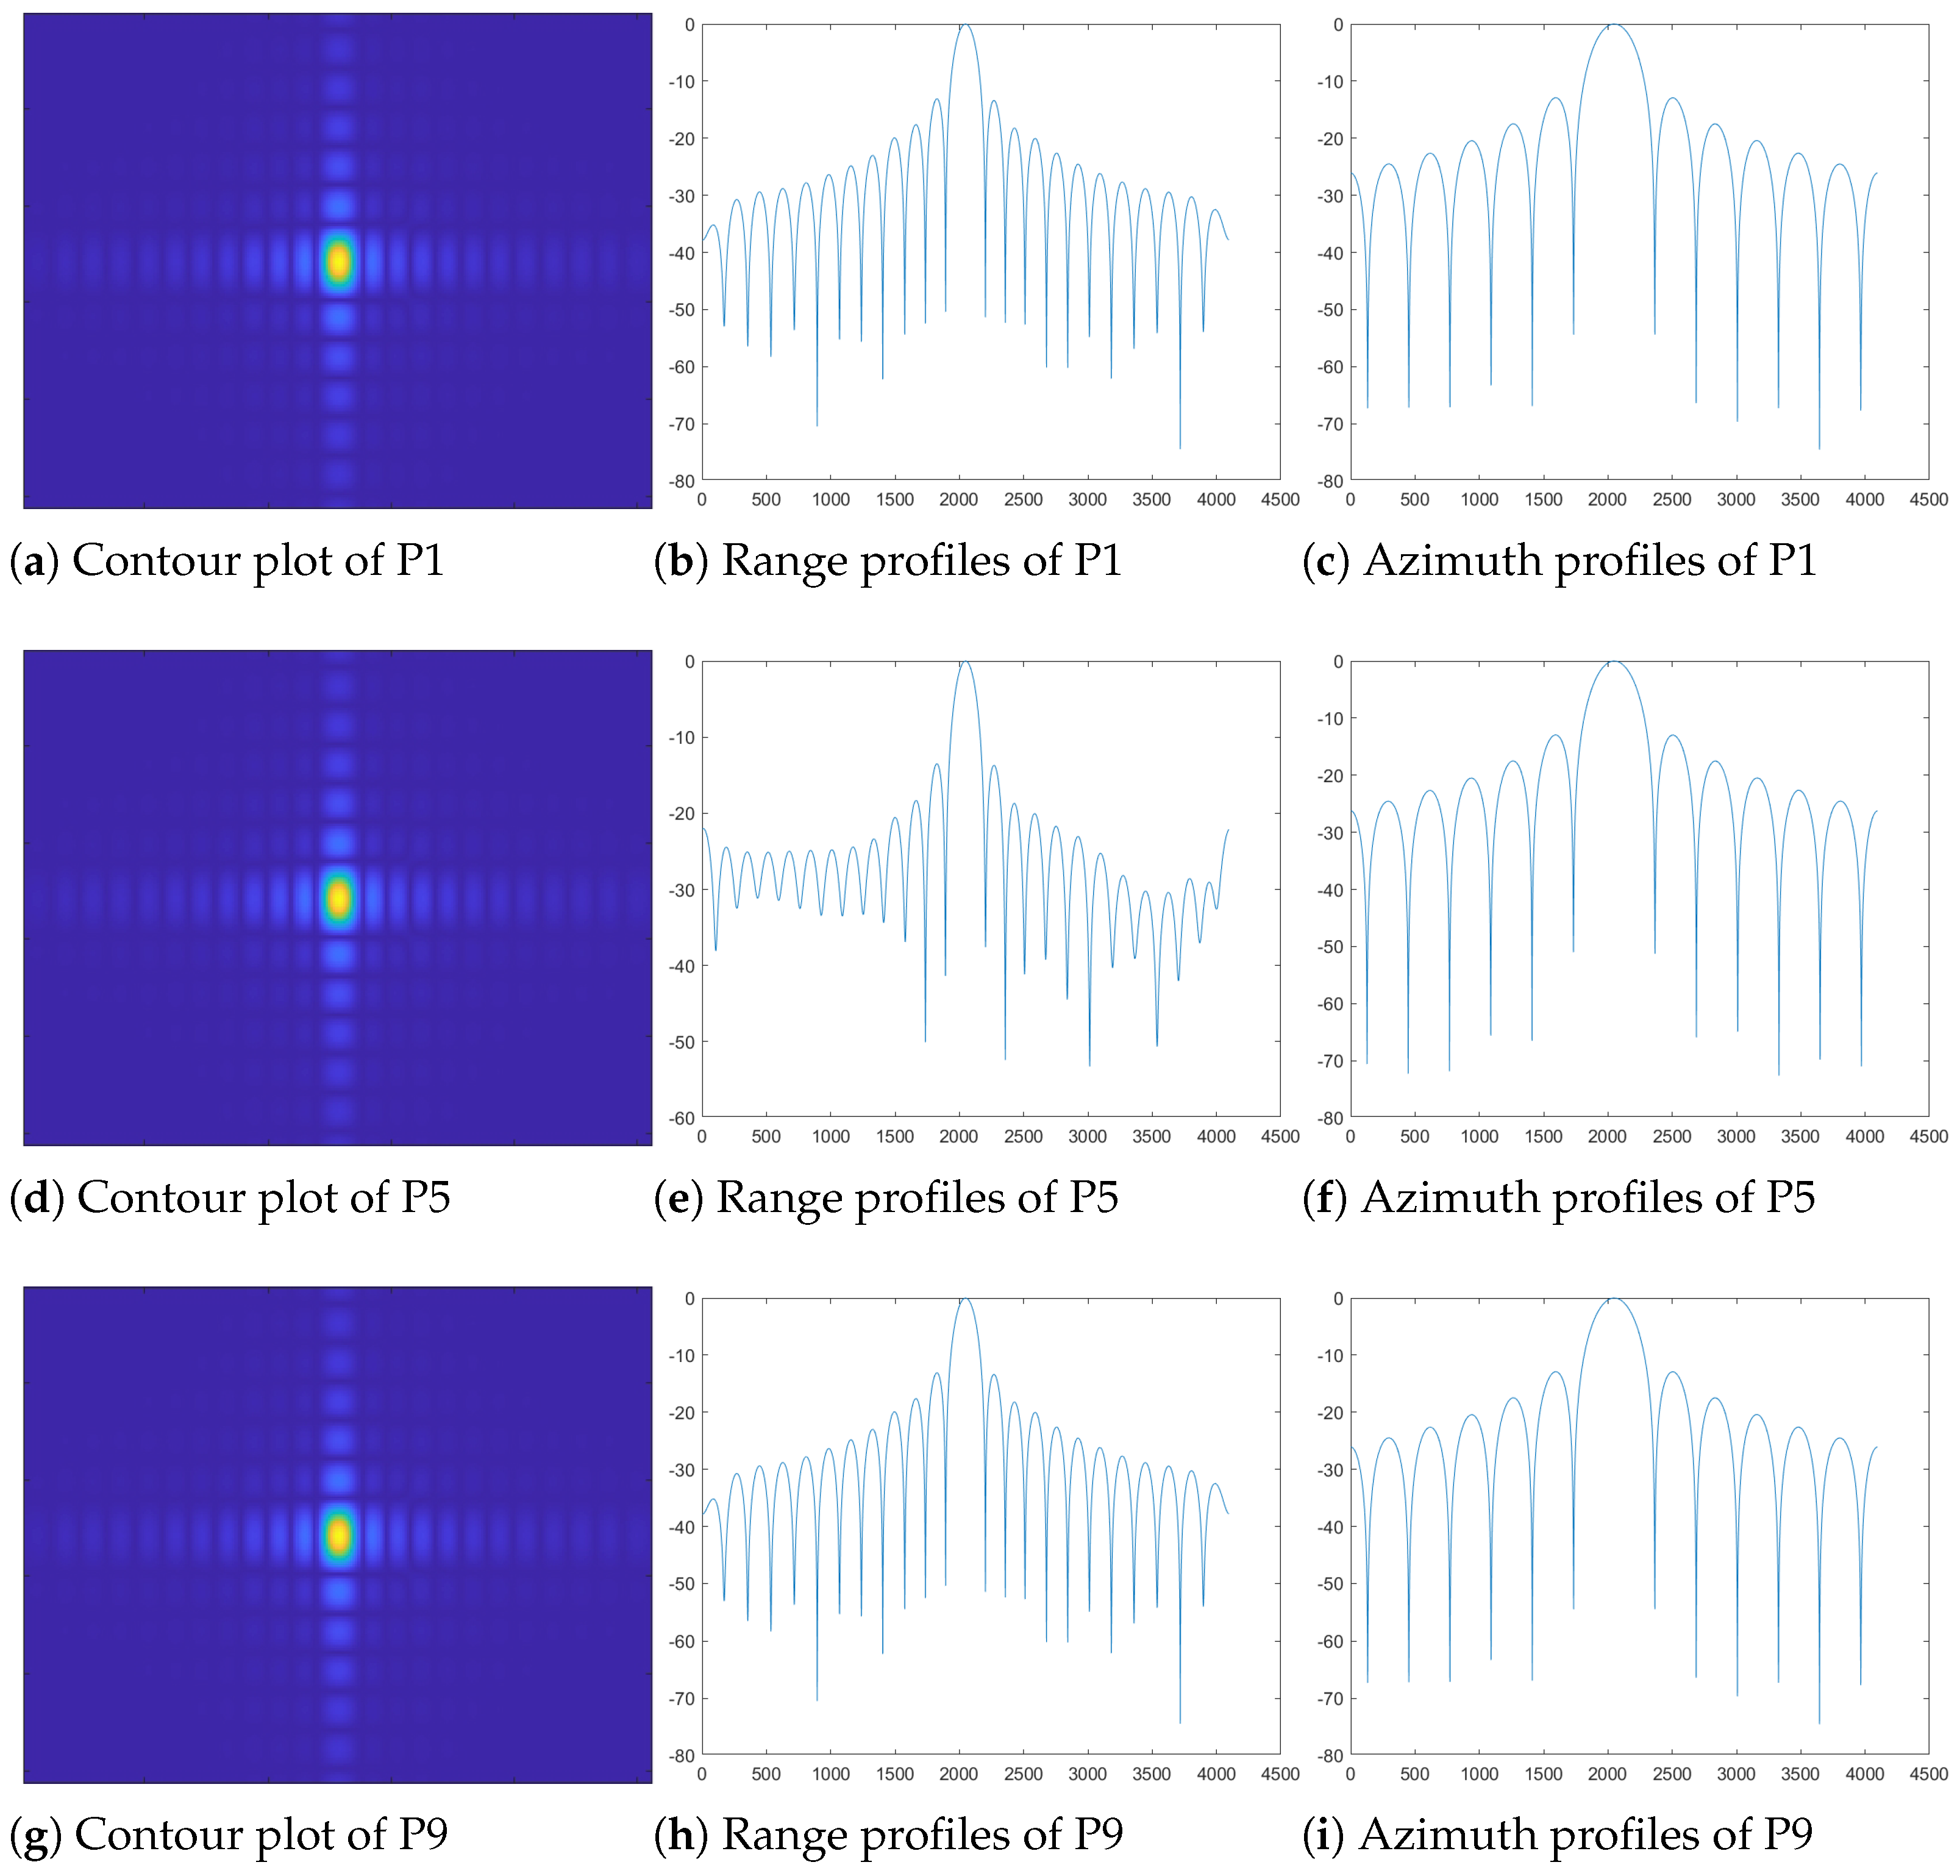
4.1. Simulation
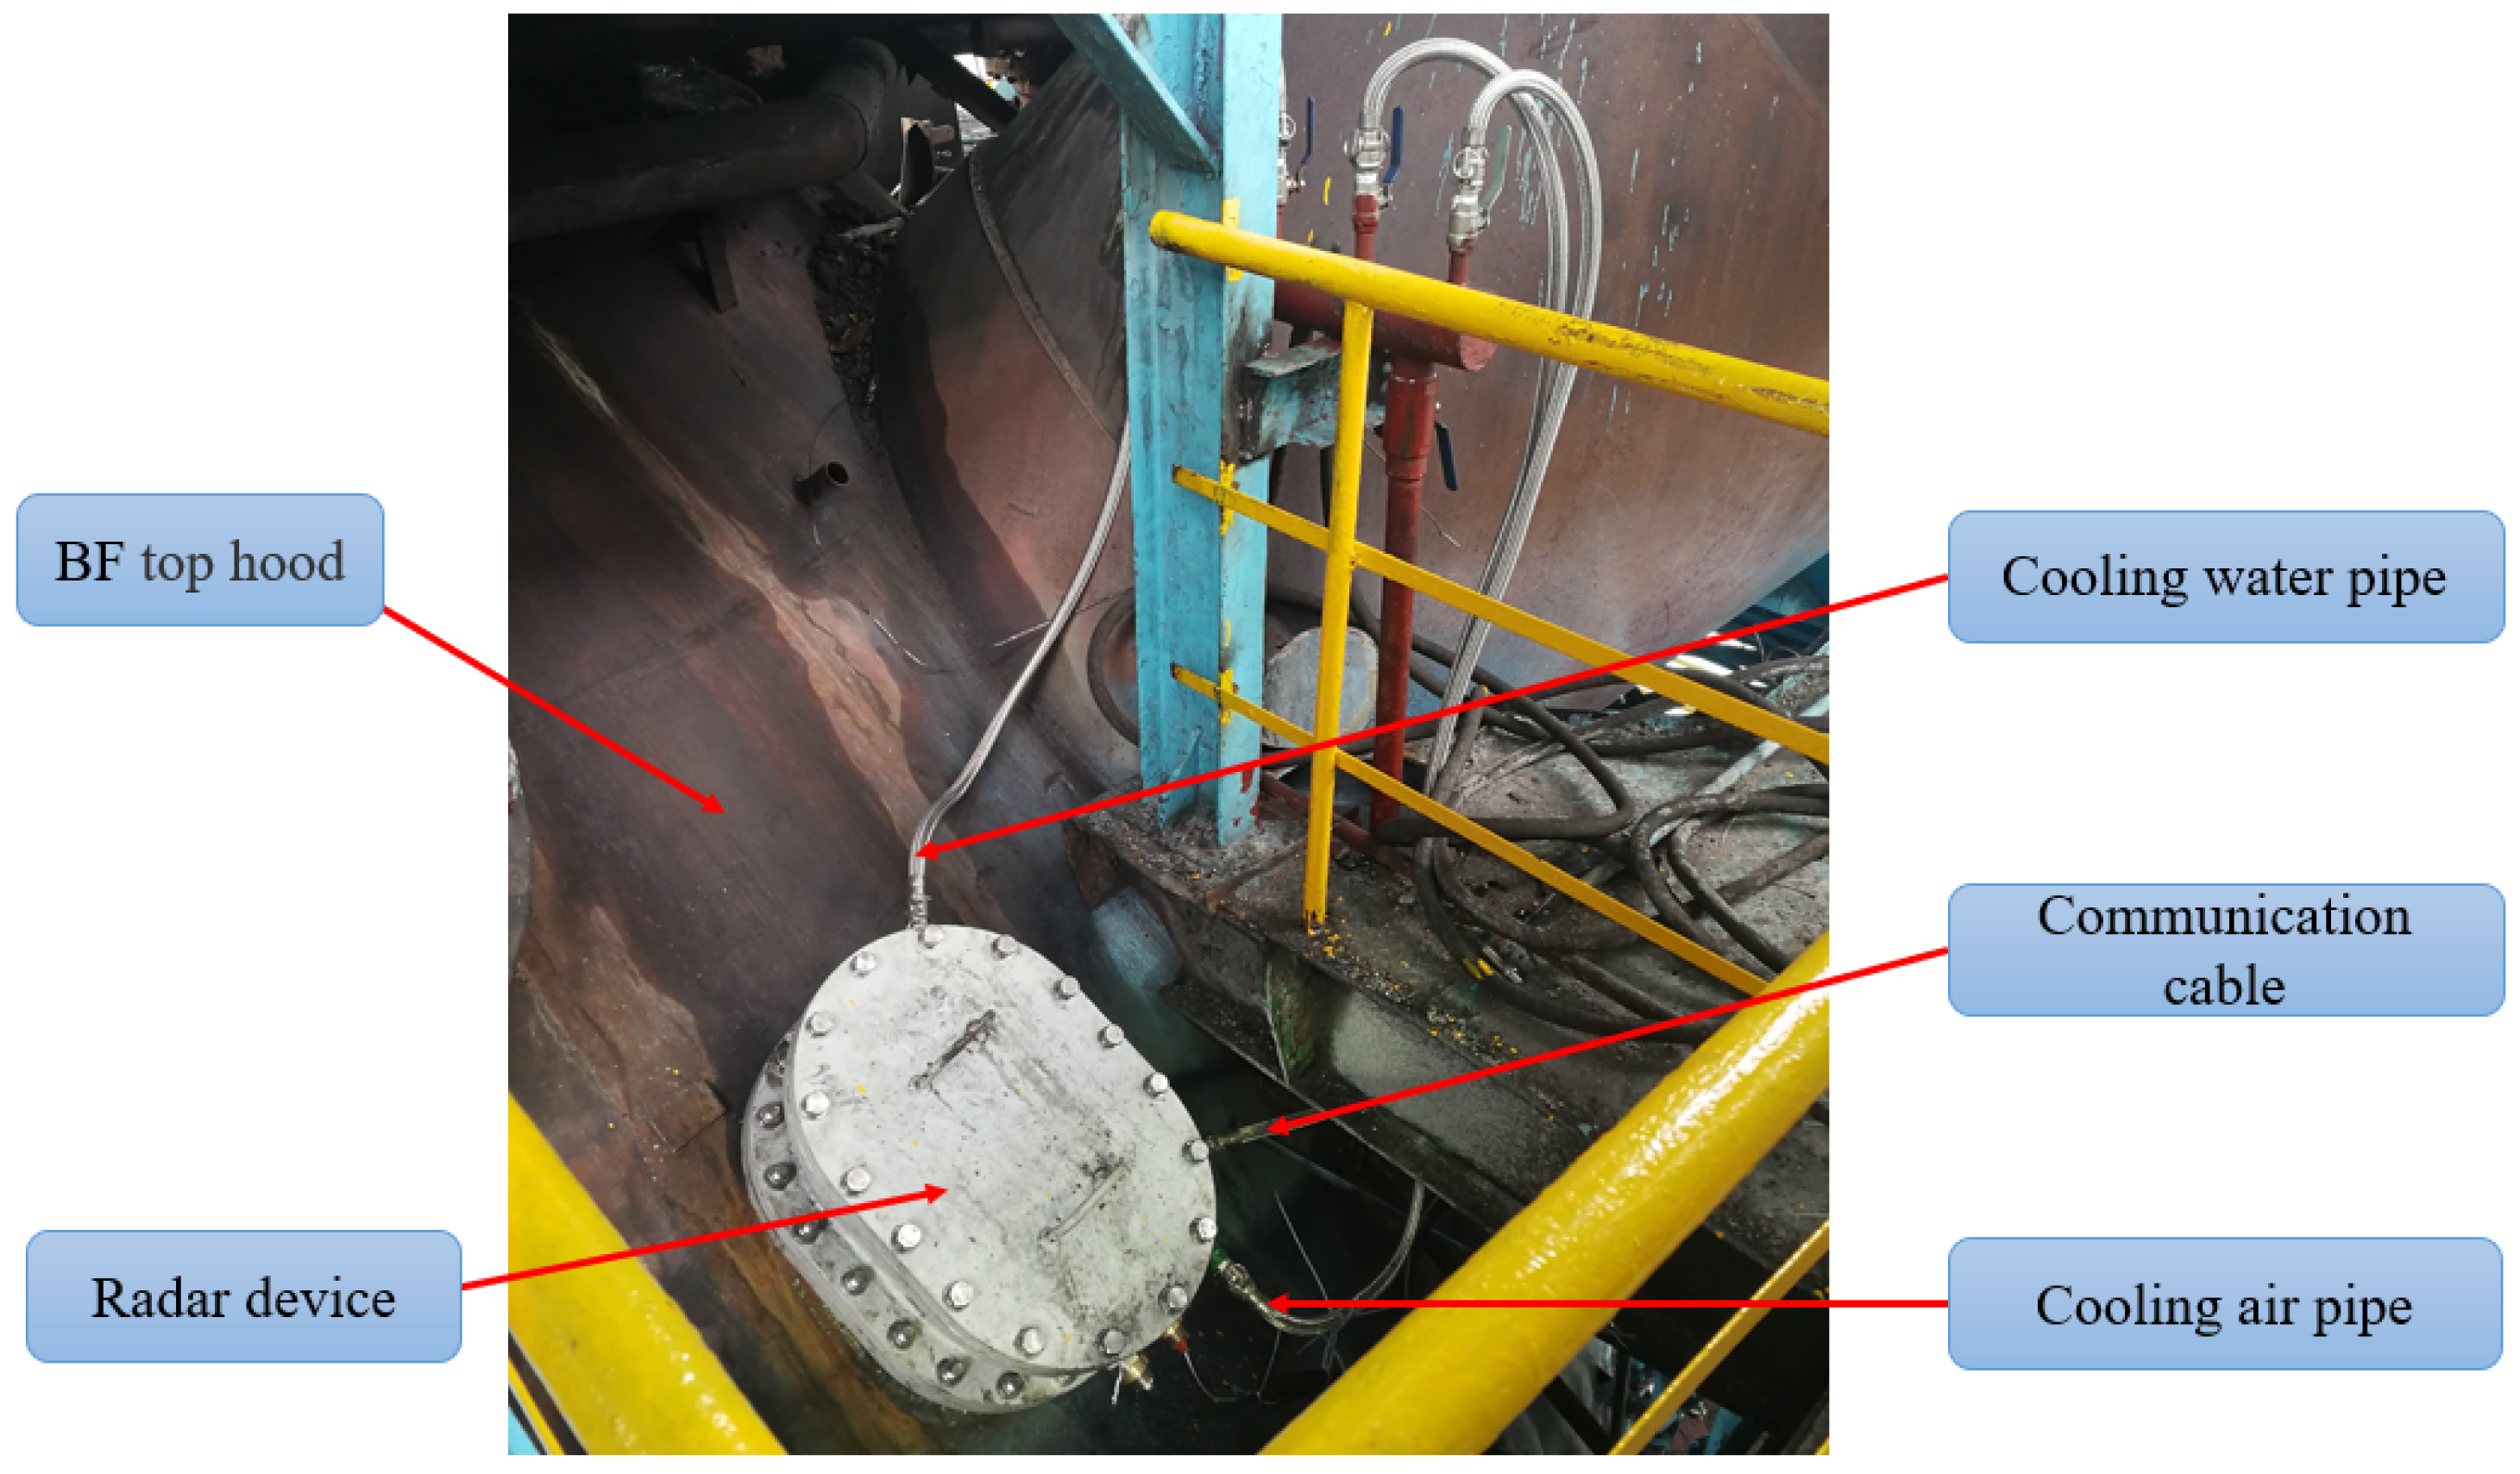
4.2. Industrial Data Validation
4.3. BF Clutter Suppression Validation
5. Discussion
6. Conclusions
Author Contributions
Funding
Institutional Review Board Statement
Informed Consent Statement
Data Availability Statement
Acknowledgments
Conflicts of Interest
References
- Chen, Z.; Jiang, Z.; Yang, C.; Gui, W. Detection of blast furnace stockline based on a spatial–temporal characteristic cooperative method. IEEE Trans. Instrum. Meas. 2020, 70, 2500213. [Google Scholar] [CrossRef]
- Li, Z.; Kuang, S.; Liu, S.; Gan, J.; Yu, A.; Li, Y.; Mao, X. Numerical investigation of burden distribution in ironmaking blast furnace. Powder Technol. 2019, 353, 385–397. [Google Scholar] [CrossRef]
- Shi, Q.; Wu, J.; Ni, Z.; Lv, X.; Ye, F.; Hou, Q.; Chen, X. A blast furnace burden surface deeplearning detection system based on radar spectrum restructured by entropy weight. IEEE Sens. J. 2020, 21, 7928–7939. [Google Scholar] [CrossRef]
- Li, Y.; Zhang, S.; Zhang, J.; Yin, Y.; Xiao, W.; Zhang, Z. Data-driven multiobjective optimization for burden surface in blast furnace with feedback compensation. IEEE Trans. Ind. Inform. 2019, 16, 2233–2244. [Google Scholar] [CrossRef]
- Aberman, K.; Eldar, Y.C. Sub-Nyquist SAR via Fourier domain range-Doppler processing. IEEE Trans. Geosci. Remote Sens. 2017, 55, 6228–6244. [Google Scholar] [CrossRef]
- Zhu, J.; Gui, W.; Chen, Z.; Jiang, Z. A Novel Non-Contact and Real-Time Blast Furnace Stockline Detection Method Based on Burden Surface Video Streams. IEEE Trans. Instrum. Meas. 2023, 72, 4502213. [Google Scholar] [CrossRef]
- Huang, J.; Chen, Z.; Jiang, Z.; Gui, W. 3D topography measurement and completion method of blast furnace burden surface using high-temperature industrial endoscope. IEEE Sens. J. 2020, 20, 6478–6491. [Google Scholar] [CrossRef]
- Huang, J.; Jiang, Z.; Gui, W.; Yi, Z.; Pan, D.; Zhou, K.; Xu, C. Depth estimation from a single image of blast furnace burden surface based on edge defocus tracking. IEEE Trans. Circuits Syst. Video Technol. 2022, 32, 6044–6057. [Google Scholar] [CrossRef]
- Chen, X.; Wei, J.; Xu, D.; Hou, Q.; Bai, Z. 3-Dimension imaging system of burden surface with 6-radars array in a blast furnace. ISIJ Int. 2012, 52, 2048–2054. [Google Scholar] [CrossRef]
- Tian, J.; Tanaka, A.; Meng, Y.; Hou, Q.; Chen, X. Tracking the burden surface radial profile of a blast furnace by a B-mode mechanical swing radar system. ISIJ Int. 2020, 60, 297–307. [Google Scholar] [CrossRef]
- Zankl, D.; Schuster, S.; Feger, R.; Stelzer, A.; Scheiblhofer, S.; Schmid, C.M.; Ossberger, G.; Stegfellner, L.; Lengauer, G.; Feilmayr, C. BLASTDAR—A large radar sensor array system for blast furnace burden surface imaging. IEEE Sens. J. 2015, 15, 5893–5909. [Google Scholar] [CrossRef]
- Sun, G.-C.; Liu, Y.; Xiang, J.; Liu, W.; Xing, M.; Chen, J. Spaceborne synthetic aperture radar imaging algorithms: An overview. IEEE Geosci. Remote Sens. Mag. 2021, 10, 161–184. [Google Scholar] [CrossRef]
- Zeng, T.; Yin, W.; Ding, Z.; Long, T. Motion and Doppler characteristics analysis based on circular motion model in geosynchronous SAR. IEEE J. Sel. Top. Appl. Earth Obs. Remote Sens. 2015, 9, 1132–1142. [Google Scholar] [CrossRef]
- Zhao, B.; Qi, X.; Deng, Y.; Wang, R.; Song, H.; Luo, Y. A new method of improving the accuracy of the hyperbolic range equation. In Proceedings of the 2012 IEEE International Geoscience and Remote Sensing Symposium, Munich, Germany, 22–27 July 2012; pp. 5770–5773. [Google Scholar]
- Guo, Y.; Wang, P.; Men, Z.; Chen, J.; Zhou, X.; He, T.; Cui, L. A Modified Range Doppler Algorithm for High-Squint SAR Data Imaging. Remote Sens. 2023, 15, 4200. [Google Scholar] [CrossRef]
- Dong, J.; Zhang, Q.; Huang, W.; Wang, H.; Lu, W.; Liu, X. Deceptive Jamming Algorithm against Synthetic Aperture Radar in Large Squint Angle Mode Based on Non-Linear Chirp Scaling and Low Azimuth Sampling Reconstruction. Remote Sens. 2023, 15, 5446. [Google Scholar] [CrossRef]
- Liu, W.; Sun, G.-C.; Xia, X.-G.; Chen, J.; Guo, L.; Xing, M. A modified CSA based on joint time-Doppler resampling for MEO SAR stripmap mode. IEEE Trans. Geosci. Remote Sens. 2018, 56, 3573–3586. [Google Scholar] [CrossRef]
- Ding, Z.; Xiao, F.; Xie, Y.; Yu, W.; Yang, Z.; Chen, L.; Long, T. A modified fixed-point chirp scaling algorithm based on updating phase factors regionally for spaceborne SAR real-time imaging. IEEE Trans. Geosci. Remote Sens. 2018, 56, 7436–7451. [Google Scholar] [CrossRef]
- Yan, J.; Li, L.; Li, H.; Ke, M.; Ma, X.; Sun, X. An Improved UAV Bi-SAR Imaging Algorithm with Two-Dimensional Spatial Variant Range Cell Migration Correction and Azimuth Non-Linear Phase Equalization. Remote Sens. 2023, 15, 3734. [Google Scholar] [CrossRef]
- Gao, Y.; Liang, D.; Fang, T.; Zhou, Z.-X.; Zhang, H.; Wang, R. A modified extended wavenumber-domain algorithm for ultra-high resolution spaceborne spotlight SAR data processing. In Proceedings of the IGARSS 2020–2020 IEEE International Geoscience and Remote Sensing Symposium, Waikoloa, HI, USA, 26 September–2 October 2020; pp. 1544–1547. [Google Scholar]
- Liao, Y.; Wang, W.-Q.; Xing, M. A modified Omega-K algorithm for squint circular trace scanning SAR using improved range model. Signal Process. 2019, 160, 59–65. [Google Scholar] [CrossRef]
- Nie, X.; Lei, W.; Zhuang, L. A two-step wide-scene polar format algorithm for high-resolution highly-squinted SAR. IEEE Geosci. Remote Sens. Lett. 2022, 19, 4503405. [Google Scholar] [CrossRef]
- Bie, B.; Sun, G.-C.; Xia, X.-G.; Xing, M.; Guo, L.; Bao, Z. High-speed maneuvering platforms squint beam-steering SAR imaging without subaperture. IEEE Trans. Geosci. Remote Sens. 2019, 57, 6974–6985. [Google Scholar] [CrossRef]
- Moll, J.; Schops, P.; Krozer, V. Towards three-dimensional millimeter-wave radar with the bistatic fast-factorized back-projection algorithm—Potential and limitations. IEEE Trans. Terahertz Sci. Technol. 2012, 2, 432–440. [Google Scholar] [CrossRef]
- Chen, Q.; Liu, W.; Sun, G.C.; Chen, X.; Han, L.; Xing, M. A Fast Cartesian Back-Projection Algorithm Based on Ground Surface Grid for GEO SAR Focusing. IEEE Trans. Geosci. Remote Sens. 2022, 60, 5217114. [Google Scholar] [CrossRef]
- Chang, S.; Deng, Y.; Zhang, Y.; Zhao, Q.; Wang, R.; Zhang, K. An advanced scheme for range ambiguity suppression of spaceborne SAR based on blind source separation. IEEE Trans. Geosci. Remote Sens. 2022, 60, 5230112. [Google Scholar] [CrossRef]
- Wang, Y.; Song, Q.; Wang, J.; Yu, H. Airport runway foreign object debris detection system based on arc-scanning SAR technology. IEEE Trans. Geosci. Remote Sens. 2022, 60, 5221416. [Google Scholar] [CrossRef]
- Jiménez, L.P.J.; García, F.D.A.; Alvarado, M.C.L.; Fraidenraich, G.; de Lima, E.R. A general CA-CFAR performance analysis for weibull-distributed clutter environments. IEEE Geosci. Remote Sens. Lett. 2022, 19, 4025305. [Google Scholar] [CrossRef]
- He, S.; Shi, K.; Liu, C.; Guo, B.; Chen, J.; Shi, Z. Collaborative Sensing in Internet of Things: A Comprehensive Survey. IEEE Commun. Surv. Tutor. 2022, 24, 1435–1474. [Google Scholar] [CrossRef]
- Zhu, X.; Yang, C.; Zhou, C.; Shi, Z. Bayesian CFAR Detector in Weibull Clutter via Interference Control. In Proceedings of the 2023 IEEE/CIC International Conference on Communications in China (ICCC), Dalian, China, 10–12 August 2023; pp. 1–5. [Google Scholar]
- An, H.; Wu, J.; Teh, K.C.; Sun, Z.; Yang, J. Nonambiguous image formation for low-earth-orbit SAR with geosynchronous illumination based on multireceiving and CAMP. IEEE Trans. Geosci. Remote Sens. 2020, 59, 348–362. [Google Scholar] [CrossRef]


| Parameters | Valve |
|---|---|
| Carrier frequency/GHz | 24 |
| Range bandwidth/GHz | 2 |
| Frequency modulation rate/MHz/μs | 80 |
| Modulation duration/μs | 25 |
| ADC sampling frequency/MHz | 25 |
| Pulse repetition frequency/Hz | 40 |
| Pulse width/ms | 25.5 |
| Antenna beam angle/deg | 8 |
| Antenna length/m | 0.3 |
| Antenna steer angle/deg | −30°–3° |
| Antenna steer speed/rad/s | 0 2 |
| Target | PSLR (dB) | ISLR (dB) | ||
|---|---|---|---|---|
| Range | Azimuth | Range | Azimuth | |
| P1(10,5) | −10.68 | −11.95 | −10.87 | −11.87 |
| P2(10,10) | −10.83 | −12.15 | −10.90 | −11.98 |
| P3(10,15) | −10.70 | −12.06 | −10.86 | −11.88 |
| P4(20,5) | −10.73 | −12.08 | −10.77 | −11.91 |
| P5(20,10) | −10.80 | −12.18 | −10.88 | −11.81 |
| P6(20,15) | −10.66 | −12.02 | −10.81 | −11.93 |
| P7(20,5) | −10.74 | −12.08 | −10.87 | −11.89 |
| P8(20,10) | −10.79 | −12.15 | −10.91 | −11.96 |
| P9(20,15) | −10.72 | −12.06 | −10.84 | −11.91 |
Disclaimer/Publisher’s Note: The statements, opinions and data contained in all publications are solely those of the individual author(s) and contributor(s) and not of MDPI and/or the editor(s). MDPI and/or the editor(s) disclaim responsibility for any injury to people or property resulting from any ideas, methods, instructions or products referred to in the content. |
© 2024 by the authors. Licensee MDPI, Basel, Switzerland. This article is an open access article distributed under the terms and conditions of the Creative Commons Attribution (CC BY) license (https://creativecommons.org/licenses/by/4.0/).
Share and Cite
Deng, L.; Chen, X.; Hou, Q. Sub-Aperture Synthetic Aperture Radar Imaging of Fixed-Platform Beam-Steering Radar for Blast Furnace Burden Surface Detection. Sensors 2024, 24, 4479. https://doi.org/10.3390/s24144479
Deng L, Chen X, Hou Q. Sub-Aperture Synthetic Aperture Radar Imaging of Fixed-Platform Beam-Steering Radar for Blast Furnace Burden Surface Detection. Sensors. 2024; 24(14):4479. https://doi.org/10.3390/s24144479
Chicago/Turabian StyleDeng, Lifu, Xianzhong Chen, and Qingwen Hou. 2024. "Sub-Aperture Synthetic Aperture Radar Imaging of Fixed-Platform Beam-Steering Radar for Blast Furnace Burden Surface Detection" Sensors 24, no. 14: 4479. https://doi.org/10.3390/s24144479