
Multi-Source Feature-Fusion Method for the Seismic Data of Cultural Relics Based on Deep Learning


Abstract

1. Introduction
- Contributions:
- Formulate a multi-source data-processing strategy for seismic damage of cultural relics in collections. By defining the seismic damage event-ontology model; sorting out the relationship between the event attributes of the cultural relics in the collection; and designing an empirical model to solve the dynamic coefficient, center of mass, and other event attributes of cultural relics exhibition facilities, a universal and standardized seismic damage data index system for curatorial cultural relics is proposed.
- Propose a multi-source feature-fusion matching method based on deep learning, as well as the fusion of superpixel map convolution, to assess the damage status of seismic-damaged cultural relics. This is combined with deep learning fusion of multi-source information to realize automated annotation of massive cultural relics seismic damage image data to improve data quality and processing efficiency.
- Construct a complete dataset for the analysis of the impact of seismic damage on cultural relics in the collection. Based on a variety of seismic damage cultural relics data acquisition and automation methods, we processed the seismic damage data of 1352 cultural relics in the collection and formed an accurate, comprehensive, and standardized seismic damage dataset of cultural relics in the collection.
2. Related Works
2.1. Data Processing Strategy—Related Works for Cultural Relics
2.2. Multiple-Source Data Fusion—Related Works
3. Multi-Source Data-Processing Strategy for Seismic Damage of Cultural Relics
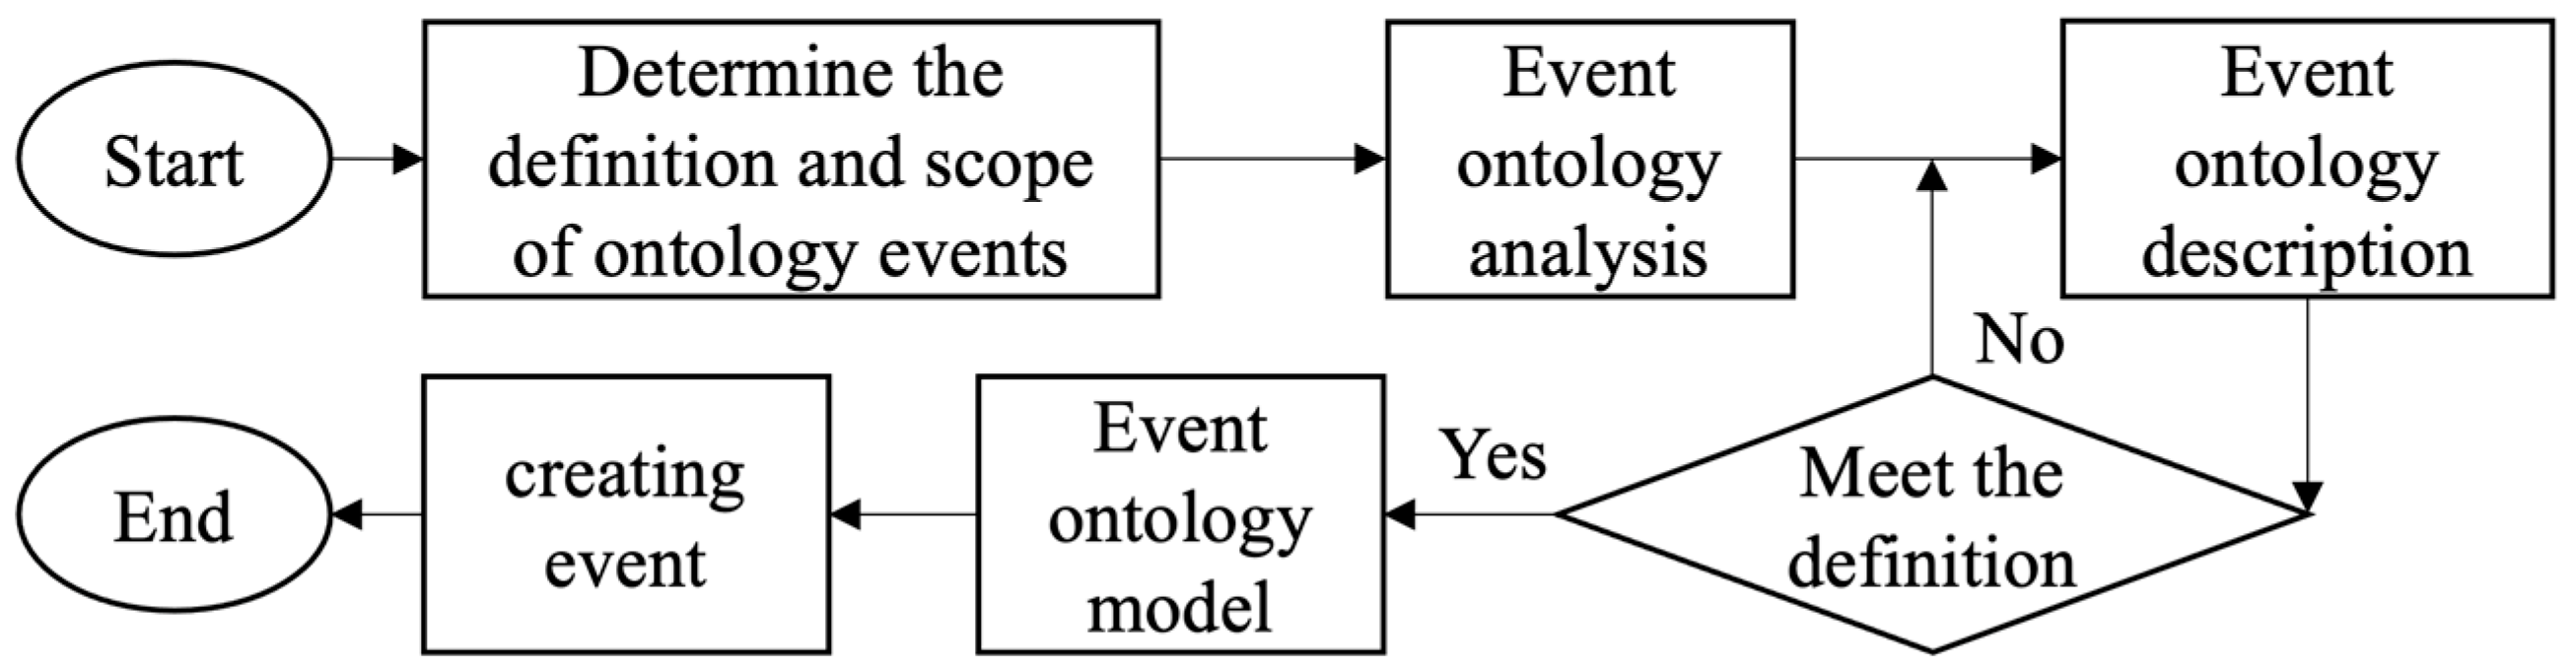
3.1. Cultural Relic Seismic Impact Analysis in the Event-Ontology Model
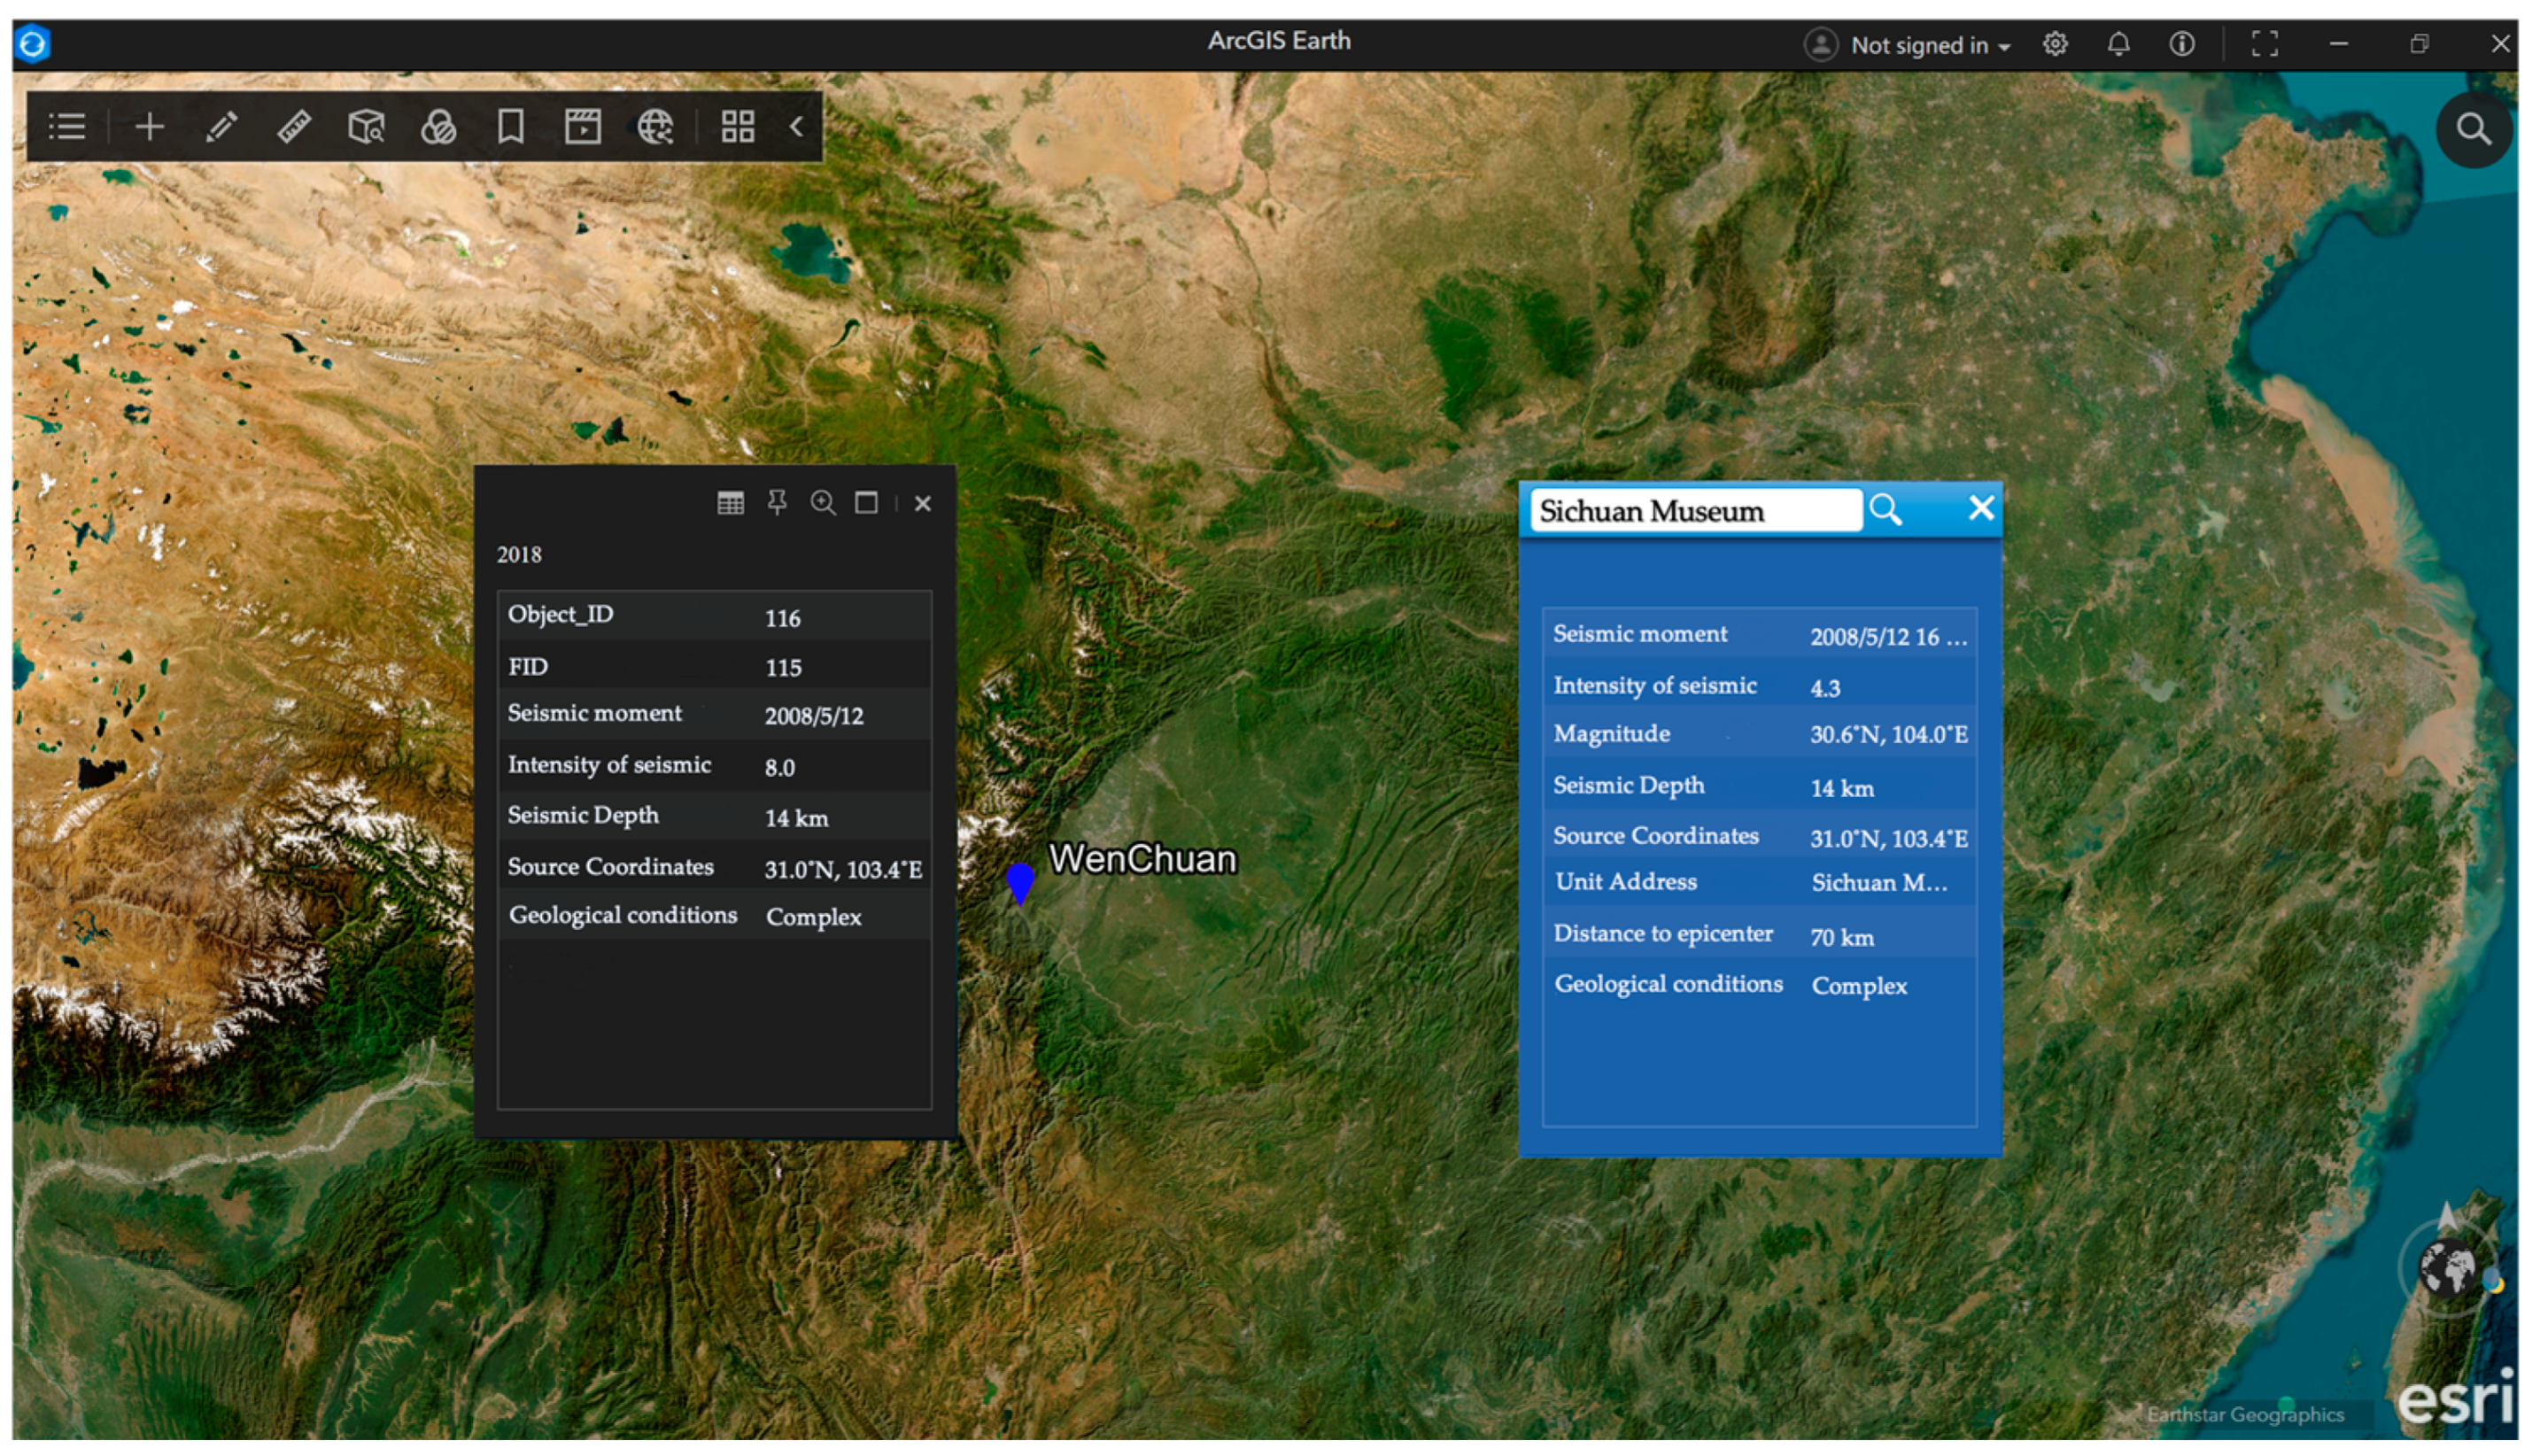
3.2. Ontology of Cultural Relics and Exhibition Facilities Data Attribute Processing
4. Multi-Source Feature-Fusion Matching of Cultural Relics Based on Deep Learning
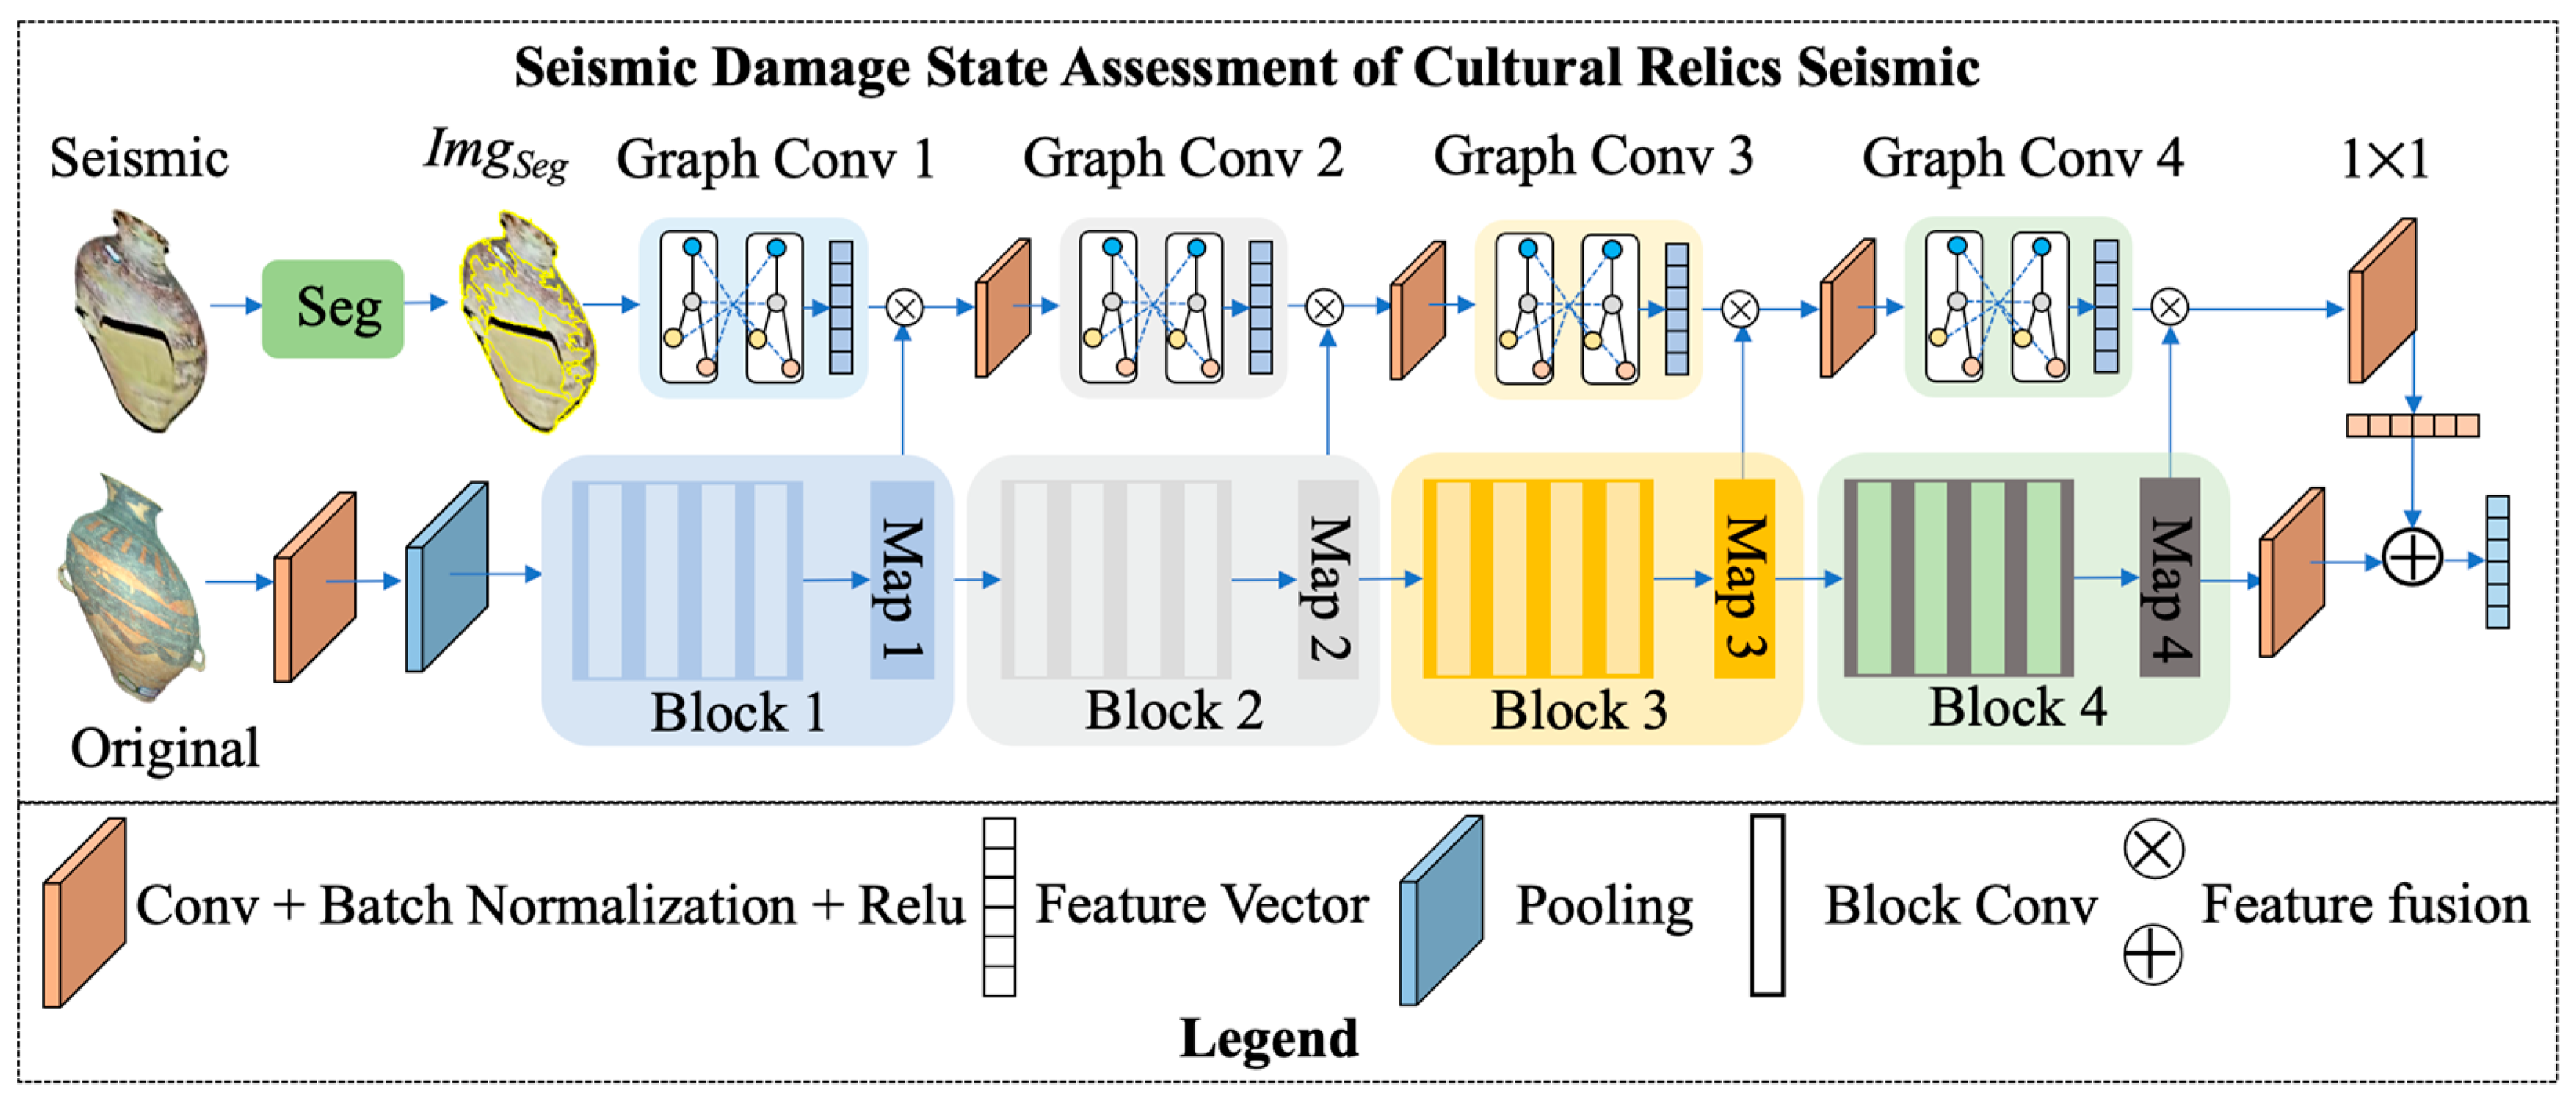
4.1. Damage State Assessment Method for Cultural Relics Based on Superpixel Map Convolution
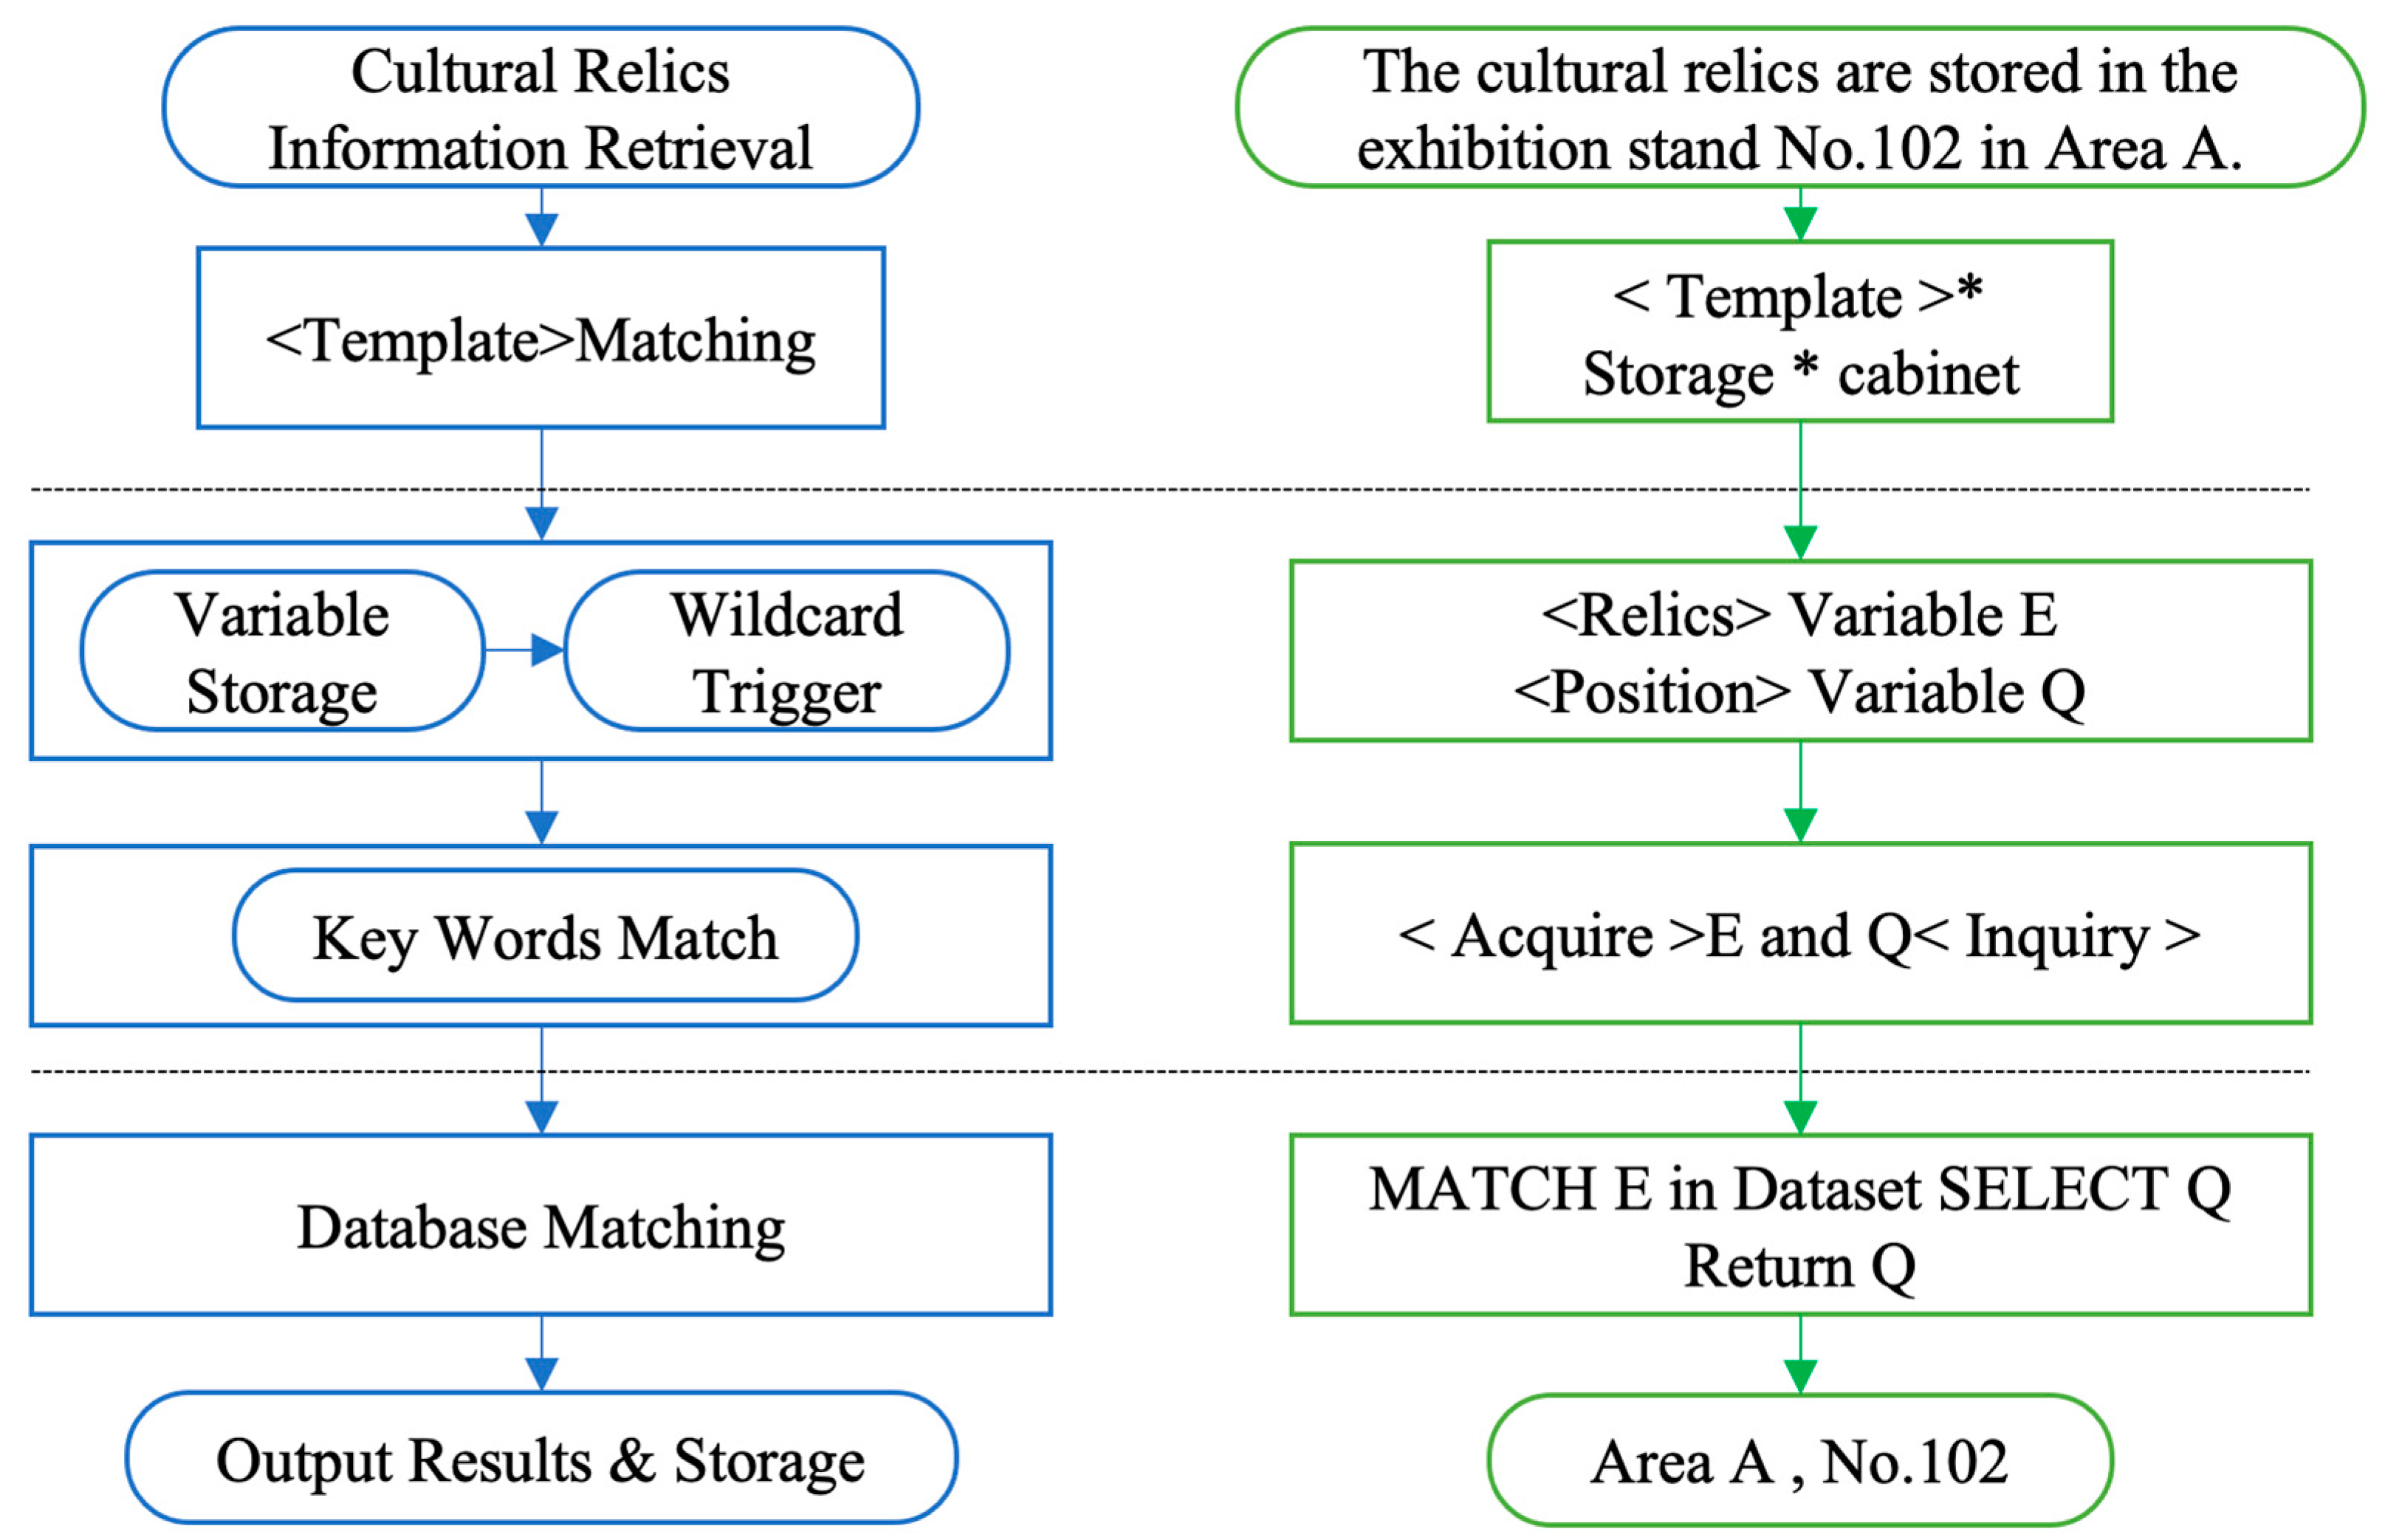
4.2. Automatic Matching Method Based on Multi-Source Information Fusion
4.3. Loss Function
5. Experimental Analysis
5.1. Experimental Environment and Dataset
5.2. Comparison Model and Evaluation Metrics
5.3. Evaluation Results of Seismic Damage State of Cultural Relics
5.4. Evaluation of the Effect of Matching Data on Cultural Relics’ Seismic Damage
5.4.1. Evaluation of Label Matching for Relic Seismic Data
5.4.2. Analysis of Multi-Label Classification Prediction Results
5.5. Calibration of Seismic Damage Dataset of Cultural Relics
6. Conclusions
Author Contributions
Funding
Institutional Review Board Statement
Informed Consent Statement
Data Availability Statement
Conflicts of Interest
Appendix A

| First Class | Second Class | Data Attribution |
|---|---|---|
| Cultural Relics Ontology | Name of cultural relics | Text |
| Artifact Texture | Pottery/Porcelain/Metalware/Bricks/Organic matter | |
| Age | In years | |
| Size | Length, width, height/caliber/diameter | |
| Quality | g | |
| Collection Registration Number | Not relevant | |
| Artifact index number | Not relevant | |
| Grade of cultural relics | not relevant | |
| Damaged before the seismic event | Yes/No | |
| Repaired or not | Yes/No | |
| Reason for the damage of cultural relics | Damage due to falling of display cabinets (cultural relics cabinets) and shelves/damage due to falling/tipping of cultural relics/damage due to mutual collision/damage due to building collapse/damage due to falling of accessories (e.g., lighting equipment, early warning equipment, etc.) in the display cabinets | |
| Cultural relics preservation space | Custodian unit | Text with 56 unit names |
| Building time | Numeric | |
| Building structure | Brick/Brick and Wood/Frame | |
| Building type | Museum building/General building | |
| Building area | Numerical value | |
| Seismic damage condition | Collapsed/structurally damaged/severely damaged/slightly damaged/safe | |
| Cultural Relics Exhibition and Collection Facilities | Storage location | Cultural relics storehouse/cultural relics exhibition hall |
| Storehouse floor | Numerical | |
| Floor of the showroom | Numerical | |
| Total number of floors | Numerical | |
| Location of cultural relics | Cultural relics shelves/cabinets/floor | |
| Material of contact surface | Metal/wood/cement | |
| The total number of layers of artifact cabinets and shelves | Numerical | |
| Layers of cultural relics | Numerical value | |
| Height of artifact shelf | Unit m | |
| Cultural relics cabinet shelf power amplification factor | Numerical value | |
| Cultural relics cabinet shelf style | No guardrail shelf/cabinet | |
| Cultural relics cabinet shelf whether against the wall | Yes/No | |
| Cultural relics cabinet shelf is fixed with the ground | Yes/No | |
| Cultural relics cabinet shelf is fixed between | Yes/No | |
| Cultural relics storage state | Vertical/Flat/Covered/Horizontal/Suspended | |
| Cultural relics storage method | Hybrid/Freestanding/Compact/Other | |
| Cultural relics stored with or without packaging | Yes/No | |
| Destruction of the cabinet and shelf | Tilting/undamaged/displaced/others | |
| Contact surface material | Wooden/Fabric/Plexiglass/Other | |
| Static friction coefficient with contact surface | Numerical | |
| The total number of layers of the cabinet shelf | Numerical | |
| The number of layers of cultural relics | Numerical value | |
| Height of the display cabinet | Unit “m” | |
| Power amplification coefficient of the display cabinet | Numerical value | |
| Style of the display case | Against the wall/freestanding display cabinets | |
| Damage to the display case | Tipped over/undamaged/displaced/other | |
| Whether the storage table is dampened or not | Yes/No | |
| Whether the display cabinets are fixed to the building floor | Yes/No | |
| Connection between neighboring display cases | Yes/No | |
| State of storage of cultural relics | Vertical/Flat/Covered/Horizontal/Suspended | |
| The way of storing cultural relics | Hybrid/Freestanding/Dense/Other | |
| Whether the display of cultural relics is fixed | Yes/No | |
| Seismic Information | Seismic moment | Year/Month/Day Hour: Minute: Second |
| Intensity of seismic event | Numerical value | |
| Magnitude | Numeric value, uniform | |
| Seismic depth | Unit: “km” | |
| Source coordinates | Unit: “degree-minute” | |
| Unit address | Text | |
| Distance to epicenter | Unit: “km” | |
| Geological conditions | Complex/medium/simple |
| Name | |||||||||||||
| Address | |||||||||||||
| Level | □I □II □III □Undefined | □Provincial □Municipal □County | |||||||||||
| Distance to epicenter | Number of cultural relics | ||||||||||||
| Cultural relics storeroom | Construction age | Building orientation | □east □south □north □west □southeast □northeast □southwest □northwest | Area | |||||||||
| Total Layer | building structure | □frame □brick □masonry □wood | |||||||||||
| Damage status | □collapsed □structurally damaged (need to rebuild) □severely damaged (need to be reinforced for use) □slightly damaged (e.g., cracks can be observed) □safe | ||||||||||||
| Kind | Earthenware | Porcelain | Metals | Brick, stone, etc. | Paintings | Other | Total | ||||||
| Number | |||||||||||||
| Number | |||||||||||||
| Damage Number | |||||||||||||
| Culture Relics Shock Damage Types | |||||||||||||
| 1. Number of cultural relics damaged by building collapse | 2. Number of relics damaged by falling/tipping | ||||||||||||
| 3. Number of cultural relics damaged by mutual collision | 4. Number of relics broken by falling objects | ||||||||||||
| 5. Number of relics damaged by falling cabinets and shelves | 6. Number of relics damaged in other ways | ||||||||||||
| Cultural relics exhibition room | Construction age | Building orientation | □east □south □north □west □southeast □northeast □southwest □northwest | Area | |||||||||
| Total Layer | building structure | □frame □brick □masonry □wood | |||||||||||
| Damage status | □collapsed □structurally damaged (need to rebuild) □severely damaged (need to be reinforced for use) □slightly damaged (e.g., cracks can be observed) □safe | ||||||||||||
| Kind | Earthenware | Porcelain | Metals | Brick, stone, etc. | Paintings | Other | Total | ||||||
| Number | |||||||||||||
| Number | |||||||||||||
| Damage Number | |||||||||||||
| Culture Relics Shock Damage Types | |||||||||||||
| 1. Number of cultural relics damaged by building collapse | 2. Number of relics damaged by falling/tipping | ||||||||||||
| 3. Number of cultural relics damaged by mutual collision | 4. Number of relics broken by falling objects | ||||||||||||
| 5. Number of relics damaged by falling cabinets and shelves | 6. Number of relics damaged in other ways | ||||||||||||
| Basic Information of Damaged Cultural Relics | Collection number | No. | |||||||||
| Materials | □Pottery □Porcelain □Metalwork □Bricks, jade, and stoneware □Paintings, calligraphy, textiles □Others | ||||||||||
| Level | □I □II □III □Undefined | ||||||||||
| Period | Collection Unit | □Collection of own □Other | |||||||||
| Dimensions (length, width)/cm | Mass/g | ||||||||||
| Any pre-seismic damage (e.g., fissures, etc.) | □Yes □No | ||||||||||
| Any repairs due to salvage | □Yes □No | ||||||||||
| Causes of damage to cultural relics | □Damage caused by the collapse of a building □Damage caused by the fall of a display case (artifact cabinet) or shelf □Damage caused by falling accessories (e.g., lighting equipment, warning equipment, etc.) in display cases □Damage caused by falling/tipping of cultural relics □Damage caused by mutual collision □Others | ||||||||||
| Damage of cultural relics | □radioactive damage □partial damage □fracture □cracking □deformation □scratches | ||||||||||
| Custody of damaged cultural relics | Location of cultural relics | □Artifact cabinet □Artifact rack □Floor □Other | |||||||||
| Cabinets and shelves for cultural relics | Materials | □Wood □Metal □Other | |||||||||
| Style | □Cabinet □With Railing Shelf □Without Railing Shelf □Other | ||||||||||
| Status of cultural relics cabinets and shelves doors at the time of seismic activity | □Open □Loose-leaf door closed, but not secured, movable □Flap door closed and locked □Sliding door closed and locked | ||||||||||
| Total Layers | Number of stores and height of the relics | ||||||||||
| Cultural relics cabinet, shelf foot form | □Yes □No | ||||||||||
| Whether cabinets and shelves are against the wall | □Yes □No | ||||||||||
| Cultural relics cabinet, shelf fixing method | Between the shelves of cultural relics cabinets | □No fixing □Bonding □Welding □Others | |||||||||
| Between the shelves of the cultural relics cabinet and the floor | □No fixing □Bonding □Clip fixing □Others | ||||||||||
| Whether there are shock absorbers on the countertops of cultural relics cabinets and shelves | □Yes, Shock absorbers are… □No | ||||||||||
| Destruction | □Overturned □Displaced □Undamaged □Other | ||||||||||
| Other anti-vibration measures for cabinets and shelves for cultural relics | |||||||||||
| Cultural Objects Storage Methods | □Vertical □Covered □Horizontal □Curled □Hanging □Flat □Other | ||||||||||
| □Intensive □Hybrid □Freestanding □Other | |||||||||||
| □With packaging □Without packaging | |||||||||||
| Whether or not the storage table is covered with shock absorbers | □Yes, store there… □No | ||||||||||
| Immobilization of cultural relics, anti-shock measures | □No □Lowering the center of gravity method □Internal support method □Gluing method □Wire bolting method (type of wire) □ Other | ||||||||||
| Damage to room lighting and other ancillary equipment | □Intact □Loose and not falling □Falling □Falling and causing damage to artifacts □Other | ||||||||||
References
- Wu, L.; Wang, Z.L.; Gao, H.P. Seismic protection of cultural relics in museums (3)-Seismic safety analysis of cultural relics on display. Prot. Cult. Relics Archaeol. Sci. 2002, S1, 139–151. [Google Scholar]
- Wu, L.; Ma, B.T.; Wen, X. Collection of cultural relics anti-seismic technology in the practice of Ya’ an City Museum. China Cult. Relics Sci. Res. 2022, 67, 39–45. [Google Scholar]
- Ge, J.Q. Research on the whole system solutions and measures of earthquake prevention for museums. Southeast Cult. 2016, S1, 13–15. [Google Scholar]
- Pan, J. Research on Anti-Seismic Protection of Cultural Relics on Display in Museums in Yunnan Province. Master’s Thesis, Yunnan University, Kunming, China, 2017; pp. 15–17. [Google Scholar]
- Wang, Q.; Li, L. Museum Relic Image Detection and Recognition Based on Deep Learning. Comput. Intell. Neurosci. 2022, 2022, 9670191. [Google Scholar] [CrossRef] [PubMed]
- Niu, W.Y.; Huang, X.F.; Jie, J. Small cultural relics photogrammetry 3D modeling subject object recognition. J. Remote Sens. 2021, 25, 2409–2420. [Google Scholar]
- Qiu, S.; Zhang, P.; Li, S.; Hu, B. Extraction and analysis algorithms for Sanxingdui cultural relics based on hyperspectral imaging. Comput. Electr. Eng. 2023, 111, 108982. [Google Scholar] [CrossRef]
- Pei, H.; Zhang, C.; Zhang, X.; Liu, X.; Ma, Y. Recognizing materials in cultural relic images using computer vision and attention mechanism. Expert Syst. Appl. 2024, 239, 122399. [Google Scholar] [CrossRef]
- Zhou, Q. Research on seismic protection method of cultural relics on display in the Palace Museum. J. Palace Mus. 2016, 186, 152–159+163. [Google Scholar]
- Ni, J.; Chen, J.; Wu, Y.; Chen, Z.; Liang, M. Method to Determine the Centroid of Non-Homogeneous Polygons Based on Suspension Theory. ISPRS Int. J. Geo-Inf. 2022, 11, 233. [Google Scholar] [CrossRef]
- Yuan, H.Y. Research and Application of Highly Simulation Technology of Cultural Relics. Ph.D. Thesis, North University of Technology, Beijing, China, 2019; pp. 2–6. [Google Scholar]
- Yu, R.; Liu, S.; Wang, X. Dataset Distillation: A Comprehensive Review. IEEE Trans. Pattern Anal. Mach. Intell. 2024, 46, 150–170. [Google Scholar] [CrossRef]
- Schmitt-Koopmann, F.M.; Huang, E.M.; Hutter, H.-P.; Stadelmann, T.; Darvishy, A. FormulaNet: A Benchmark Dataset for Mathematical Formula Detection. IEEE Access 2022, 10, 91588–91596. [Google Scholar] [CrossRef]
- Tu, Z.; Ma, Y.; Li, Z.; Li, C.; Xu, J.; Liu, Y. RGBT Salient Object Detection: A Large-Scale Dataset and Benchmark. IEEE Trans. Multimed. 2023, 25, 4163–4176. [Google Scholar] [CrossRef]
- Ferrari, C.; Berretti, S.; Pala, P.; Del Bimbo, A. The Florence Multi-Resolution 3D Facial Expression Dataset. Pattern Recognit. Lett. 2023, 175, 23–29. [Google Scholar] [CrossRef]
- Nguyen, T.T.T.; Eichholtzer, A.C.; Driscoll, D.A.; Semianiw, N.I.; Corva, D.M.; Kouzani, A.Z.; Nguyen, T.T.; Nguyen, D.T. SAWIT: A Small-Sized Animal Wild Image Dataset with Annotations. Multimed. Tools Appl. 2023, 83, 34083–34108. [Google Scholar] [CrossRef]
- Feng, Q. Research on the Construction Technology of Knowledge Graph of Cultural Relics. Master’s thesis, Northwest University, Xi’an, China, 2023; pp. 1–15.
- Yuan, J.L.; Li, S.C.; Song, T. Study on seismic damage characteristics and laws of ancient timber frame buildings. Earthq. Eng. Eng. Vib. 2022, 42, 22–33. [Google Scholar]
- Ge, J.Q.; Ma, B.T. Research progress of integrated seismic protection technology for cultural relics in Chinese museums. China Mus. 2021, 1, 10–16+126. [Google Scholar]
- Qin, X. Practice and Reflection on the Digital Protection of Cultural Relics in Shanxi Museum. China Mus. 2023, 06, 79–85. [Google Scholar]
- Tsiachta, A.; Argyrou, P.; Tsougas, I.; Kladou, M.; Ravanidis, P.; Kaimaris, D.; Georgiadis, C.; Georgoula, O.; Patias, P. Multi-Sensor Image and Range-Based Techniques for the Geometric Documentation and the Photorealistic 3D Modeling of Complex Architectural Monuments. Sensors 2024, 24, 2671. [Google Scholar] [CrossRef] [PubMed]
- Wang, C.L.; Feng, Y.Y.; You, W.H. Application of laser technology in cultural relics protection. Prog. Laser Optoelectron. 2022, 59, 37–46. [Google Scholar]
- Zheng, Y.Y.; Wang, H.Q.; Wang, K. An improved grid holography projection transformation method for multi-lens spectral image mosaic of cultural relics. Comput. Eng. Appl. 2024, 1–13. [Google Scholar]
- Fernandez-Balbuena, A.A.; Gómez-Manzanares, A.; Martínez Antón, J.C.; Gómez-Tejedor, J.G.; Mayorga-Pinilla, S.; Durán Roque, H.; Vázquez Moliní, D. High-Dynamic-Range Spectral Reflectance for the Segmentation of Paint Pigment: Application to Dalí’s Oil Painting Dos Figuras (1926). Sensors 2023, 23, 4316. [Google Scholar] [CrossRef] [PubMed]
- Ager, F.J.; Respaldiza, M.A.; Scrivano, S.; Ortega-Feliu, I.; Kriznar, A.; Gómez-Tubío, B. Cultural Heritage Science at CNA (Seville, Spain): Applications of XRF and IBA Techniques to Art and Archaeological Objects. Radiat. Phys. Chem. 2020, 167, 108324. [Google Scholar] [CrossRef]
- Zhang, Q.Y.; Zou, Y.L.; Li, J.H. Application of 3D laser scanning technology in erosion and spalling monitoring of natural cultural relics. Not. Surv. Mapp. 2023, 140–144. [Google Scholar]
- Xu, J.; Song, P.; Liang, L. Study on the characteristics of Bronze Cultural relics by X-ray flaw Detection Imaging—A case study of Bronze Cultural relics in the Museum of Huangdao District of Qingdao. Sci. Res. Cult. Relics China 2022, 4, 87–96. [Google Scholar]
- Zhuang, Y. Museum collection knowledge organization for artificial intelligence-Taking the Palace Museum’s “Reference Model of Ancient Chinese Movable Cultural Relics” as an example. Palace Mus. J. 2023, 11, 126–136+150. [Google Scholar]
- Song, W.; Zhang, H.; Wang, Q.; Wang, Y. The application of X-ray micro-CT imaging technology in the research of metal cultural relics production process and corrosion state evaluation. Cult. Relics Prot. Archaeol. Sci. 2022, 34, 51–59. [Google Scholar]
- Li, D.; Zhou, H.; Xu, F.; Yan, Y.; Shi, H.; Wu, L.; Cai, L. The Visualization Method of Environmental Risk Assessment for Metal Cultural Relics in Museums Based on Quick Response Code. J. Cult. Herit. 2023, 62, 21–31. [Google Scholar] [CrossRef]
- Yu, K.; Li, Z.; Duan, Y.; Wang, L.; Wang, J.; Peng, J. Multi-Scale Convolutional Autoencoder Network-Based Implicit Information Mining of Cultural Relics. In Proceedings of the Optics for Arts, Architecture, and Archaeology (O3A) IX, Munich, Germany, 26–27 June 2023; Groves, R., Liang, H., Eds.; SPIE: Bellingham, WA, USA, 2023; p. 7. [Google Scholar]
- Qin, L.; Chen, F.D.; Zhen, G. Stability analysis of stone monuments under earthquake. Wen Bo 2021, 6, 90–97. [Google Scholar]
- Zhao, S.J.; Yang, Y.Q.; Dai, J.W. Dynamic characteristics and seismic response analysis of Yuhua Pavilion in the Forbidden City. World Earthq. Eng. 2020, 36, 85–92. [Google Scholar]
- Ji, J.B.; Yan, W.M.; Zhou, Q. Seismic damage causes and strengthening methods of museum free-standing cultural relics. Appl. Mech. Mater. 2013, 351, 1558–1562. [Google Scholar] [CrossRef]
- Wang, W.; Li, J.; Jiang, J.; Wang, B.; Wang, Q.; Gao, E.; Yue, T. Autonomous Data Association and Intelligent Information Discovery Based on Multimodal Fusion Technology. Symmetry 2024, 16, 81. [Google Scholar] [CrossRef]
- Ning, C.; Zhang, W. MHA-Net: Multi-Source Heterogeneous Aerodynamic Data Fusion Neural Network Embedding Reduced-Dimension Features. Aerosp. Sci. Technol. 2024, 145, 108908. [Google Scholar] [CrossRef]
- Tong, W.; Chu, X.; Jiang, W.; Li, Z. A Multimodal Dual-Fusion Entity Extraction Model for Large and Complex Devices. Comput. Commun. 2023, 210, 1–9. [Google Scholar] [CrossRef]
- Miao, M.; Yu, J. Deep Feature Interactive Network for Machinery Fault Diagnosis Using Multi-Source Heterogeneous Data. Reliab. Eng. Syst. Saf. 2024, 242, 109795. [Google Scholar] [CrossRef]
- Yan, C.; Fang, X.; Huang, X.; Guo, C.; Wu, J. A Solution and Practice for Combining Multi-Source Heterogeneous Data to Construct Enterprise Knowledge Graph. Front. Big Data 2023, 6, 1278153. [Google Scholar] [CrossRef] [PubMed]
- Chen, Y.; Wang, C.; Zhou, Y.; Zuo, Y.; Yang, Z.; Li, H.; Yang, J. Research on Multi-Source Heterogeneous Big Data Fusion Method Based on Feature Level. Int. J. Patt. Recogn. Artif. Intell. 2024, 38, 2455001. [Google Scholar] [CrossRef]
- Xu, C.; Shu, J.; Zhu, G. Scene Classification Based on Heterogeneous Features of Multi-Source Data. Remote Sens. 2023, 15, 325. [Google Scholar] [CrossRef]
- He, C.; Qu, Y.; Yin, J.; Zhao, Z.; Ma, R.; Duan, L. Cross-View Contrastive Representation Learning Approach to Predicting DTIs via Integrating Multi-Source Information. Methods 2023, 218, 176–188. [Google Scholar] [CrossRef] [PubMed]
- Huang, J.; Chen, C.; Sun, C.; Cao, Y.; An, Y. An Integrated Risk Assessment Model for the Multi-Perspective Vulnerability of Distribution Networks under Multi-Source Heterogeneous Data Distributions. Int. J. Electr. Power Energy Syst. 2023, 153, 109397. [Google Scholar] [CrossRef]
- Wu, B.; Hu, Y. Analysis of Substation Joint Safety Control System and Model Based on Multi-Source Heterogeneous Data Fusion. IEEE Access 2023, 11, 35281–35297. [Google Scholar] [CrossRef]
- He, X.; Dong, H.; Yang, W.; Li, W. Multi-Source Information Fusion Technology and Its Application in Smart Distribution Power System. Sustainability 2023, 15, 6170. [Google Scholar] [CrossRef]
- Jin, Q.; Xie, J.; Huang, D.; Zhao, C.; He, H. MSFF-MA-DDI: Multi-Source Feature Fusion with Multiple Attention Blocks for Predicting Drug–Drug Interaction Events. Comput. Biol. Chem. 2024, 108, 108001. [Google Scholar] [CrossRef]
- Zhang, N.; Liu, Y.; Li, Z.; Xiang, J.; Pan, R. Fabric Image Retrieval Based on Multi-Modal Feature Fusion. SIViP 2024, 18, 2207–2217. [Google Scholar] [CrossRef]
- Zhang, J.; Sui, T.; Lin, B.; Lv, B.; Du, H.; Song, N. Quantification of Micro-Damage Evolution Process in Ceramics through Extensive Analysis of Multi-Source Heterogeneous Data. Mater. Des. 2024, 237, 112600. [Google Scholar] [CrossRef]
- Islam, M.M.; Nooruddin, S.; Karray, F.; Muhammad, G. Multi-Level Feature Fusion for Multimodal Human Activity Recognition in Internet of Healthcare Things. Inf. Fusion 2023, 94, 17–31. [Google Scholar] [CrossRef]
- Tian, Y. Fault Diagnosis Strategy of Industrial Process Based on Multi-Source Heterogeneous Information and Deep Learning. Chem. Eng. Res. Des. 2023, 198, 459–477, Erratum in Chem. Eng. Res. Des. 2023, 200, 21. [Google Scholar] [CrossRef]
- Liu, J.; Li, T.; Ji, S.; Xie, P.; Du, S.; Teng, F.; Zhang, J. Urban Flow Pattern Mining Based on Multi-Source Heterogeneous Data Fusion and Knowledge Graph Embedding. IEEE Trans. Knowl. Data Eng. 2023, 35, 2133–2146. [Google Scholar] [CrossRef]
- Strelet, E.; Peng, Y.; Castillo, I.; Rendall, R.; Wang, Z.; Joswiak, M.; Braun, B.; Chiang, L.; Reis, M.S. Multi-Source and Multimodal Data Fusion for Improved Management of a Wastewater Treatment Plant. J. Environ. Chem. Eng. 2023, 11, 111530. [Google Scholar] [CrossRef]
- Liu, Y.; Xu, Y.; Liu, J.; Shi, Y.; Li, S.; Zhou, J. Real-Time Comprehensive Health Status Assessment of Hydropower Units Based on Multi-Source Heterogeneous Uncertainty Information. Measurement 2023, 216, 112979. [Google Scholar] [CrossRef]
- Wang, Y.; Liu, T.; Lu, Y.; Wan, H.; Huang, P.; Deng, F. Traffic Accident Risk Prediction of Tunnel Based on Multi-Source Heterogeneous Data Fusion. IEEE Access 2024, 12, 18694–18702. [Google Scholar] [CrossRef]
- National Cultural Heritage Administration. Available online: http://www.ncha.gov.cn/col/col2423/index.html (accessed on 2 July 2024).
- Find Open Datasets and Machine Learning Projects|Kaggle. Available online: https://www.kaggle.com/datasets (accessed on 20 June 2024).
- Everingham, M.; Van Gool, L.; Williams, C.K.I.; Winn, J.; Zisserman, A. The Pascal Visual Object Classes (VOC) Challenge. Int. J. Comput. Vis. 2010, 88, 303–338. [Google Scholar] [CrossRef]
- Lin, T.Y.; Maire, M.; Belongie, S. Microsoft coco: Common objects in context. In Proceedings of the European Conference on Computer Vision, Zurich, Switzerland, 6–12 September 2014; Springer: Berlin, Germany, 2014; pp. 740–755. [Google Scholar]
- Liu, H.; Tian, Y.; Wang, Y. Deep relative distance learning: Tell the difference between similar vehicles. In Proceedings of the 2016 IEEE Conference on Computer Vision and Pattern Recognition (CVPR), Las Vegas, NV, USA, 27–30 June 2016; IEEE Press: Piscataway, NJ, USA, 2016; pp. 2167–2175. [Google Scholar]
- Li, W.; Zhao, R.; Wang, X. Human Reidentification with Transferred Metric Learning. In Proceedings of the Asian Conference on Computer Vision (ACCV), Daejeon, Republic of Korea, 5–9 November 2012; pp. 1–10. [Google Scholar]
- Zhou, F.T.; Huang, S.; Liu, B. Multi-label image classification via category prototype compositional learning. IEEE Trans. Circuits Syst. Video Technol. 2022, 32, 4513–4525. [Google Scholar] [CrossRef]
- Chen, T.S.; Xu, M.X.; Hui, X.L. Learning semantic—Specific graph representation for multi-label image recognition. In Proceedings of the IEEE International Conference on Computer Vision, Seoul, Republic of Korea, 27 October–2 November 2019; IEEE Press: Piscataway, NJ, USA, 2019; pp. 522–531. [Google Scholar]
- Qu, X.W.; Che, H.; Huang, J. Multi-layered semantic representation network for multi-label image classification. Int. J. Mach. Learn. Cybern. 2023, 14, 3427–3435. [Google Scholar] [CrossRef]
- Zhou, F.T.; Huang, S.; Xing, Y. Deep semantic dictionary learning for multi-label image classification. In Proceedings of the AAA Conference on Artificial Intelligence, Montreal, QC, Canada, 19–27 August 2021; AAAI: Menlo Park, CA, USA, 2021; pp. 3572–3580. [Google Scholar]
- Wu, Z.; Hu, Z.; Ding, J. Same-clothes person re-identification with dual-stream network. Multimed. Syst. 2024, 30, 70. [Google Scholar] [CrossRef]
- Huang, Y.; Liang, B.; Xie, W.; Liao, Y.; Kuang, Z.; Zhuang, Y.; Ding, X. Dual Domain Multi-Task Model for Vehicle Re-Identification. IEEE Trans. Intell. Transport. Syst. 2022, 23, 2991–2999. [Google Scholar] [CrossRef]
- Lee, S.; Woo, T.; Lee, S.H. Multi-Attention-Based Soft Partition Network for Vehicle Re-Identification. J. Comput. Des. Eng. 2023, 10, 488–502. [Google Scholar] [CrossRef]
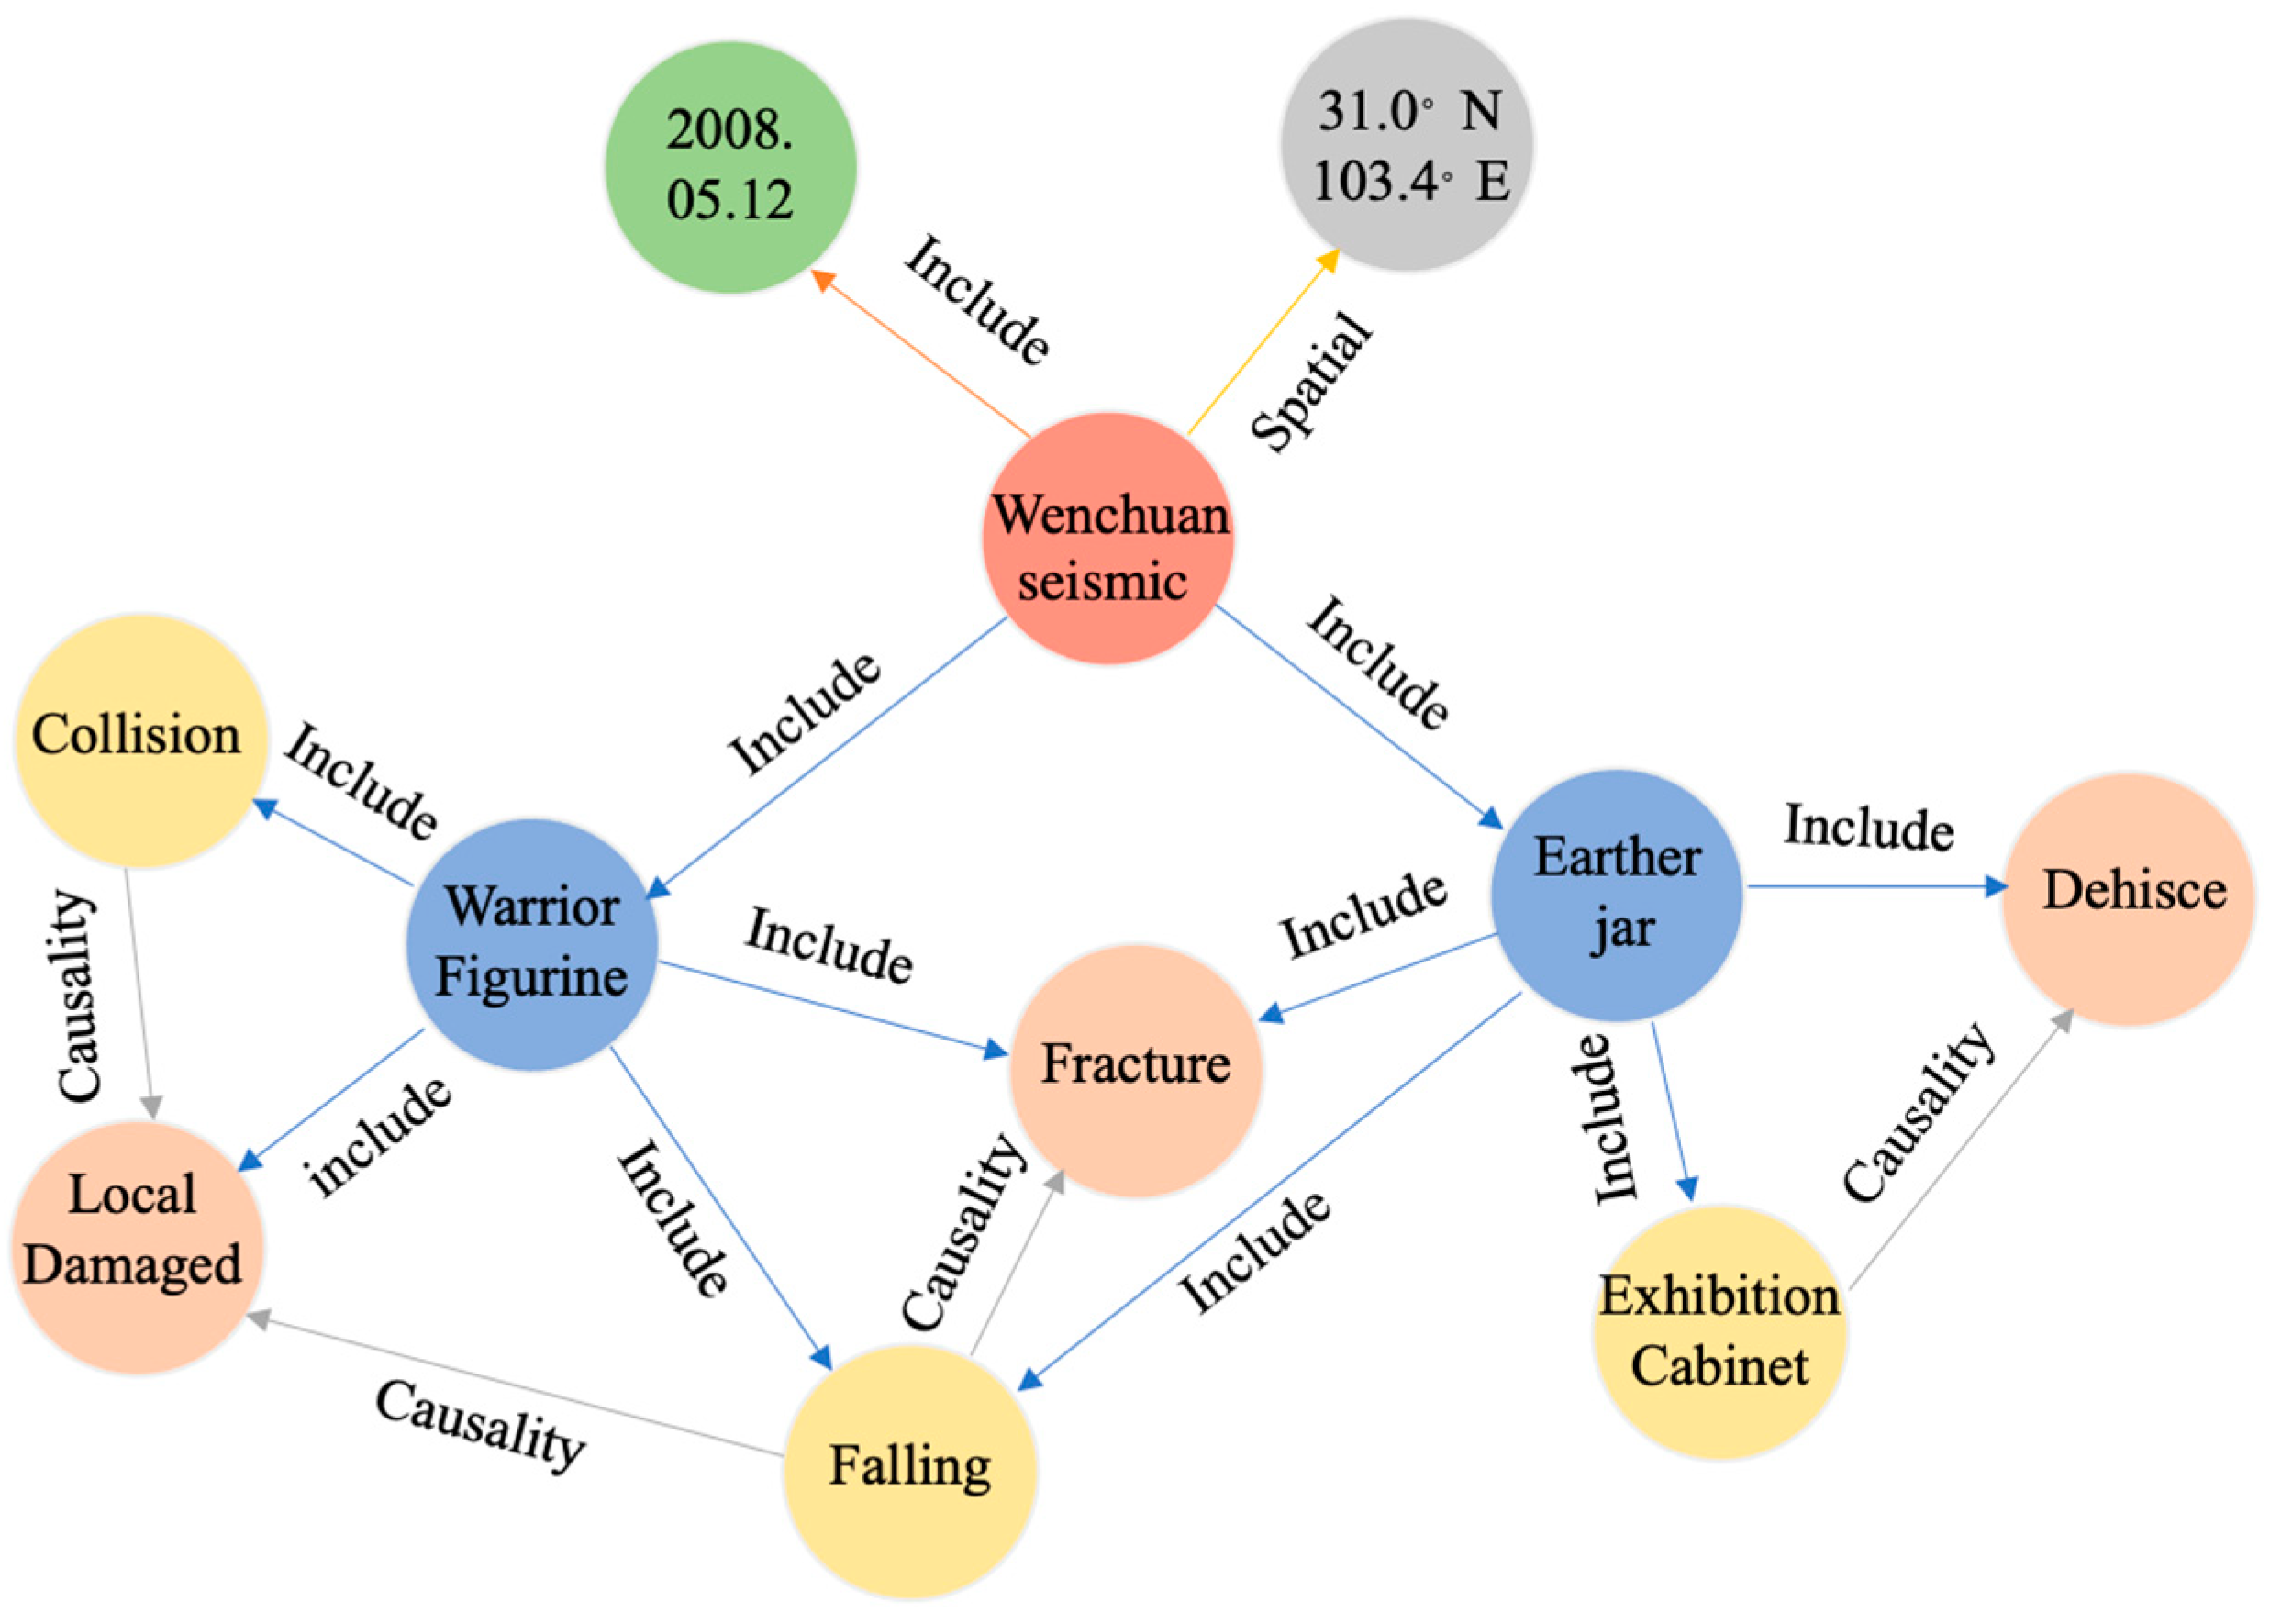


| No. | Attributes | Definition | Description |
|---|---|---|---|
| 1 | subject | Event Initiator | Seismic Disasters |
| 2 | Object | The recipient of the event | Seismic Artifacts |
| 3 | Influence | Correlating factors contributing to the occurrence of the event | Seismic Impact Factor |
| 4 | Time | The point in time when the event occurs | Seismic events |
| 5 | Space | The physical space in which the event occurred | Location of the seismic |
| 6 | Event Type | Types of damage to artifacts during the event | Types of Damage to Cultural Objects |
| 7 | Causality | The role of the events in relation to each other | Relationships that cause damage to artifacts |
| 8 | Include | The attribution of the events, i.e., Event B is a sub-event of Event A. | Inclusion of seismic influences |
| 9 | Temporal | The sequence of events | The process of seismic damage to cultural objects |
| 10 | Spatial | The spatial correlation between the events | Physical relations in the space where the seismic damage to cultural objects occurred |
| Environment | Configuration | Model Parameters | Configuration |
|---|---|---|---|
| GPU | RTX3080 (10 GB) * 1 | weights_init | xavier |
| OS | ubuntu20.04 | optimizer | Adam |
| Framework | PyTorch1.11.0 | Batch_size | 16 |
| Language | Python3.8 | lr | 1 × 10⁻³ |
| cuda | 11.3 | epoch | 50 |
| DataSet | Train | Validation | Test |
|---|---|---|---|
| CR-SDD | 946 | 270 | 136 |
| VOC2012 | 8071 | 2306 | 1153 |
| MS-COCO | 85,552 | 24,443 | 12,223 |
| VehicleID | 74,240 | 21,212 | 10,606 |
| CUHK01 | 2720 | 7,76 | 388 |
| Method | VehicleID | CUHK01 | CR-SDD | Params (M) | FLOPs (G) | ||||||
|---|---|---|---|---|---|---|---|---|---|---|---|
| P | R | F1 | P | R | F1 | P | R | F1 | |||
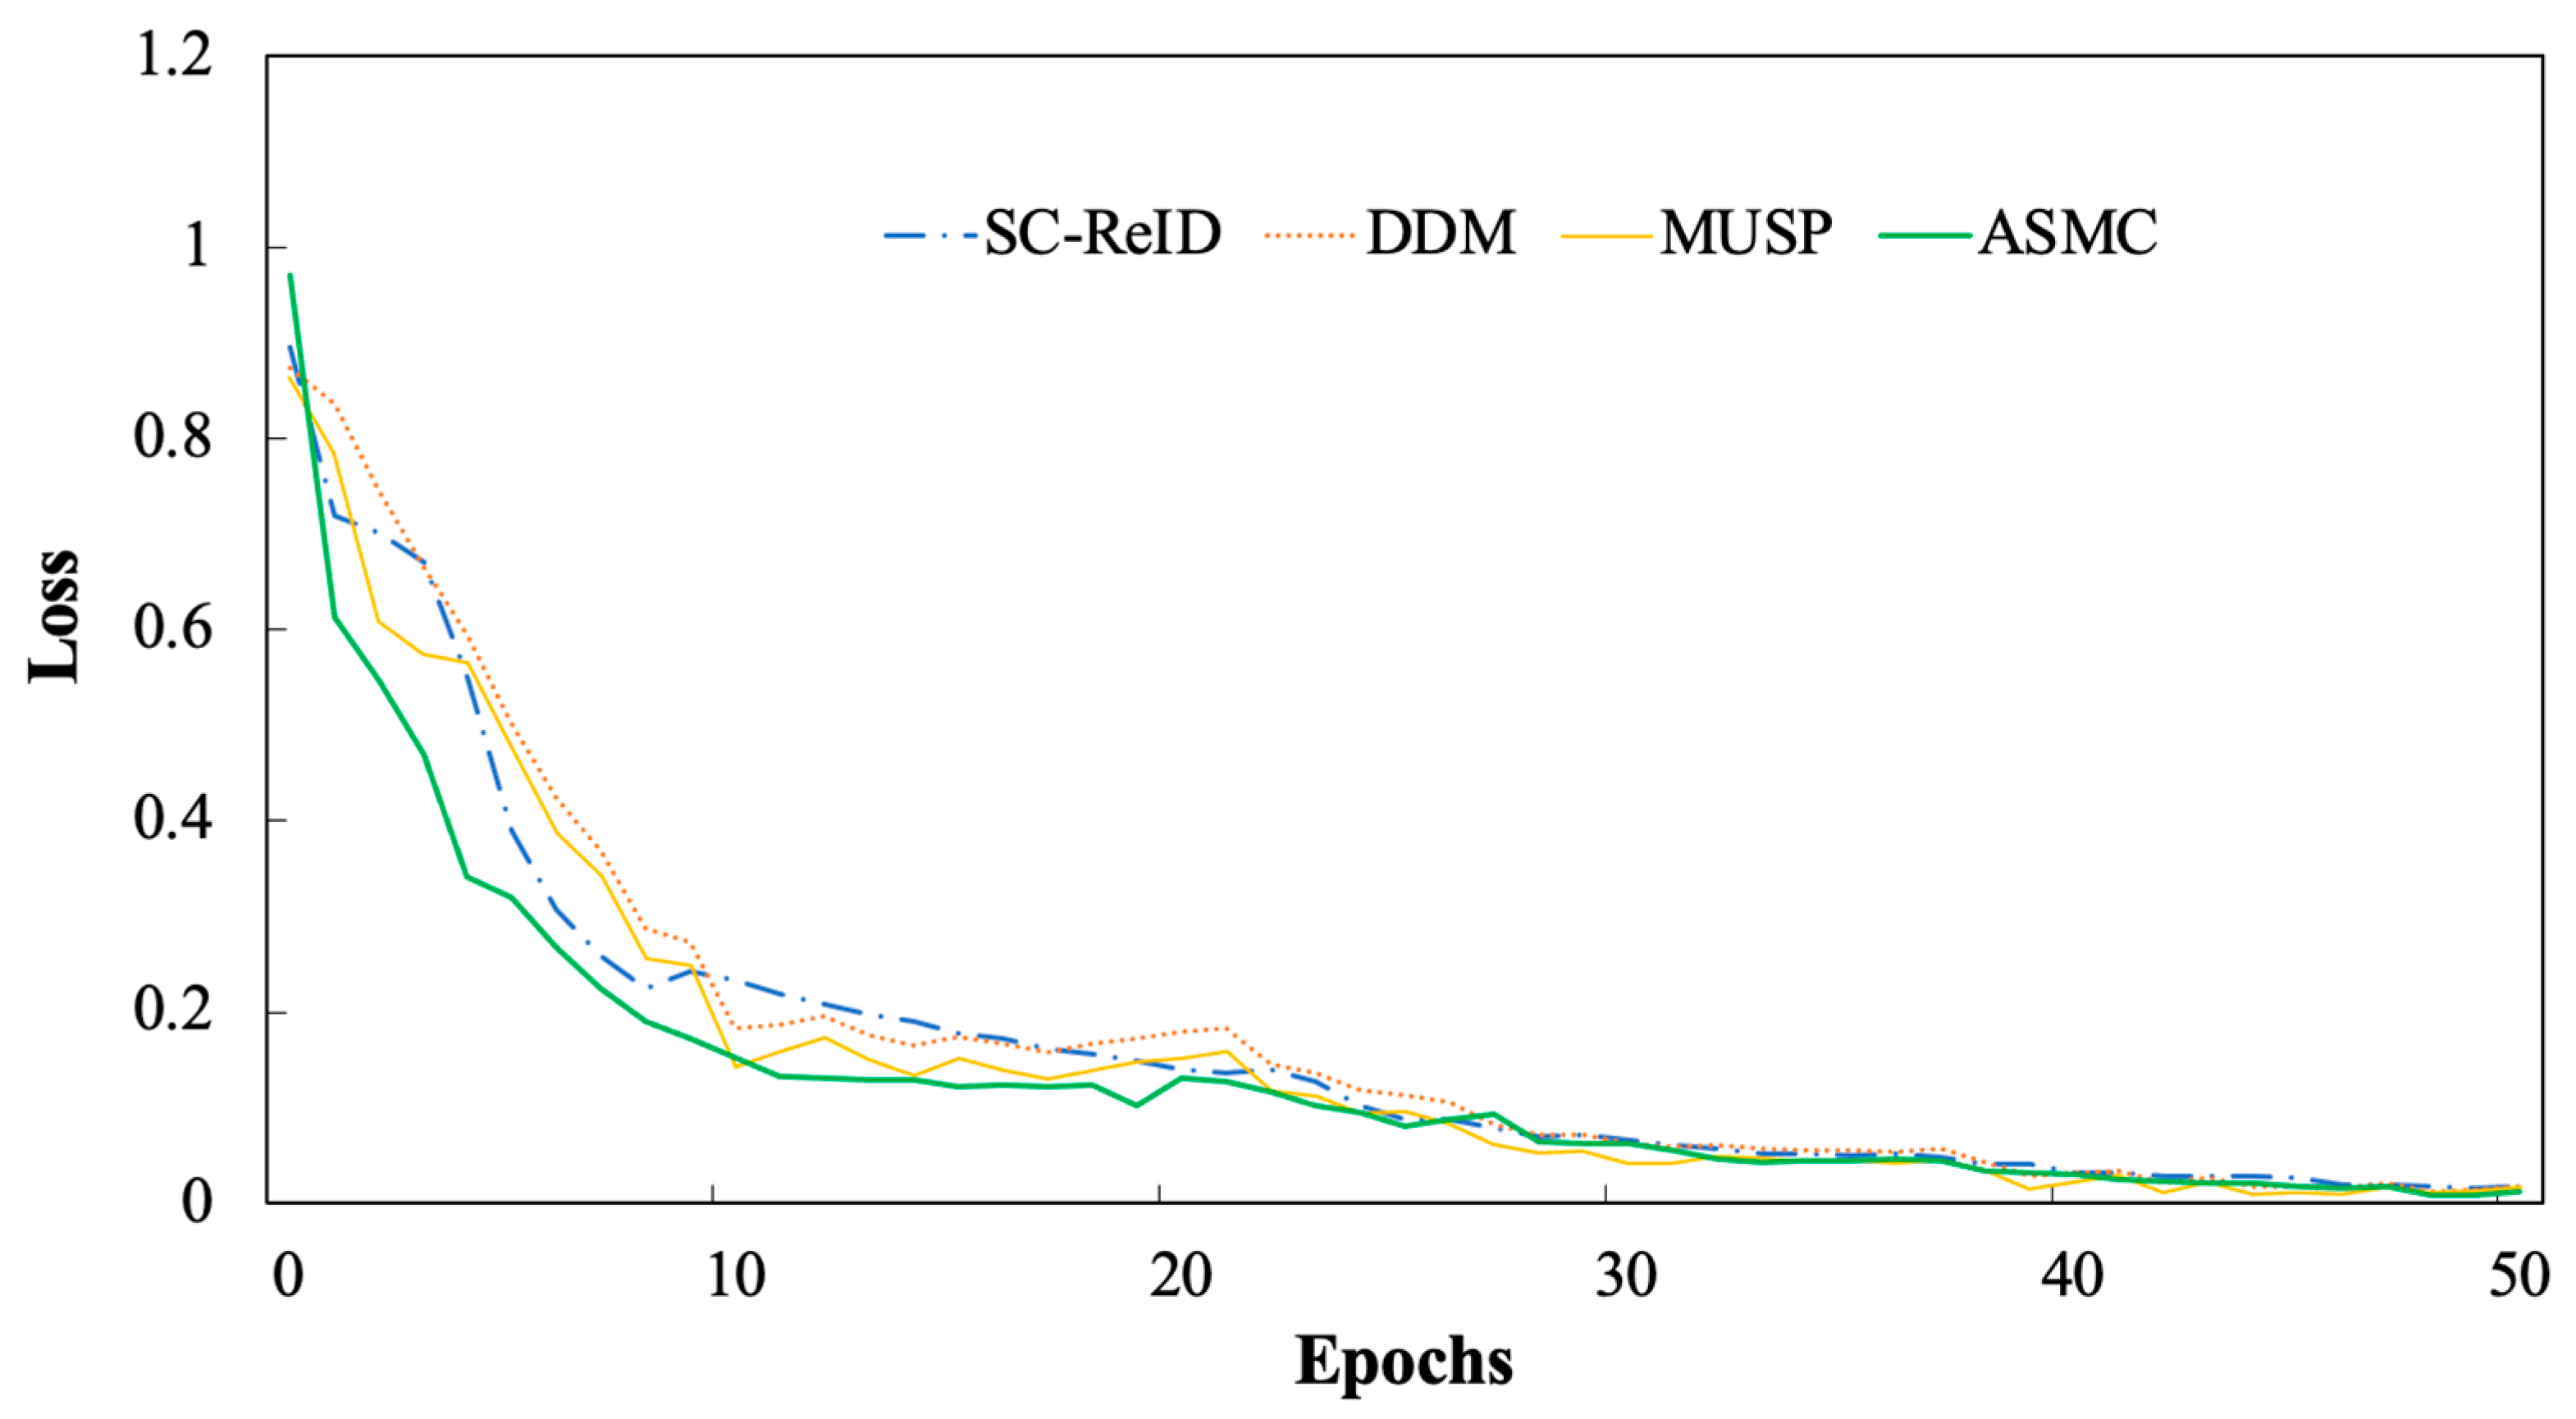
| SC-ReID | 74.3 | 77.8 | 76.0 | 80.2 | 79.6 | 79.9 | 83.5 | 82.4 | 82.9 | 25.6 | 4.1 |
| DDM | 80.1 | 79.3 | 79.6 | 85.6 | 84.3 | 84.9 | 80.1 | 81.3 | 80.7 | 19.2 | 2.4 |
| MUSP | 95.3 | 93.3 | 94.3 | 81.4 | 82.3 | 81.8 | 87.6 | 81.2 | 84.3 | 26.6 | 3.5 |
| ASMC | 95.1 | 94.2 | 94.6 | 87.4 | 83.6 | 85.5 | 93.6 | 92.2 | 92.9 | 20.6 | 2.3 |
| Method | Classes | Evaluation Metrics (Per) | Evaluation Metrics (Average) | ||||
|---|---|---|---|---|---|---|---|
| P | R | F1 | mP | mR | mF1 | ||
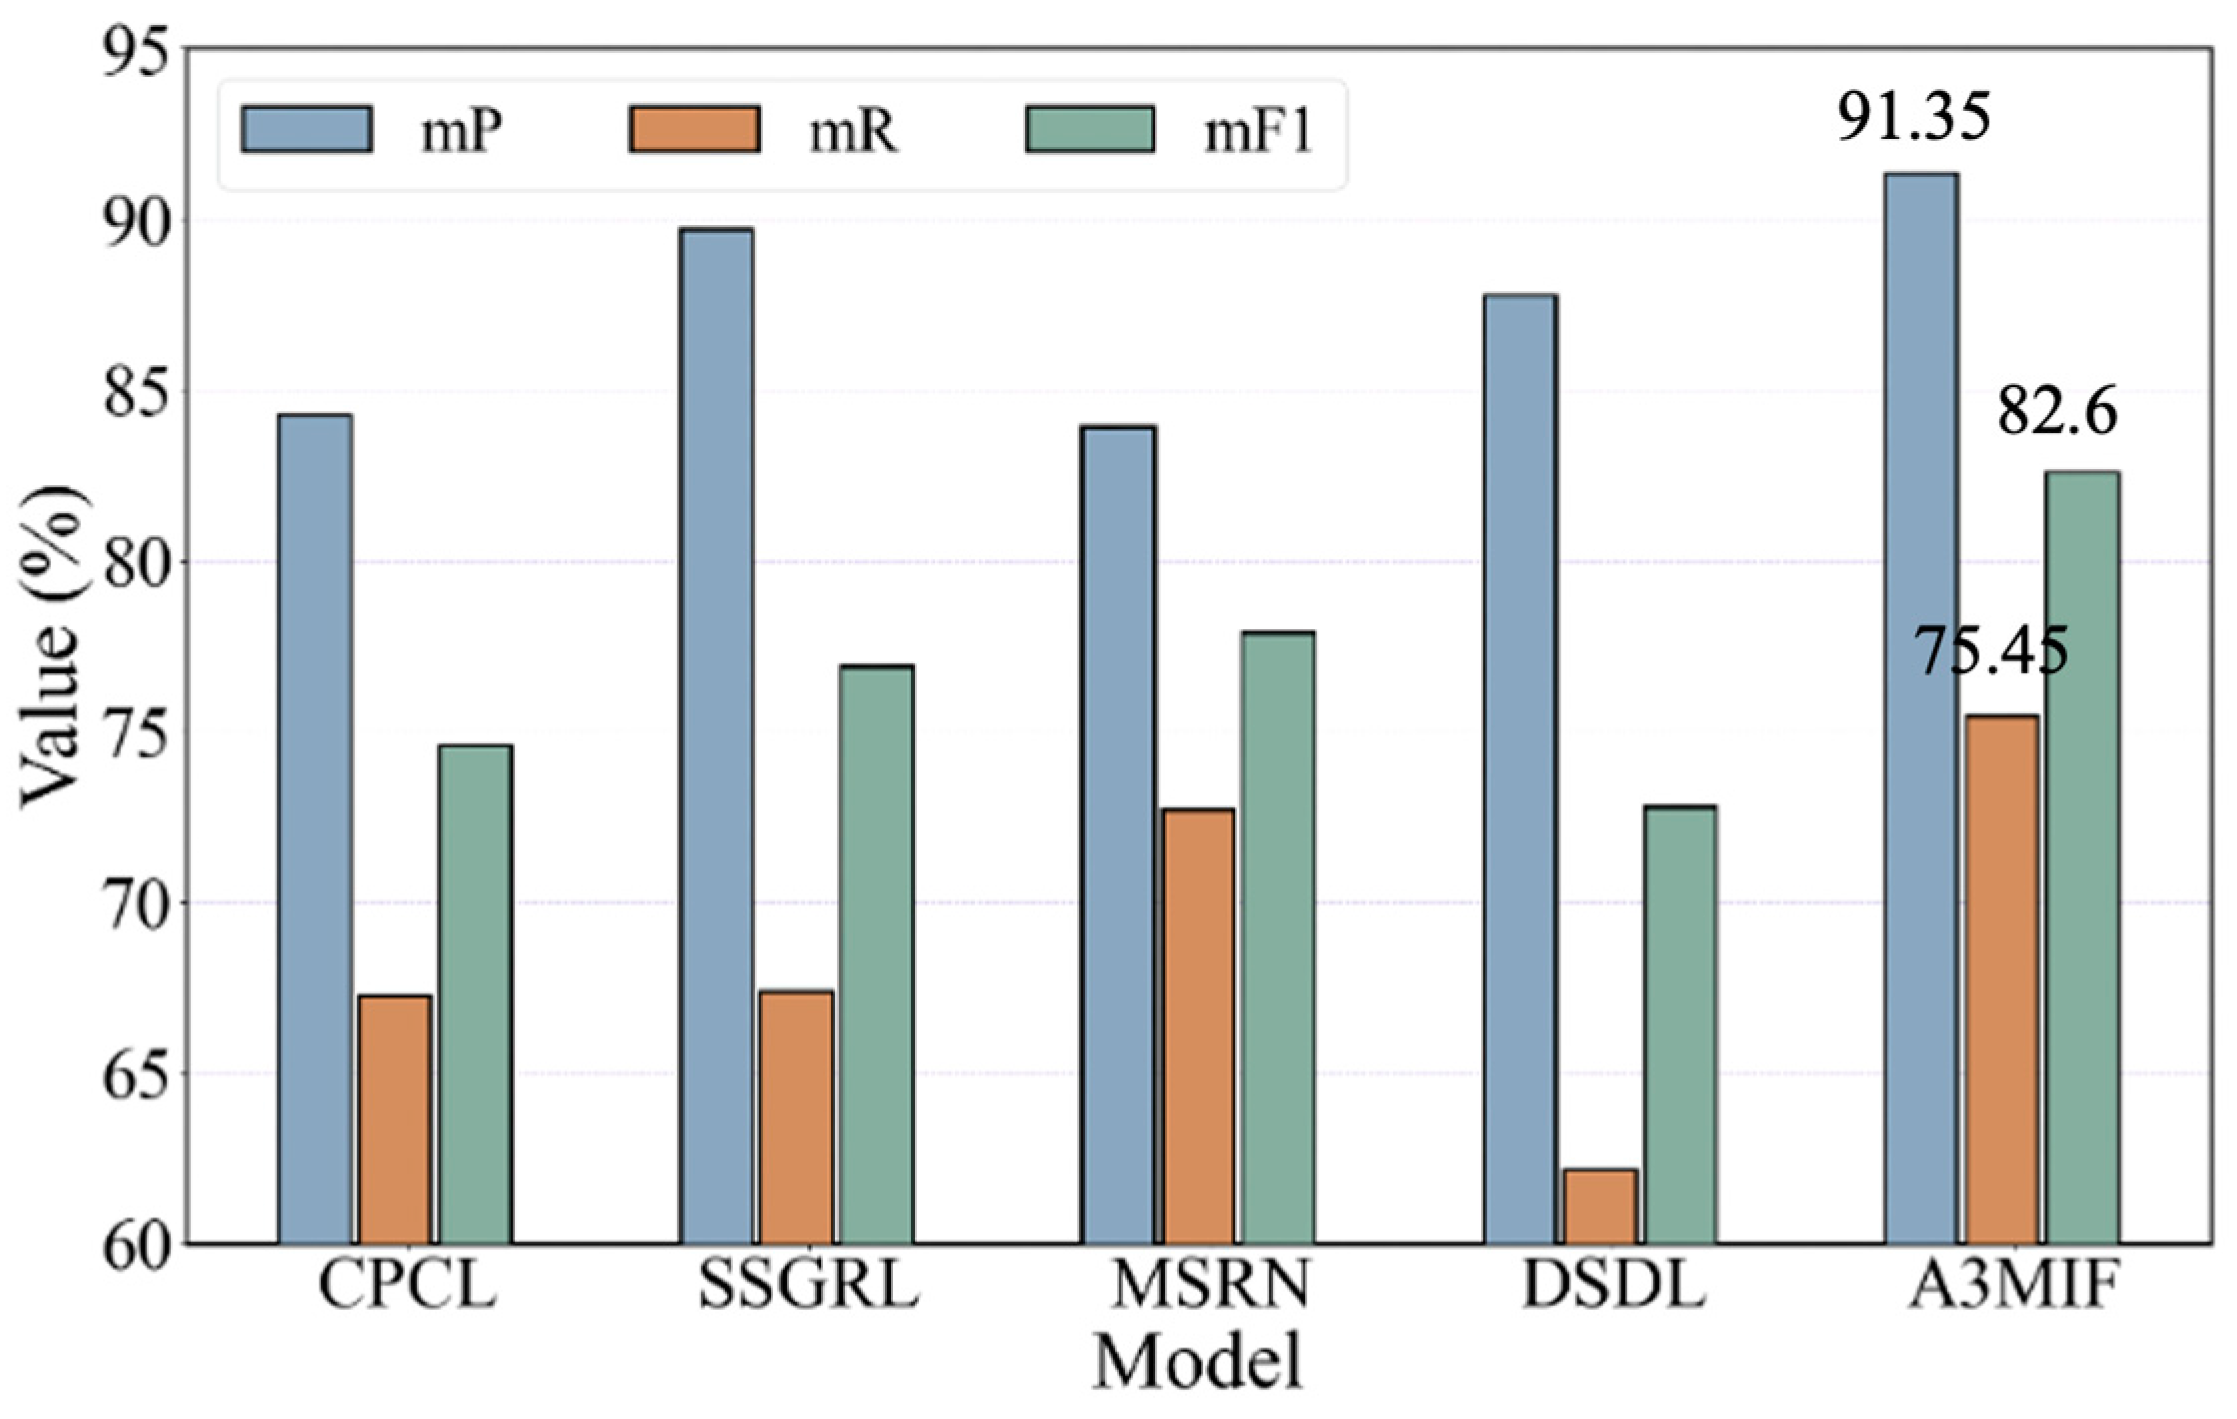
| CPCL | 1 | 87.1 | 63.3 | 73.3 | 84.25 | 67.25 | 74.6 |
| 2 | 81.4 | 71.2 | 75.9 | ||||
| SSGRL | 1 | 90.1 | 63.2 | 74.3 | 89.7 | 67.4 | 76.9 |
| 2 | 89.3 | 71.6 | 79.4 | ||||
| MSRN | 1 | 83.2 | 74.1 | 78.3 | 83.9 | 72.7 | 77.9 |
| 2 | 84.6 | 71.3 | 77.3 | ||||
| DSDL | 1 | 88.0 | 63.2 | 73.5 | 87.75 | 62.15 | 72.8 |
| 2 | 87.5 | 61.1 | 72 | ||||
| A3MIF | 1 | 90.6 | 76.3 | 82.8 | 91.35 | 75.45 | 82.6 |
| 2 | 92.1 | 74.6 | 82.4 | ||||
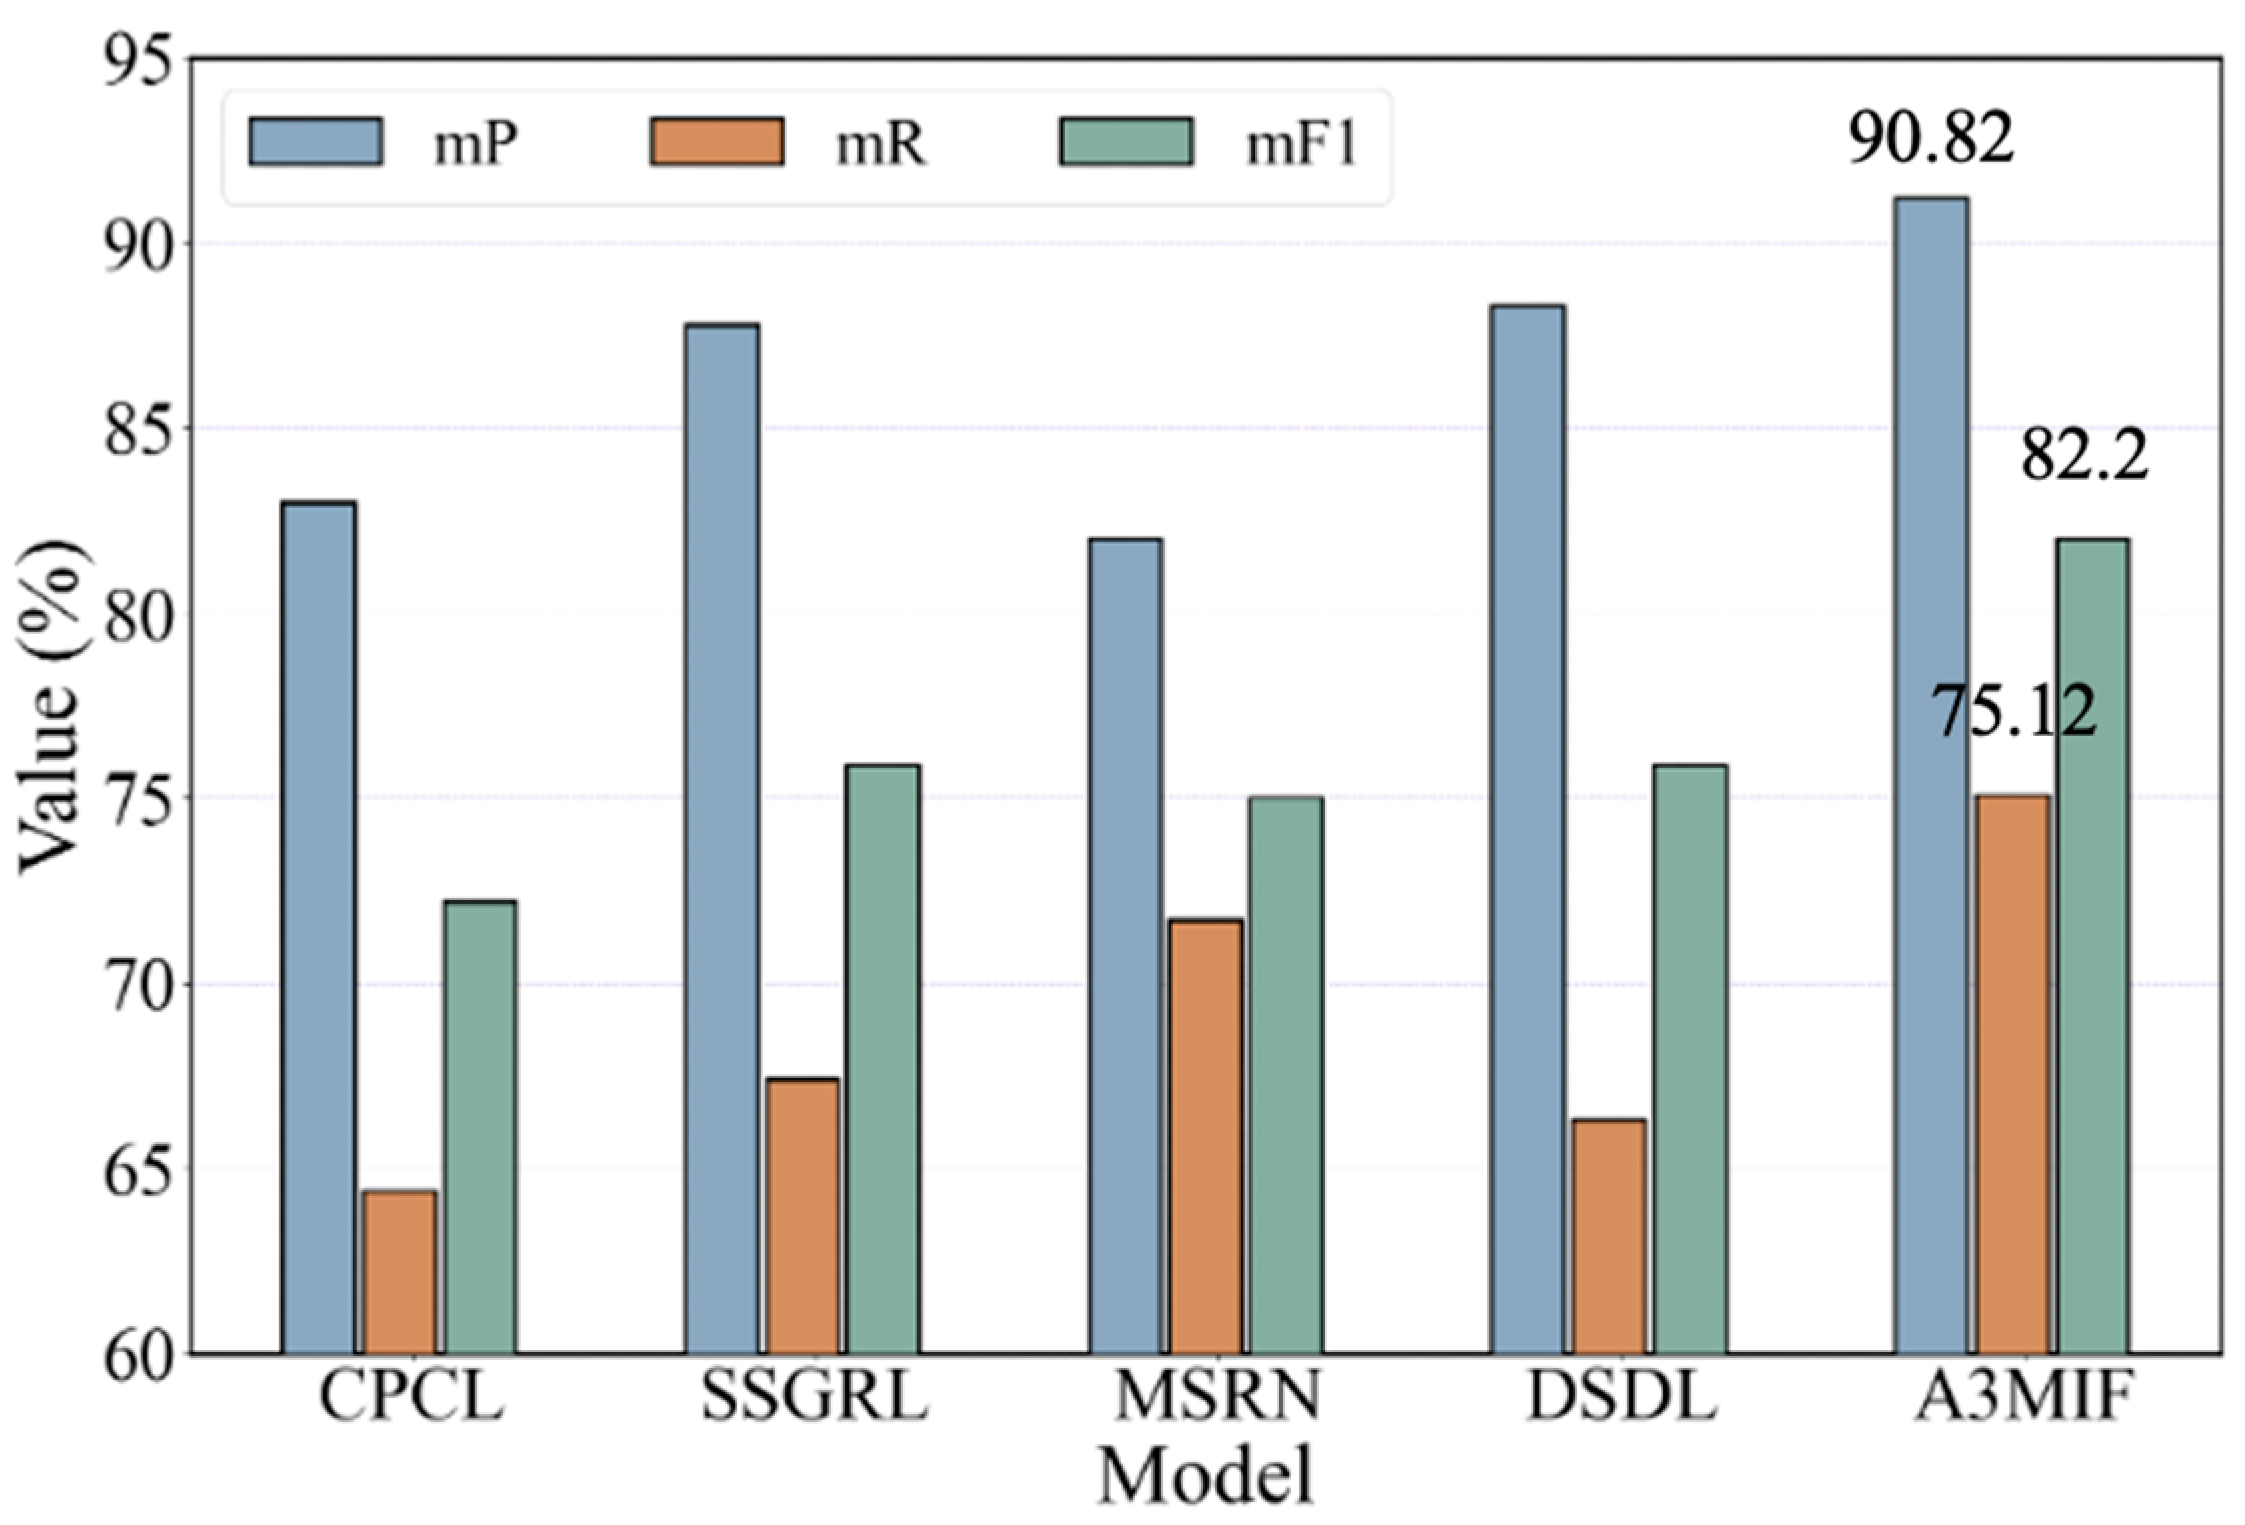
| Method | Classes | Evaluation Metrics (Per) | Evaluation Metrics (Average) | ||||
|---|---|---|---|---|---|---|---|
| P | R | F1 | mP | mR | mF1 | ||
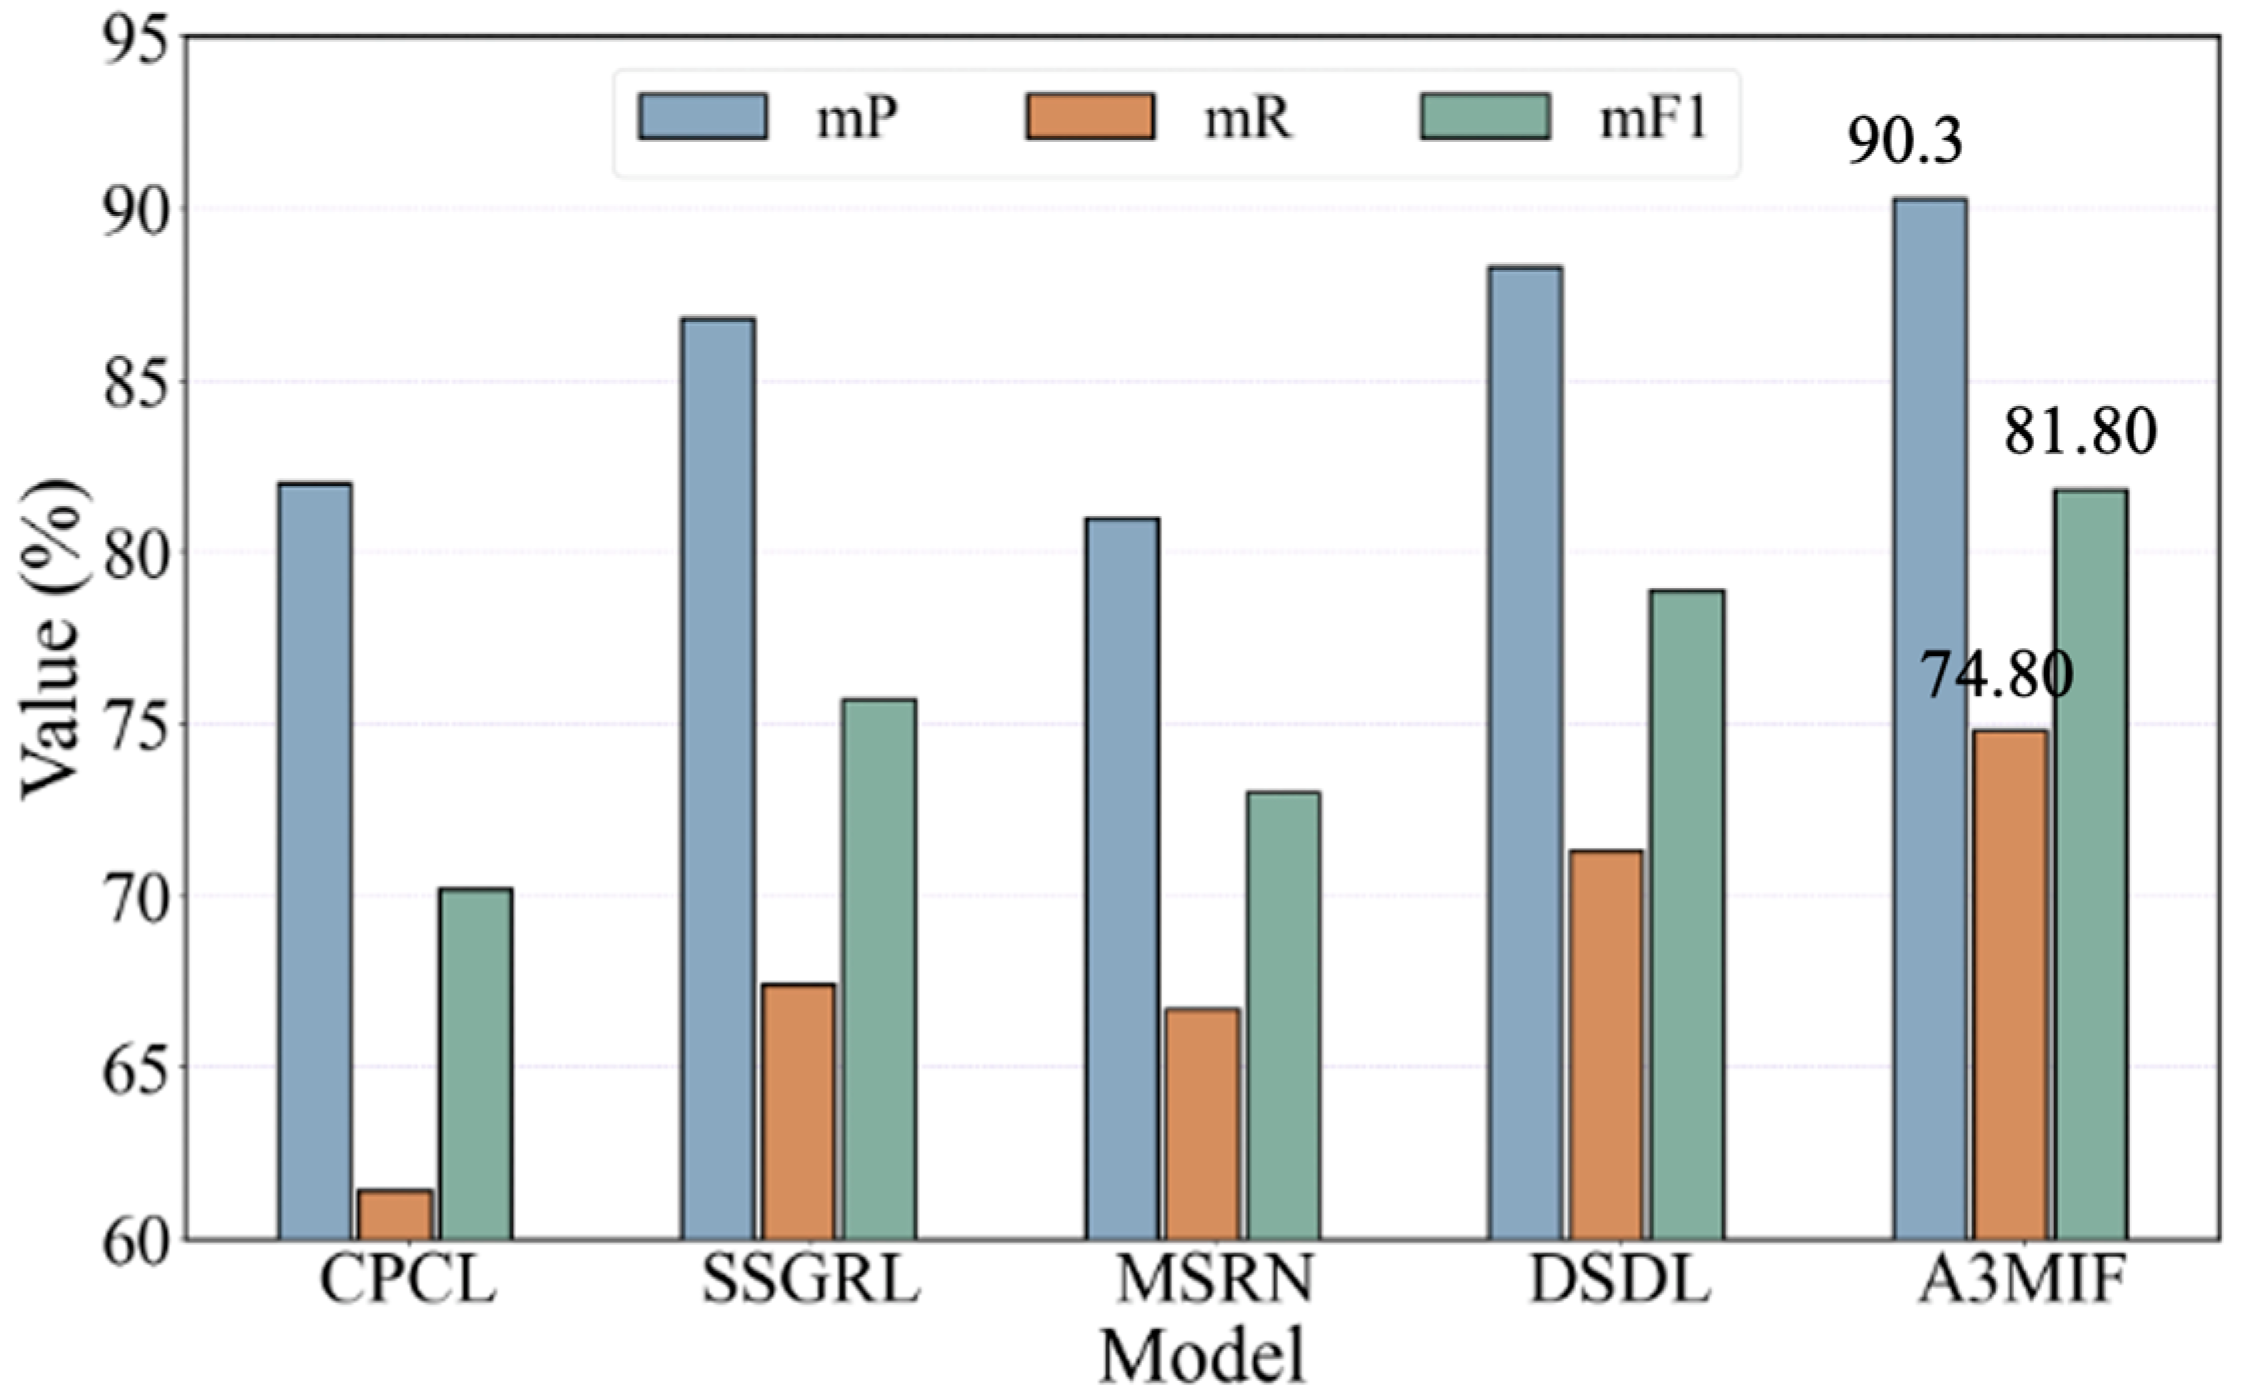
| CPCL | 1 | 82.0 | 60.6 | 69.7 | 82.0 | 61.4 | 70.2 |
| 2 | 83.5 | 62.2 | 71.3 | ||||
| 3 | 80.3 | 61.4 | 69.6 | ||||
| SSGRL | 1 | 89.6 | 64.3 | 74.9 | 86.8 | 67.4 | 75.7 |
| 2 | 88.7 | 67.6 | 76.7 | ||||
| 3 | 82.1 | 70.3 | 75.7 | ||||
| MSRN | 1 | 80.1 | 65.5 | 72.1 | 81.0 | 66.7 | 73.0 |
| 2 | 79.3 | 70.3 | 74.5 | ||||
| 3 | 83.5 | 64.4 | 72.7 | ||||
| DSDL | 1 | 88.3 | 70.2 | 78.2 | 88.3 | 71.3 | 78.9 |
| 2 | 89.1 | 72.2 | 79.8 | ||||
| 3 | 87.4 | 71.4 | 78.6 | ||||
| A3MIF | 1 | 91.1 | 76.2 | 82.9 | 90.3 | 74.8 | 81.8 |
| 2 | 90.3 | 78.1 | 83.8 | ||||
| 3 | 89.6 | 70.1 | 78.7 | ||||
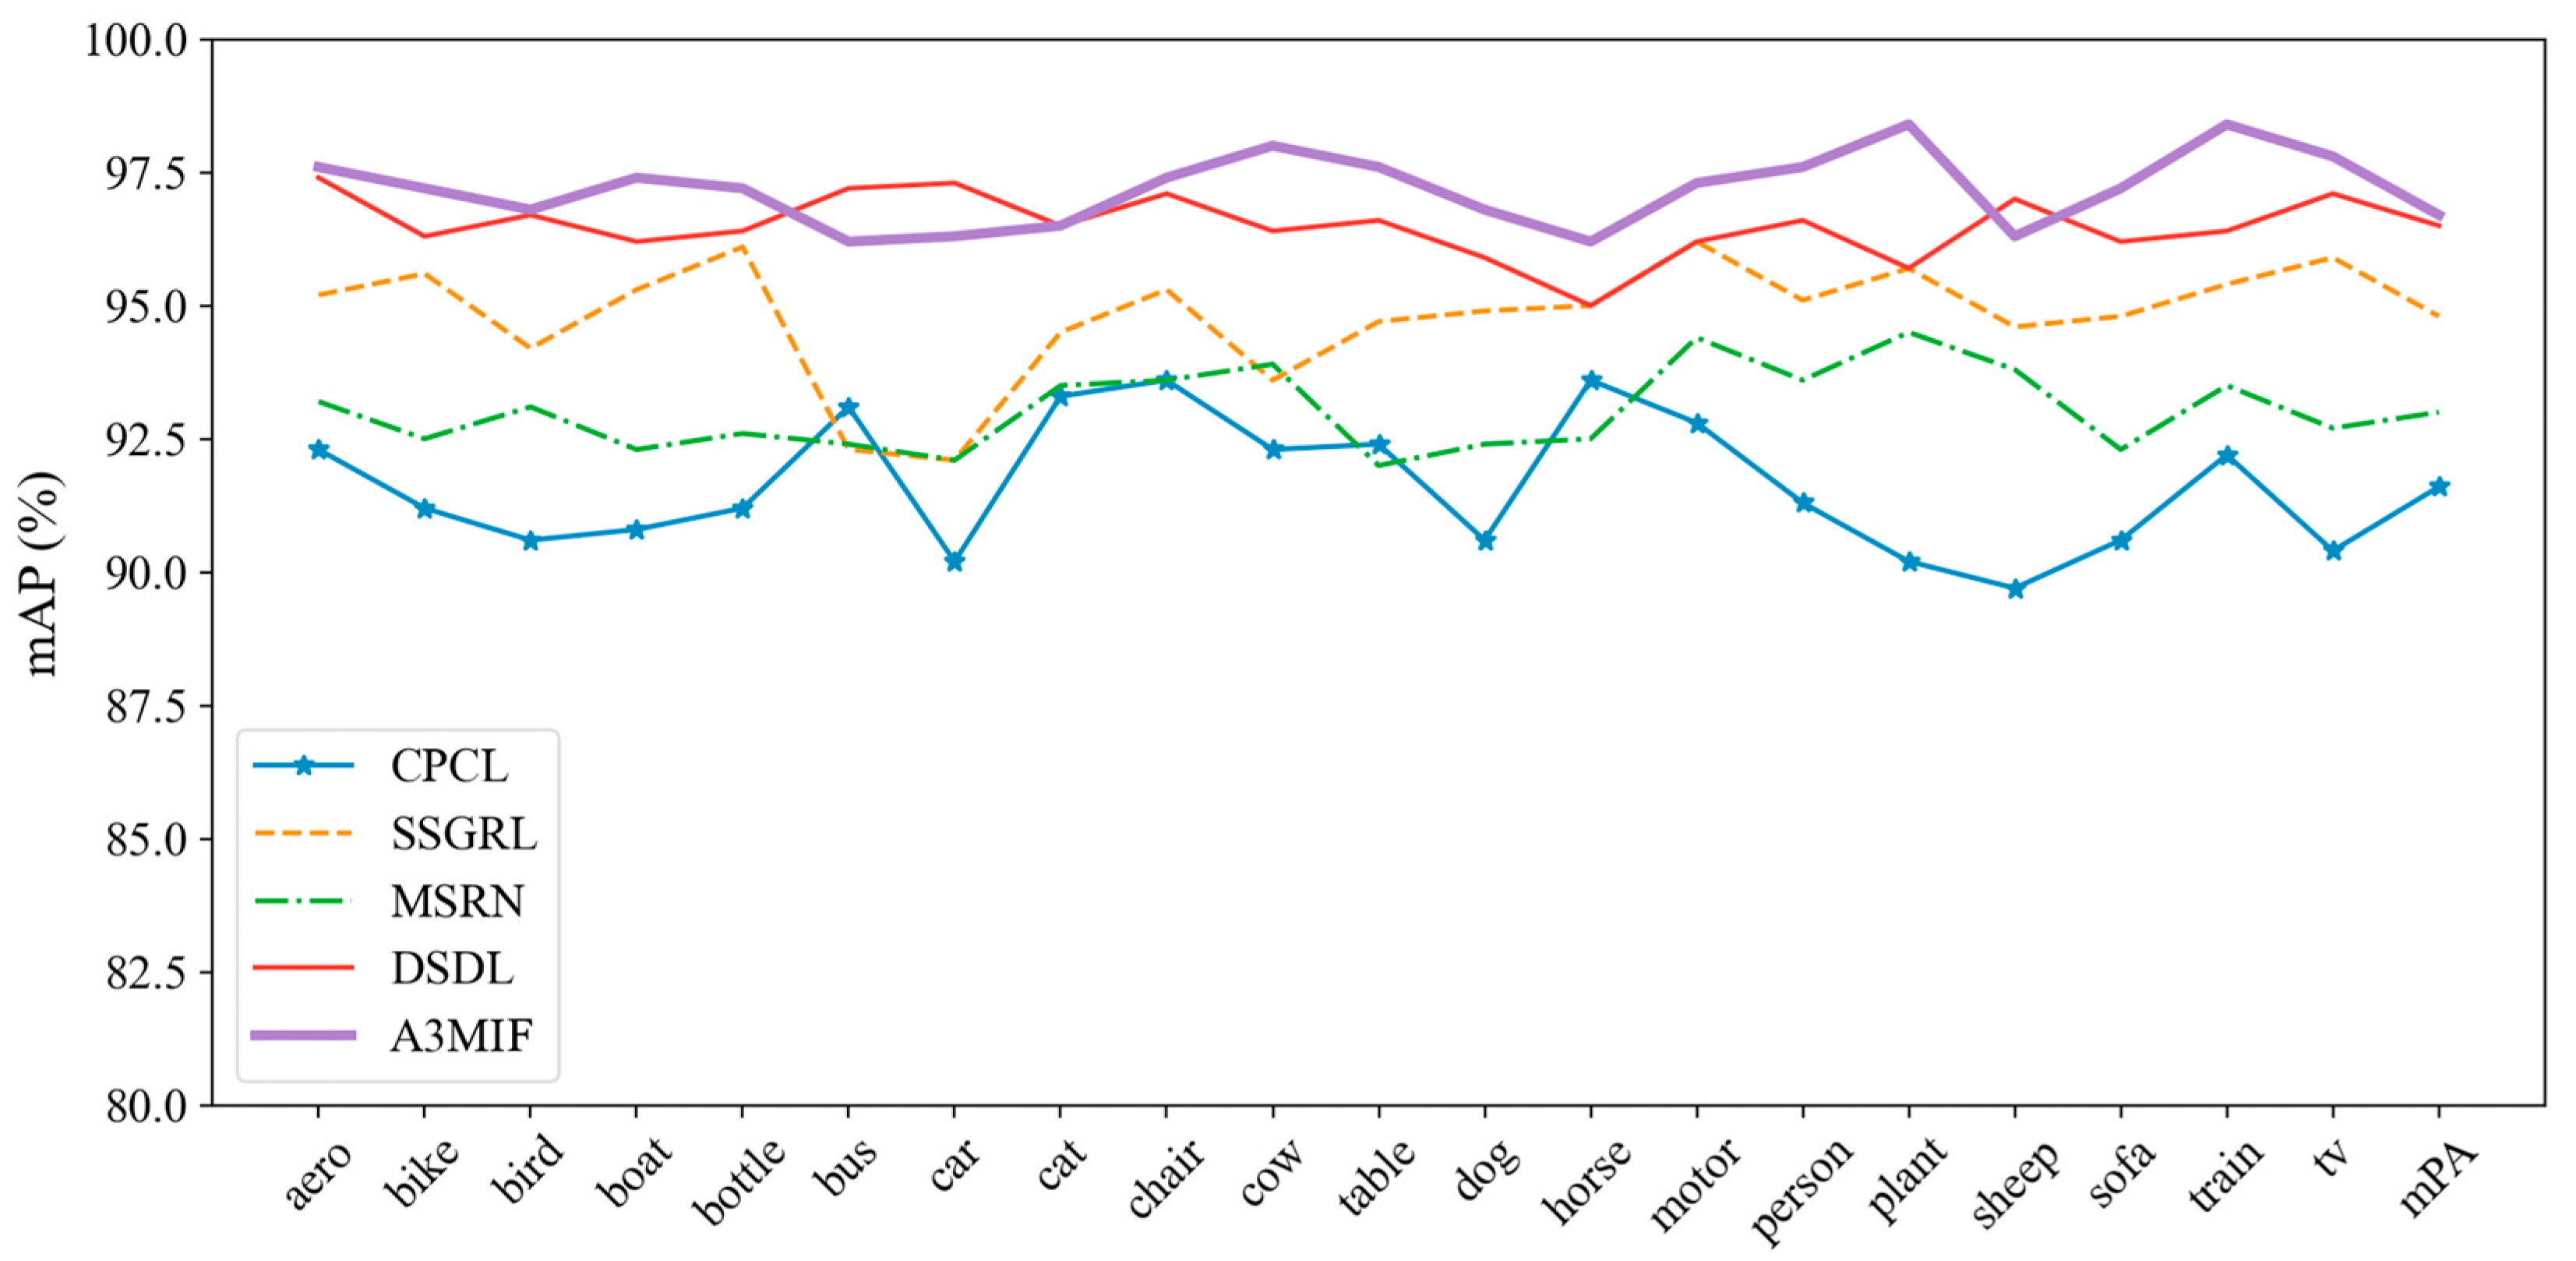
| Classes | Method | ||||
|---|---|---|---|---|---|
| CPCL | SSGRL | MSRN | DSDL | A3MIF | |
| aero | 92.3 | 95.2 | 93.2 | 97.4 | 97.6 |
| bike | 91.2 | 95.6 | 92.5 | 96.3 | 97.2 |
| bird | 90.6 | 94.2 | 93.1 | 96.7 | 96.8 |
| boat | 90.8 | 95.3 | 92.3 | 96.2 | 97.4 |
| bottle | 91.2 | 96.1 | 92.6 | 96.4 | 97.2 |
| bus | 93.1 | 92.3 | 92.4 | 97.2 | 96.2 |
| car | 90.2 | 92.1 | 92.1 | 97.3 | 96.3 |
| cat | 93.3 | 94.5 | 93.5 | 96.5 | 96.5 |
| chair | 93.6 | 95.3 | 93.6 | 97.1 | 97.4 |
| cow | 92.3 | 93.6 | 93.9 | 96.4 | 98.0 |
| table | 92.4 | 94.7 | 92.0 | 96.6 | 97.6 |
| dog | 90.6 | 94.9 | 92.4 | 95.9 | 96.8 |
| horse | 93.6 | 95.0 | 92.5 | 95.0 | 96.2 |
| motor | 92.8 | 96.2 | 94.4 | 96.2 | 97.3 |
| person | 91.3 | 95.1 | 93.6 | 96.6 | 97.6 |
| plant | 90.2 | 95.7 | 94.5 | 95.7 | 98.4 |
| sheep | 89.7 | 94.6 | 93.8 | 97.0 | 96.3 |
| sofa | 90.6 | 94.8 | 92.3 | 96.2 | 97.2 |
| train | 92.2 | 95.4 | 93.5 | 96.4 | 98.4 |
| tv | 90.4 | 95.9 | 92.7 | 97.1 | 97.8 |
| mPA | 91.6 | 94.8 | 93.0 | 96.5 | 97.2 |
Disclaimer/Publisher’s Note: The statements, opinions and data contained in all publications are solely those of the individual author(s) and contributor(s) and not of MDPI and/or the editor(s). MDPI and/or the editor(s) disclaim responsibility for any injury to people or property resulting from any ideas, methods, instructions or products referred to in the content. |
© 2024 by the authors. Licensee MDPI, Basel, Switzerland. This article is an open access article distributed under the terms and conditions of the Creative Commons Attribution (CC BY) license (https://creativecommons.org/licenses/by/4.0/).
Share and Cite
He, L.; Wei, Q.; Gong, M.; Yang, X.; Wei, J. Multi-Source Feature-Fusion Method for the Seismic Data of Cultural Relics Based on Deep Learning. Sensors 2024, 24, 4525. https://doi.org/10.3390/s24144525
He L, Wei Q, Gong M, Yang X, Wei J. Multi-Source Feature-Fusion Method for the Seismic Data of Cultural Relics Based on Deep Learning. Sensors. 2024; 24(14):4525. https://doi.org/10.3390/s24144525
Chicago/Turabian StyleHe, Lin, Quan Wei, Mengting Gong, Xiaofei Yang, and Jianming Wei. 2024. "Multi-Source Feature-Fusion Method for the Seismic Data of Cultural Relics Based on Deep Learning" Sensors 24, no. 14: 4525. https://doi.org/10.3390/s24144525
APA StyleHe, L., Wei, Q., Gong, M., Yang, X., & Wei, J. (2024). Multi-Source Feature-Fusion Method for the Seismic Data of Cultural Relics Based on Deep Learning. Sensors, 24(14), 4525. https://doi.org/10.3390/s24144525