
Validation of Citizen Science Meteorological Data: Can They Be Considered a Valid Help in Weather Understanding and Community Engagement?

 ,
,  and
and 
Abstract
:1. Introduction
- Improving the knowledge of climate change science and the understanding of related physical, socioeconomic and cultural processes;
- Promoting the active participation of citizens in data collection in eight Living Labs (LLs), in Europe, the Middle East, and Africa, through citizen tools and sensors;
- Increasing the usability and interoperability of the data collected by the citizens at a broader scale.
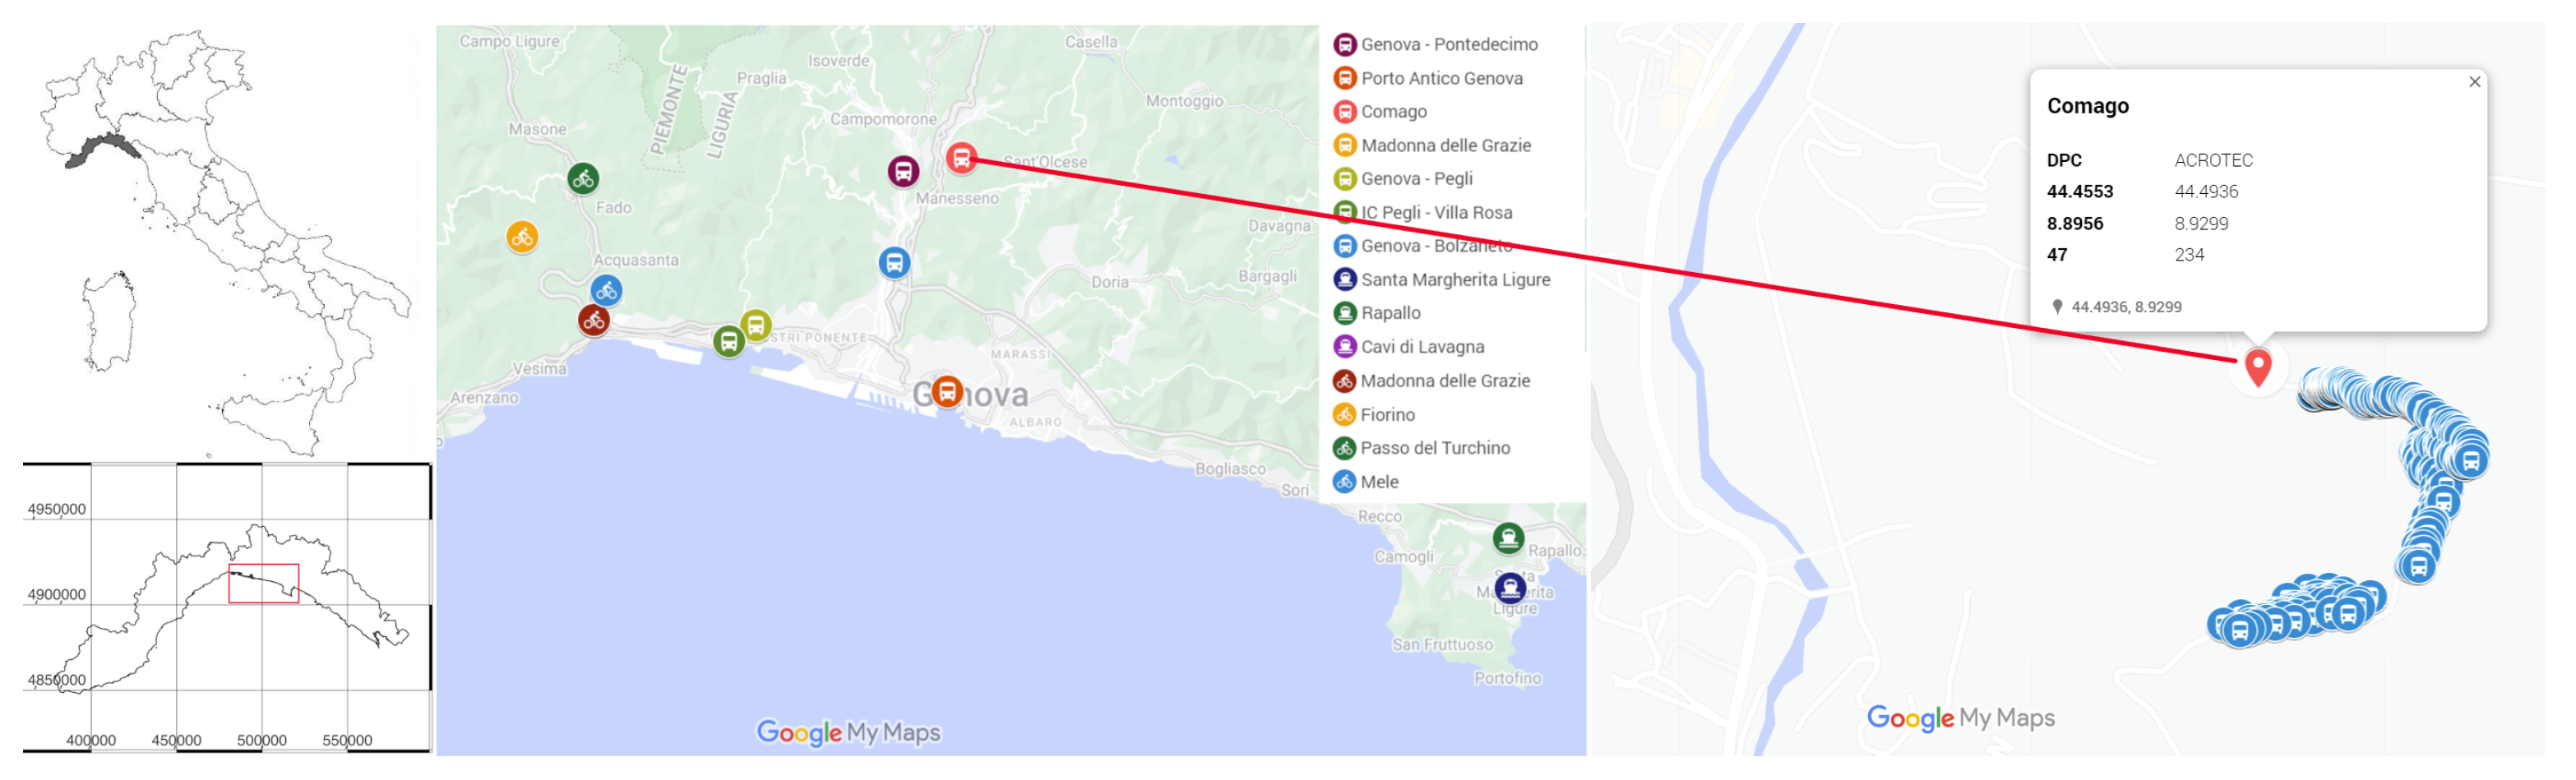
2. The MeteoTracker Device
- A mobile app (Android and iOS) for real-time data visualization and upload to the server and archive management;
- A full-stack suite that includes an advanced dashboard for data visualization (on map, graphs, numeric format, and other advanced features);
- An API service for data integration on third-party platforms;
- An interactive map embeddable in third-party websites;
- Other software implementations for data processing (like the Virtual Fixed Station suite).
3. Methodology
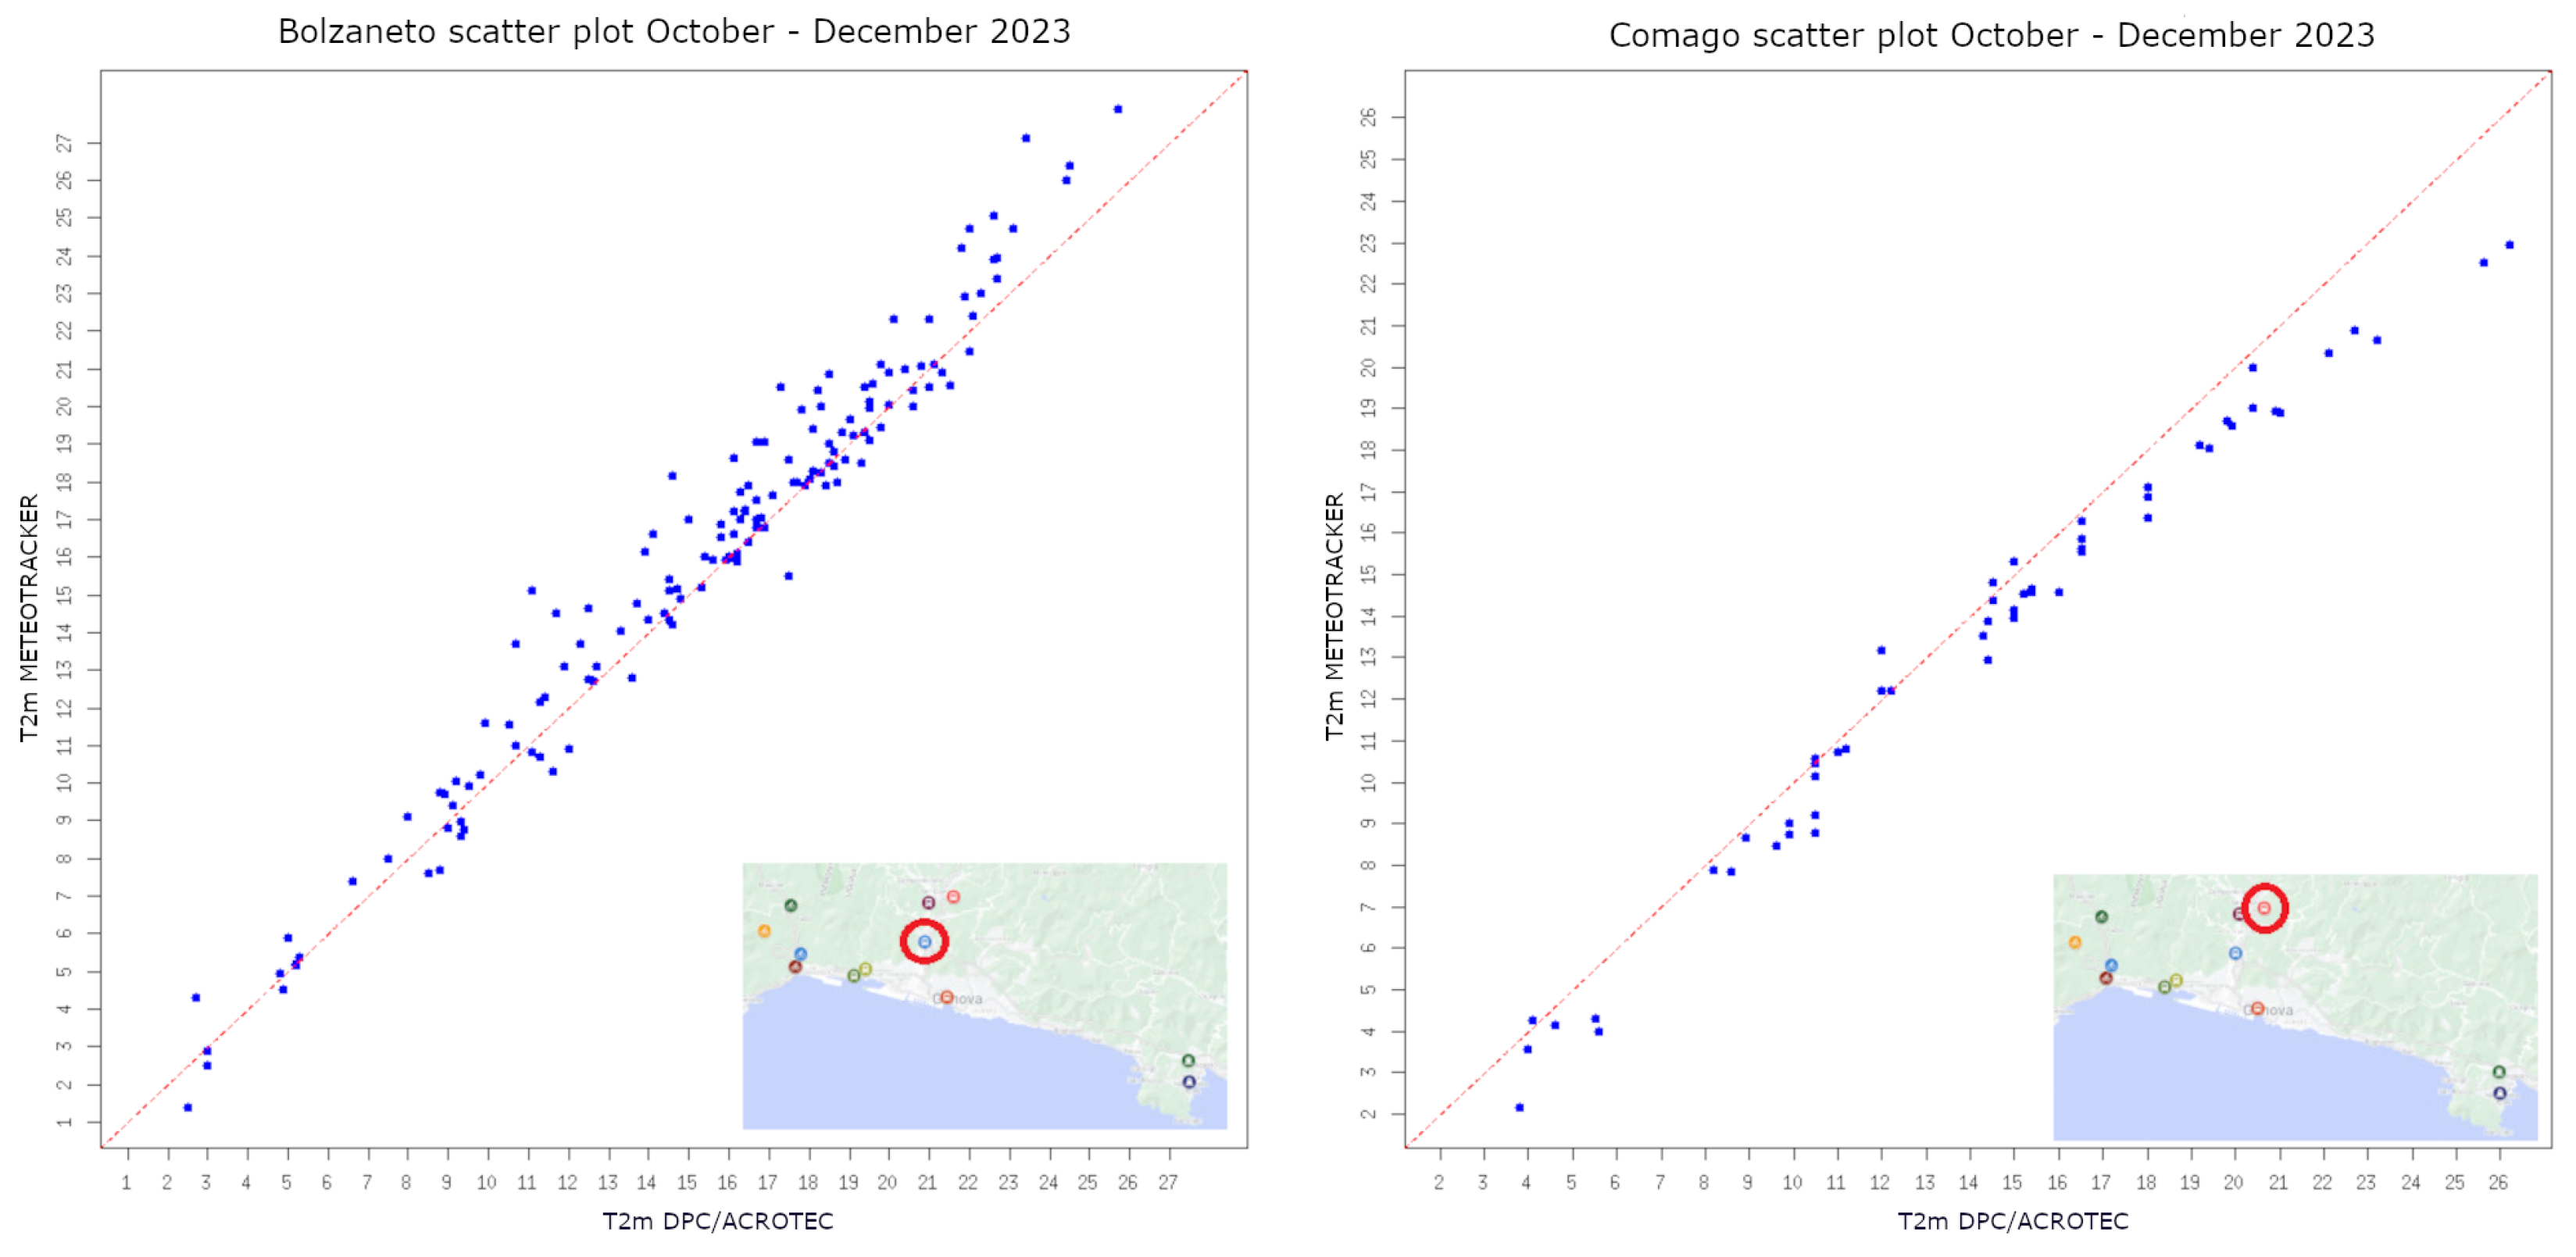
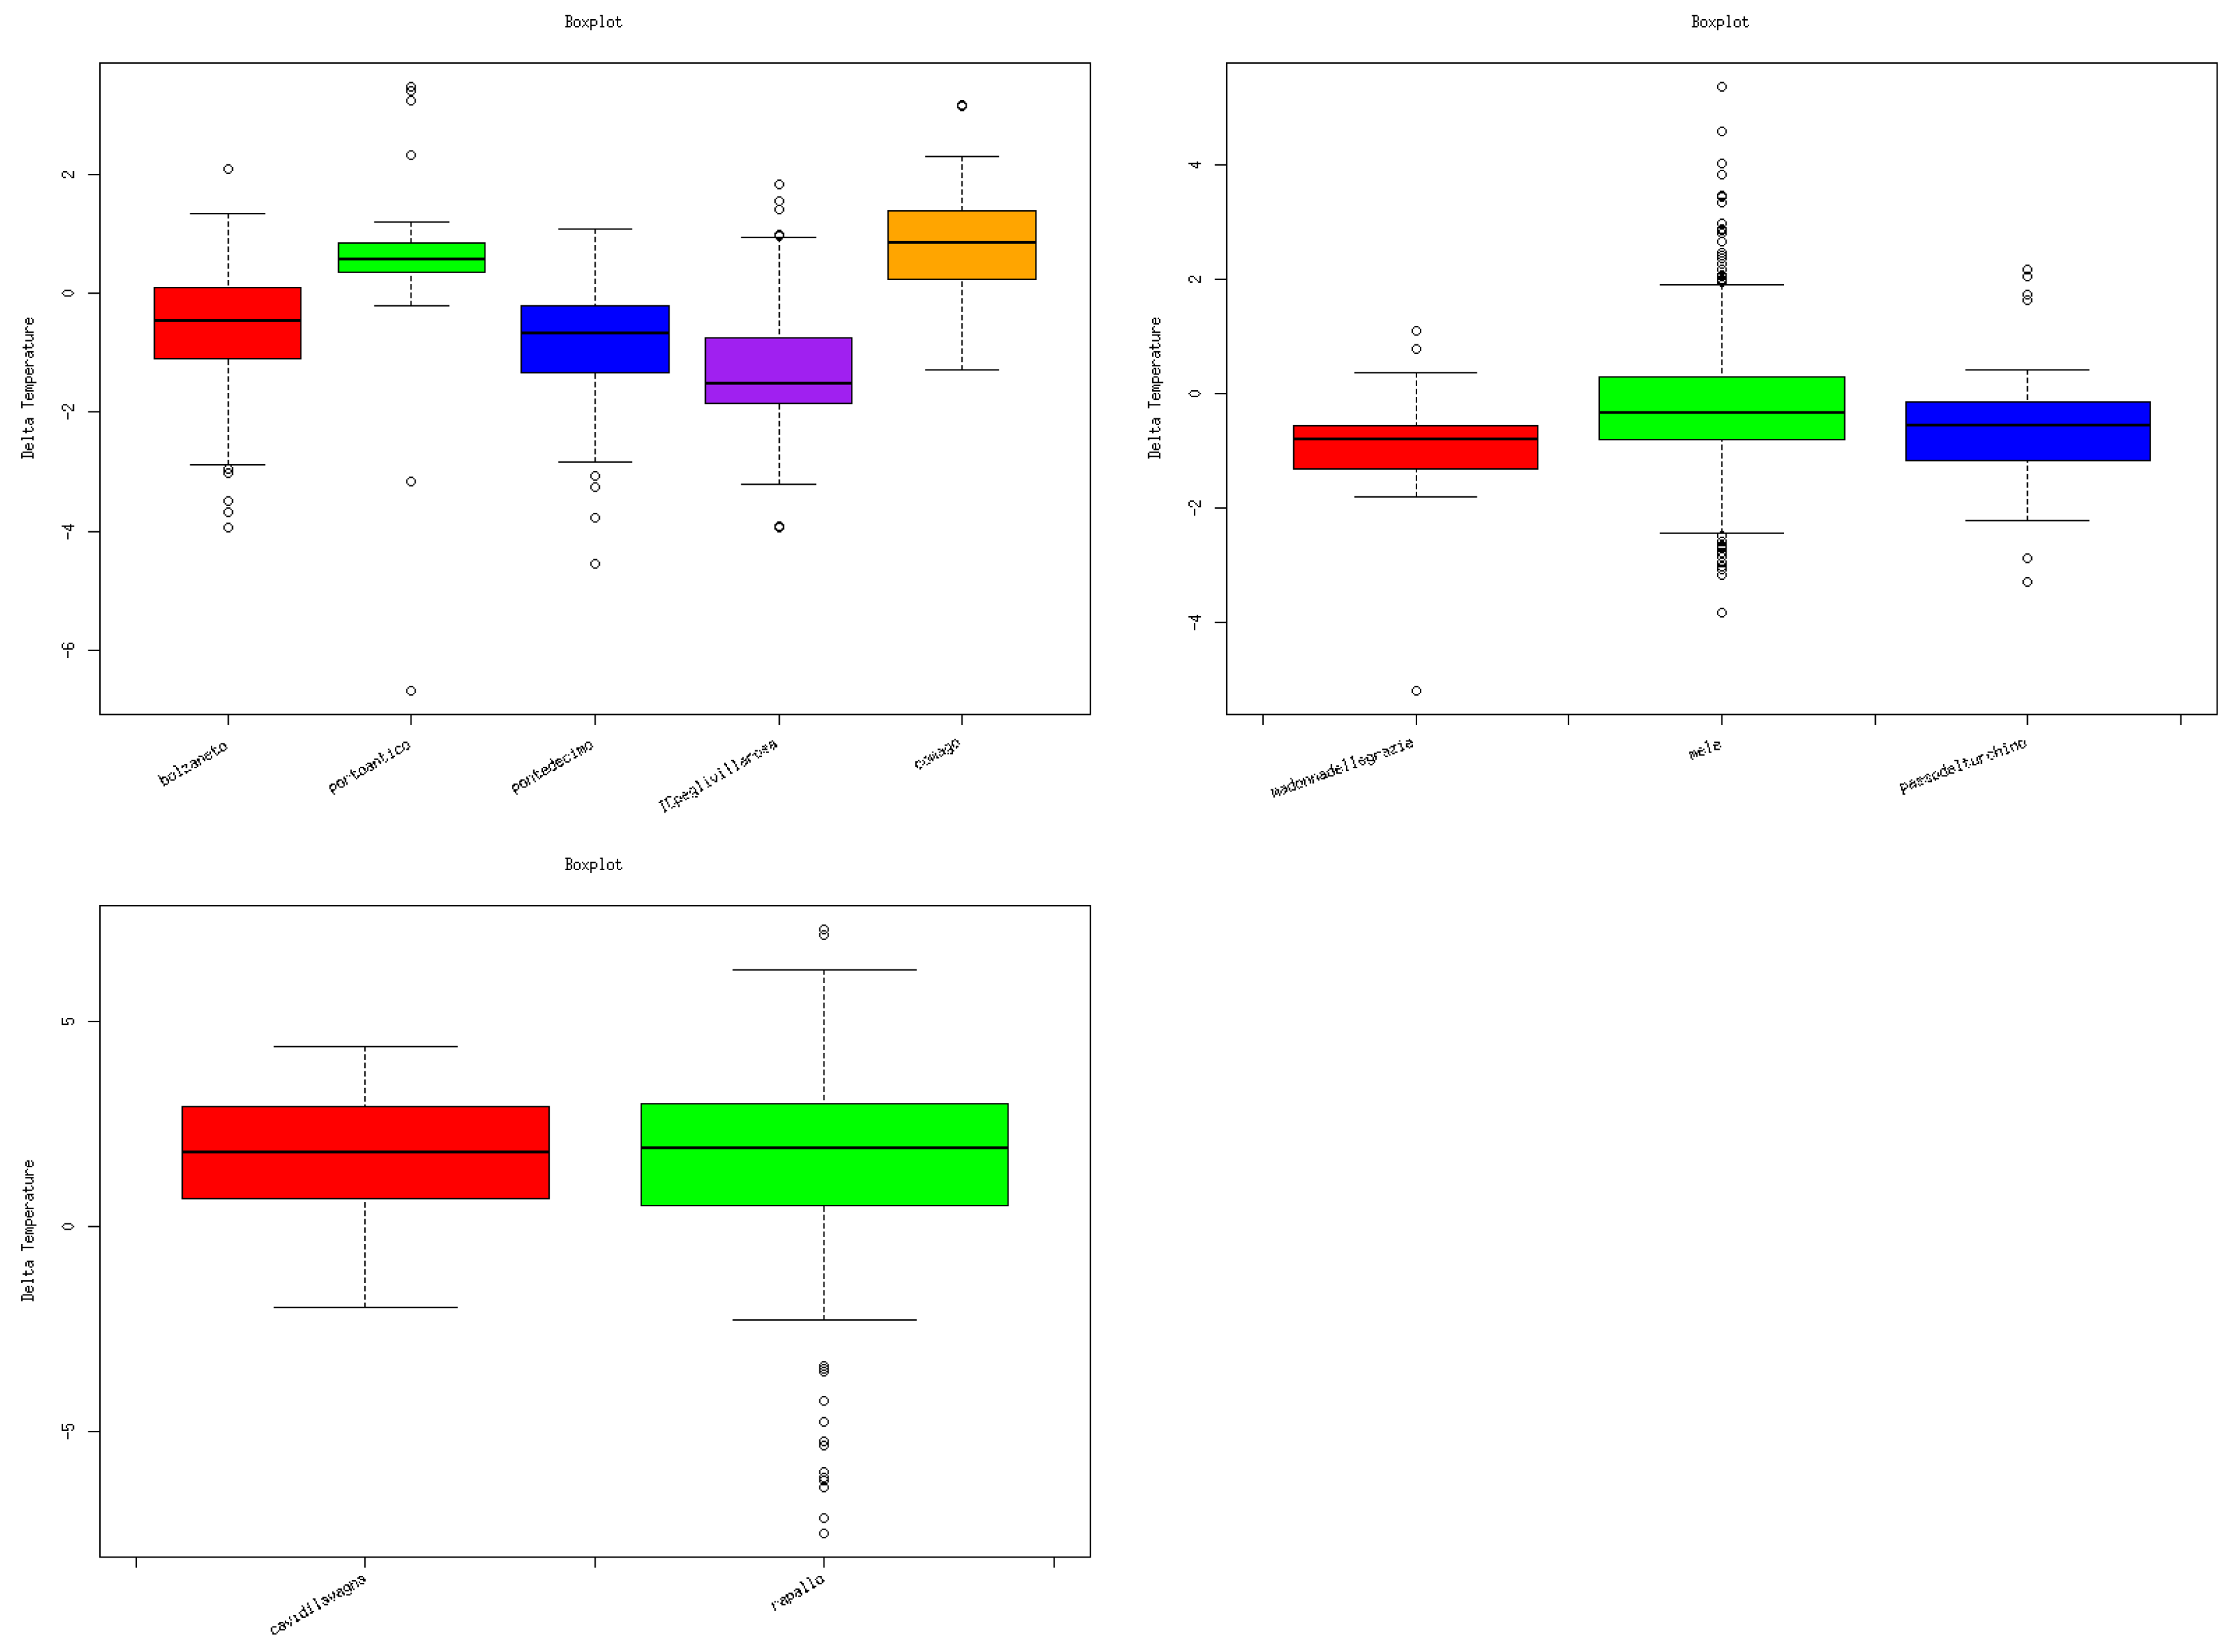
4. Results
5. Discussion
6. Conclusions
Author Contributions
Funding
Data Availability Statement
Acknowledgments
Conflicts of Interest
Abbreviations
| MT | MeteoTracker |
| LLs | Living Labs |
| EIH | Environmental Impact Hub |
References
- Bonney, R.; Cooper, C.B.; Dickinson, J.; Kelling, S.; Phillips, T.; Rosenberg, K.V.; Shirk, J. Citizen science: A developing tool for expanding science knowledge and scientific literacy. BioScience 2009, 159, 977–984. [Google Scholar] [CrossRef]
- Hand, E. Citizen science: People power. Nature 2010, 466, 685–687. [Google Scholar] [CrossRef] [PubMed]
- Jordan, R.; Crall, A.; Gray, S.; Phillips, T.; Mellor, D.; Crall, A. Citizen science as a distinct field of inquiry. BioScience 2015, 61, 208–211. [Google Scholar] [CrossRef]
- Davis, L.S.; Zhu, L.; Finkler, W. Citizen Science: Is It Good Science? Sustainability 2023, 15, 4577. [Google Scholar] [CrossRef]
- Silvertown, J. A new dawn for citizen science. Trends Ecol. Evol. 2015, 24, 467–471. [Google Scholar] [CrossRef] [PubMed]
- Fraisl, D.; Hager, G.; Bedessem, B.; Gold, M.; Hsing, P.Y.; Danielsen, F.; Hitchcock, C.B.; Hulbert, J.M.; Piera, J.; Spiers, H.; et al. Citizen science in environmental and ecological sciences. Nat. Rev. Methods Prim. 2022, 2, 64. [Google Scholar] [CrossRef]
- Hsiao, H. ICT-mixed community participation model for development planning in a vulnerable sandbank community: Case study of the Eco Shezi Island Plan in Taipei City, Taiwan. Int. J. Disaster Risk Reduct. 2021, 58, 102218. [Google Scholar] [CrossRef]
- Liao, K.H.; Chiang, Y.S.; Chan, J.K.H. The levee dilemma game: A game experiment on flood management decision-making. Int. J. Disaster Risk Reduct. 2023, 90, 103662. [Google Scholar] [CrossRef]
- Conrad, C.C.; Hilchey, K.G. A review of citizen science and community-based environmental monitoring: Issues and opportunities. Environ. Monit. Assess. 2011, 176, 273–291. [Google Scholar] [CrossRef]
- Smith, B.; Rodriguez, S. Spatial Analysis of High-Resolution Radar Rainfall and Citizen-Reported Flash Flood Data in Ultra-Urban New York City. Water 2017, 9, 736. [Google Scholar] [CrossRef]
- European Commission. Best Practices in Citizen Science for Environmental Monitoring. CSWD(2020). Available online: https://data.consilium.europa.eu/doc/document/ST-9973-2020-INIT/en/pdf (accessed on 9 July 2024).
- Cecilia, A.; Peng, Z. Validating a Cycle-Based IoT Sensor for Mapping Intra-Urban Air Temperature and Humidity. In Will Cities Survive? The Future of Sustainable Buildings and Urbanism in the Age of Emergency; Bustamante, W., Andrade, M., Ortiz, E.P., Eds.; PLEA International: Santiago, Chile, 2022; Volume 1, pp. 954–959. [Google Scholar]
- Downs, R.R.; Ramapriyan, H.K.; Peng, G.; Wei, Y. Perspectives on citizen science data quality. Front. Clim. 2011, 3, 615032. [Google Scholar] [CrossRef]
- Zanetti, C.; Carraro, M.; De Marchi, M.; Pappalardo, S.E. Volunteered geographic information for mapping urban climate and air quality: Testing and assessing ‘Sniffer bikes’ with low-cost sensors. Int. Arch. Photogramm. Remote. Sens. Spat. Inf. Sci. 2023, 48, 555–561. [Google Scholar] [CrossRef]
- I-CHANGE Project. Citizen Actions on Climate Change and Environment. Available online: https://ichange-project.eu/ (accessed on 9 July 2024).
- Barbano, F.; Brattich, E.; Cintolesi, C.; Nizamani, A.G.; Di Sabatino, S.; Milelli, M.; Peerlings, E.E.M.; Polder, S.; Steeneveld, G.-J.; Parodi, A. Performance Evaluation of MeteoTracker Mobile Sensor for Outdoor Applications. Atmosoheric Meas. Tech. 2024, 17, 3255–3278. [Google Scholar] [CrossRef]
- Shirk, J.L.; Ballard, H.L.; Wilderman, C.C.; Phillips, T.; Wiggins, A.; Jordan, R.; McCallie, E.; Minarchek, M.; Lewenstein, B.V.; Krasny, M.E. Public participation in scientific research: A framework for deliberate design. Ecol. Soc. 2012, 17, 20. [Google Scholar] [CrossRef]
- Magalhães, J.; Guasch, B.; Arias, R.; Giardullo, P.; Elorza, A.; Navalhas, I.; Marín-González, E.; Mazzonetto, M.; Luís, C. A methodological approach to co-design citizen science communication strategies directed to quadruple-helix stakeholders. J. Sci. Commun. 2022, 21, 1–20. [Google Scholar] [CrossRef]
- Jansa, A.; Alpert, P.; Arbogast, P.; Buzzi, A.; Ivancan-Picek, B.; Kotroni, V.; Speranza, A. MEDEX: A general overview. Nat. Hazards Earth Syst. Sci. 2014, 14, 1965–1984. [Google Scholar] [CrossRef]
- La Scienza va Anche in Bicicletta, il Progetto della Fondazione Cima. Available online: https://www.rainews.it/tgr/liguria/video/2023/06/raccogliere-dati-sul-clima-in-bicicletta-il-progetto-della-fondazione-cima--af17abd9-7244-40ad-8326-f072363426a7.html (accessed on 9 July 2024).
- González-Alemán, J.J.; Insua-Costa, D.; Bazile, E.; González-Herrero, S.; Marcello Miglietta, M.; Groenemeijer, P.; Donat, M.G. Anthropogenic warming had a crucial role in triggering the historic and destructive Mediterranean derecho in summer 2022. Bull. Am. Meteorol. Soc. 2023, 104, E1526–E1532. [Google Scholar] [CrossRef]
- Parodi, A.; Ferraris, L.; Gallus, W.; Maugeri, M.; Molini, L.; Siccardi, F.; Boni, G. Ensemble cloud-resolving modelling of a historic back-building mesoscale convective system over Liguria: The San Fruttuoso case of 1915. Clim. Past 2017, 13, 455–472. [Google Scholar] [CrossRef]
- Haklay, M. Citizen science and volunteered geographic information: Overview and typology of participation. In Crowdsourcing Geographic Knowledge; Springer: Berlin/Heidelberg, Germany, 2017; pp. 105–122. [Google Scholar]
- Kullenberg, C.; Kasperowski, D. What is citizen science?–A scientometric meta-analysis. PLoS ONE 2016, 11, e0147152. [Google Scholar] [CrossRef]
- Poslad, S.; Irum, T.; Charlton, P.; Mumtaz, R.; Azam, M.; Zaidi, H.; Herodotou, C.; Yu, G.; Toosy, F. How IoT-Driven citizen science coupled with data satisficing can promote deep citizen science. Sensors 2022, 22, 3196. [Google Scholar] [CrossRef]
- Overdevest, C.; Orr, C.H.; Stepenuck, K.F. Volunteer stream monitoring and local participation in natural resource issues. Hum. Ecol. Rev. 2004, 11, 177–185. [Google Scholar]
- Rotman, D.; Preece, J.; Hammock, J.; Procita, K.; Hansen, D.; Parr, C.; Lewis, D. Dynamic changes in motivation in collaborative citizen-science projects. In Proceedings of the ACM 2012 Conference on Computer Supported Cooperative Work, Seatle, WA, USA, 11–15 February 2012; pp. 217–226. [Google Scholar]
- McKinley, D.C.; Miller-Rushing, A.J.; Ballard, H.L.; Bonney, R.; Brown, H.; Cook-Patton, S.C.; Evans, D.M.; French, R.A.; Parrish, J.; Phillips, T.B.; et al. Citizen science can improve conservation science, natural resource management, and environmental protection. Biol. Conserv. 2017, 208, 15–28. [Google Scholar] [CrossRef]
- Koedel, U.; Dietrich, P.; Herrmann, T.; Liang, C.; Ritter, O.; Roettenbacher, J.; Schuetze, F.M.; Schuetze, S.V.; Thoboell, J.; Schuetze, C. Enhancing Citizen Science Impact in Environmental Monitoring: Targeted Engagement Strategies with Stakeholder Groups. Front. Environ. Sci. 2024, 12, 1375675. [Google Scholar] [CrossRef]
- Vasiliades, M.A.; Hadjichambis, A.C.; Paraskeva-Hadjichambi, D.; Adamou, A.; Georgiou, Y.A. Systematic Literature Review on the Participation Aspects of Environmental and Nature-Based Citizen Science Initiatives. Sustainability 2021, 13, 7457. [Google Scholar] [CrossRef]
- Irwin, A. Citizen Science: A Study of People, Expertise, and Sustainable Development; Routledge: New York, NY, USA, 1995. [Google Scholar]
- Boldrini, E.; Nativi, S.; Hradec, J.; Santoro, M.; Mazzetti, P.; Craglia, M. GEOSS Platform data content and use. Int. J. Digit. Earth 2023, 16, 715–740. [Google Scholar] [CrossRef]
- Bonney, R.; Phillips, T.B.; Ballard, H.L.; Enck, J.W. Can citizen science enhance public understanding of science? Public Underst. Sci. 2016, 25, 2–16. [Google Scholar] [CrossRef]
- Miller-Rushing, A.J.; Primack, R.B.; Bonney, R. The history of public participation in ecological research. Front. Ecol. Environ. 2012, 10, 285–290. [Google Scholar] [CrossRef] [PubMed]
- Colon Robles, M.; Amos, H.M.; Dodson, J.B.; Bouwman, J.; Rogerson, T.; Bombosch, A.; Farmer, L.; Burdick, A.; Taylor, J.; Chambers, L.H. Clouds around the World: How a Simple Citizen Science Data Challenge Became a Worldwide Success. Bull. Am. Meteorol. Soc. 2020, 101, E1201–E1213. [Google Scholar] [CrossRef]
- Somerwill, L.; Wehn, U. How to measure the impact of citizen science on environmental attitudes, behaviour and knowledge? A review of state-of-the-art approaches. Environ. Sci. Eur. 2022, 34, 18. [Google Scholar] [CrossRef]


| Location | R2 | p-Value |
|---|---|---|
| Bolzaneto | 0.9624 | 2.2 × 10⁻¹⁶ |
| Comago | 0.9813 | 2.2 × 10⁻¹⁶ |
| IC Pegli Villarosa | 0.9232 | 2.2 × 10⁻¹⁶ |
| Pontedecimo | 0.9723 | 2.2 × 10⁻¹⁶ |
| Porto Antico | 0.7696 | 2.2 × 10⁻¹⁶ |
| Passo del Turchino | 0.9859 | 2.2 × 10⁻¹⁶ |
| Madonna delle Grazie | 0.9094 | 2.2 × 10⁻¹⁶ |
| Mele | 0.9702 | 2.2 × 10⁻¹⁶ |
| Rapallo | 0.7618 | 2.2 × 10⁻¹⁶ |
| Cavi di Lavagna | 0.8168 | 2.2 × 10⁻¹⁶ |
Disclaimer/Publisher’s Note: The statements, opinions and data contained in all publications are solely those of the individual author(s) and contributor(s) and not of MDPI and/or the editor(s). MDPI and/or the editor(s) disclaim responsibility for any injury to people or property resulting from any ideas, methods, instructions or products referred to in the content. |
© 2024 by the authors. Licensee MDPI, Basel, Switzerland. This article is an open access article distributed under the terms and conditions of the Creative Commons Attribution (CC BY) license (https://creativecommons.org/licenses/by/4.0/).
Share and Cite
Loglisci, N.; Milelli, M.; Iurato, J.; Galia, T.; Galizia, A.; Parodi, A. Validation of Citizen Science Meteorological Data: Can They Be Considered a Valid Help in Weather Understanding and Community Engagement? Sensors 2024, 24, 4598. https://doi.org/10.3390/s24144598
Loglisci N, Milelli M, Iurato J, Galia T, Galizia A, Parodi A. Validation of Citizen Science Meteorological Data: Can They Be Considered a Valid Help in Weather Understanding and Community Engagement? Sensors. 2024; 24(14):4598. https://doi.org/10.3390/s24144598
Chicago/Turabian StyleLoglisci, Nicola, Massimo Milelli, Juri Iurato, Timoteo Galia, Antonella Galizia, and Antonio Parodi. 2024. "Validation of Citizen Science Meteorological Data: Can They Be Considered a Valid Help in Weather Understanding and Community Engagement?" Sensors 24, no. 14: 4598. https://doi.org/10.3390/s24144598