
Influence of Gestational Age on Pelvic Floor Muscle Activity, Plantar Contact, and Functional Mobility in High-Risk Pregnant Women: A Cross-Sectional Study
 , , , ,
  and
and
Abstract
:1. Introduction
2. Materials and Methods
2.1. Ethical Aspects
2.2. Study Design
2.3. Setting and Period of Study
2.4. Population
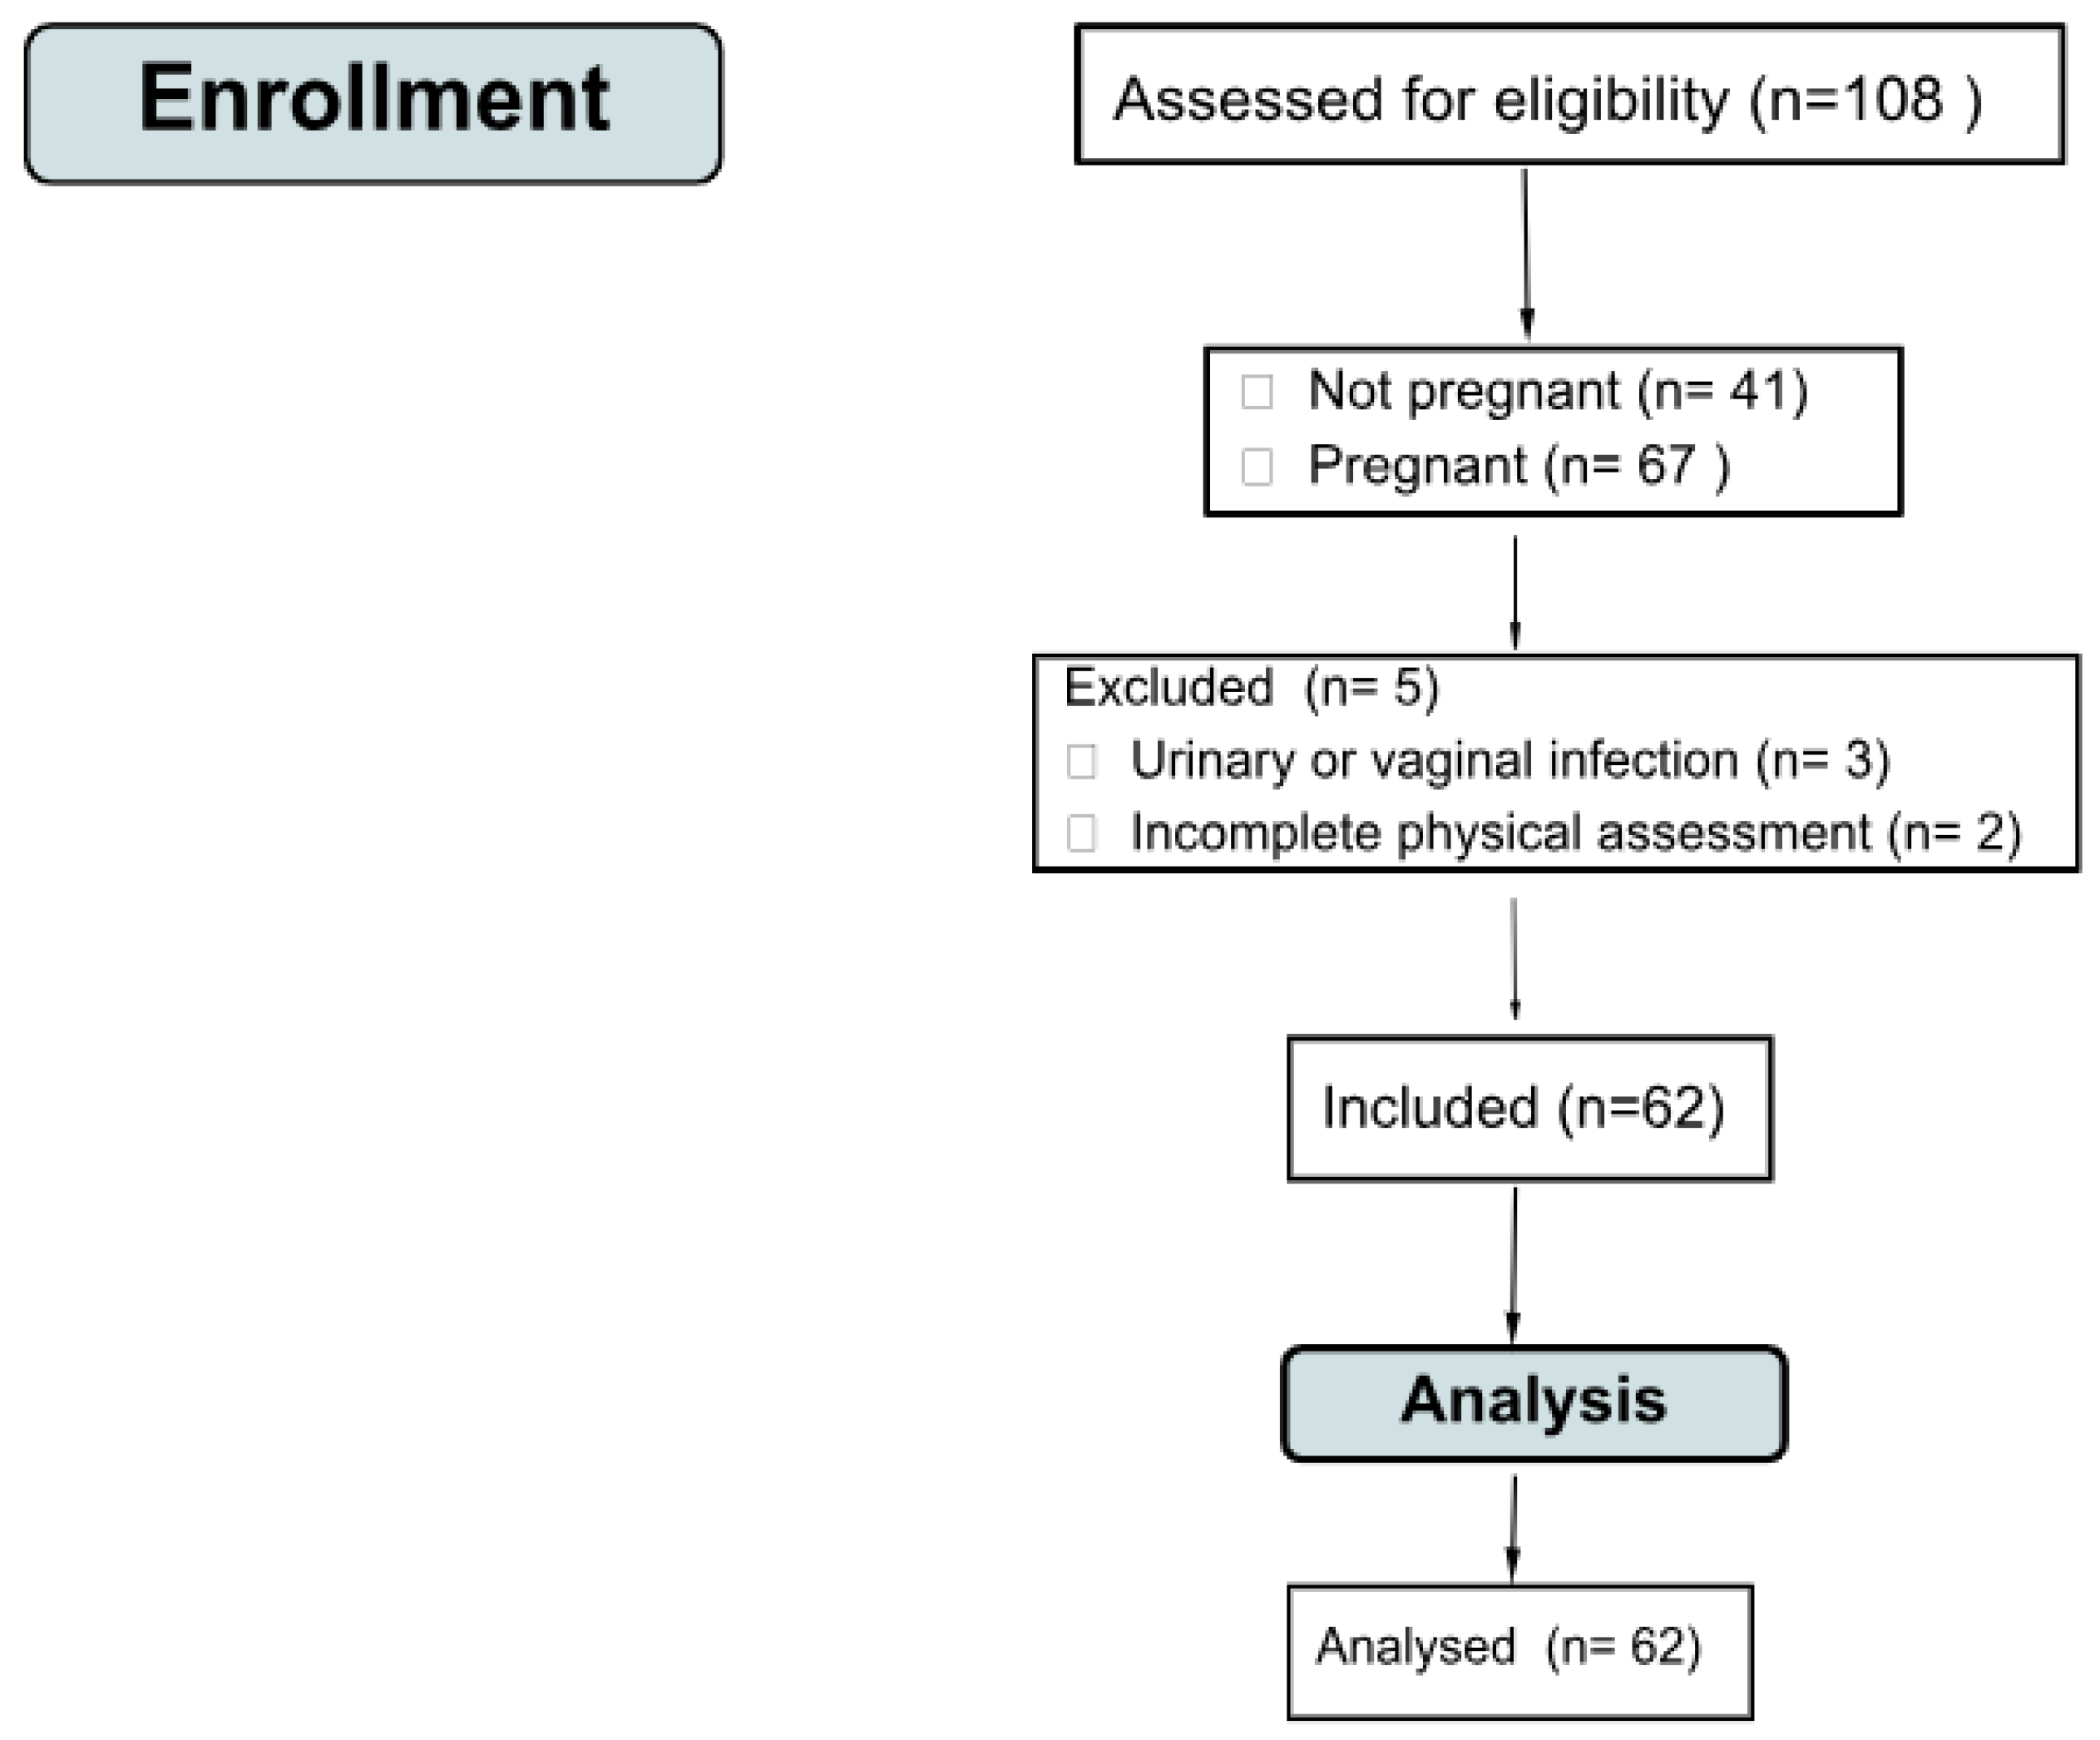
2.5. Sampling
2.6. Sample Size
2.7. Eligibility Criteria
2.8. Instruments and Variables
2.8.1. Socioeconomic Form
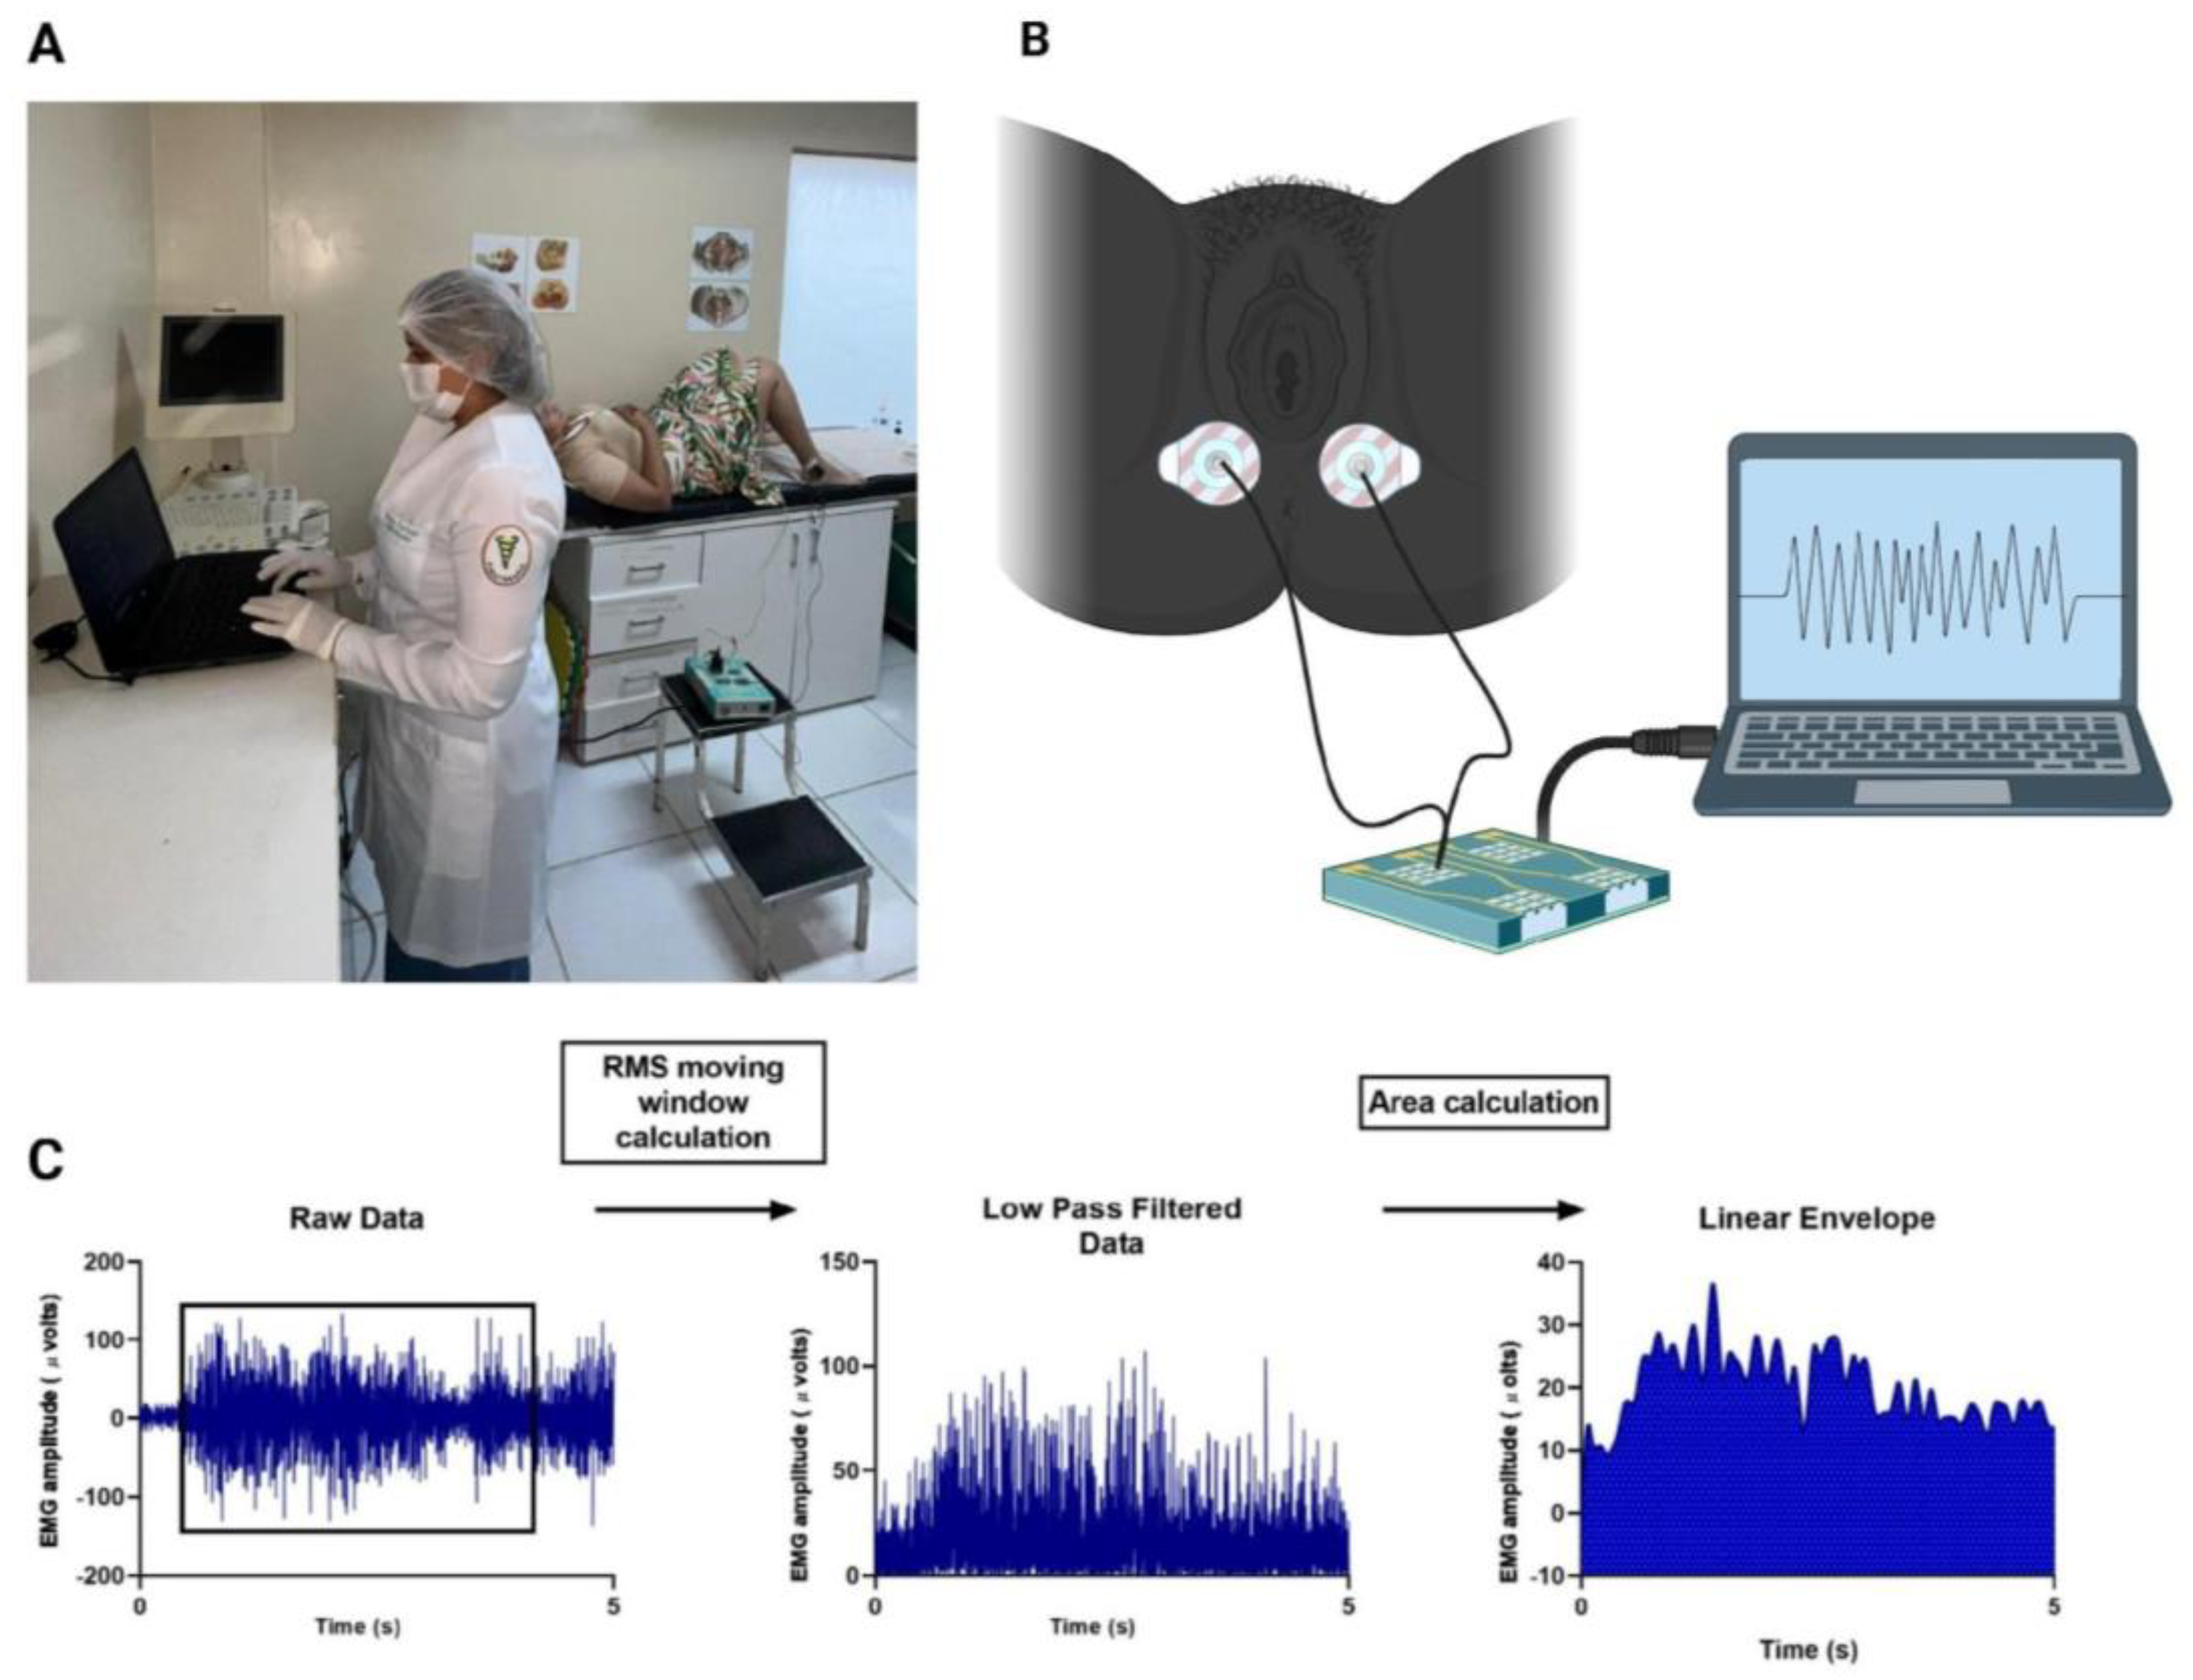
2.8.2. Surface Electromyography
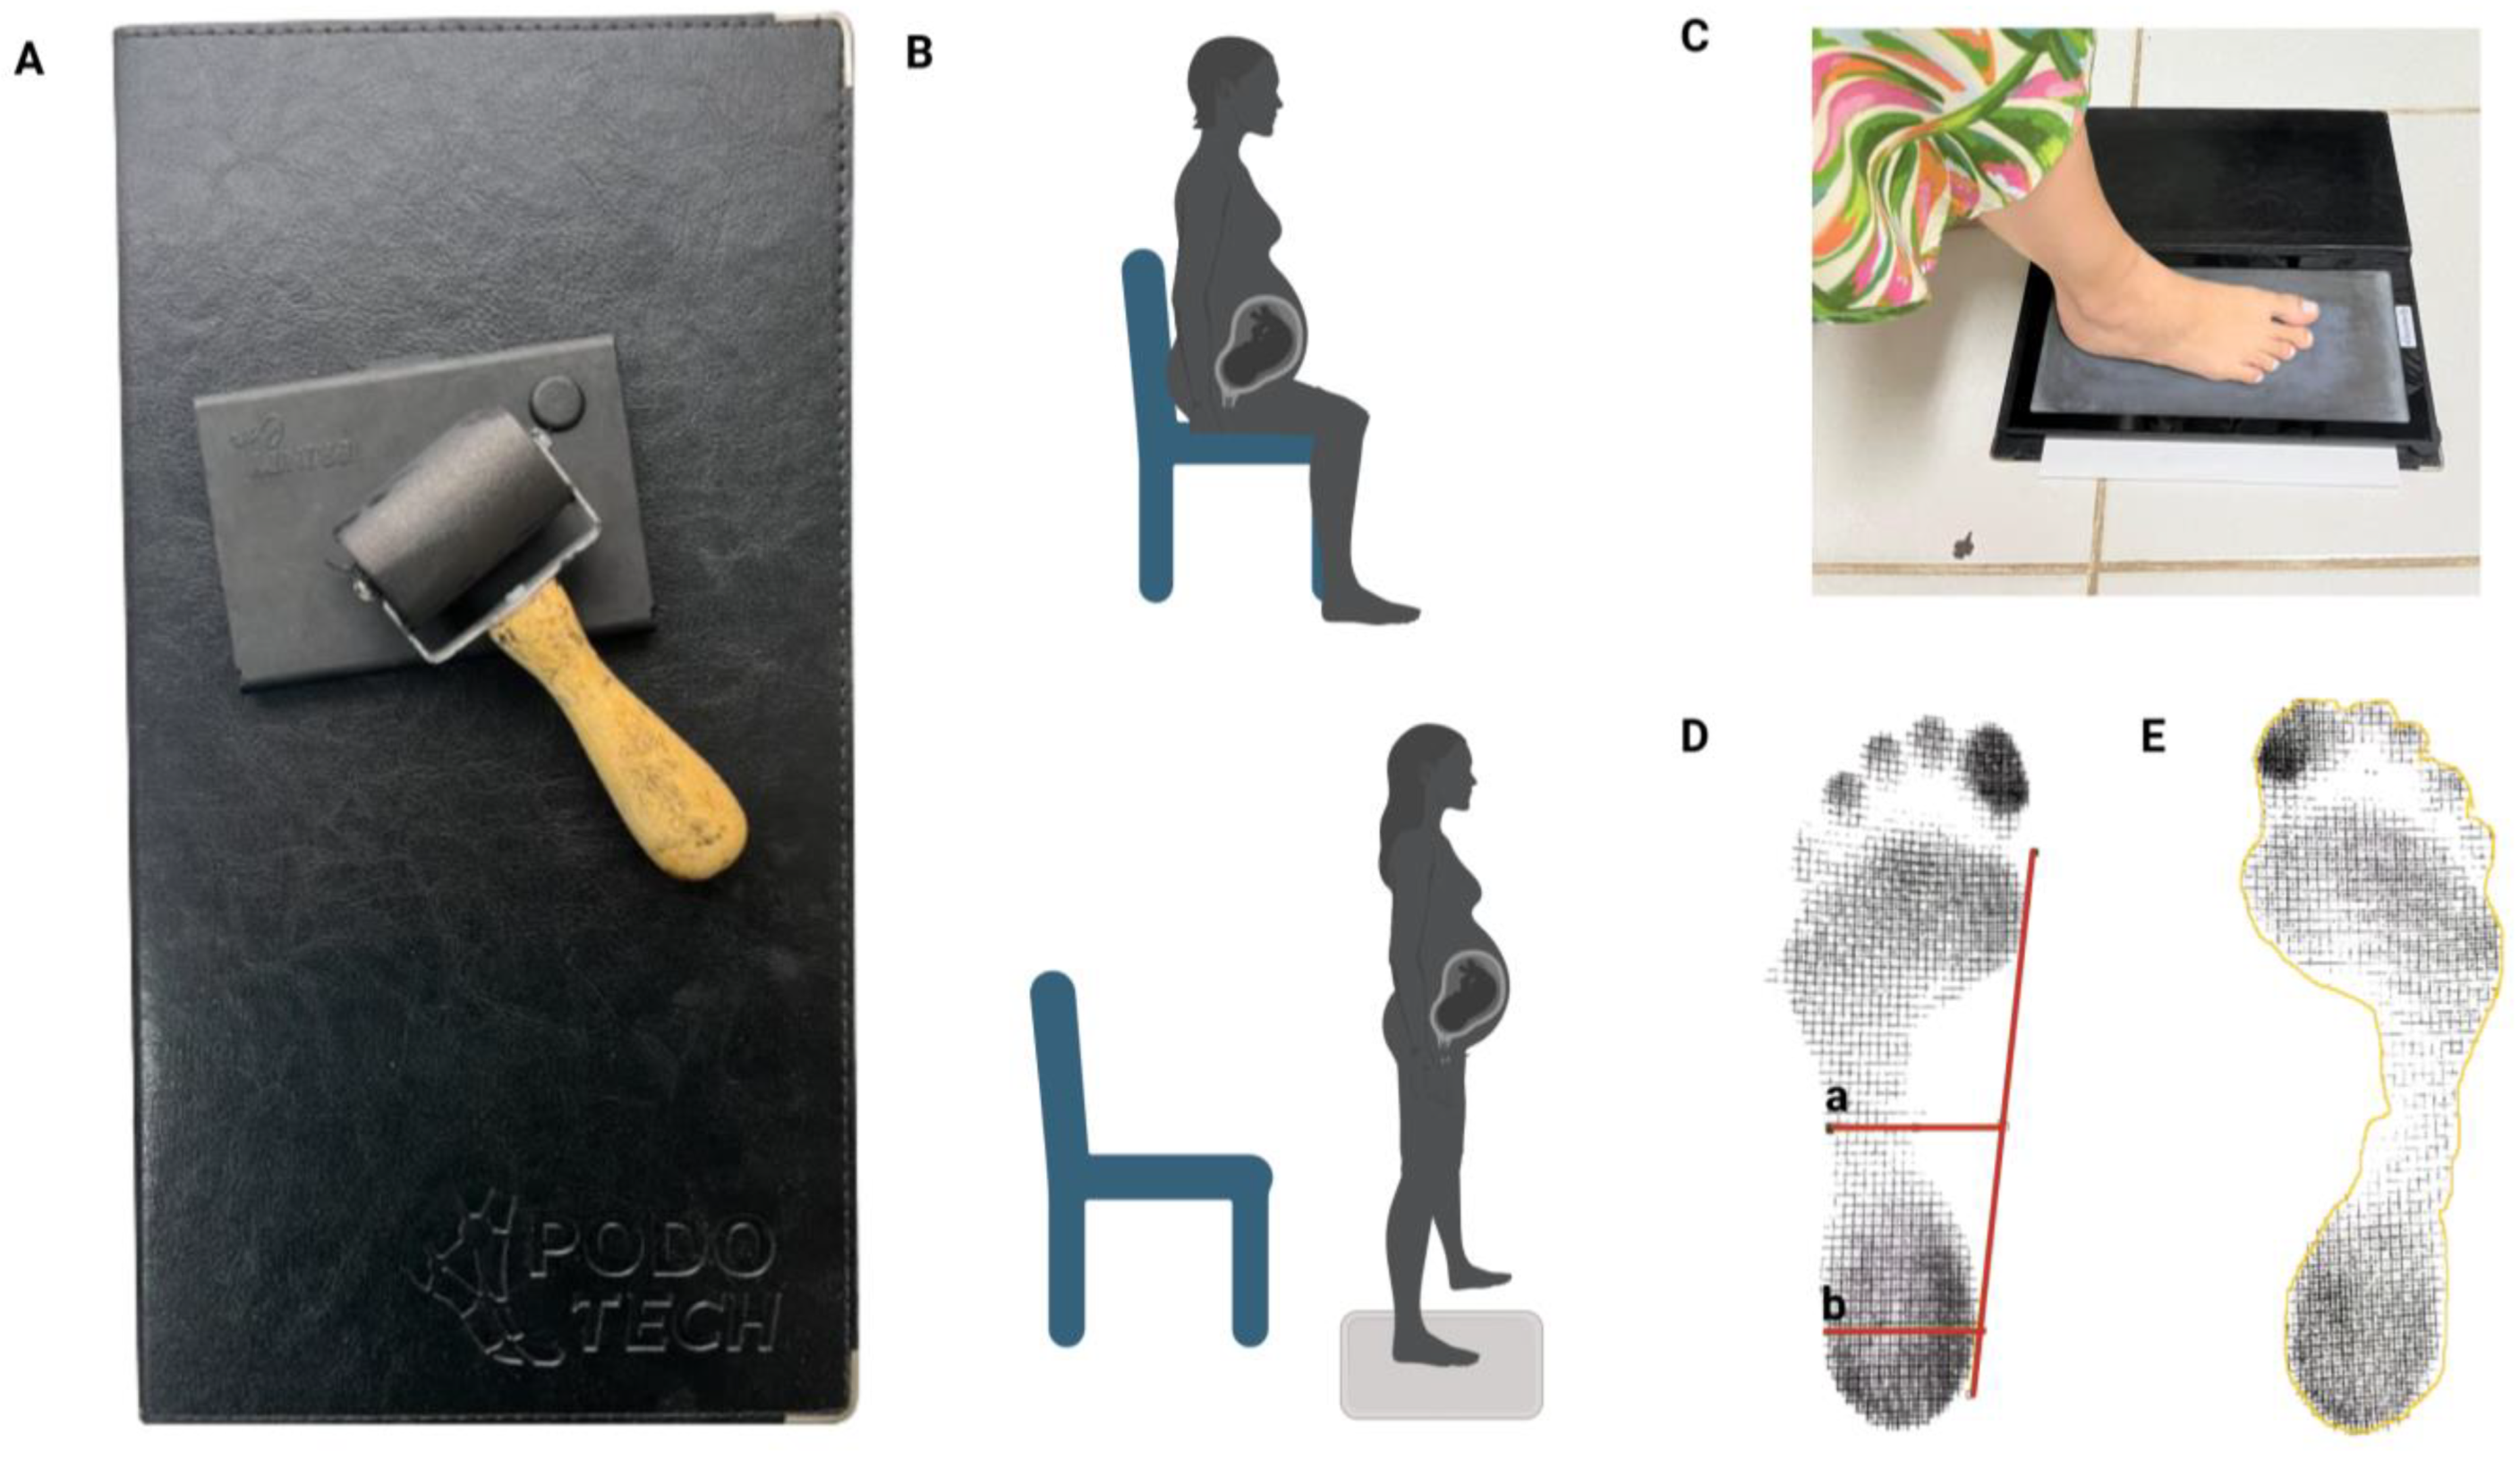
2.8.3. Plantigraphy
- The Staheli index was used to carry out the analysis because it was obtained by dividing the narrowest part of the isthmus by the value of a parallel at the widest part of the heel. The reference values used for evaluation are in the normal range of 0.6 to 0.69, while values greater than 0.69 indicate cavus feet, and values less than 0.6 indicate flat feet [6] (Figure 3D).
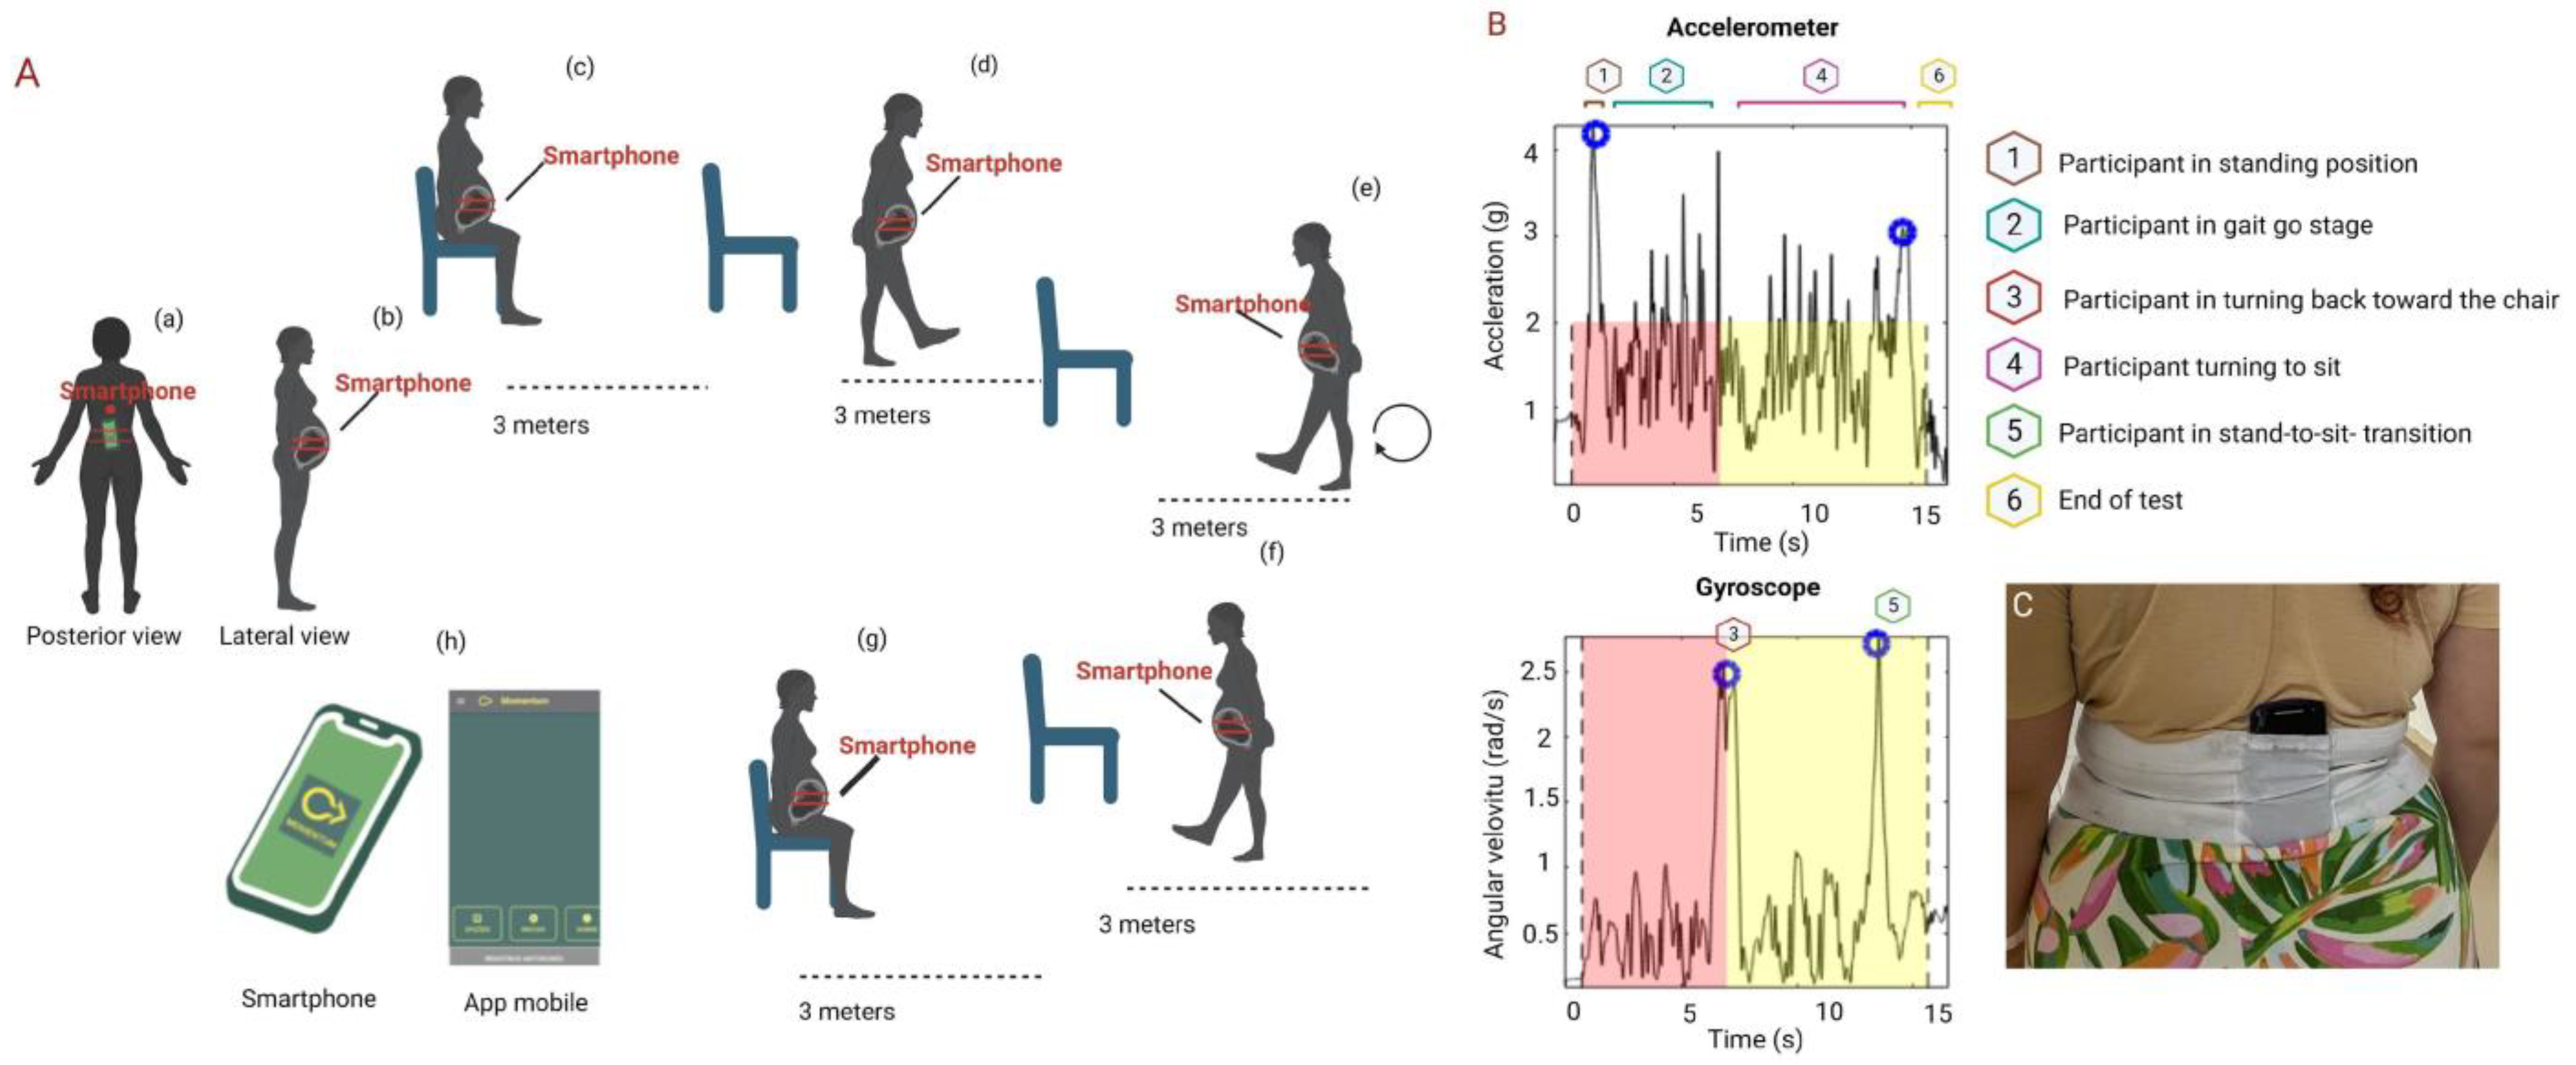
2.8.4. Inertial Sensors and Timed Up and Go Test
2.9. Data Processing
2.9.1. Bias
2.9.2. Statistical Analysis
3. Results
3.1. Myoelectric Activity of the Pelvic Floor Muscles
3.2. Plantar Contact
3.3. Functional Mobility
4. Discussion
5. Conclusions
Author Contributions
Funding
Institutional Review Board Statement
Informed Consent Statement
Data Availability Statement
Conflicts of Interest
References
- Conder, R.; Zamani, R.; Akrami, M. The Biomechanics of Pregnancy: A Systematic Review. J. Funct. Morphol. Kinesiol. 2019, 4, 72. [Google Scholar] [CrossRef]
- Alcahuz-Griñan, M.; Nieto-Gil, P.; Perez-Soriano, P.; Gijon-Nogueron, G. Morphological and Postural Changes in the Foot during Pregnancy and Puerperium: A Longitudinal Study. Int. J. Environ. Res. Public Health 2021, 18, 2423. [Google Scholar] [CrossRef]
- Miranda, L.A.; de Moura, A.C.R.; Kasawara, K.T.; Surita, F.G.; Moreira, M.A.; do Nascimento, S.L. Exercise and Physical Activity Levels and Associated Factors among High-Risk Pregnant Women. Fatores associados com o nível de atividade física e a prática de exercício em gestantes de alto risco. Rev. Bras. Ginecol. Obstet. 2022, 44, 360–368. [Google Scholar] [CrossRef]
- Stegman, M.M.; Lucarelli-Baldwin, E.; Ural, S.H. Disparities in high risk prenatal care adherence along racial and ethnic lines. Front. Glob. Womens Health 2023, 4, 1151362. [Google Scholar] [CrossRef]
- Mann, L.; Kleinpaul, J.F.; Mota, C.B.; dos Santos, S.G. Alterações biomecânicas durante o período gestacional: Uma revisão. Mot. Rev. Educ. Fis. 2010, 16, 730–741. [Google Scholar] [CrossRef]
- Gonzalez-Martin, C.; Fernandez-Lopez, U.; Mosquera-Fernandez, A.; Balboa-Barreiro, V.; Garcia-Rodriguez, M.T.; Seijo-Bestilleiro, R.; Veiga-Seijo, R. Concordance between Pressure Platform and Pedigraph. Diagnostics 2021, 11, 2322. [Google Scholar] [CrossRef]
- Hernandez, A.J.; Kimura, L.K.; Laraya, M.H.F.; Fávaro, E. Cálculo do índice do arco plantar de staheli e a prevalência de pés planos: Estudo em 100 crianças entre 5 e 9 anos de idade. Acta Ortop. Bras. 2007, 15, 68–71. [Google Scholar] [CrossRef]
- Forczek, W.; Ivanenko, Y.P.; Bielatowicz, J.; Wacławik, K. Gait assessment of the expectant mothers—Systematic review. Gait Posture 2018, 62, 7–19. [Google Scholar] [CrossRef]
- Bertuit, J.; Leyh, C.; Rooze, M.; Feipel, V. Plantar Pressure during Gait in Pregnant Women. J. Am. Podiatr. Med. Assoc. 2016, 106, 398–405. [Google Scholar] [CrossRef]
- Gijon-Nogueron, G.A.; Gavilan-Diaz, M.; Valle-Funes, V.; Jimenez-Cebrian, A.M.; Cervera-Marin, J.A.; Morales-Asencio, J.M. Anthropometric foot changes during pregnancy: A pilot study. J. Am. Podiatr. Med. Assoc. 2013, 103, 314–321. [Google Scholar] [CrossRef]
- Masłoń, A.; Suder, A.; Curyło, M.; Frączek, B.; Salamaga, M.; Ivanenko, Y.; Forczek-Karkosz, W. Influence of pregnancy related anthropometric changes on plantar pressure distribution during gait—A follow-up study. PLoS ONE 2022, 17, e0264939. [Google Scholar] [CrossRef] [PubMed]
- Mei, Q.; Gu, Y.; Fernandez, J. Alterations of Pregnant Gait during Pregnancy and Post-Partum. Sci. Rep. 2018, 8, 2217. [Google Scholar] [CrossRef]
- Dubey, L.; Karthikbabu, S.; Mohan, D. Effects of Pelvic Stability Training on Movement Control, Hip Muscles Strength, Walking Speed and Daily Activities after Stroke: A Randomized Controlled Trial. Ann. Neurosci. 2018, 25, 80–89. [Google Scholar] [CrossRef]
- Hungerford, B.; Gilleard, W.; Lee, D. Altered patterns of pelvic bone motion determined in subjects with posterior pelvic pain using skin markers. Clin. Biomech. 2004, 19, 456–464. [Google Scholar] [CrossRef] [PubMed]
- Romero-Gallardo, L.; Roldan Reoyo, O.; Castro-Piñero, J.; May, L.E.; Ocón-Hernández, O.; Mottola, M.F.; Aparicio, V.A.; Soriano-Maldonado, A. Assessment of physical fitness during pregnancy: Validity and reliability of fitness tests, and relationship with maternal and neonatal health—A systematic review. BMJ Open Sport. Exerc. Med. 2022, 8, e001318. [Google Scholar] [CrossRef] [PubMed]
- Evensen, N.M.; Kvåle, A.; Brækken, I.H. Convergent validity of the Timed Up and Go Test and Ten-meterre Timed Walk Test in pregnant women with pelvic girdle pain. Man. Ther. 2016, 21, 94–99. [Google Scholar] [CrossRef]
- Christensen, L.; Vøllestad, N.K.; Veierød, M.B.; Stuge, B.; Cabri, J.; Robinson, H.S. The Timed up & Go test in pregnant women with pelvic girdle pain compared to asymptomatic pregnant and nonnon-pregnant women. Musculoskelet. Sci. Pract. 2019, 43, 110–116. [Google Scholar] [CrossRef]
- Ponciano, V.; Pires, I.M.; Ribeiro, F.R.; Spinsante, S. Sensors are Capable to Help in the Measurement of the Results of the Timed-Up and Go Test? A Systematic Review. J. Med. Syst. 2020, 44, 199. [Google Scholar] [CrossRef]
- Fontana Carvalho, A.P.; Dufresne, S.S.; Rogerio de Oliveira, M.; Couto Furlanetto, K.; Dubois, M.; Dallaire, M.; Ngomo, S.; da Silva, R.A. Effects of lumbar stabilization and muscular stretching on pain, disabilities, postural control and muscle activation in pregnant woman with low back pain. Eur. J. Phys. Rehabil. Med. 2020, 56, 297–306. [Google Scholar] [CrossRef]
- Nagai, M.; Isida, M.; Saitoh, J.; Hirata, Y.; Natori, H.; Wada, M. Characteristics of the control of standing posture during pregnancy. Neurosci. Lett. 2009, 462, 130–134. [Google Scholar] [CrossRef] [PubMed]
- Ribeiro, S.O.; de Sousa, V.P.S.; Viana, E.d.S.R. Influence of a virtual reality-based exercise protocol on the sit-to-stand activity kinematic variables in pregnant women: A randomized controlled trial. Motriz Rev. Educ. Fis. 2017, 23, e101757. [Google Scholar] [CrossRef]
- Gachon, B.; Desseauve, D.; Fradet, L.; Decatoire, A.; Lacouture, P.; Pierre, F.; Fritel, X. Modifications de la statique pelvienne et de la laxité ligamentaire pendant la grossesse et le postpost-partum. Revue de la littérature et perspectives. Prog. Urol. J. L’assoc. Fr. D’urologie Soc. Fr. D’urologie 2016, 26, 385–394. [Google Scholar] [CrossRef]
- Vleeming, A.; Albert, H.B.; Ostgaard, H.C.; Sturesson, B.; Stuge, B. European guidelines for the diagnosis and treatment of pelvic girdle pain. Eur. Spine J. 2008, 17, 794–819. [Google Scholar] [CrossRef]
- Peinado-Molina, R.A.; Hernández-Martínez, A.; Martínez-Vázquez, S.; Rodríguez-Almagro, J.; Martínez-Galiano, J.M. Pelvic floor dysfunction: Prevalence and associated factors. BMC Public Health 2023, 23, 2005. [Google Scholar] [CrossRef] [PubMed]
- Chmielewska, D.; Stania, M.; Kucab-Klich, K.; Błaszczak, E.; Kwaśna, K.; Smykla, A.; Hudziak, D.; Dolibog, P. Electromyographic characteristics of pelvic floor muscles in women with stress urinary incontinence following sEMG-assisted biofeedback training and Pilates exercises. PLoS ONE 2019, 14, e0225647. [Google Scholar] [CrossRef] [PubMed] [PubMed Central]
- Zhang, H.; Gou, Y.; Zhang, J.; Liang, K.; Li, H.; Fang, Y. Analysis of pelvic floor electromyography in women screened 42 days postpartum: A cross-sectional study. Medicine 2023, 102, e33851. [Google Scholar] [CrossRef] [PubMed] [PubMed Central]
- Resende, A.P.M.; Petricelli, C.D.; Bernardes, B.T.; Alexandre, S.M.; Nakamura, M.U.; Zanetti, M.R.D. Electromyographic evaluation of pelvic floor muscles in pregnant and nonpregnant women. Int. Urogynecol. J. 2012, 23, 1041–1045. [Google Scholar] [CrossRef]
- Duarte, N.d.S.; Bittencourt, K.C.; Soares, C.O.; Ferreira, C.R.G.; Soares, W.M.; Tavares, V.B.; da Silva, A.S.A.; Priante, C.H.d.C.; das Neves, P.F.M.; Souza, G.d.S.; et al. Sexual Function, Physical Activity, Mean Amplitudes and Maximal Voluntary Contraction of Pelvic Floor Muscles Are Related to Handgrip Strength: A Cross-Sectional Study. Healthcare 2023, 11, 129. [Google Scholar] [CrossRef] [PubMed]
- Szyszka-Sommerfeld, L.; Lipski, M.; Woźniak, K. Surface Electromyography as a Method for Diagnosing Muscle Function in Patients with Congenital Maxillofacial Abnormalities. J. Healthc. Eng. 2020, 2020, 8846920. [Google Scholar] [CrossRef]
- Bertotto, A. Perfil Eletromiográfico do Assoalho Pélvico em Mulheres Menopausadas com Incontinência Urinária de Esforço e Mista. 2021. Available online: www.lume.ufrgs.br (accessed on 2 November 2022).
- Duarte, N.S.; Azevedo, Y.S.; Furtado, E.C.S.; Araújo, L.J.F.; Bendelack, R.M.; Rodrigues, C.N.C.; Araujo, N.d.S.; das Neves, P.F.M.; Soares, A.C.N.; Barros, R.C.; et al. Electromyographic activity of pelvic floor muscles in different positions during the use an innovative vaginal educator: Cross-sectional study. PLoS ONE 2024, 19, e0291588. [Google Scholar] [CrossRef]
- Szumilewicz, A.; Kuchta, A.; Kranich, M.; Dornowski, M.; Jastrzębski, Z. Prenatal high-low impact exercise program supported by pelvic floor muscle education and training decreases the life impact of postnatal urinary incontinence: A quasiexperimental trial. Medicine 2020, 99, e18874. [Google Scholar] [CrossRef]
- Petricelli, C.D.; Resende, A.P.; Elito Júnior, J.; Júnior, E.A.; Alexandre, S.M.; Zanetti, M.R.; Nakamura, M.U. Distensibility and strength of the pelvic floor muscles of women in the third trimester of pregnancy. BioMed Res. Int. 2014, 2014, 437867. [Google Scholar] [CrossRef]
- Barros Filho, T.E.P.; Lech, O. Exame Físico em Ortopedia, 3rd ed.; Sarvier: São Paulo, Spain, 2017; 409p. [Google Scholar]
- Di Giorgio, A.C.; de Montes, J.N.H.; Thomé, G.R.; Cyrillo, F.N.; Castelo, L.d.A. Relação Entre Baropodometria, Podoscopia e Plantigrafia na Avaliação da Impressão Plantar [Internet]. Repositório Digital UNI.P. Available online: https://repositorio.unip.br/journal-of-the-health-sciences-institute-revista-do-instituto-de-ciencias-da-saude/relacao-entre-baropodometria-podoscopia-e-plantigrafia-na-avaliacao-da-impressao-plantar/ (accessed on 3 June 2024).
- Stroppa-Marques, A.E.Z.; Neto, J.S.M.; Pedroni, C.R.; Tozim, B.M.; Chagas, E.F.B.; Navega, F.R.F.; Navega, M.T. Plantar Myofascial Mobilization: Plantar Area, Functional Mobility, and Balance in Elderly Women: A Randomized Clinical Trial. J. Manip. Physiol. Ther. 2020, 43, 539–550. [Google Scholar] [CrossRef] [PubMed]
- Corrêa, B.D.C.; Santos, E.G.R.; Belgamo, A.; Pinto, G.H.L.; Xavier, S.S.; Silva, C.C.; Dias, R.N.; Paranhos, A.C.M.; Cabral, A.d.S.; Callegari, B.; et al. Smartphone-based evaluation of static balance and mobility in long-lasting COVID-19 patients. Front. Neurol. 2023, 14, 1277408. [Google Scholar] [CrossRef] [PubMed]
- Stroeder, R.; Radosa, J.; Clemens, L.; Gerlinger, C.; Schmidt, G.; Sklavounos, P.; Takacs, Z.; Meyberg-Solomayer, G.; Solomayer, E.-F.; Hamza, A. Urogynecology in obstetrics: Impact of pregnancy and delivery on pelvic floor disorders, a prospective longitudinal observational pilot study. Arch. Gynecol. Obstet. 2021, 304, 401–408. [Google Scholar] [CrossRef] [PubMed]
- Routzong, M.R.; Rostaminia, G.; Moalli, P.A.; Abramowitch, S.D. Pelvic floor shape variations during pregnancy and after vaginal delivery. Comput. Methods Programs Biomed. 2020, 194, 105516. [Google Scholar] [CrossRef]
- Lakovschek, I.C.; Trutnovsky, G.; Obermayer-Pietsch, B.; Gold, D. Longitudinal Study of Pelvic Floor Characteristics Before, During, and after Pregnancy in Nulliparous Women. J. Ultrasound Med. 2022, 41, 147–155. [Google Scholar] [CrossRef]
- Moccellin, A.S.; Rett, M.T.; Driusso, P. Existe alteração na função dos músculos do assoalho pélvico e abdominais de primigestas no segundo e terceiro trimestre gestacional? Fisioter Pesqui. 2016, 23, 136–141. [Google Scholar] [CrossRef]
- Prudencio, C.B.; Nunes, S.K.; Pinheiro, F.A.; Sartorão Filho, C.I.; Nava, G.T.d.A.; Salomoni, S.E.; Pedroni, C.R.; Rudge, M.V.C.; Barbosa, A.M.P.; Diamater Study Group. Gestational diabetes is associated with alteration on pelvic floor muscle activation pattern during pregnancy and postpartum: Prospective cohort using electromyography assessment. Front. Endocrinol. 2022, 13, 958909. [Google Scholar] [CrossRef]
- Escalona-Vargas, D.; Oliphant, S.; Eswaran, H. Magnetomyographic Recordings of Pelvic Floor Activity During Pregnancy and Postpartum: A Novel NonNon-invasive Approach. Annu. Int. Conf. IEEE Eng. Med. Biol. Soc. 2019, 2019, 1855–1858. [Google Scholar] [CrossRef]
- Botelho, S.; Pereira, L.C.; Marques, J.; Lanza, A.H.; Amorim, C.F.; Palma, P.; Riccetto, C. Is there correlation between electromyography and digital palpation as means of measuring pelvic floor muscle contractility in nulliparous, pregnant, and postpartum women? Neurourol. Urodyn. 2013, 32, 420–423. [Google Scholar] [CrossRef] [PubMed]
- Sung, J.H.; Baek, S.H.; Park, J.W.; Rho, J.H.; Kim, B.J. Surface Electromyography-Driven Parameters for Representing Muscle Mass and Strength. Sensors 2023, 23, 5490. [Google Scholar] [CrossRef] [PubMed]
- Pereira-Baldon, V.S.; de Oliveira, A.B.; Padilha, J.F.; Degani, A.M.; Avila, M.A.; Driusso, P. Reliability of different electromyographic normalization methods for pelvic floor muscles assessment. Neurourol. Urodyn. 2020, 39, 1145–1151. [Google Scholar] [CrossRef] [PubMed]
- Gaymer, C.; Whalley, H.; Achten, J.; Vatish, M.; Costa, M.L. Midfoot plantar pressure significantly increases during late gestation. Foot 2009, 19, 114–116. [Google Scholar] [CrossRef] [PubMed]
- Catena, R.D.; Bailey, J.P.; Campbell, N.; Stewart, B.C.; Marion, S.J. Correlations between joint kinematics and dynamic balance control during gait in pregnancy. Gait Posture 2020, 80, 106–112. [Google Scholar] [CrossRef] [PubMed]
- Cakmak, B.; Ribeiro, A.P.; Inanir, A. Postural balance and the risk of falling during pregnancy. J. Matern. Fetal Neonatal Med. 2016, 29, 1623–1625. [Google Scholar] [CrossRef] [PubMed]
- Nascimento, A.Q.; Nagata, L.A.R.; Almeida, M.T.; da Silva Costa, V.L.; de Marin, A.B.R.; Tavares, V.B.; Ishak, G.; Callegari, B.; Santos, E.G.R.; Souza, G.d.S.; et al. Smartphone-based inertial measurements during Chester step test as a predictor of length of hospital stay in abdominopelvic cancer postoperative period: A prospective cohort study. World J. Surg. Oncol. 2024, 22, 71. [Google Scholar] [CrossRef]
- Inoue-Hirakawa, T.; Ito, A.; Iguchi, S.; Watanabe, H.; Kato, C.; Sugiura, H.; Suzuki, S. The effect of simulated gestational weight gain on balance, gait, and fear of falling. Nagoya J. Med. Sci. 2021, 83, 41–49. [Google Scholar] [CrossRef]


| N = 62 | % | |
|---|---|---|
| Race/skin color | ||
| Black | 4 | 6.5 |
| Brown | 44 | 71 |
| White | 11 | 17.7 |
| Yellow | 2 | 3.2 |
| Uninformed | 1 | 1.6 |
| Marital status | ||
| Married | 41 | 66.1 |
| Single | 20 | 32.3 |
| Uninformed | 1 | 1.6 |
| Education (years) | ||
| 1 to 4 | 2 | 3.2 |
| 5 to 9 | 18 | 29.1 |
| 10 to 12 | 33 | 53.2 |
| >12 | 8 | 12.9 |
| Uninformed | 1 | 1.6 |
| Family income | ||
| No income | 3 | 4.8 |
| <1 | 25 | 40.3 |
| 1 to 3 | 25 | 40.3 |
| 4 to 6 | 6 | 9.7 |
| 7 to 9 | 2 | 3.2 |
| Uninformed | 1 | 1.6 |
Disclaimer/Publisher’s Note: The statements, opinions and data contained in all publications are solely those of the individual author(s) and contributor(s) and not of MDPI and/or the editor(s). MDPI and/or the editor(s) disclaim responsibility for any injury to people or property resulting from any ideas, methods, instructions or products referred to in the content. |
© 2024 by the authors. Licensee MDPI, Basel, Switzerland. This article is an open access article distributed under the terms and conditions of the Creative Commons Attribution (CC BY) license (https://creativecommons.org/licenses/by/4.0/).
Share and Cite
Furtado, E.C.S.; Azevedo, Y.S.D.; Galhardo, D.d.R.; Miranda, I.P.C.; Oliveira, M.E.C.; das Neves, P.F.M.; Monte, L.B.; Carneiro Nunes, E.F.; Ferreira, E.A.G.; Callegari, B.; et al. Influence of Gestational Age on Pelvic Floor Muscle Activity, Plantar Contact, and Functional Mobility in High-Risk Pregnant Women: A Cross-Sectional Study. Sensors 2024, 24, 4615. https://doi.org/10.3390/s24144615
Furtado ECS, Azevedo YSD, Galhardo DdR, Miranda IPC, Oliveira MEC, das Neves PFM, Monte LB, Carneiro Nunes EF, Ferreira EAG, Callegari B, et al. Influence of Gestational Age on Pelvic Floor Muscle Activity, Plantar Contact, and Functional Mobility in High-Risk Pregnant Women: A Cross-Sectional Study. Sensors. 2024; 24(14):4615. https://doi.org/10.3390/s24144615
Chicago/Turabian StyleFurtado, Emilly Cássia Soares, Yury Souza De Azevedo, Deizyane dos Reis Galhardo, Iasmin Pereira Cabral Miranda, Maria Eunice Chagas Oliveira, Pablo Fabiano Moura das Neves, Lindinalva Brasil Monte, Erica Feio Carneiro Nunes, Elizabeth Alves Gonçalves Ferreira, Bianca Callegari, and et al. 2024. "Influence of Gestational Age on Pelvic Floor Muscle Activity, Plantar Contact, and Functional Mobility in High-Risk Pregnant Women: A Cross-Sectional Study" Sensors 24, no. 14: 4615. https://doi.org/10.3390/s24144615