
Exploring Spectrogram-Based Audio Classification for Parkinson’s Disease: A Study on Speech Classification and Qualitative Reliability Verification


Abstract
1. Introduction
2. Related Works
2.1. Deep Learning-Based Speech Classification Research
2.2. EXplainable AI (XAI)
3. Methods
3.1. Data Preprocessing
3.2. Model Training
3.3. XAI
4. Experiments and Results
4.1. Quantitative Classification Model Evaluation
4.1.1. Evaluation Metrics
4.1.2. Model Performance Comparison
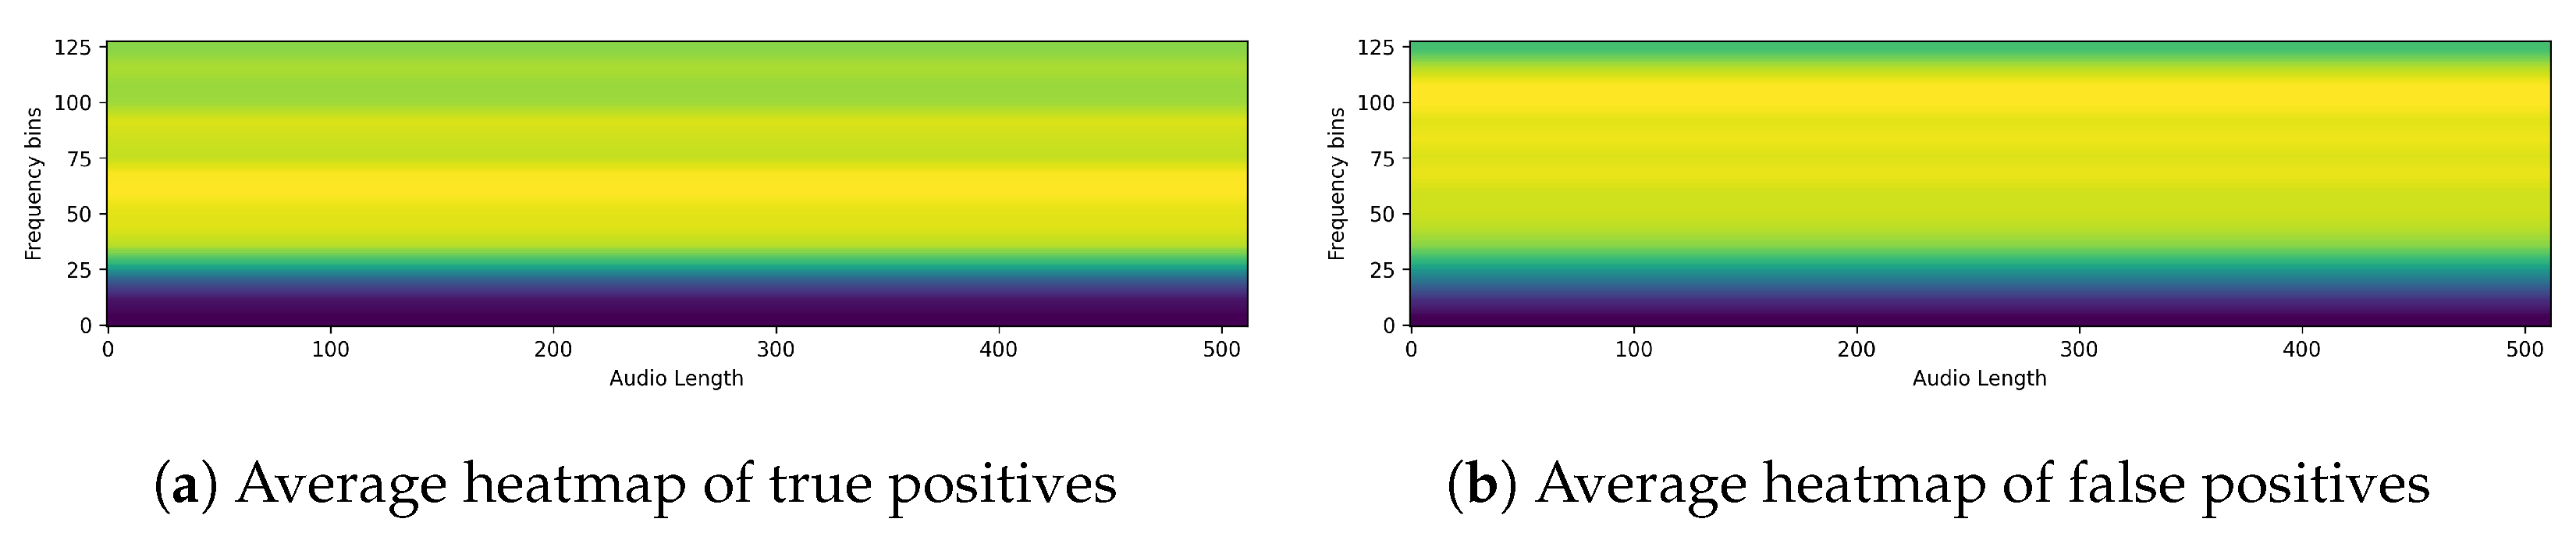
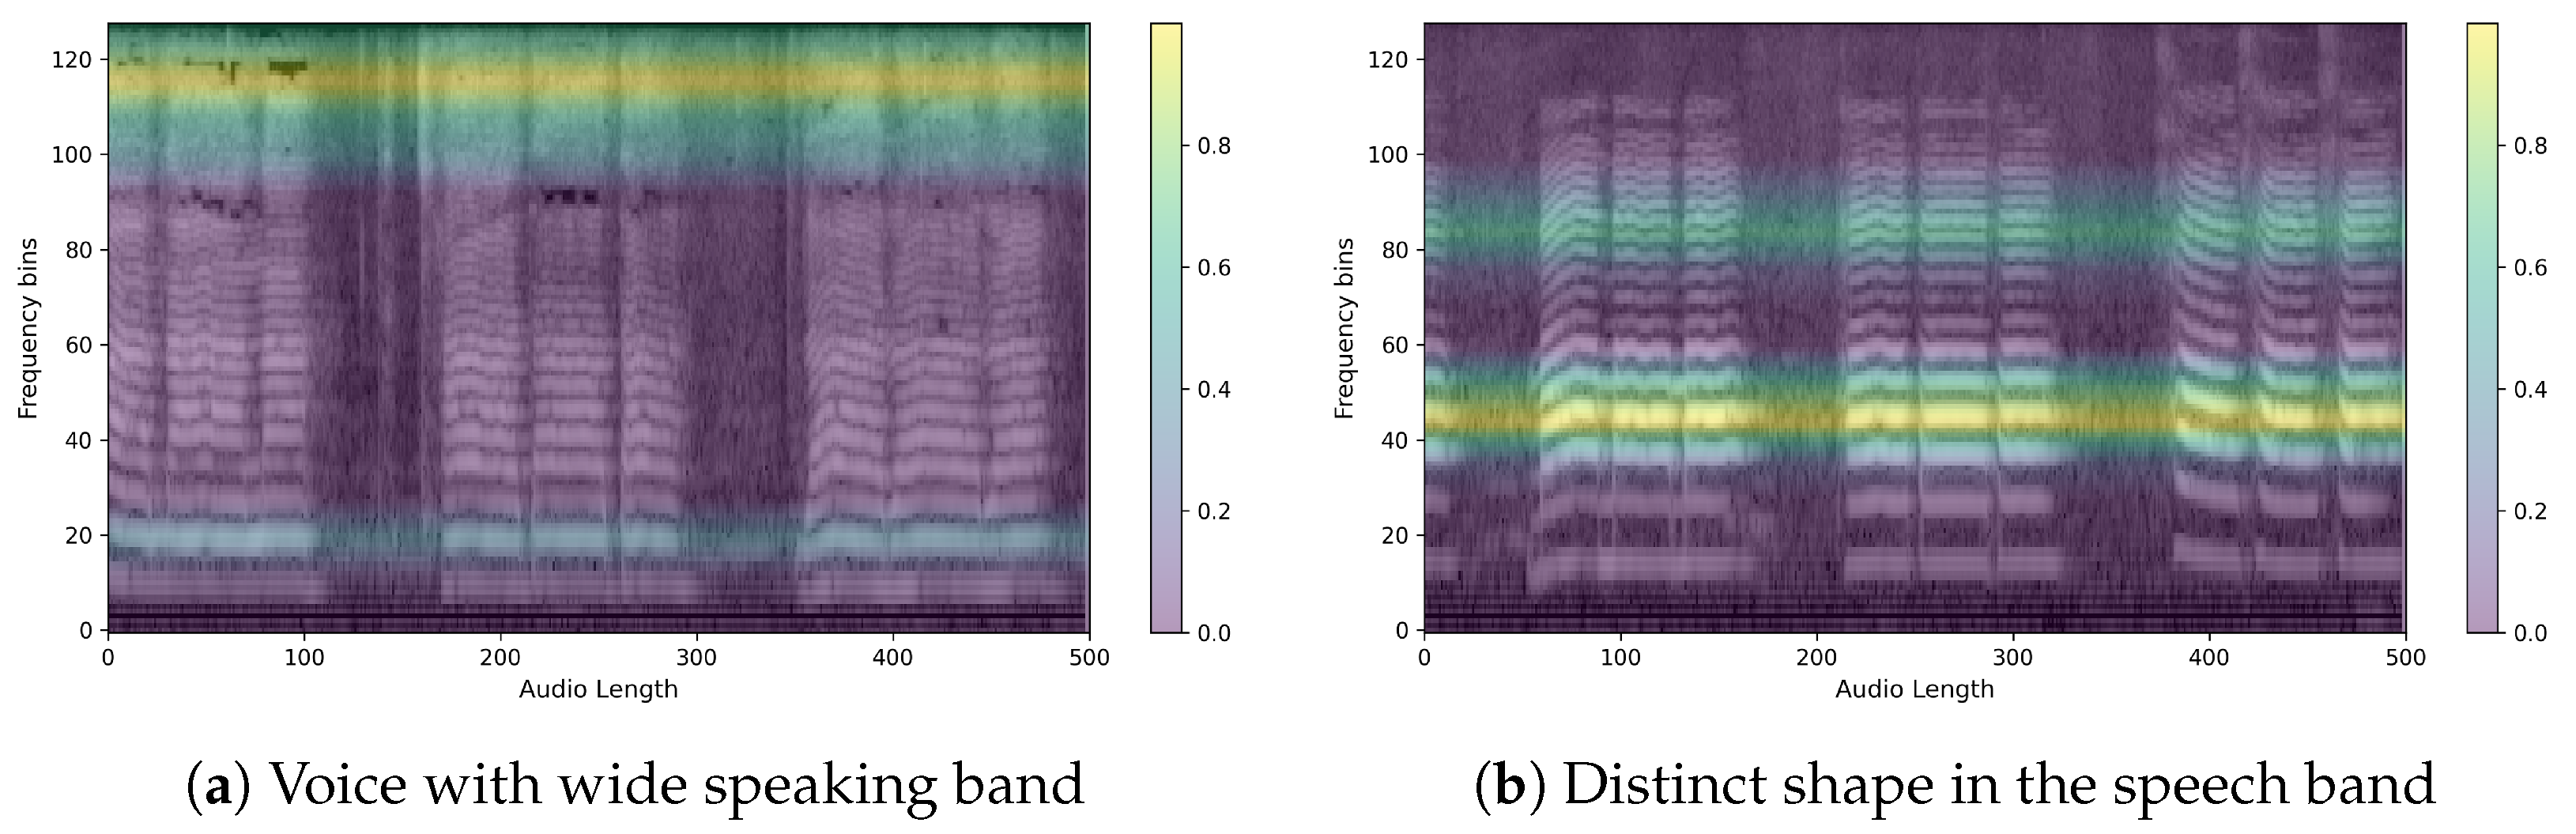
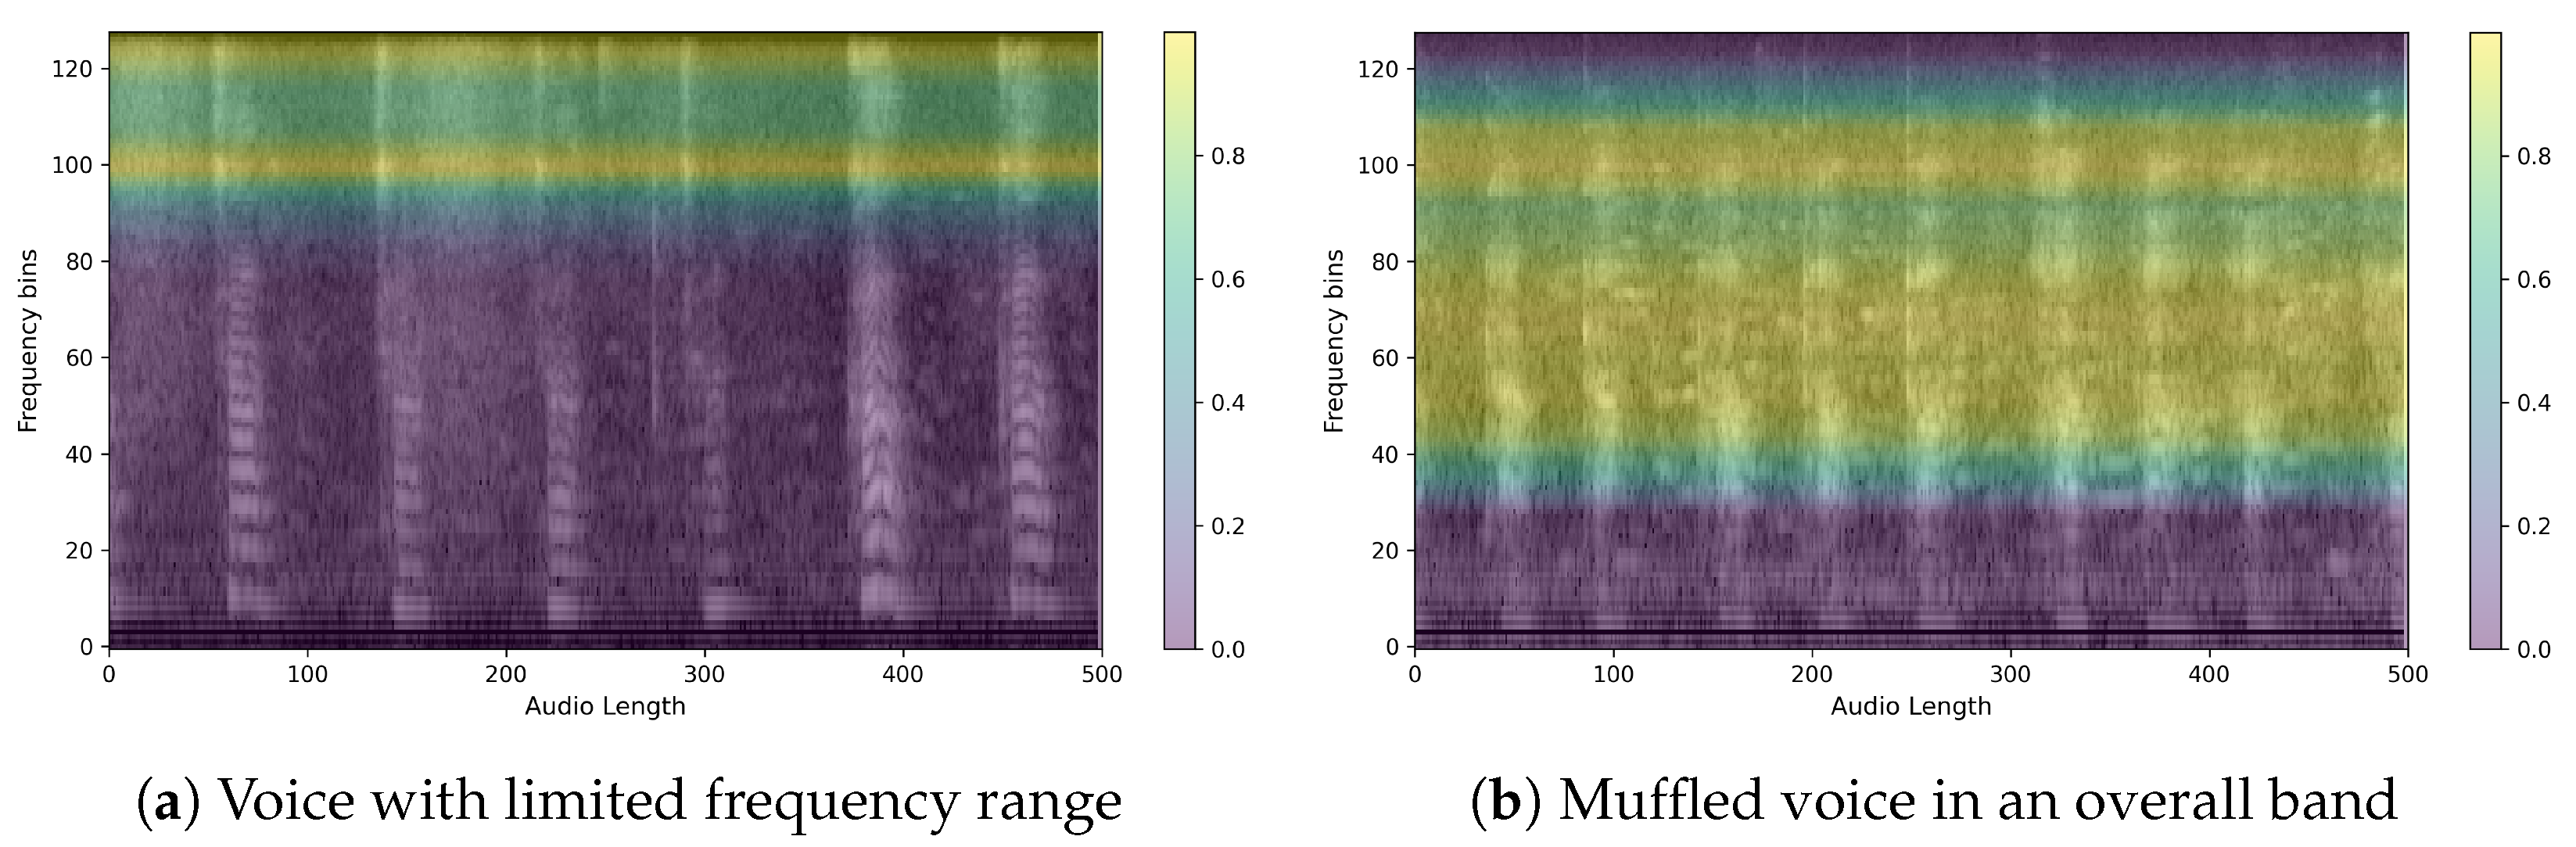
4.2. Qualitative Classification Model Evaluation
5. Discussion
6. Conclusions
Author Contributions
Funding
Institutional Review Board Statement
Informed Consent Statement
Data Availability Statement
Conflicts of Interest
References
- Poewe, W.; Seppi, K.; Tanner, C.M.; Halliday, G.M.; Brundin, P.; Volkmann, J.; Schrag, A.E.; Lang, A.E. Parkinson disease. Nat. Rev. Dis. Primers 2017, 3, 17013. [Google Scholar] [CrossRef] [PubMed]
- Willis, A.W.; Roberts, E.; Beck, J.C.; Fiske, B.; Ross, W.; Savica, R.; Van Den Eeden, S.K.; Tanner, C.M.; Marras, C.; Alcalay, R.; et al. Incidence of Parkinson disease in North America. NPJ Park. Dis. 2022, 8, 170. [Google Scholar] [CrossRef] [PubMed]
- Park, J.H.; Kim, D.H.; Kwon, D.Y.; Choi, M.; Kim, S.; Jung, J.H.; Han, K.; Park, Y.G. Trends in the incidence and prevalence of Parkinson’s disease in Korea: A nationwide, population-based study. BMC Geriatr. 2019, 19, 320. [Google Scholar] [CrossRef] [PubMed]
- Per-Patient Health Insurance Treatment Costs for Parkinson’s Disease Increase by 8.9% in Five Years. 2022. Available online: http://www.doctorstimes.com/news/articleView.html?idxno=218383 (accessed on 12 April 2024).
- Magee, M.; Copland, D.; Vogel, A.P. Motor speech and non-motor language endophenotypes of Parkinson’s disease. Expert Rev. Neurother. 2019, 19, 1191–1200. [Google Scholar] [CrossRef] [PubMed]
- Hlavnička, J.; Čmejla, R.; Tykalová, T.; Šonka, K.; Růžička, E.; Rusz, J. Automated analysis of connected speech reveals early biomarkers of Parkinson’s disease in patients with rapid eye movement sleep behaviour disorder. Sci. Rep. 2017, 7, 12. [Google Scholar] [CrossRef] [PubMed]
- Bang, Y.I.; Min, K.; Sohn, Y.H.; Cho, S.R. Acoustic characteristics of vowel sounds in patients with Parkinson disease. NeuroRehabilitation 2013, 32, 649–654. [Google Scholar] [CrossRef] [PubMed]
- Holmes, R.J.; Oates, J.M.; Phyland, D.J.; Hughes, A.J. Voice characteristics in the progression of Parkinson’s disease. Int. J. Lang. Commun. Disord. 2000, 35, 407–418. [Google Scholar] [CrossRef] [PubMed]
- Karlsson, F.; Schalling, E.; Laakso, K.; Johansson, K.; Hartelius, L. Assessment of speech impairment in patients with Parkinson’s disease from acoustic quantifications of oral diadochokinetic sequences. J. Acoust. Soc. Am. 2020, 147, 839–851. [Google Scholar] [CrossRef]
- Skodda, S.; Grönheit, W.; Lukas, C.; Bellenberg, B.; von Hein, S.M.; Hoffmann, R.; Saft, C. Two different phenomena in basic motor speech performance in premanifest Huntington disease. Neurology 2016, 86, 1329–1335. [Google Scholar] [CrossRef]
- Karlsson, F.; Hartelius, L. How well does diadochokinetic task performance predict articulatory imprecision? Differentiating individuals with Parkinson’s disease from control subjects. Folia Phoniatr. Logop. 2019, 71, 251–260. [Google Scholar] [CrossRef]
- Dromey, C.; Bjarnason, S. A preliminary report on disordered speech with deep brain stimulation in individuals with Parkinson’s disease. Park. Dis. 2011, 2011, 796205. [Google Scholar] [CrossRef] [PubMed]
- Godino-Llorente, J.I.; Shattuck-Hufnagel, S.; Choi, J.Y.; Moro-Velázquez, L.; Gómez-García, J.A. Towards the identification of Idiopathic Parkinson’s Disease from the speech. New articulatory kinetic biomarkers. PLoS ONE 2017, 12, e0189583. [Google Scholar] [CrossRef] [PubMed]
- Mei, J.; Desrosiers, C.; Frasnelli, J. Machine learning for the diagnosis of Parkinson’s disease: A review of literature. Front. Aging Neurosci. 2021, 13, 633752. [Google Scholar] [CrossRef] [PubMed]
- Iyer, A.; Kemp, A.; Rahmatallah, Y.; Pillai, L.; Glover, A.; Prior, F.; Larson-Prior, L.; Virmani, T. A machine learning method to process voice samples for identification of Parkinson’s disease. Sci. Rep. 2023, 13, 20615. [Google Scholar] [CrossRef] [PubMed]
- Cho, M.K. Rising to the challenge of bias in health care AI. Nat. Med. 2021, 27, 2079–2081. [Google Scholar] [CrossRef] [PubMed]
- Mittermaier, M.; Raza, M.M.; Kvedar, J.C. Bias in AI-based models for medical applications: Challenges and mitigation strategies. NPJ Digit. Med. 2023, 6, 113. [Google Scholar] [CrossRef] [PubMed]
- Liang, W.; Tadesse, G.A.; Ho, D.; Fei-Fei, L.; Zaharia, M.; Zhang, C.; Zou, J. Advances, challenges and opportunities in creating data for trustworthy AI. Nat. Mach. Intell. 2022, 4, 669–677. [Google Scholar] [CrossRef]
- Chen, I.Y.; Pierson, E.; Rose, S.; Joshi, S.; Ferryman, K.; Ghassemi, M. Ethical machine learning in healthcare. Annu. Rev. Biomed. Data Sci. 2021, 4, 123–144. [Google Scholar] [CrossRef] [PubMed]
- Arrieta, A.B.; Díaz-Rodríguez, N.; Del Ser, J.; Bennetot, A.; Tabik, S.; Barbado, A.; García, S.; Gil-López, S.; Molina, D.; Benjamins, R.; et al. Explainable Artificial Intelligence (XAI): Concepts, taxonomies, opportunities and challenges toward responsible AI. arXiv 2019, arXiv:1910.10045. [Google Scholar]
- Gong, Y.; Chung, Y.A.; Glass, J. AST: Audio Spectrogram Transformer. In Proceedings of the Interspeech 2021, ISCA, Brno, Czechia, 30 August–3 September 2021. [Google Scholar]
- Gong, Y.; Chung, Y.A.; Glass, J. PSLA: Improving audio tagging with pretraining, sampling, labeling, and aggregation. IEEE ACM Trans. Audio Speech Lang. Process. 2021, 29, 3292–3306. [Google Scholar] [CrossRef]
- Zhou, B.; Khosla, A.; Lapedriza, A.; Oliva, A.; Torralba, A. Learning deep features for discriminative localization. In Proceedings of the 2016 IEEE Conference on Computer Vision and Pattern Recognition (CVPR), Las Vegas, NV, USA, 26 June–1 July 2016; IEEE: Piscataway, NJ, USA, 2016; pp. 2921–2929. [Google Scholar]
- Selvaraju, R.R.; Cogswell, M.; Das, A.; Vedantam, R.; Parikh, D.; Batra, D. Grad-CAM: Visual explanations from deep networks via gradient-based localization. In Proceedings of the 2017 IEEE International Conference on Computer Vision (ICCV), Venice, Italy, 22–29 October 2017; IEEE: Piscataway, NJ, USA, 2017. [Google Scholar]
- Muhammad, M.B.; Yeasin, M. Eigen-CAM: Class Activation Map using Principal Components. In Proceedings of the 2020 International Joint Conference on Neural Networks (IJCNN), Glasgow, UK, 19–24 July 2020; IEEE: Piscataway, NJ, USA, 2020. [Google Scholar]
- Wodzinski, M.; Skalski, A.; Hemmerling, D.; Orozco-Arroyave, J.R.; Nöth, E. Deep learning approach to Parkinson’s disease detection using voice recordings and convolutional neural network dedicated to image classification. In Proceedings of the 2019 41st annual international conference of the IEEE engineering in medicine and biology society (EMBC), Berlin, Germany, 23–27 July 2019; IEEE: Piscataway, NJ, USA, 2019; pp. 717–720. [Google Scholar]
- Ma, J.; Zhang, Y.; Li, Y.; Zhou, L.; Qin, L.; Zeng, Y.; Wang, P.; Lei, Y. Deep dual-side learning ensemble model for Parkinson speech recognition. Biomed. Signal Process. Control 2021, 69, 102849. [Google Scholar] [CrossRef]
- Quan, C.; Ren, K.; Luo, Z. A deep learning based method for Parkinson’s disease detection using dynamic features of speech. IEEE Access 2021, 9, 10239–10252. [Google Scholar] [CrossRef]
- Quan, C.; Ren, K.; Luo, Z.; Chen, Z.; Ling, Y. End-to-end deep learning approach for Parkinson’s disease detection from speech signals. Biocybern. Biomed. Eng. 2022, 42, 556–574. [Google Scholar] [CrossRef]
- Costantini, G.; Cesarini, V.; Leo, P.D.; Amato, F.; Suppa, A.; Asci, F.; Pisani, A.; Calculli, A.; Saggio, G. Artificial Intelligence-Based Voice Assessment of Patients with Parkinson’s Disease Off and On Treatment: Machine vs. Deep-Learning Comparison. Sensors 2023, 23, 2293. [Google Scholar] [CrossRef] [PubMed]
- Ouhmida, A.; Raihani, A.; Cherradi, B.; Sandabad, S. Parkinson’s diagnosis hybrid system based on deep learning classification with imbalanced dataset. Int. J. Electr. Comput. Eng. 2023, 13, 3204–3216. [Google Scholar] [CrossRef]
- Tsanas, A. LSVT Voice Rehabilitation; UCI Machine Learning Repository: Espoo, Finland, 2014. [Google Scholar] [CrossRef]
- Sakar, B.E.; Isenkul, M.E.; Sakar, C.O.; Sertbas, A.; Gurgen, F.; Delil, S.; Apaydin, H.; Kursun, O. Collection and analysis of a Parkinson speech dataset with multiple types of sound recordings. IEEE J. Biomed. Health Inform. 2013, 17, 828–834. [Google Scholar] [CrossRef] [PubMed]
- Postuma, R.B.; Berg, D.; Stern, M.; Poewe, W.; Olanow, C.W.; Oertel, W.; Obeso, J.; Marek, K.; Litvan, I.; Lang, A.E.; et al. MDS clinical diagnostic criteria for Parkinson’s disease: MDS-PD Clinical Diagnostic Criteria. Mov. Disord. 2015, 30, 1591–1601. [Google Scholar] [CrossRef] [PubMed]
- Roßbach, J.; Kollmeier, B.; Meyer, B.T. A model of speech recognition for hearing-impaired listeners based on deep learning. J. Acoust. Soc. Am. 2022, 151, 1417. [Google Scholar] [CrossRef]
- Touvron, H.; Cord, M.; Douze, M.; Massa, F.; Sablayrolles, A.; Jégou, H. Training data-efficient image transformers & distillation through attention. In Proceedings of the International Conference on Machine Learning, PMLR, Virtual, 18–24 July 2021; pp. 10347–10357. [Google Scholar]
- Deng, J.; Dong, W.; Socher, R.; Li, L.J.; Li, K.; Fei-Fei, L. Imagenet: A large-scale hierarchical image database. In Proceedings of the 2009 IEEE Conference on Computer Vision and Pattern Recognition, Miami, FL, USA, 20–25 June 2009; IEEE: Piscataway, NJ, USA, 2009; pp. 248–255. [Google Scholar]
- Tan, M.; Le, Q. EfficientNet: Rethinking Model Scaling for Convolutional Neural Networks. In Proceedings of the 36th International Conference on Machine Learning, Long Beach, CA, USA, 10–15 June 2019; Chaudhuri, K., Salakhutdinov, R., Eds.; Volume 97, pp. 6105–6114. [Google Scholar]
- Park, D.S.; Chan, W.; Zhang, Y.; Chiu, C.C.; Zoph, B.; Cubuk, E.D.; Le, Q.V. Specaugment: A simple data augmentation method for automatic speech recognition. arXiv 2019, arXiv:1904.08779. [Google Scholar]
- Zhang, H.; Cisse, M.; Dauphin, Y.N.; Lopez-Paz, D. mixup: Beyond empirical risk minimization. arXiv 2017, arXiv:1710.09412. [Google Scholar]


| Authors | Years | Dataset | Input Feature | Model | Accuracy |
|---|---|---|---|---|---|
| Wodzinski et al. [26] | 2019 | PC-GITA | Mel-spectrogram | CNN | 91.7% |
| Jie et al. [27] | 2021 | LSVT voice rehabilitation dataset [32], Sakar dataset [33] | Original speech features/hybrid feature data | Embedded deep-stacked group sparse autoencoder (EGSAE) | 98.4% and 99.6% |
| Quan et al. [28] | 2021 | Database collected from GYENNO SCIENCE | BBE, MFCC, DMFCC, DDMFCC | Bidirectional LSTM | 84.29% |
| Quan et al. [29] | 2022 | Database collected from GYENNO SCIENCE, PC-GITA | Log Mel-spectrogram | 2D-CNN + 1D-CNN | GYENNO: 81.56%, PC-GITA: 92% |
| Giovanni et al. [30] | 2023 | 266 healthy controls (HCs) and 160 PD subjects (custom dataset) | Extracted features from various sources, Mel-spectrogram | Various machine learning models (KNN, SVM, naïve Bayes classifiers)/CNN | |
| Asmae et al. [31] | 2023 | Database collected by Max A. Little et al. | Acoustic features of the Parkinson’s dataset | Bidirectional LSTM | 98.72% |
| Control | PD | |
|---|---|---|
| Age * | 65.8 ± 7.6 | 64.3 ± 9.4 |
| Gender | ||
| Male | 47 | 49 |
| Female | 53 | 51 |
| Disease duration (yr) | Not applicable | 6.9 ± 4.5 |
| HY stage | Not applicable | 1.9 ± 0.8 |
| Total Participants | 100 | 100 |
| Task | Length | Remarks |
|---|---|---|
| /Pa/-/ta/-/ka/ | ~10 s | Repeat /pa/, /ta/, /ka/ alternately |
| Consonant | Various | Sequentially produce each consonant three times |
| Vowel | Various | Repeat /a/, /e/, /i/, /o/, /u/ alternately |
| Model | Accuracy | Sensitivity | Specificity | AUC | F1-Score | EER | d-Prime |
|---|---|---|---|---|---|---|---|
| AST | 87.75% | 86.59% | 88.94% | 94.16% | 87.75% | 12.84% | 2.218 |
| PSLA | 92.15% | 91.53% | 92.79% | 97.43% | 92.15% | 7.73% | 2.754 |
| Model | AST | PSLA |
|---|---|---|
| Training Time | 60.14 s/epoch | 38.92 s/epoch |
| Inference Time | 3.8 s | 1.9 s |
| GPU Memory | 6.26 GB | 2.24 GB |
| Method | Accuracy | Sensitivity | Specificity | AUC | F1-Score | EER | d-Prime |
|---|---|---|---|---|---|---|---|
| AST baseline | 79.30% | 76.11% | 82.64% | 87.30% | 79.30% | 20.93% | 1.613 |
| Filtered data +Audioset Pretraining | 87.75% | 86.59% | 88.94% | 94.16% | 87.75% | 12.84% | 2.218 |
| Method | Accuracy | Sensitivity | Specificity | AUC | F1-Score | EER | d-Prime |
|---|---|---|---|---|---|---|---|
| PSLA baseline | 90.38% | 91.15% | 89.58% | 96.66% | 90.38% | 9.50% | 2.592 |
| +Data filtering | 90.61% | 91.52% | 89.66% | 95.90% | 90.60% | 9.51% | 2.459 |
| +EfficientNet b2 | 92.15% | 91.53% | 92.79% | 97.43% | 92.15% | 7.73% | 2.754 |
Disclaimer/Publisher’s Note: The statements, opinions and data contained in all publications are solely those of the individual author(s) and contributor(s) and not of MDPI and/or the editor(s). MDPI and/or the editor(s) disclaim responsibility for any injury to people or property resulting from any ideas, methods, instructions or products referred to in the content. |
© 2024 by the authors. Licensee MDPI, Basel, Switzerland. This article is an open access article distributed under the terms and conditions of the Creative Commons Attribution (CC BY) license (https://creativecommons.org/licenses/by/4.0/).
Share and Cite
Jeong, S.-M.; Kim, S.; Lee, E.C.; Kim, H.J. Exploring Spectrogram-Based Audio Classification for Parkinson’s Disease: A Study on Speech Classification and Qualitative Reliability Verification. Sensors 2024, 24, 4625. https://doi.org/10.3390/s24144625
Jeong S-M, Kim S, Lee EC, Kim HJ. Exploring Spectrogram-Based Audio Classification for Parkinson’s Disease: A Study on Speech Classification and Qualitative Reliability Verification. Sensors. 2024; 24(14):4625. https://doi.org/10.3390/s24144625
Chicago/Turabian StyleJeong, Seung-Min, Seunghyun Kim, Eui Chul Lee, and Han Joon Kim. 2024. "Exploring Spectrogram-Based Audio Classification for Parkinson’s Disease: A Study on Speech Classification and Qualitative Reliability Verification" Sensors 24, no. 14: 4625. https://doi.org/10.3390/s24144625
APA StyleJeong, S.-M., Kim, S., Lee, E. C., & Kim, H. J. (2024). Exploring Spectrogram-Based Audio Classification for Parkinson’s Disease: A Study on Speech Classification and Qualitative Reliability Verification. Sensors, 24(14), 4625. https://doi.org/10.3390/s24144625