
Clustering Runners’ Response to Different Midsole Stack Heights: A Field Study

 ,
,
Abstract
:1. Introduction
2. Materials and Methods
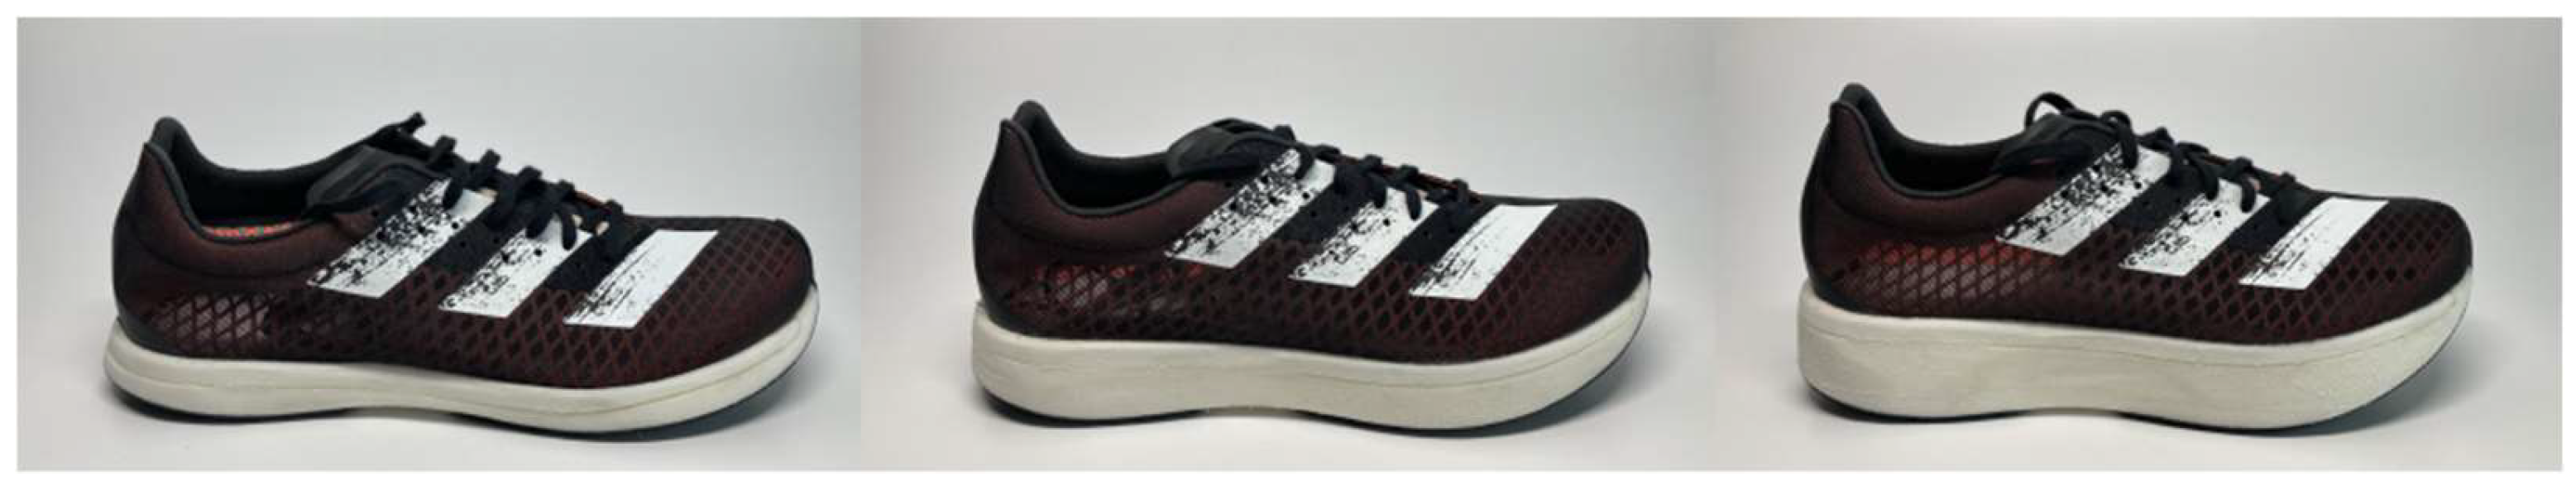
2.1. Shoes
2.2. Footwear and Mechanical Testing Shoes
2.3. Human Participants
2.4. Study Protocol
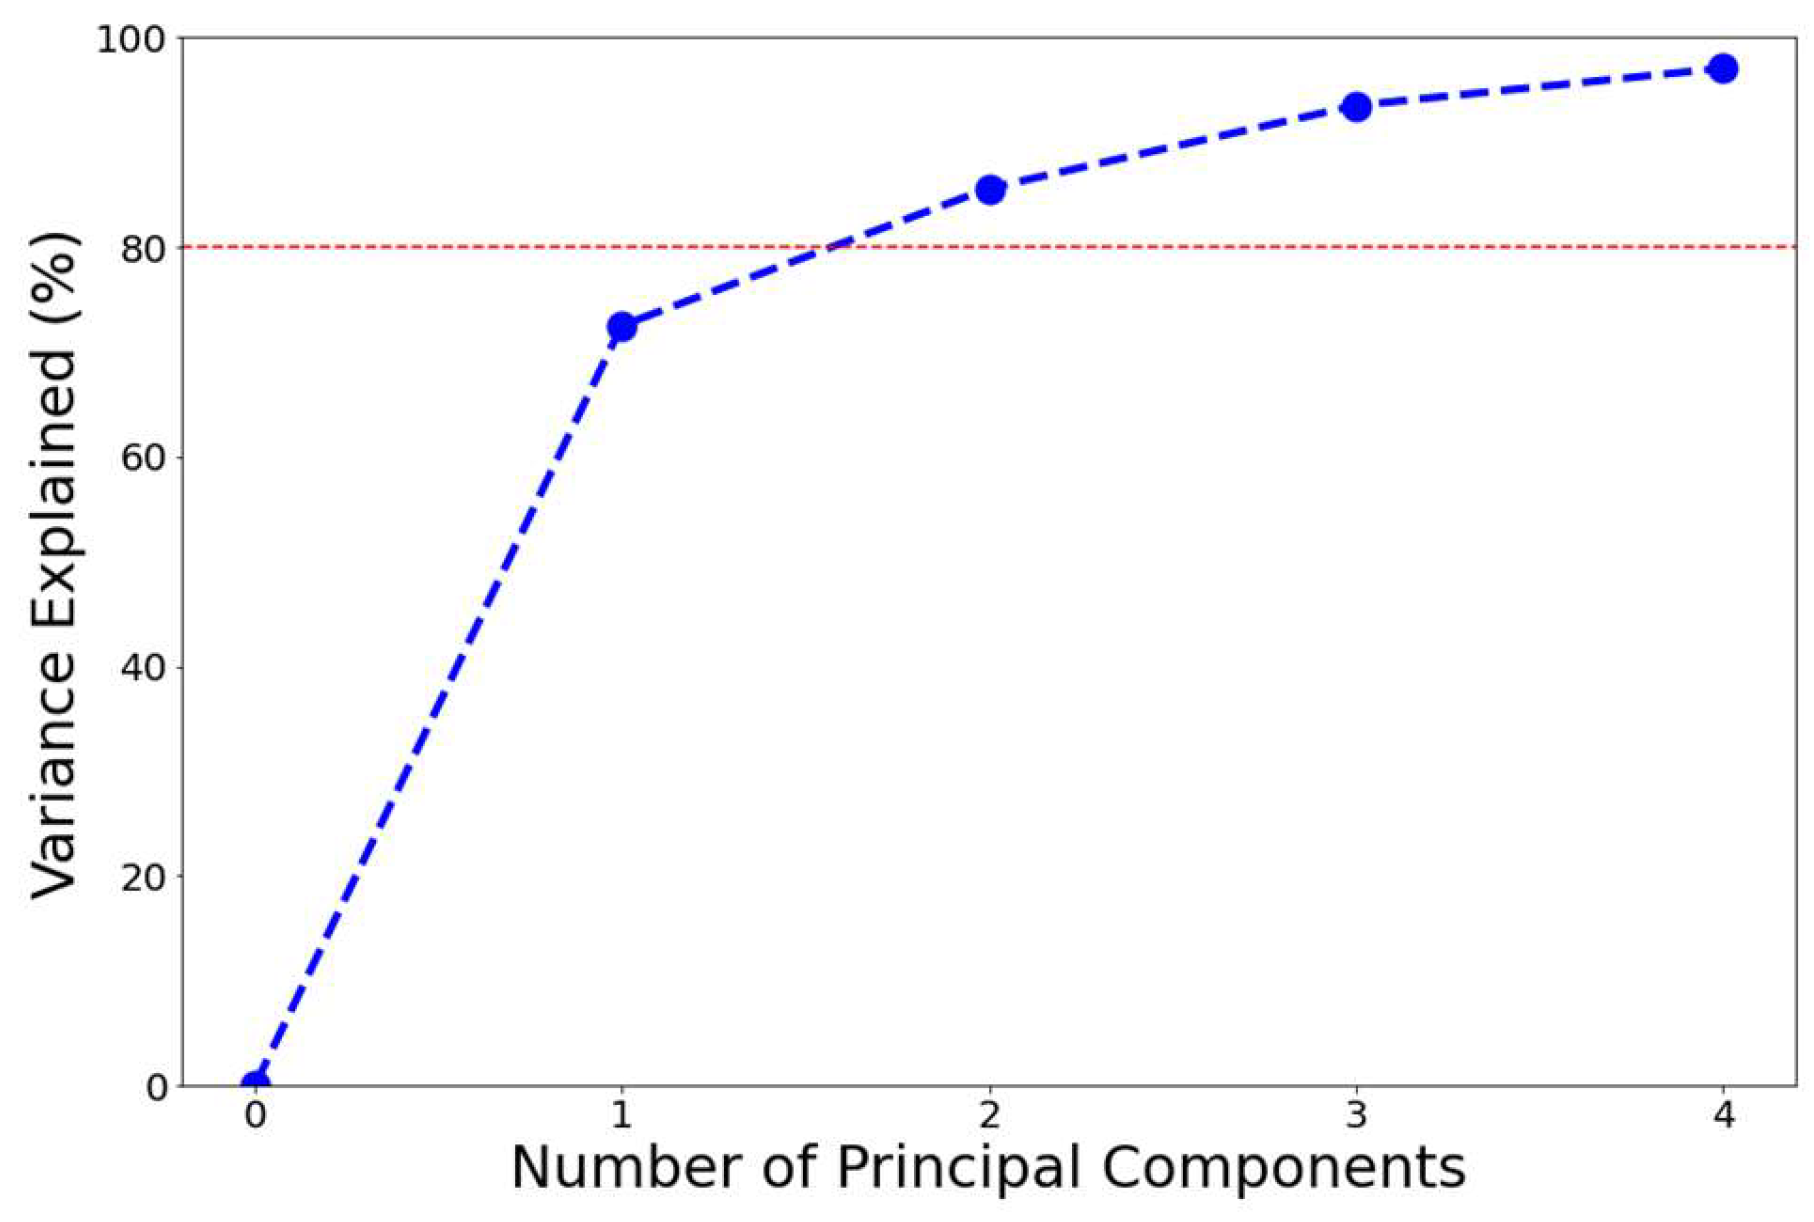
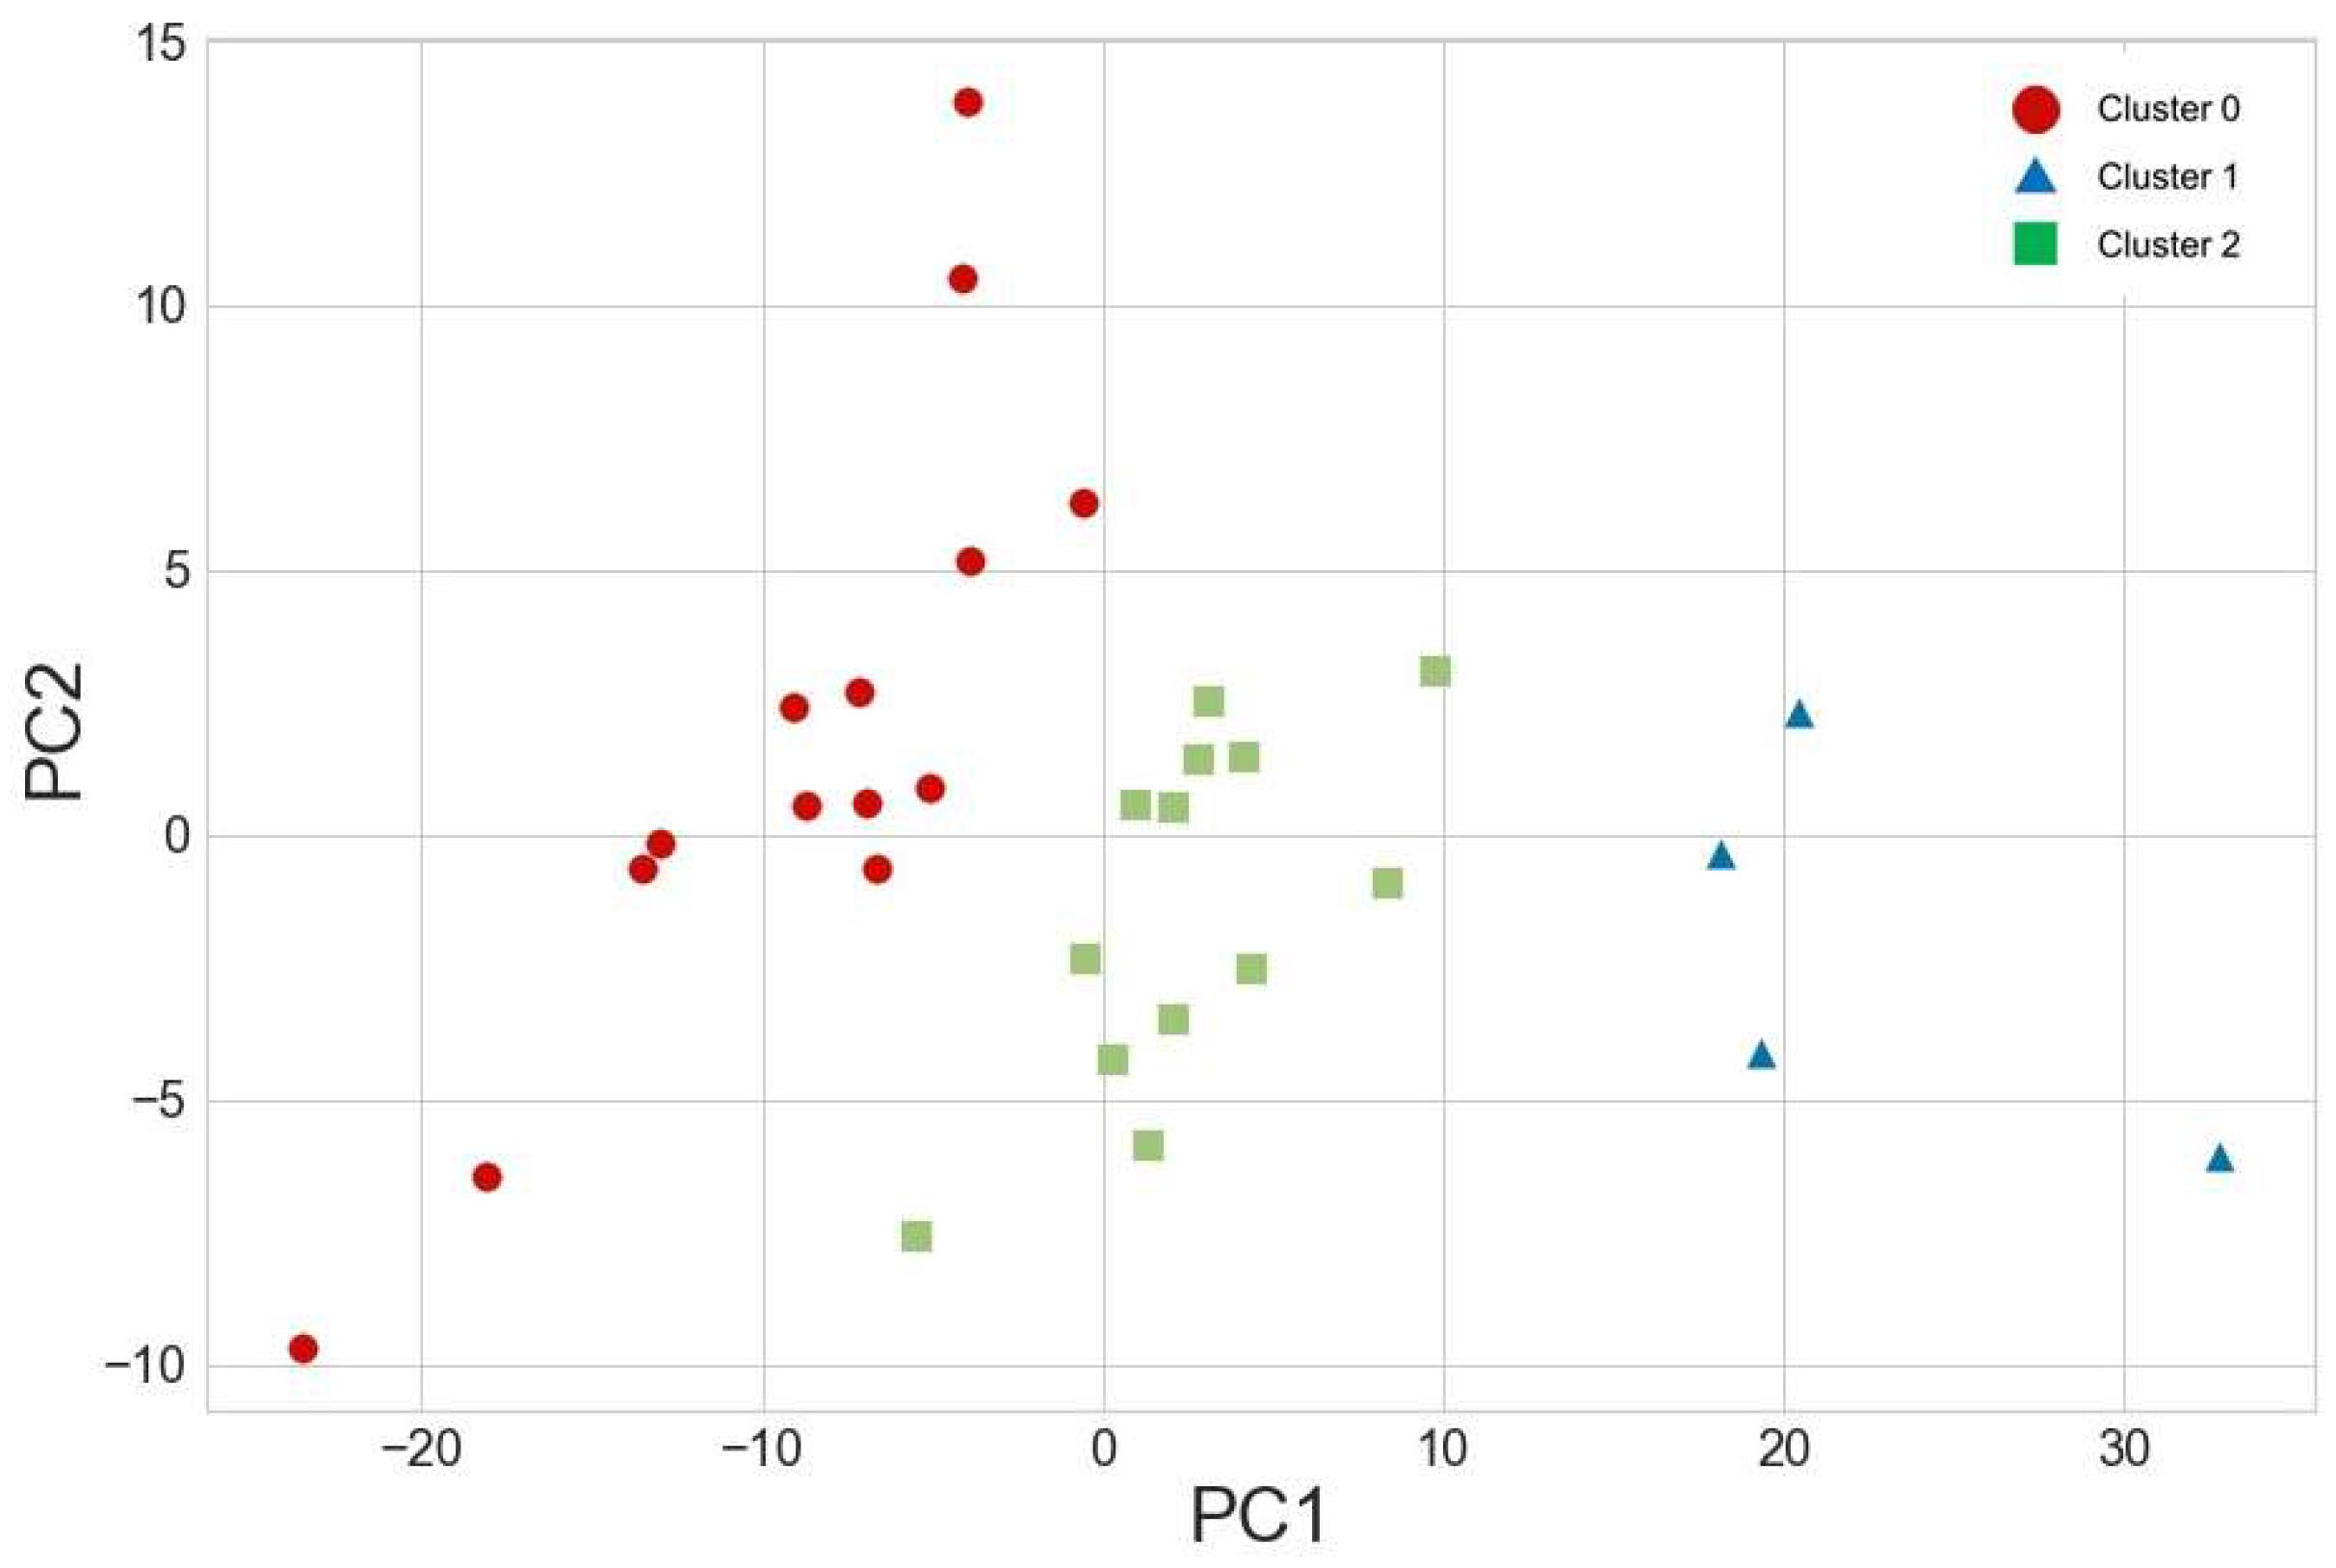
2.5. Data Analysis
3. Results
4. Discussion
Author Contributions
Funding
Institutional Review Board Statement
Informed Consent Statement
Data Availability Statement
Conflicts of Interest
Appendix A

| Cluster 0 | Cluster 1 | Cluster 2 | |||||
|---|---|---|---|---|---|---|---|
| Mean | std | Mean | std | Mean | std | ||
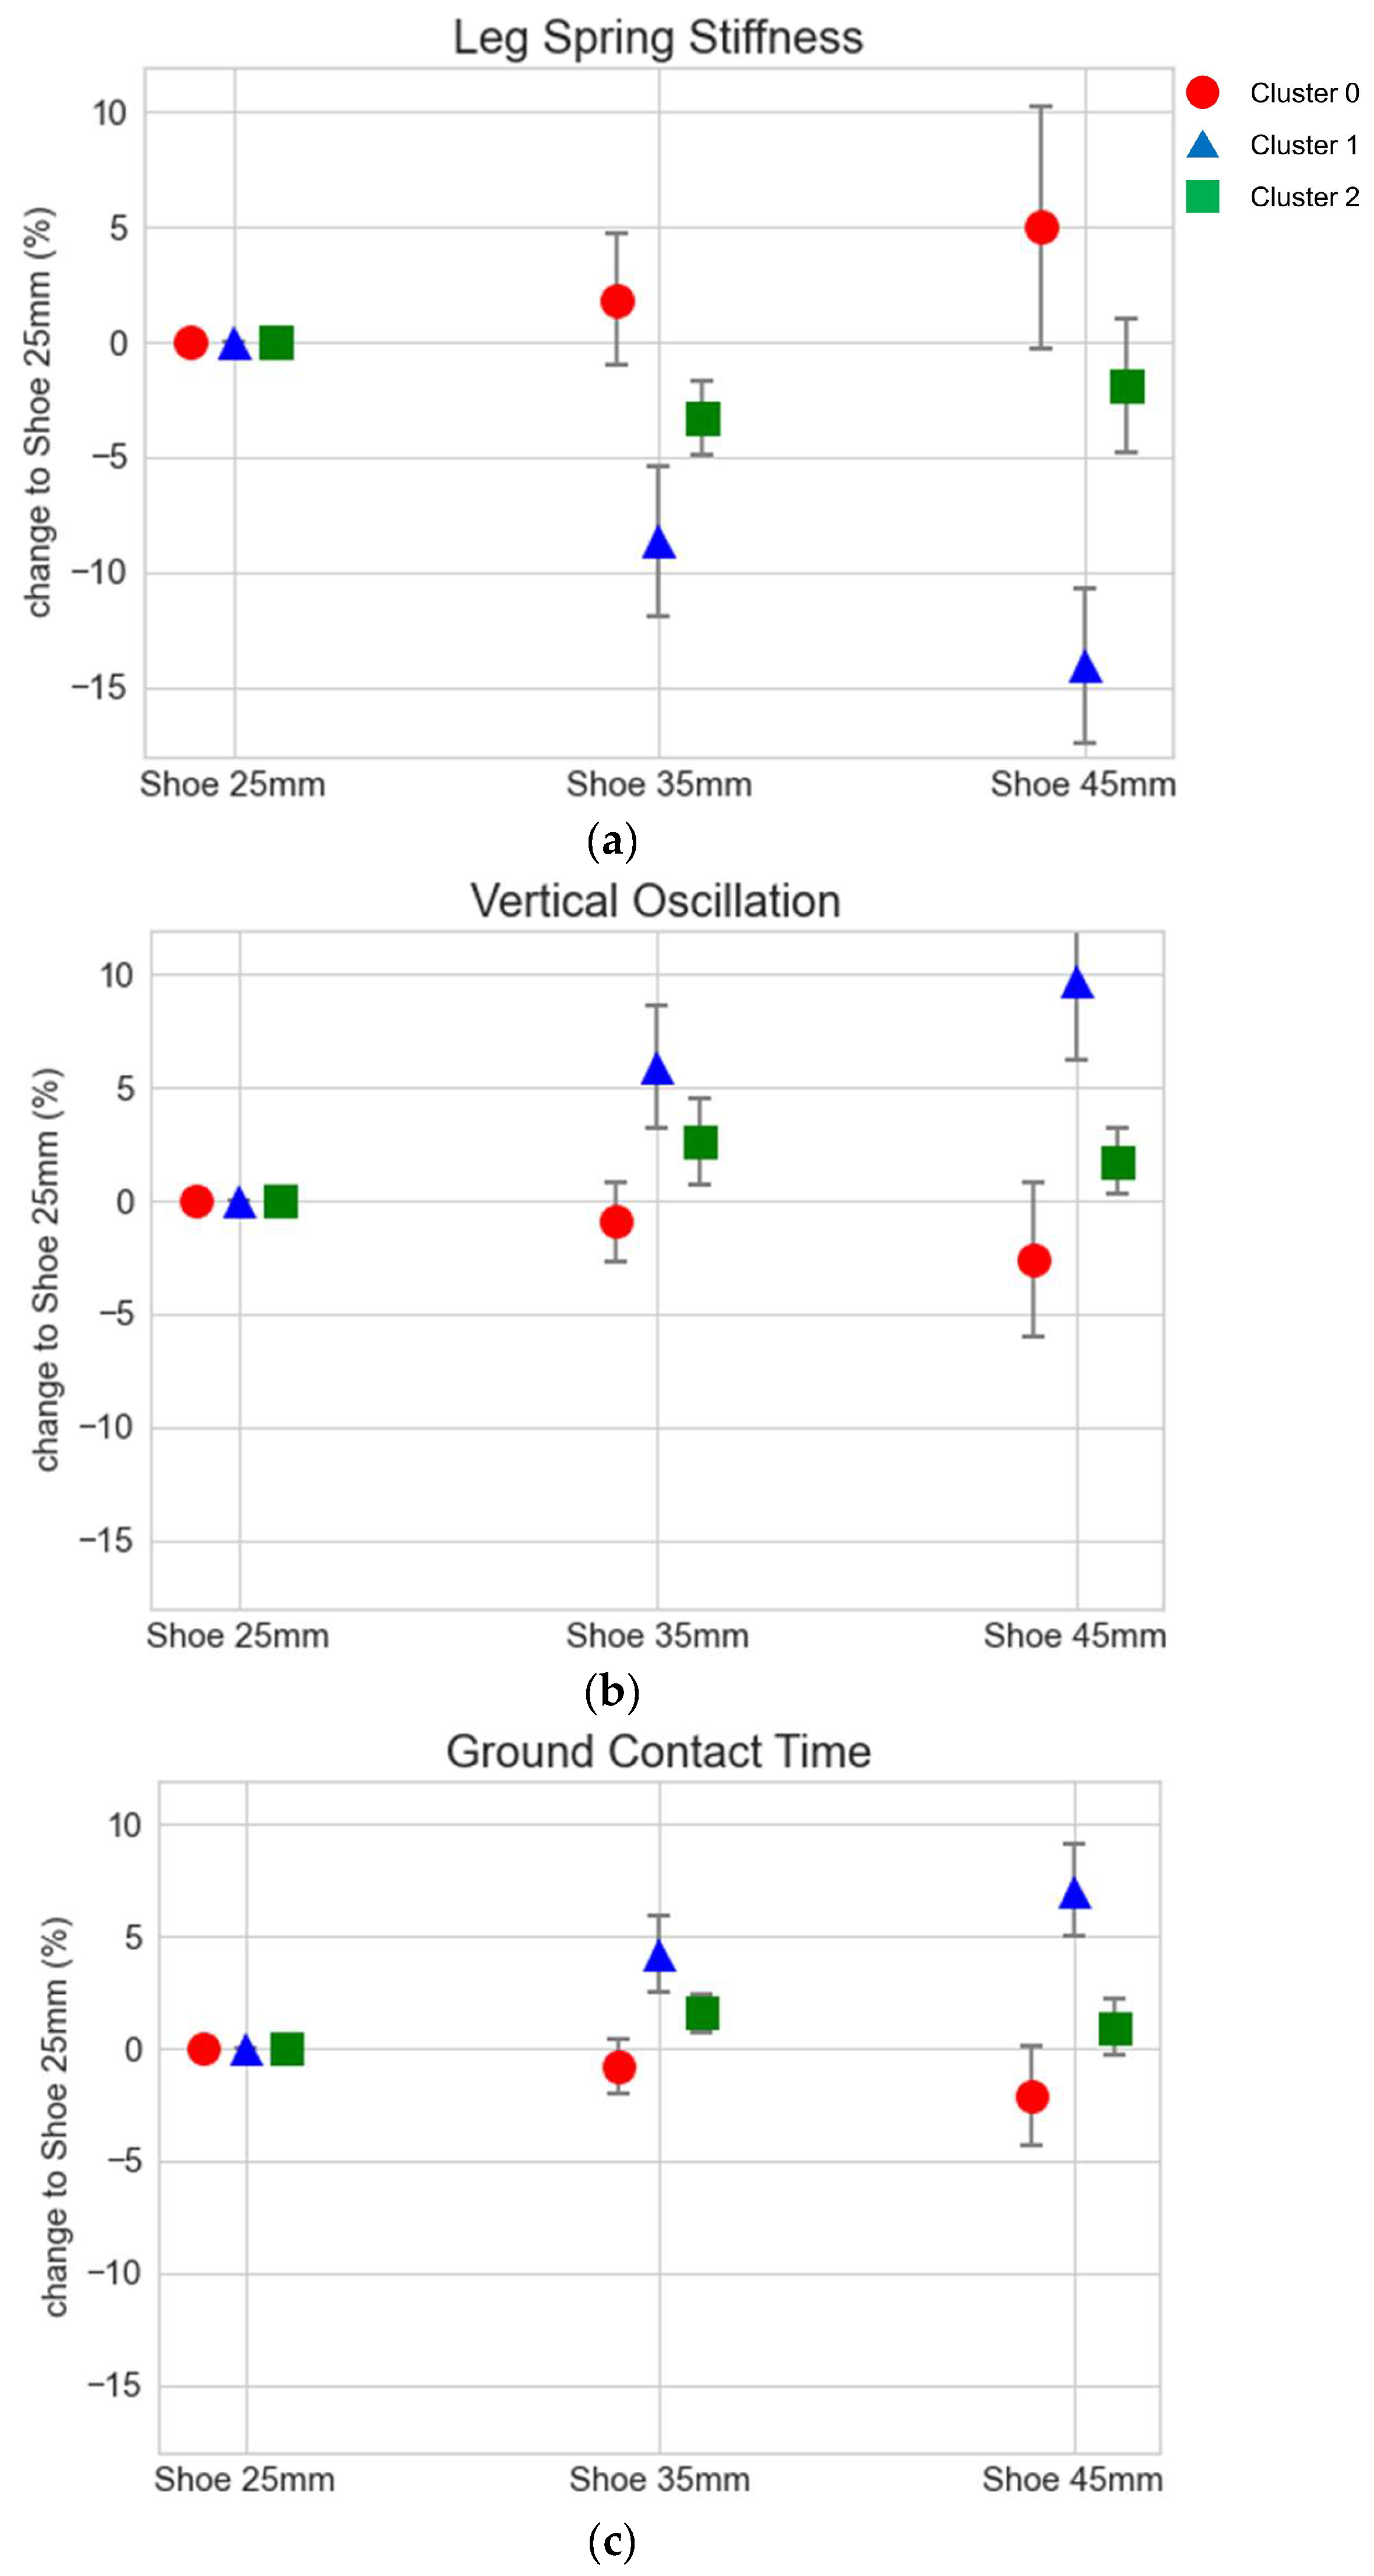
| Leg Spring Stiffness | Shoe 35 mm | 1.8 | 2.85 | −8.7 | 3.26 | −3.3 | 1.63 |
| Shoe 45 mm | 5.0 | 5.26 | −14.1 | 3.36 | −1.9 | 2.91 | |
| Vertical Oscillation | Shoe 35 mm | −0.9 | 1.72 | 5.9 | 2.74 | 2.6 | 1.90 |
| Shoe 45 mm | −2.6 | 3.41 | 9.7 | 3.50 | 1.7 | 1.46 | |
| Ground Contact Time | Shoe 35 mm | −0.8 | 1.19 | 4.2 | 1.69 | 1.6 | 0.86 |
| Shoe 45 mm | −2.0 | 2.21 | 7.0 | 2.06 | −0.2 | 1.23 | |
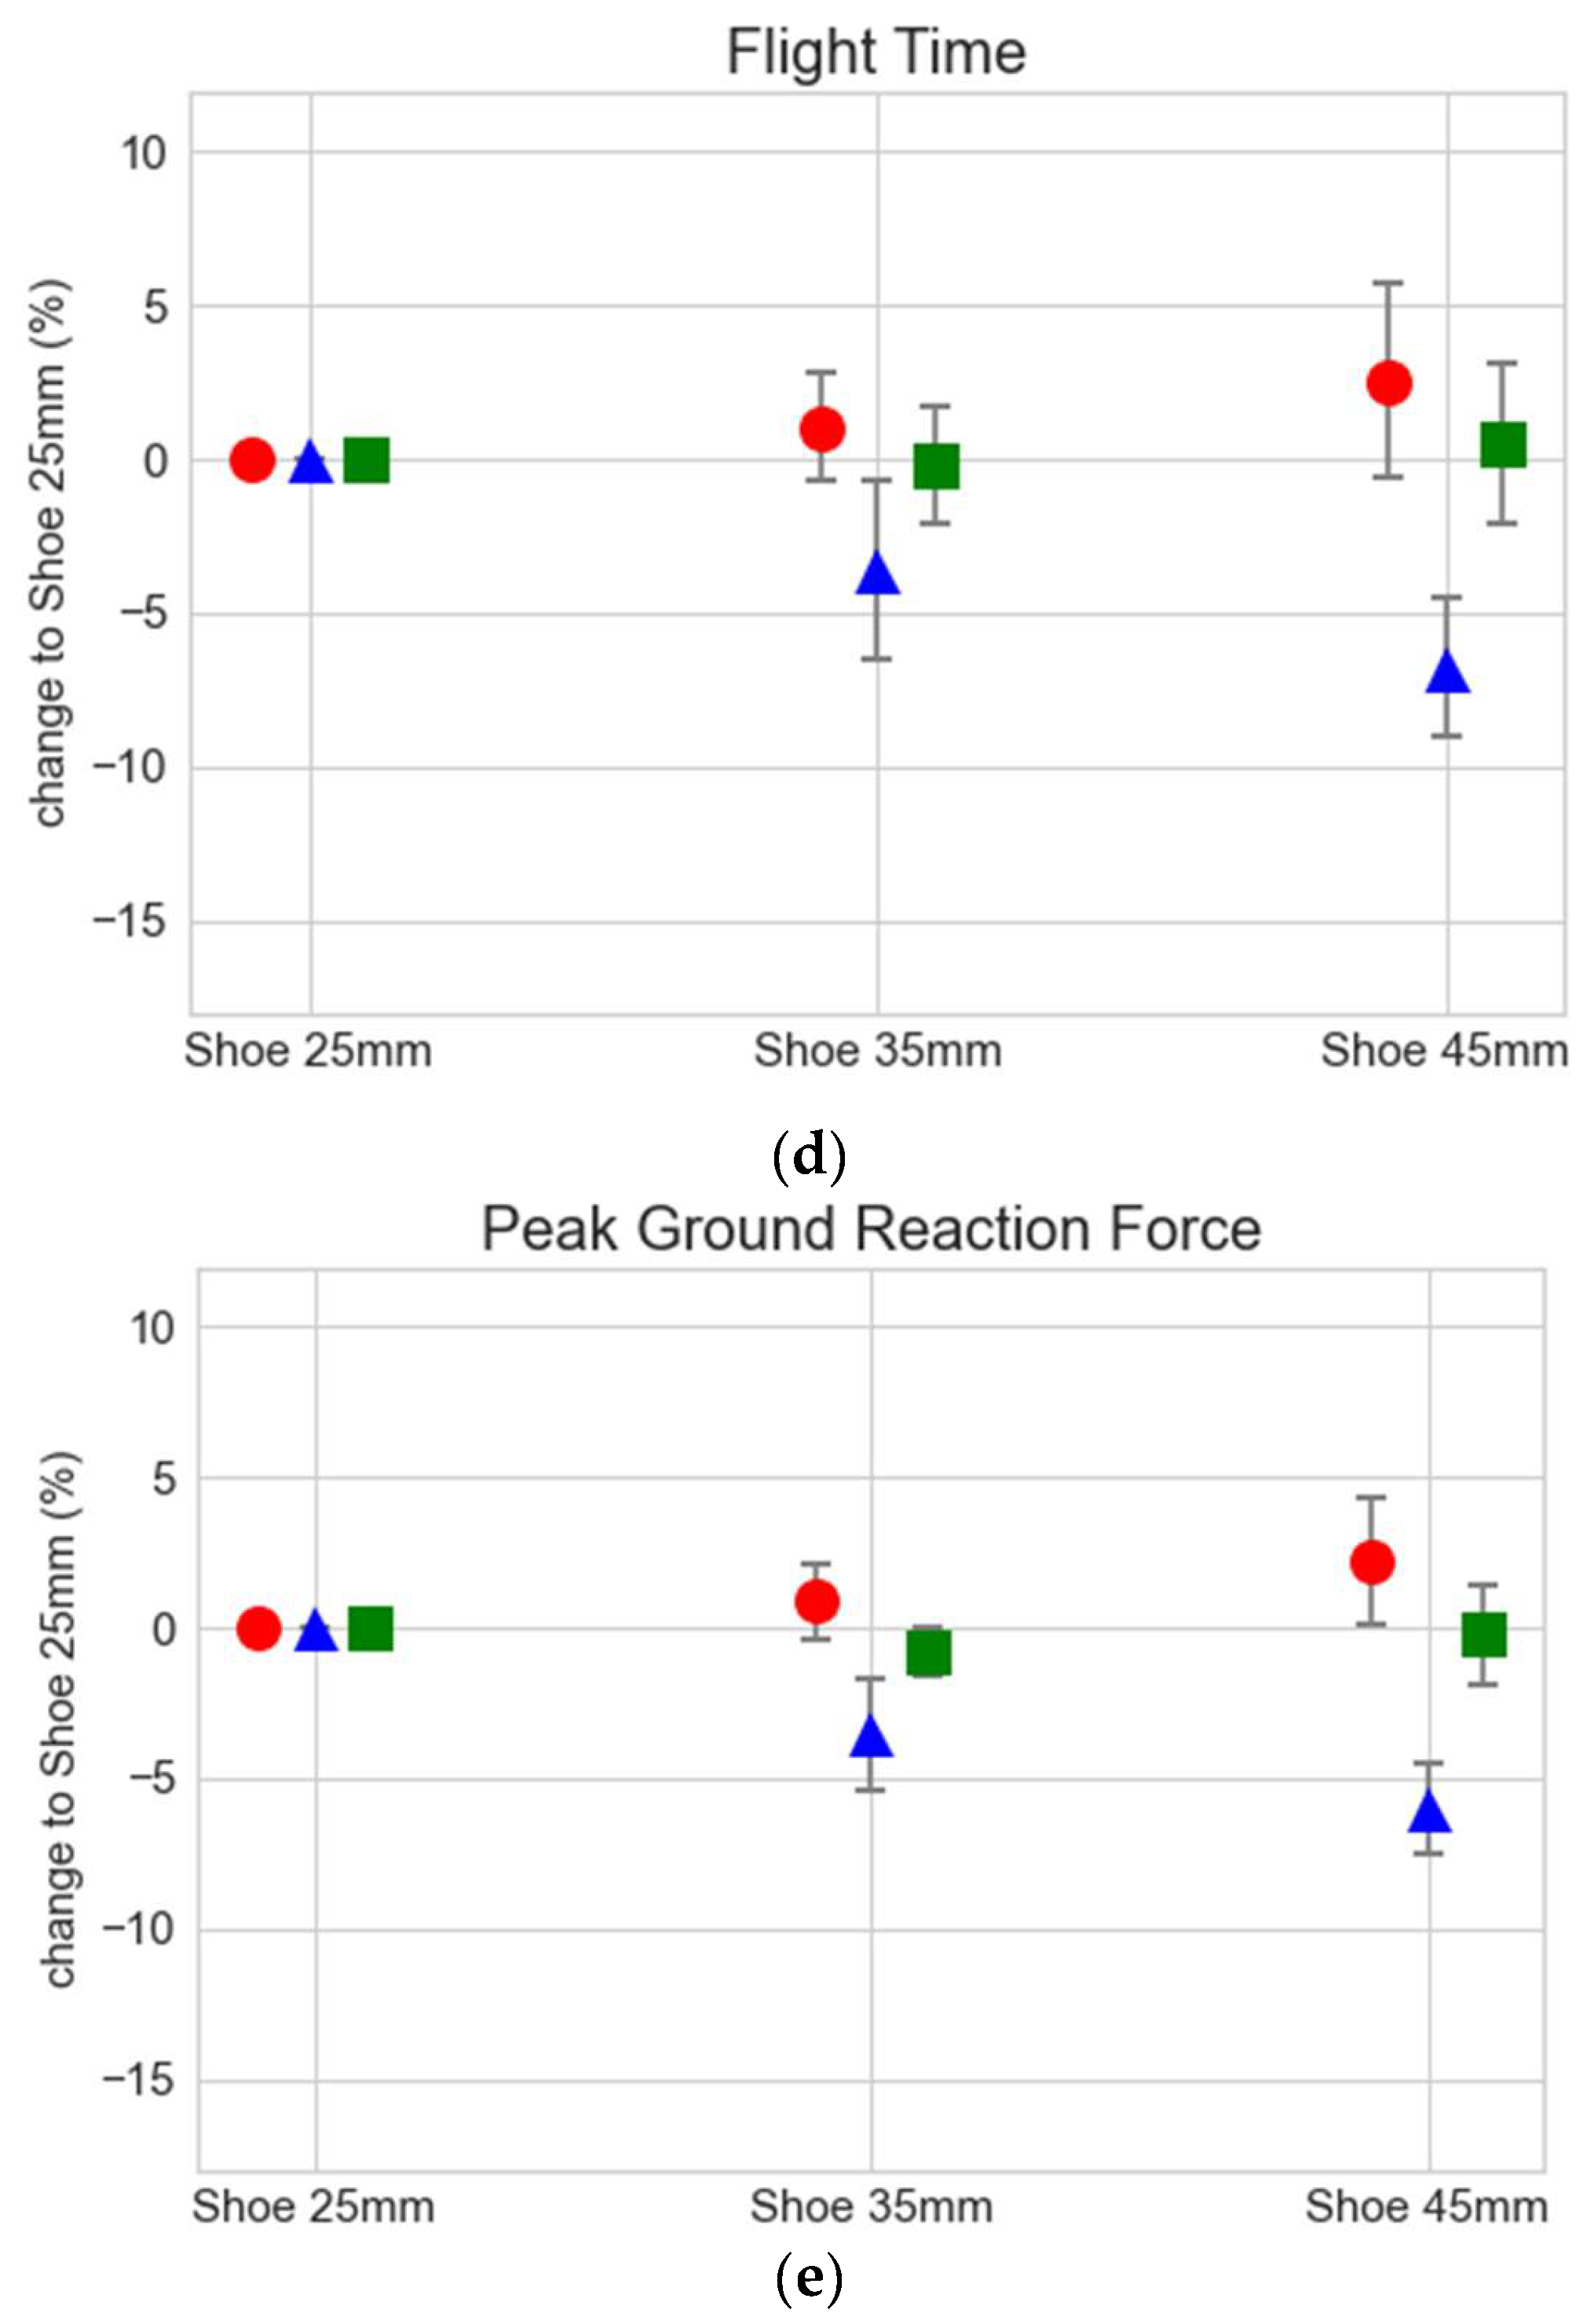
| Flight Time | Shoe 35 mm | 1.0 | 1.77 | −3.6 | 2.91 | −0.2 | 1.93 |
| Shoe 45 mm | 2.5 | 3.17 | −6.8 | 2.24 | 0.5 | 2.59 | |
| Peak Ground Reaction Forces | Shoe 35 mm | 0.9 | 1.27 | −3.5 | 1.85 | −0.8 | 0.76 |
| Shoe 45 mm | 2.2 | 2.11 | −6.0 | 1.50 | −0.2 | 1.69 | |
| Speed | Shoe 35 mm | 0.6 | 1.23 | −1.5 | 4.00 | −1.0 | 1.88 |
| Shoe 45 mm | 1.9 | 3.48 | −2.3 | 4.15 | −0.1 | 1.60 | |
| Stride Length | Shoe 35 mm | 0.7 | 1.18 | −1.0 | 2.88 | −0.3 | 1.32 |
| Shoe 45 mm | 2.0 | 2.83 | −1.7 | 3.49 | 0.6 | 1.63 | |
| Cadence | Shoe 35 mm | −0.1 | 0.72 | −0.5 | 1.48 | −0.8 | 1.18 |
| Shoe 45 mm | −0.1 | 1.43 | −0.6 | 1.26 | −0.7 | 0.74 | |
References
- Hoogkamer, W.; Kipp, S.; Frank, J.H.; Farina, E.M.; Luo, G.; Kram, R. A Comparison of the Energetic Cost of Running in Marathon Racing Shoes. Sports Med. 2018, 48, 1009–1019. [Google Scholar] [CrossRef]
- Barnes, K.R.; Kilding, A.E. A Randomized Crossover Study Investigating the Running Economy of Highly-Trained Male and Female Distance Runners in Marathon Racing Shoes versus Track Spikes. Sports Med. 2019, 49, 331–342. [Google Scholar] [CrossRef]
- Hunter, I.; McLeod, A.; Valentine, D.; Low, T.; Ward, J.; Hager, R. Running Economy, Mechanics, and Marathon Racing Shoes. J. Sports Sci. 2019, 37, 2367–2373. [Google Scholar] [CrossRef] [PubMed]
- Hébert-Losier, K.; Finlayson, S.J.; Driller, M.W.; Dubois, B.; Esculier, J.-F.; Beaven, C.M. Metabolic and Performance Responses of Male Runners Wearing 3 Types of Footwear: Nike Vaporfly 4%, Saucony Endorphin Racing Flats, and Their Own Shoes. J. Sport Health Sci. 2022, 11, 275–284. [Google Scholar] [CrossRef]
- Patoz, A.; Lussiana, T.; Breine, B.; Gindre, C. The Nike Vaporfly 4%: A Game Changer to Improve Performance without Biomechanical Explanation Yet. Footwear Sci. 2022, 14, 147–150. [Google Scholar] [CrossRef]
- Frederick, E.C. Let’s Just Call It Advanced Footwear Technology (AFT). Footwear Sci. 2022, 14, 131. [Google Scholar] [CrossRef]
- Book of Rules-C2.1A Athletic Shoe Regulation. Available online: https://worldathletics.org/about-iaaf/documents/book-of-rules (accessed on 1 February 2024).
- Frederick, E.C. Physiological and ergonomics factors in running shoe design. Appl. Ergonomics 1984, 15, 281–287. [Google Scholar] [CrossRef]
- Franz, J.R.; Wierzbinski, C.M.; Kram, R. Metabolic Cost of Running Barefoot versus Shod: Is Lighter Better? Med. Sci. Sports Exerc. 2012, 44, 1519–1525. [Google Scholar] [CrossRef] [PubMed]
- Nigg, B.M.; Cigoja, S.; Nigg, S.R. Effects of Running Shoe Construction on Performance in Long Distance Running. Footwear Sci. 2020, 12, 133–138. [Google Scholar] [CrossRef]
- Barrons, Z.B.; Wannop, J.W.; Stefanyshyn, D.J. The Influence of Midsole Thickness on Running Biomechanics and Performance in Female and Male Runners, Does Size Matter? Footwear Sci. 2023, 15, 5. [Google Scholar] [CrossRef]
- Bertschy, M.; Lino, H.; Healey, L.; Hoogkamer, W. Effects of Midsole Stack Height and Foam on the Metabolic Cost of Running. Footwear Sci. 2023, 15, 83. [Google Scholar] [CrossRef]
- Cochrum, R.G.; Connors, R.T.; Coons, J.M.; Fuller, D.K.; Morgan, D.W.; Caputo, J.L. Comparison of Running Economy Values While Wearing No Shoes, Minimal Shoes, and Normal Running Shoes. J. Strength Cond. Res. 2017, 31, 595–601. [Google Scholar] [CrossRef] [PubMed]
- Law, M.H.C.; Choi, E.M.F.; Law, S.H.Y.; Chan, S.S.C.; Wong, S.M.S.; Ching, E.C.K.; Chan, Z.Y.S.; Zhang, J.H.; Lam, G.W.K.; Lau, F.O.Y.; et al. Effects of Footwear Midsole Thickness on Running Biomechanics. J. Sports Sci. 2019, 37, 1004–1010. [Google Scholar] [CrossRef] [PubMed]
- Knopp, M.; Muñiz-Pardos, B.; Wackerhage, H.; Schönfelder, M.; Guppy, F.; Pitsiladis, Y.; Ruiz, D. Variability in Running Economy of Kenyan World-Class and European Amateur Male Runners with Advanced Footwear Running Technology: Experimental and Meta-Analysis Results. Sports Med. 2023, 53, 1255–1271. [Google Scholar] [CrossRef] [PubMed]
- Heyde, C.; Nielsen, A.; Roecker, K.; Godsk Larsen, R.; De Zee, M.; Kersting, U.K.; Brund, R.B. The Percentage of Recreational Runners That Might Benefit from New Running Shoes. A Likely Scenario. Footwear Sci. 2022, 14, 163–172. [Google Scholar] [CrossRef]
- Dorschky, E.; Krüger, D.; Kurfess, N.; Schlarb, H.; Wartzack, S.; Eskofier, B.M.; Van Den Bogert, A.J. Optimal Control Simulation Predicts Effects of Midsole Materials on Energy Cost of Running. Comput. Methods Biomech. Biomed. Eng. 2019, 22, 869–879. [Google Scholar] [CrossRef] [PubMed]
- Morin, J.-B.; Dalleau, G.; Kyröläinen, H.; Jeannin, T.; Belli, A. A Simple Method for Measuring Stiffness during Running. J. Appl. Biomech. 2005, 21, 167–180. [Google Scholar] [CrossRef] [PubMed]
- Ward, J.H. Hierarchical Grouping to Optimize an Objective Function. J. Am. Stat. Assoc. 1963, 58, 236–244. [Google Scholar] [CrossRef]
- Van Hooren, B.; Jukic, I.; Cox, M.; Frenken, K.G.; Bautista, I.; Moore, I.S. The Relationship Between Running Biomechanics and Running Economy: A Systematic Review and Meta-Analysis of Observational Studies. Sports Med. 2024, 54, 1269–1316. [Google Scholar] [CrossRef]
- Imbach, F.; Candau, R.; Chailan, R.; Perrey, S. Validity of the Stryd Power Meter in Measuring Running Parameters at Submaximal Speeds. Sports 2020, 8, 103. [Google Scholar] [CrossRef]
- García-Pinillos, F.; Roche-Seruendo, L.E.; Marcén-Cinca, N.; Marco-Contreras, L.A.; Latorre-Román, P.A. Absolute Reliability and Concurrent Validity of the Stryd System for the Assessment of Running Stride Kinematics at Different Velocities. J. Strength Cond. Res. 2021, 35, 78–84. [Google Scholar] [CrossRef] [PubMed]
- Dorschky, E.; Camomilla, V.; Davis, J.; Federolf, P.; Reenalda, J.; Koelewijn, A.D. Perspective on “in the wild” movement analysis using machine learning. Hum. Mov. Sci. 2023, 87, 103042. [Google Scholar] [CrossRef] [PubMed]
| Size (UK) | Stack Height (mm) | Weight (g) | Cushioning (N/mm) Rearfoot/Forefoot | Energy Return (Rel) (%) | Energy Return (Abs) (J) | Bending Stiffness (Nm/°) |
|---|---|---|---|---|---|---|
| 8.5 | 25.0 | 186.0 | 128/136 | 83.0 | 8.0 | 0.22 |
| 8.5 | 35.0 | 211.0 | 86/100 | 82.0 | 12.4 | 0.20 |
| 8.5 | 45.0 | 229.0 | 66/77 | 83.0 | 16.4 | 0.20 |
| 10.5 | 25.0 | 202.2 | 144/155 | 80.0 | 9.6 | 0.22 |
| 10.5 | 35.0 | 229.0 | 99/108 | 82.0 | 14.5 | 0.23 |
| 10.5 | 45.0 | 246.0 | 76/83 | 83.0 | 18.9 | 0.21 |
| Cluster 0 | Cluster 1 | Cluster 2 | F-Score | p-Value | |
|---|---|---|---|---|---|
| Body height (cm) | 180.3 (±5.61) | 182.5 (±5.07) | 182.0 (±6.24) | 0.40 | 0.674 |
| Body weight (kg) | 73.7 (±5.08) | 74.3 (±4.79) | 70.8 (±6.99) | 0.96 | 0.396 |
| Leg length (cm) | 94.78 (±3.32) | 95.5 (±3.42) | 95.7 (±4.34) | 0.19 | 0.832 |
| Running speed (m/s) | 4.7 (±0.57) | 4.8 (±0.11) | 4.9 (±0.30) | 0.80 | 0.458 |
Disclaimer/Publisher’s Note: The statements, opinions and data contained in all publications are solely those of the individual author(s) and contributor(s) and not of MDPI and/or the editor(s). MDPI and/or the editor(s) disclaim responsibility for any injury to people or property resulting from any ideas, methods, instructions or products referred to in the content. |
© 2024 by the authors. Licensee MDPI, Basel, Switzerland. This article is an open access article distributed under the terms and conditions of the Creative Commons Attribution (CC BY) license (https://creativecommons.org/licenses/by/4.0/).
Share and Cite
Koegel, J.; Huerta, S.; Gambietz, M.; Ullrich, M.; Heyde, C.; Dorschky, E.; Eskofier, B. Clustering Runners’ Response to Different Midsole Stack Heights: A Field Study. Sensors 2024, 24, 4694. https://doi.org/10.3390/s24144694
Koegel J, Huerta S, Gambietz M, Ullrich M, Heyde C, Dorschky E, Eskofier B. Clustering Runners’ Response to Different Midsole Stack Heights: A Field Study. Sensors. 2024; 24(14):4694. https://doi.org/10.3390/s24144694
Chicago/Turabian StyleKoegel, Jannik, Stacy Huerta, Markus Gambietz, Martin Ullrich, Christian Heyde, Eva Dorschky, and Bjoern Eskofier. 2024. "Clustering Runners’ Response to Different Midsole Stack Heights: A Field Study" Sensors 24, no. 14: 4694. https://doi.org/10.3390/s24144694