
Overarm Training Tolerance: A Pilot Study on the Use of Muscle Oxygen Saturation as a Biomarker
 , and
, and
Abstract
:1. Introduction
1.1. Mental Resilience
1.2. Pain Tolerance
1.3. Blending Subjective and Objective Assessments
1.4. Research Gap
2. Materials and Methods
2.1. Experiment Design
- Throwing phase;
- Deltoid exercise phase;.
- Heart rate monitoring;
- Subjective assessment
- Performance metrics (accuracy, speed, etc.) from the throws based on data from the Driveline sensor.
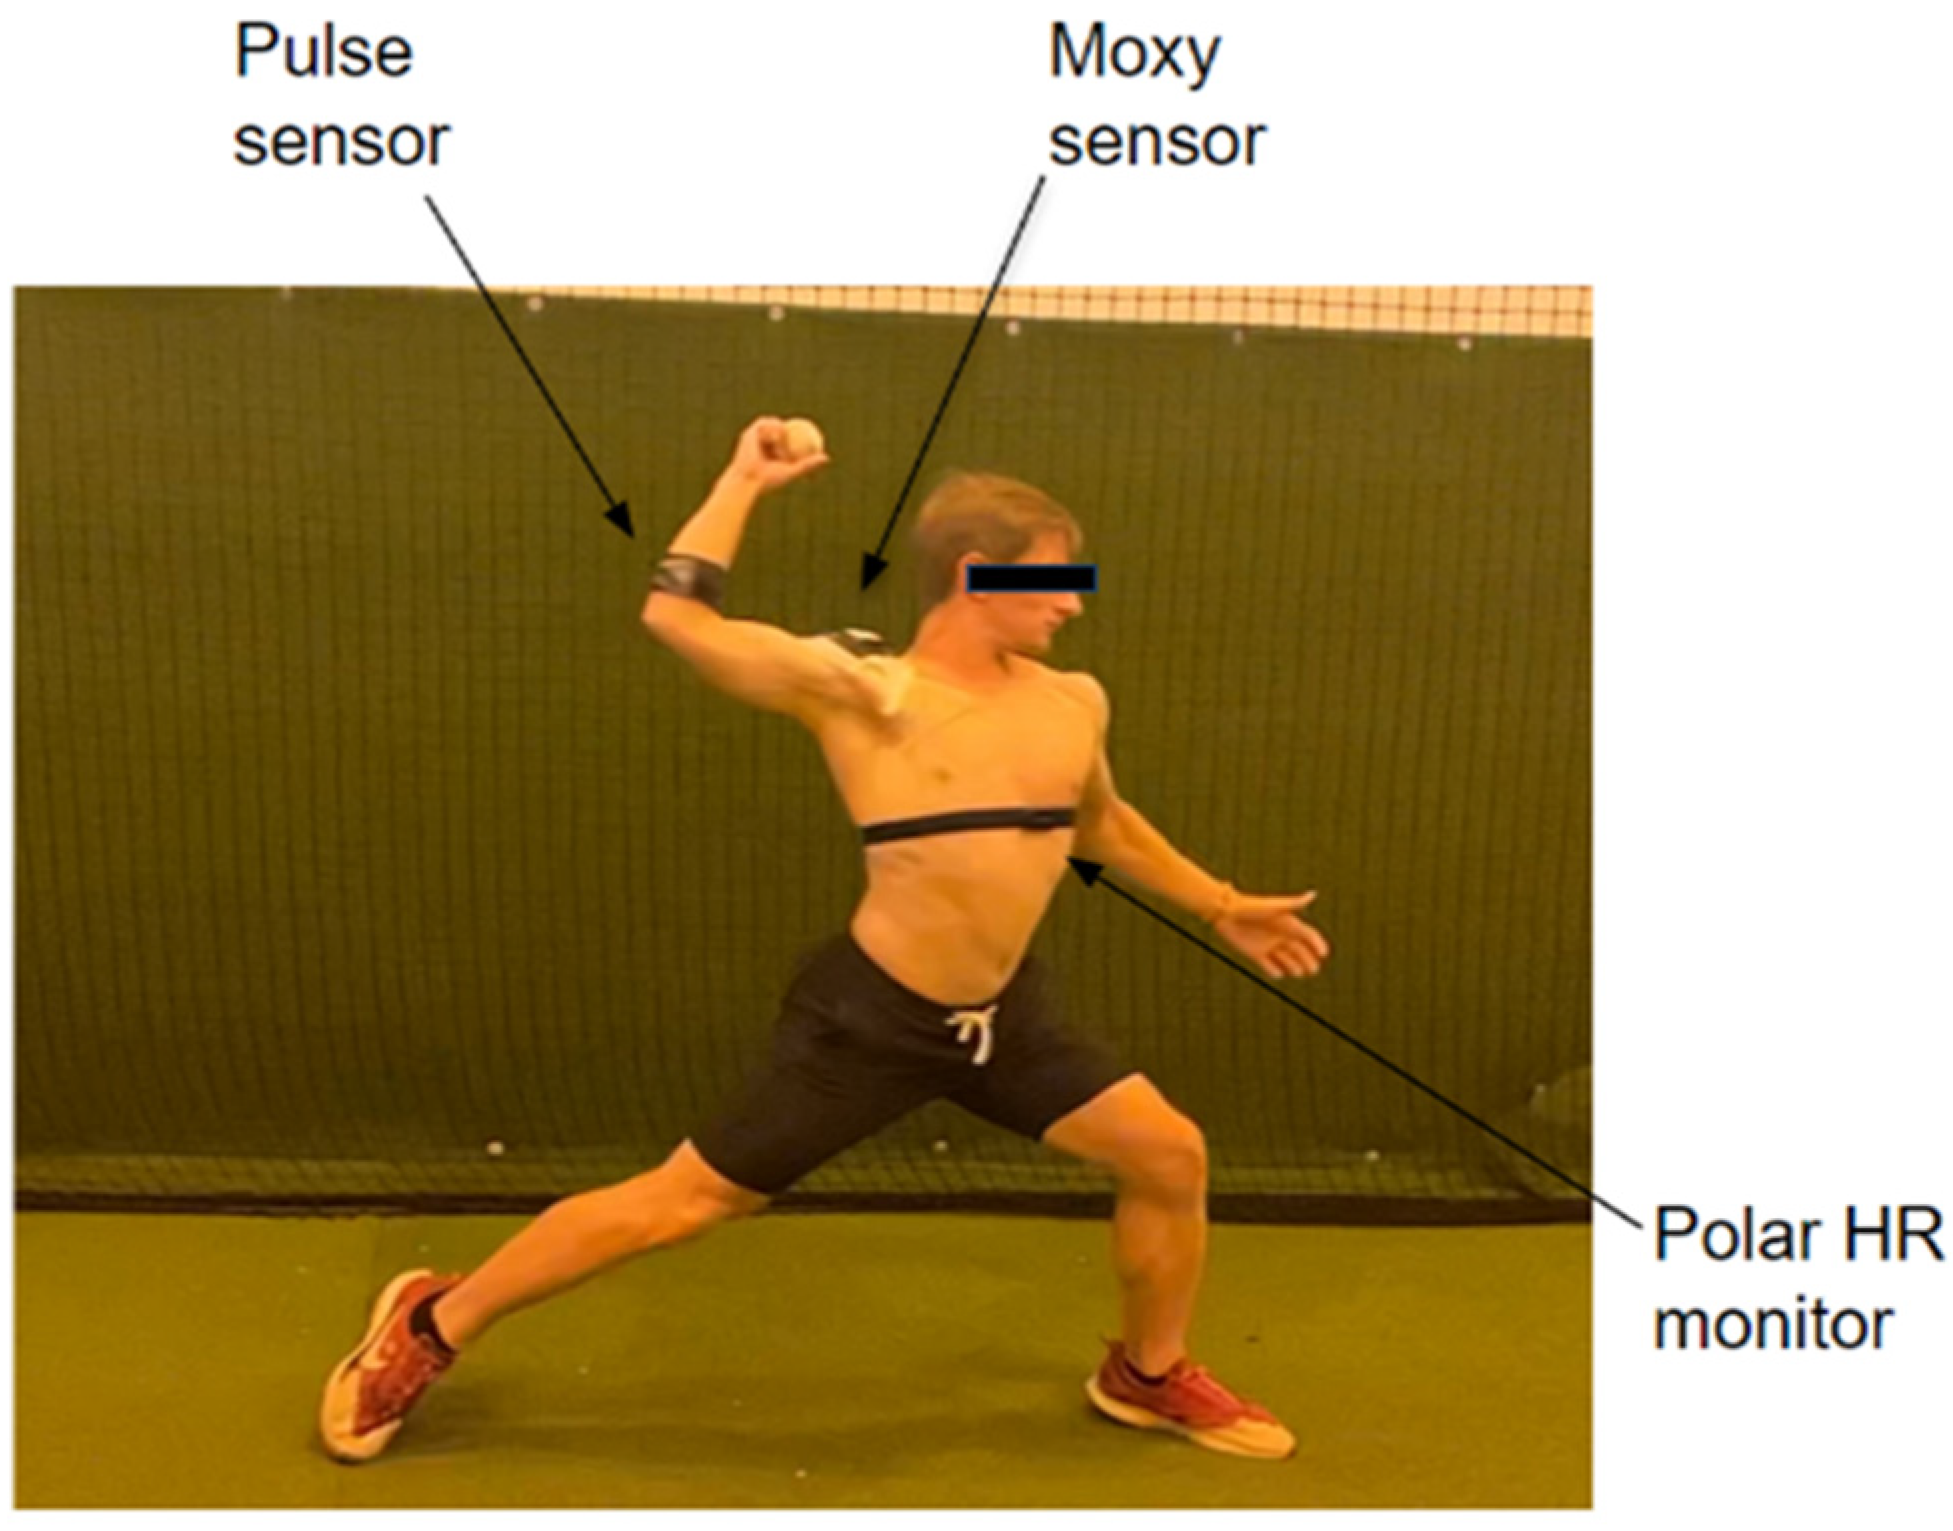
- Heart rate data to monitor physical exertion, based on the Polar 10 sensor.
- Muscle oxygen data on the anterior deltoid muscle based on the Moxy sensor
- Subjective ratings of perceived exertion.
2.2. Subject Recruitment
2.3. Data Collection
2.4. Exercise Protocol
- Throwing phase: Participants perform ten throws at “game” speed from the standard professional and collegiate pitching distance of 60 feet 6 inches.
- Exercise circuit: After the throws, participants complete a circuit of deltoid exercises using either a DriveLine resistance band or a 5 lb weighted disc. The exercises are Elevated Internal Rotation, Front Deltoid Raise, and Elevated External Rotation.
- Repetitions and sets: Each exercise is performed eight times, with no rest between sets. After completing the exercises, participants immediately begin another set of throws. This sequence is repeated two more times for a total of three sets.
- Heart rate monitoring: Participants’ heart rates are monitored using a Polar sensor to ensure active participation, with a target peak above 130 BPM.
- Effort level: Throws should be executed with more than 80% effort, reflecting game-like conditions from the participants’ perspectives.
3. Results
3.1. Arm Speed
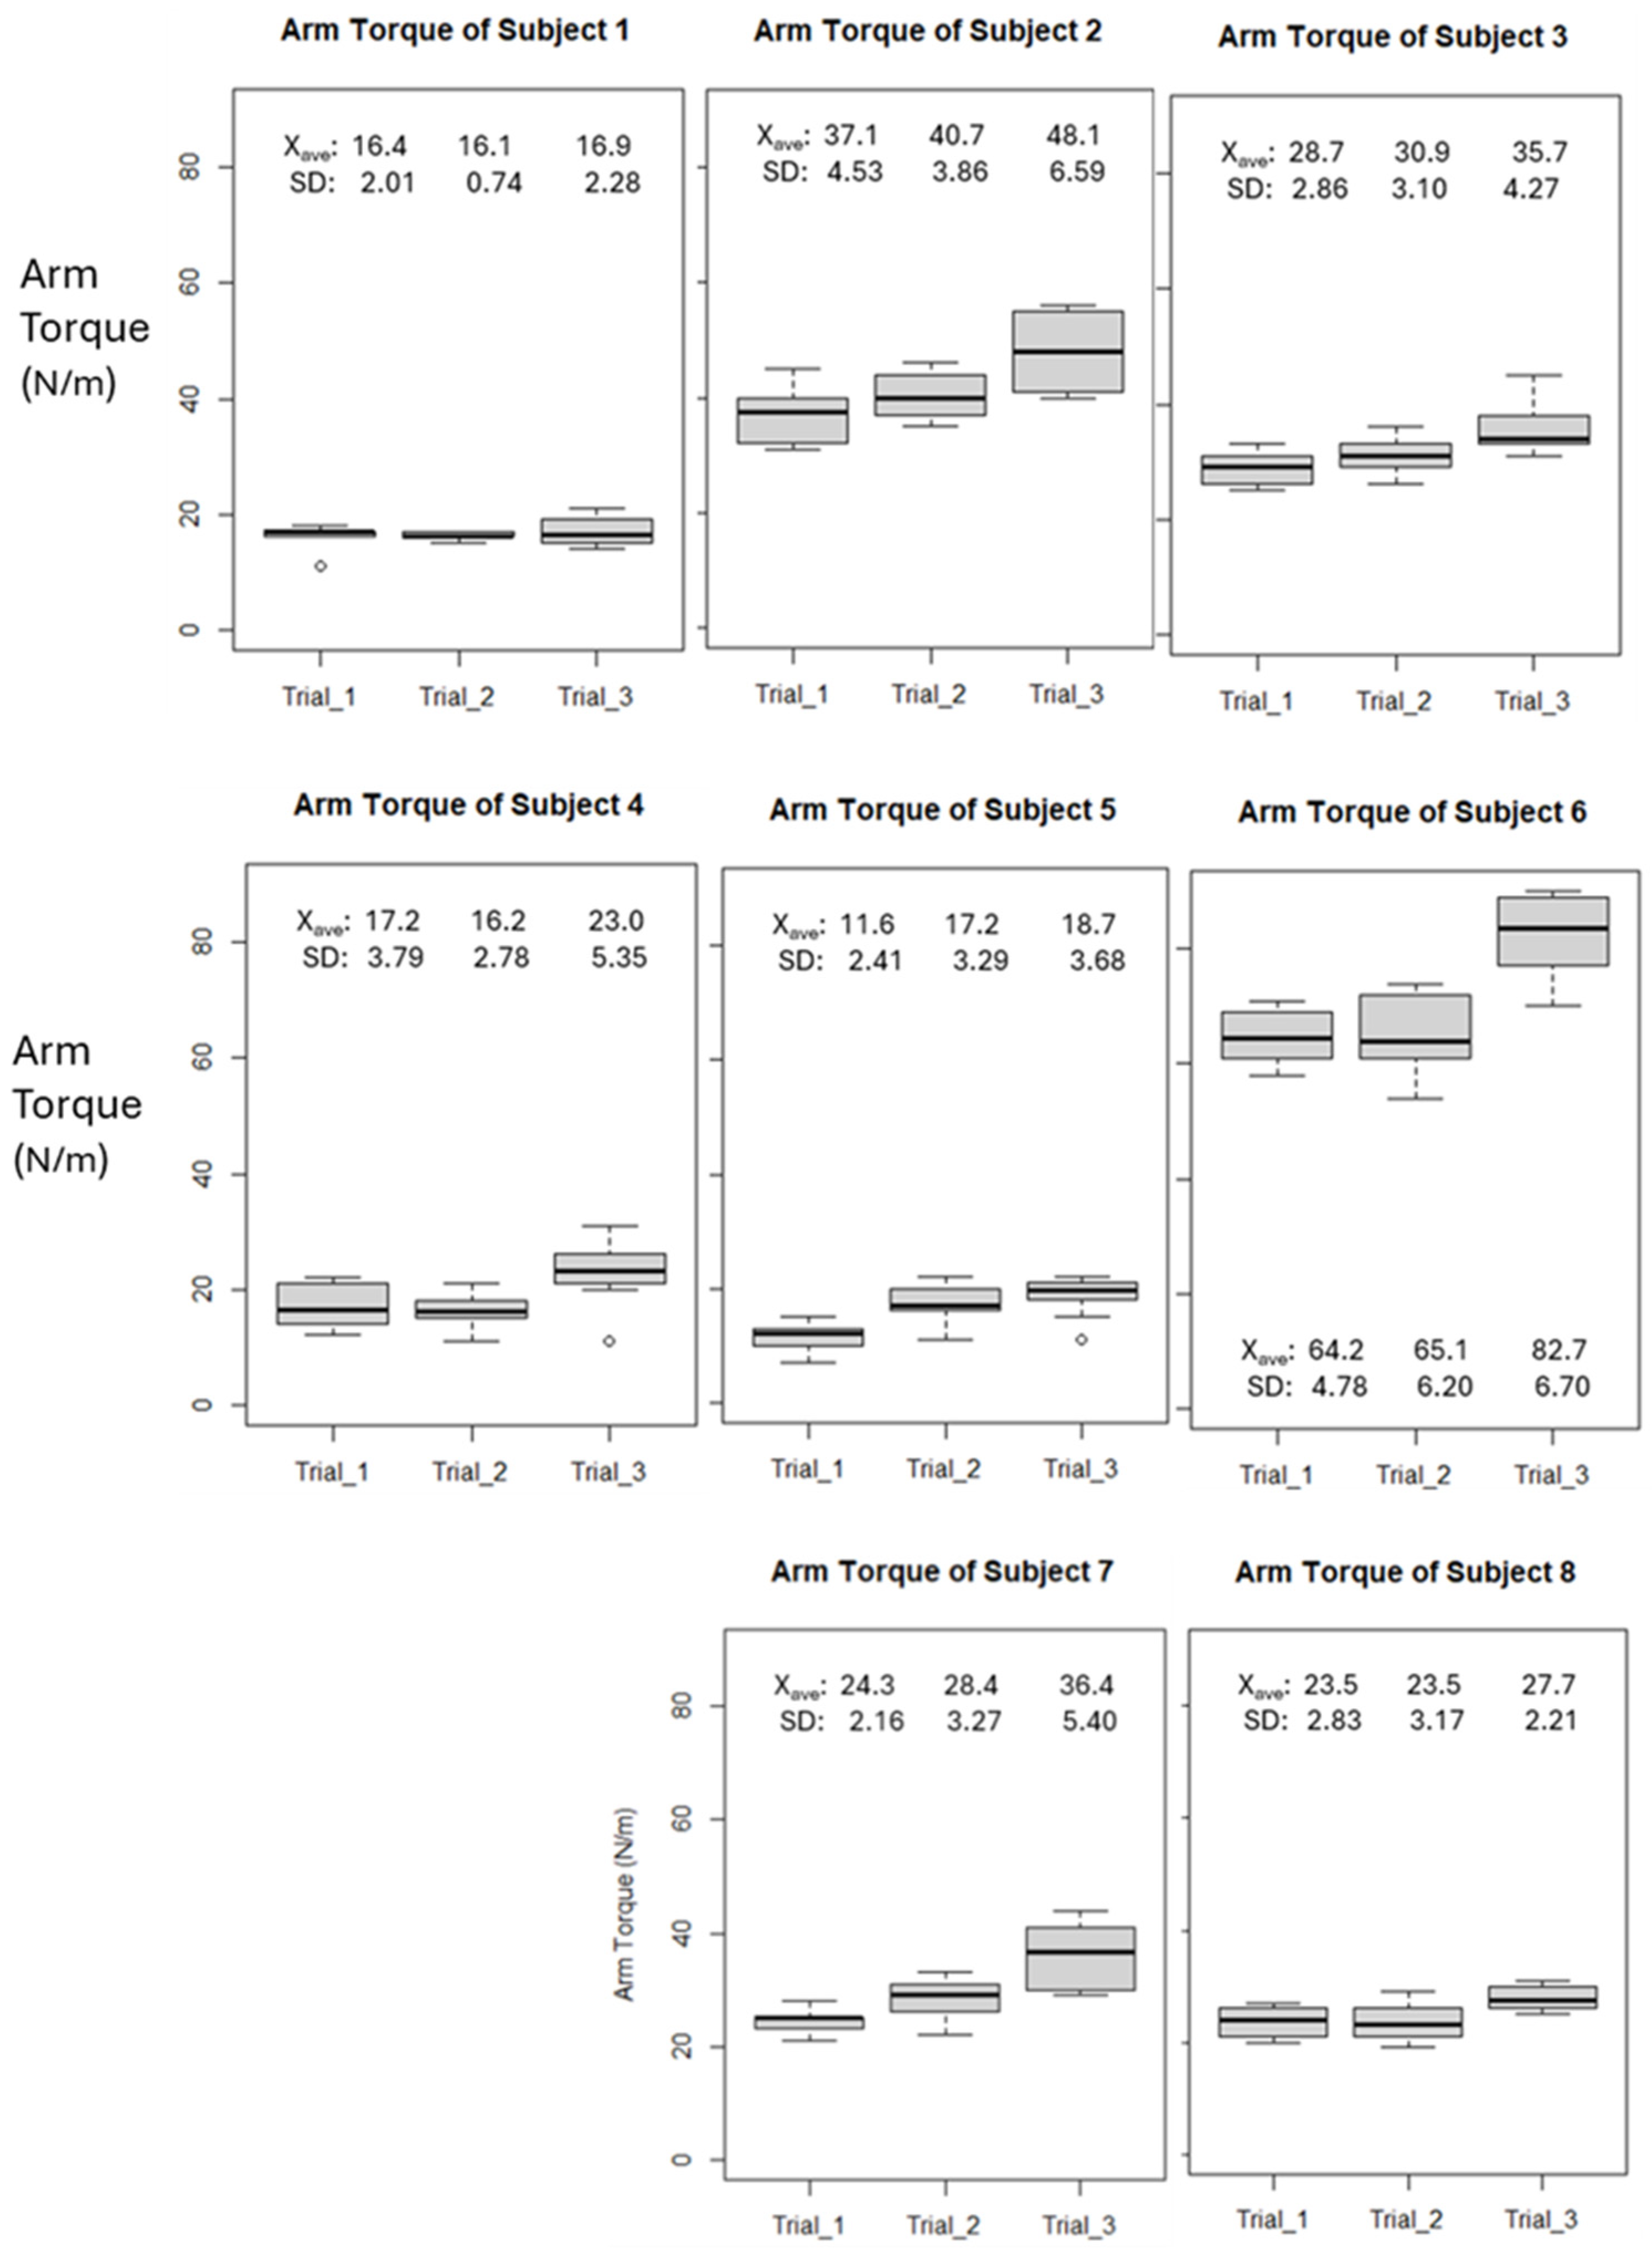
3.2. Arm Torque
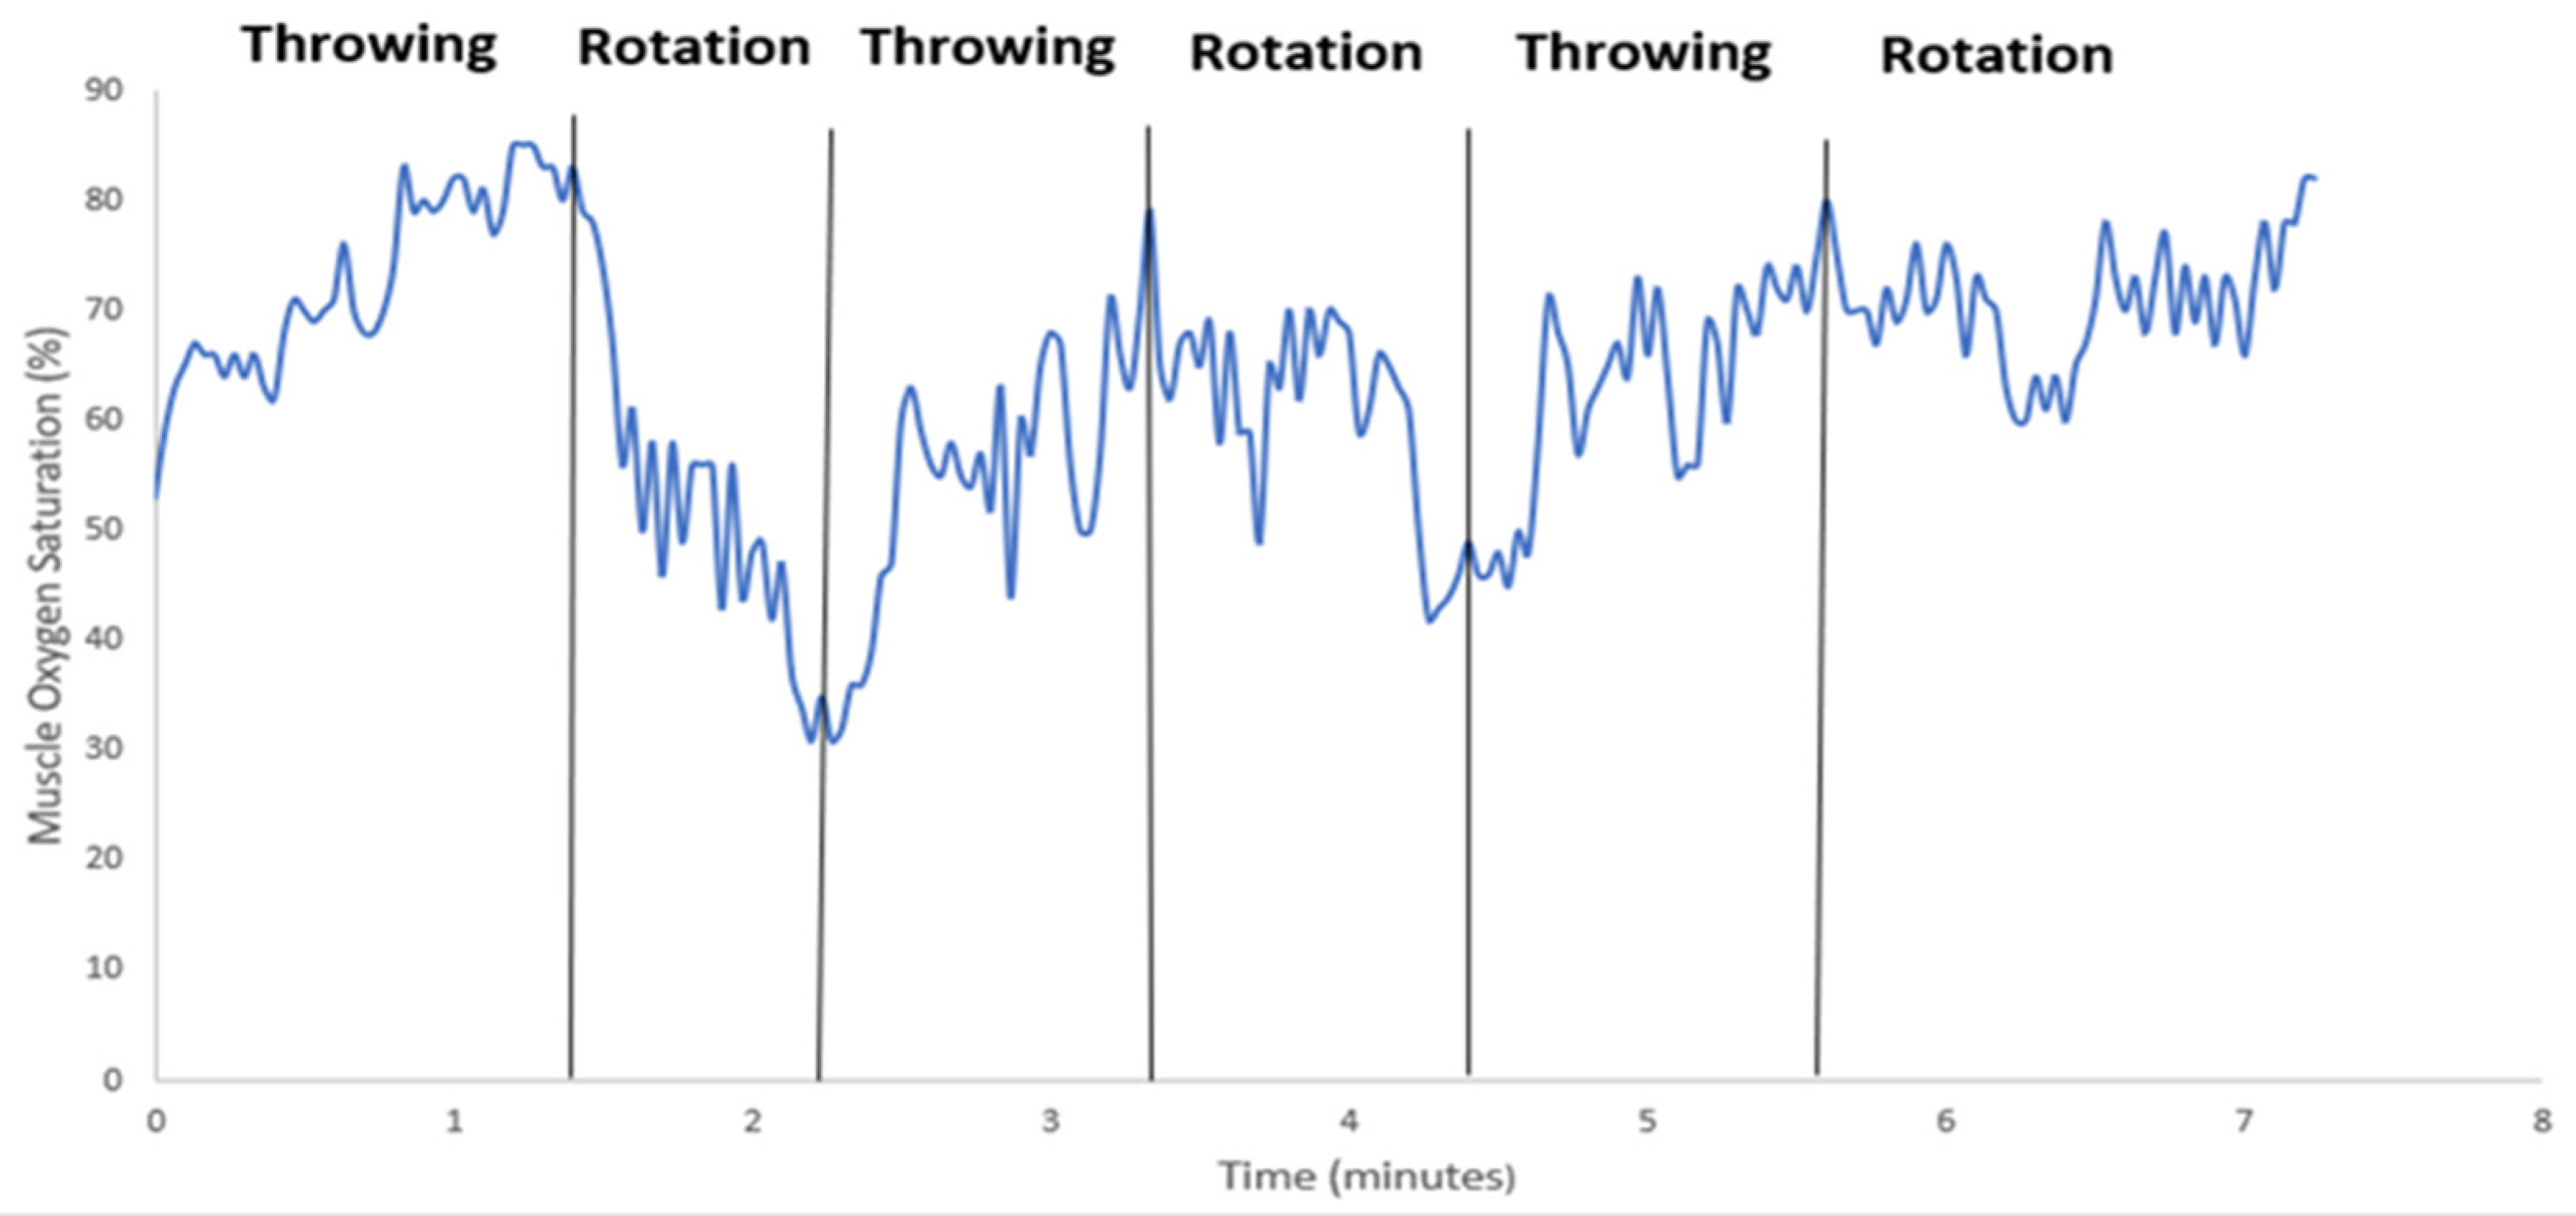
3.3. Muscle Oxygen Saturation
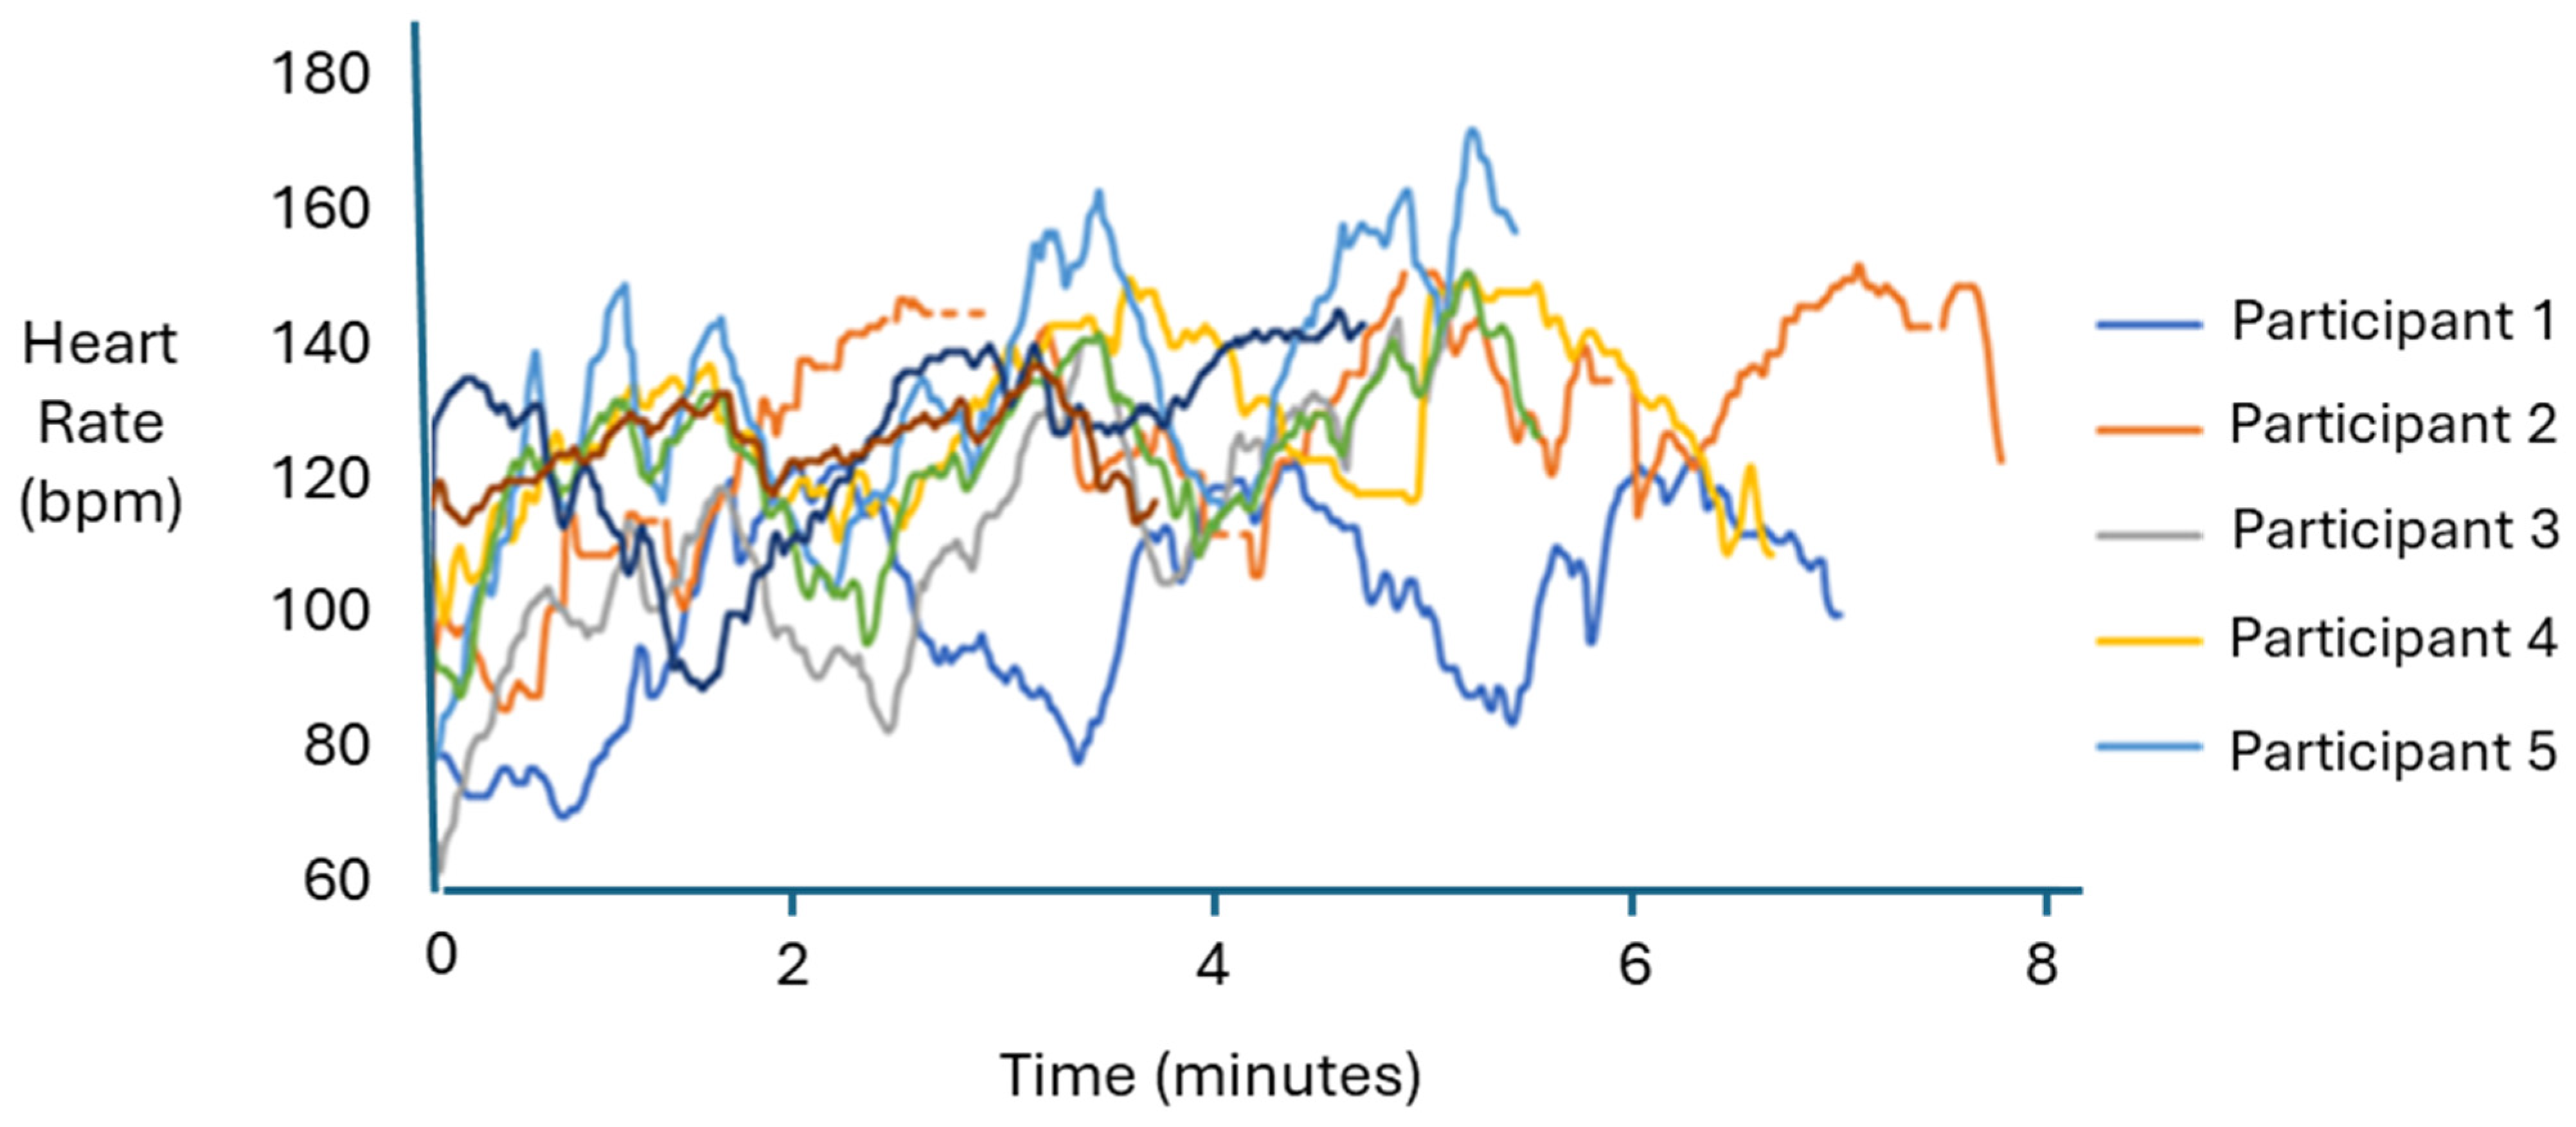
3.4. Heart Rate
4. Discussion
Future Work: Softball
5. Conclusions
Author Contributions
Funding
Institutional Review Board Statement
Informed Consent Statement
Data Availability Statement
Acknowledgments
Conflicts of Interest
References
- Zaremski, J.L.; McClelland, J.; Vincent, H.K.; Horodyski, M. Trends in Sports-Related Elbow Ulnar Collateral Ligament Injuries. Orthop. J. Sports Med. 2017, 5, 232596711773129. [Google Scholar] [CrossRef] [PubMed]
- Li, N.Y.; Goodman, A.D.; Lemme, N.J.; Owens, B.D. Epidemiology of Elbow Ulnar Collateral Ligament Injuries in Throwing Versus Contact Athletes of the National Collegiate Athletic Association: Analysis of the 2009–2010 to 2013–2014 Seasons. Orthop. J. Sports Med. 2019, 7, 232596711983642. [Google Scholar] [CrossRef]
- Erickson, B.J.; Nwachukwu, B.U.; Rosas, S.; Schairer, W.W.; McCormick, F.M.; Bach, B.R.; Bush-Joseph, C.A.; Romeo, A.A. Trends in Medial Ulnar Collateral Ligament Reconstruction in the United States: A Retrospective Review of a Large Private-Payer Database From 2007 to 2011. Am. J. Sports Med. 2015, 43, 1770–1774. [Google Scholar] [CrossRef]
- Osabahr, D.C.; Cain, L.; Andrews, J.R. Long-term outcomes after ulnar collateral ligament reconstruction in competitive baseball players: Minimum 10-Year Follow-up. Am. J. Sports Med. 2014, 42, 1333–1342. [Google Scholar] [CrossRef]
- Buffi, J.H.; Werner, K.; Kepple, T.; Murray, W.M. Computing muscle, ligament, and osseous contributions to the elbow varus moment during baseball pitching. Ann. Biomed. Eng. 2015, 43, 404–415. [Google Scholar] [CrossRef]
- Chen, A.Z.; Greaves, K.M.; Fortney, T.A.; Saltzman, B.M.; Trofa, D.P.; Ahmad, C.S. Psychological factors associated with return to play after ulnar collateral ligament reconstruction: A systematic review. Orthop. J. Sports Med. 2022, 10, 23259671221125746. [Google Scholar] [CrossRef]
- Rogers, D.; Tanaka, M.J.; Cosgarea, A.J.; Ginsburg, R.D.; Dreher, G.M. How Mental Health Affects Injury Risk and Outcomes in Athletes. Sports Health A Multidiscip. Approach 2023, 16, 222–229. [Google Scholar] [CrossRef]
- Bolling, C. How Elite Athletes, Coaches, and Physiotherapists Perceive a Sports Injury. Transl. Sports Med. 2018, 2, 17–23. [Google Scholar] [CrossRef]
- Martin, S.S. Psychological Risk Profile for Overuse Injuries in Sport: An Exploratory Study. J. Sports Sci. 2021, 39, 1926–1935. [Google Scholar] [CrossRef]
- Brewer, B.W. Psychological Responses to Sport Injury. Oxf. Res. Encycl. Psychol. 2017, 126–138. [Google Scholar] [CrossRef]
- Adesida, Y.; Papi, E.; McGregor, A.H. Exploring the role of wearable technology in sport kinematics and kinetics: A systematic review. Sensors 2019, 19, 1597. [Google Scholar] [CrossRef] [PubMed]
- Crum, E.M.; O’Connor, W.J.; Loo, L.; Valckx, M.; Stannard, S.R. Validity and reliability of the moxy oxygen monitor during Incremental Cycling Exercise. Eur. J. Sport Sci. 2017, 17, 1037–1043. [Google Scholar] [CrossRef] [PubMed]
- Paci, J.M.; Jones, C.M.; Yang, J.; Zhu, J.; Komatsu, D.; Flores, A.; Van Dyke, D. Predictive Value Of Preseason Screening In Collegiate Baseball Pitchers. Orthop. J. Sports Med. 2015, 3 (Suppl. 2), 2325967115S00148. [Google Scholar] [CrossRef]
- Hartzler, A.; Qian, A.; Rupert, D.; Sethi, M.; VanBibber, H.; Bova, T.; Seshadri, D.; Drummond, C. Modeling reality: Revisiting Calvert’s fitness simulation. In Proceedings of the 2021 Design of Medical Devices Conference (DMD2021), Virtual, 12–15 April 2021; Available online: https://www.ncbi.nlm.nih.gov/pmc/articles/PMC9066612/ (accessed on 14 December 2023).
- Seshadri, D.R.; Thom, M.L.; Harlow, E.R.; Gabbett, T.J.; Geletka, B.J.; Hsu, J.J.; Drummond, C.K.; Phelan, D.M.; Voos, J.E. Wearable Technology and analytics as a complementary toolkit to optimize workload and to reduce injury burden. Front. Sports Act. Living 2021, 2, 630576. [Google Scholar] [CrossRef]
- Barber, P.; Pontillo, M.; Bellm, E.; Davies, G. Objective and subjective measures to guide upper extremity return to sport testing: A modified Delphi survey. Phys. Ther. Sport 2023, 62, 17–24. [Google Scholar] [CrossRef] [PubMed]
- Li, R.T.; Kling, S.R.; Salata, M.J.; Cupp, S.A.; Sheehan, J.; Voos, J.E. Wearable Performance Devices in Sports Medicine. Sports Health A Multidiscip. Approach 2015, 8, 74–78. [Google Scholar] [CrossRef] [PubMed]
- Halson, S.; Peake, J.M.; Sullivan, J.P. Wearable Technology for Athletes: Information Overload and Pseudoscience? 2016. Available online: https://www.researchgate.net/profile/Shona-Halson/publication/320963222 (accessed on 14 December 2023).
- Preatoni, E.; Bergamini, E.; Fantozzi, S.; Giraud, L.I.; Bustos, A.S.O.; Vannozzi, G.; Camomilla, V. The use of wearable sensors for preventing, assessing, and informing recovery from sport-related musculoskeletal injuries: A systematic scoping review. Sensors 2022, 22, 3225. [Google Scholar] [CrossRef]
- Vandrico. Wearable Technology Database. Wearables Database. Available online: https://vandrico.com/wearables.html (accessed on 15 January 2021).
- Seckin, A.Ç.; Ateş, B.; Seçkin, M. Review on Wearable Technology in Sports: Concepts, Challenges and Opportunities. Appl. Sci. 2023, 13, 399. [Google Scholar] [CrossRef]
- Miranda, C.; Chirosa, L.J.; Guisado-Requena, I.M.; Floody, P.D.; Jérez-Mayorga, D. Changes in Muscle Oxygen Saturation Measured Using Wireless Near-Infrared Spectroscopy in Resistance Training: A Systematic Review. Int. J. Environ. Res. Public Health 2021, 18, 4293. [Google Scholar] [CrossRef]
- Feldmann, A.; Schmitz, R.; Erlacher, D. Near-infrared spectroscopy-derived muscle oxygen saturation on a 0% to 100% scale: Reliability and validity of the Moxy Monitor. J. Biomed. Opt. 2019, 24, 115001. [Google Scholar] [CrossRef]
- Scholkmann, F.; Scherer-Vrana, A. Comparison of Two NIRS Tissue Oximeters (Moxy and Nimo) for Non-Invasive Assessment of Muscle Oxygenation and Perfusion. Adv. Exp. Med. Biol. 2020, 1232, 253–259. [Google Scholar] [CrossRef] [PubMed]
- Koda, H.; Sagawa, K.; Kuroshima, K.; Tsukamoto, T.; Urita, K.; Ishibashi, Y. 3D Measurement of Forearm and Upper Arm during Throwing Motion using Body Mounted Sensor. J. Adv. Mech. Des. Syst. Manuf. 2010, 4, 167–178. [Google Scholar] [CrossRef]
- Lapinski, M.; Berkson, E.; Gill, T.; Reinold, M.; Paradiso, J.A. A Distributed Wearable, Wireless Sensor System for Evaluating Professional Baseball Pitchers and Batters. In Proceedings of the 2009 International Symposium on Wearable Computers, Linz, Austria, 4–7 September 2009; pp. 131–138. [Google Scholar] [CrossRef]
- Camp, C.L.; Tubbs, T.G.; Fleisig, G.S.; Dines, J.S.; Dines, D.M.; Altchek, D.W.; Dowling, B. The Relationship of Throwing Arm Mechanics and Elbow Varus Torque: Within-Subject Variation for Professional Baseball Pitchers Across 82,000 Throws. Am. J. Sports Med. 2017, 45, 3030–3035. [Google Scholar] [CrossRef] [PubMed]
- Dowling, B.; Brusalis, C.M.; Streepy, J.T.; Hodakowski, A.; Pauley, P.J.; Heidloff, D.; E Garrigues, G.; Verma, N.N.; Fleisig, G.S. Workload Comparison of Contemporary Interval Throwing Programs and a Novel Optimized Program for Baseball Pitchers. Int. J. Sports Phys. Ther. 2024, 19, 176–188. [Google Scholar] [CrossRef] [PubMed]
- Reinold, M.M.; Dowling, B.; Fleisig, G.S.; Macrina, L.C.; Wilk, K.E.; Streepy, J.T.; Andrews, J.R. An Interval Throwing Program for Baseball Pitchers Based upon Workload Data. Int. J. Sports Phys. Ther. 2024, 19, 326–336. [Google Scholar] [CrossRef]
- Cage, S.; Volpi, J.; Jacobsen, A.; Galbraith, R. Competitive Baseball Pitchers’ Use of Wearable Technology. Res. Inves. Sports Med. 2022, 9, 702. [Google Scholar] [CrossRef]
- Achten, J.; Jeukendrup, A.E. Heart rate monitoring: Applications and limitations. Sports Med. 2003, 33, 517–538. [Google Scholar] [CrossRef] [PubMed]
- Muggeridge, D.J.; Hickson, K.; Davies, A.V.; Giggins, O.M.; Megson, I.L.; Gorely, T.; Crabtree, D.R. Measurement of Heart Rate Using the Polar OH1 and Fitbit Charge 3 Wearable Devices in Healthy Adults During Light, Moderate, Vigorous, and Sprint-Based Exercise: Validation Study. JMIR Mhealth Uhealth 2021, 9, e25313. [Google Scholar] [CrossRef] [PubMed]
- R Core Team. R: The R Project for Statistical Computing. Available online: https://www.r-project.org/ (accessed on 18 May 2024).
- Lear, A.; Patel, N. Softball Pitching and Injury. Curr. Sports Med. Rep. 2016, 15, 336–341. [Google Scholar] [CrossRef]
- Paul, J.; Brown, S.M.; Mulcahey, M.K. Injury Prevention Programs for Throwing Injuries in Softball Players: A Systematic Review. Sports Health A Multidiscip. Approach 2021, 13, 390–395. [Google Scholar] [CrossRef]
- Swindell, H.W.; Trofa, D.P.; Alexander, F.J.; Sonnenfeld, J.J.; Saltzman, B.M.; Ahmad, C.S. Nonsurgical Management of Ulnar Collateral Ligament Injuries. JAAOS Glob. Res. Rev. 2021, 5, e20.00257. [Google Scholar] [CrossRef] [PubMed]
- Lin, K.M.; Ellenbecker, T.S.; Safran, M.R. Rehabilitation and Return to Sport Following Elbow Injuries. Arthrosc. Sports Med. Rehabil. 2022, 4, e1245–e1251. [Google Scholar] [CrossRef] [PubMed]


| Exercise | Description |
|---|---|
| A. Warm-up |
|
| B. Throws |
|
| C. Deltoid circuit |
|
| D. Throws |
|
| E. Deltoid circuit |
|
| F. Throws |
|
| G. Deltoid circuit |
|
| Participant | Position | Weight | Height | Year |
|---|---|---|---|---|
| Subject 1 | Center | 185 lb | 5′11″ | 2 |
| Subject 2 | Left-handed pitcher | 190 lb | 5′11″ | 3 |
| Subject 3 | Left-handed pitcher | 185 lb | 6′0″ | 2 |
| Subject 4 | Right-handed pitcher | 187 lb | 5′10″ | 4 |
| Subject 5 | Right-handed pitcher | 200 lb | 6′5″ | 3 |
| Subject 6 | Center | 195 lb | 6′0″ | 1 |
| Subject 7 | Right-handed pitcher | 190 lb | 5′9″ | 3 |
| Subject 8 | Outfield | 205 lb | 6′3″ | 2 |
| Subject | Player Position | m, from Regression | End-Point % Change |
|---|---|---|---|
| 1 | Center | 0.3 | 3.1 |
| 2 | Pitcher | 5.5 | 29.7 |
| 3 | Pitcher | 3.5 | 24.4 |
| 4 | Pitcher | 2.9 | 33.7 |
| 5 | Pitcher | 3.5 | 61.2 |
| 6 | Center | 9.0 | 27.8 |
| 7 | Pitcher | 6.1 | 49.8 |
| 8 | Outfield | 2.1 | 17.9 |
| Mean= | 4.1 | 30.9 |
Disclaimer/Publisher’s Note: The statements, opinions and data contained in all publications are solely those of the individual author(s) and contributor(s) and not of MDPI and/or the editor(s). MDPI and/or the editor(s) disclaim responsibility for any injury to people or property resulting from any ideas, methods, instructions or products referred to in the content. |
© 2024 by the authors. Licensee MDPI, Basel, Switzerland. This article is an open access article distributed under the terms and conditions of the Creative Commons Attribution (CC BY) license (https://creativecommons.org/licenses/by/4.0/).
Share and Cite
Gorti, B.; Stephenson, C.; Sethi, M.; Gross, K.; Ramos, M.; Seshadri, D.; Drummond, C.K. Overarm Training Tolerance: A Pilot Study on the Use of Muscle Oxygen Saturation as a Biomarker. Sensors 2024, 24, 4710. https://doi.org/10.3390/s24144710
Gorti B, Stephenson C, Sethi M, Gross K, Ramos M, Seshadri D, Drummond CK. Overarm Training Tolerance: A Pilot Study on the Use of Muscle Oxygen Saturation as a Biomarker. Sensors. 2024; 24(14):4710. https://doi.org/10.3390/s24144710
Chicago/Turabian StyleGorti, Bhargav, Connor Stephenson, Maia Sethi, KaiLi Gross, Mikaela Ramos, Dhruv Seshadri, and Colin K. Drummond. 2024. "Overarm Training Tolerance: A Pilot Study on the Use of Muscle Oxygen Saturation as a Biomarker" Sensors 24, no. 14: 4710. https://doi.org/10.3390/s24144710