
DDP-FedFV: A Dual-Decoupling Personalized Federated Learning Framework for Finger Vein Recognition

Abstract
:1. Introduction
2. Related Work
2.1. Finger Vein Recognition
2.2. Finger Vein Recognition Based on Federated Learning
3. Methodology
3.1. Problem Description
3.2. Framework of the DDP-FedFV Method
| Algorithm 1. DDP-FedFV |
| , generalization ratio
|
| Generalization Phase Server executes: for t = 0, 1, ……, (Tg − 1) do |
| for each client k parallel do always stored locally without communication. for this round t through Equation (6) and send it to all clients. |
| Personalization Phase Server executes: Use FedPWRR to compute the weight matrix W for t = Tg, ……, T do for each client k parallel do always stored locally without communication. for each client k parallel do through Equation (8) to client k and simultaneously update the parameters. ): //run for Client k for each local epoch do |
3.3. The First Phase of the DDP-FedFV Method
3.4. The Second Phase of the DDP-FedFV Method
| Algorithm 2. FedPWRR |
| , weights assigned to clients with negative similarity r, base weight scaling factor for each client rr Initialize Two empty matrices s and W0 to store the results of intermediate calculations |
| Server executes: Step 1: Obtain (e1, e2, ……, eN) via the trans operation based on (M1, M2, ……, MN). |
| uploaded for each finger vein client, and a symmetric similarity matrix is obtained using the cosine similarity assessment algorithm. Step 3: for each client k parallel do The total number of negative clients is counted as cnt. for i-th client with negative similarity with client k do for j-th client with positive similarity with client k do set s[k][k] = 1 and then let s[k] = trans(s[k]) Then, W0[k] = trans((e1, e2, ……, eN)○s[k]) Step 4: The individual weights of the final personalized aggregation matrix can be calculated using the following equation: |
Return the weight matrix W |
4. Convergence Analysis
- μ strongly convex of Lk
- Jensen inequality
- [32]
- B-local dissimilarity [32]
5. Experiments
5.1. Datasets and Verification Method
5.2. Evaluation Metrics
5.3. Experimental Results and Analysis
6. Conclusions
Author Contributions
Funding
Institutional Review Board Statement
Informed Consent Statement
Data Availability Statement
Acknowledgments
Conflicts of Interest
Appendix A. Proof of Convergence
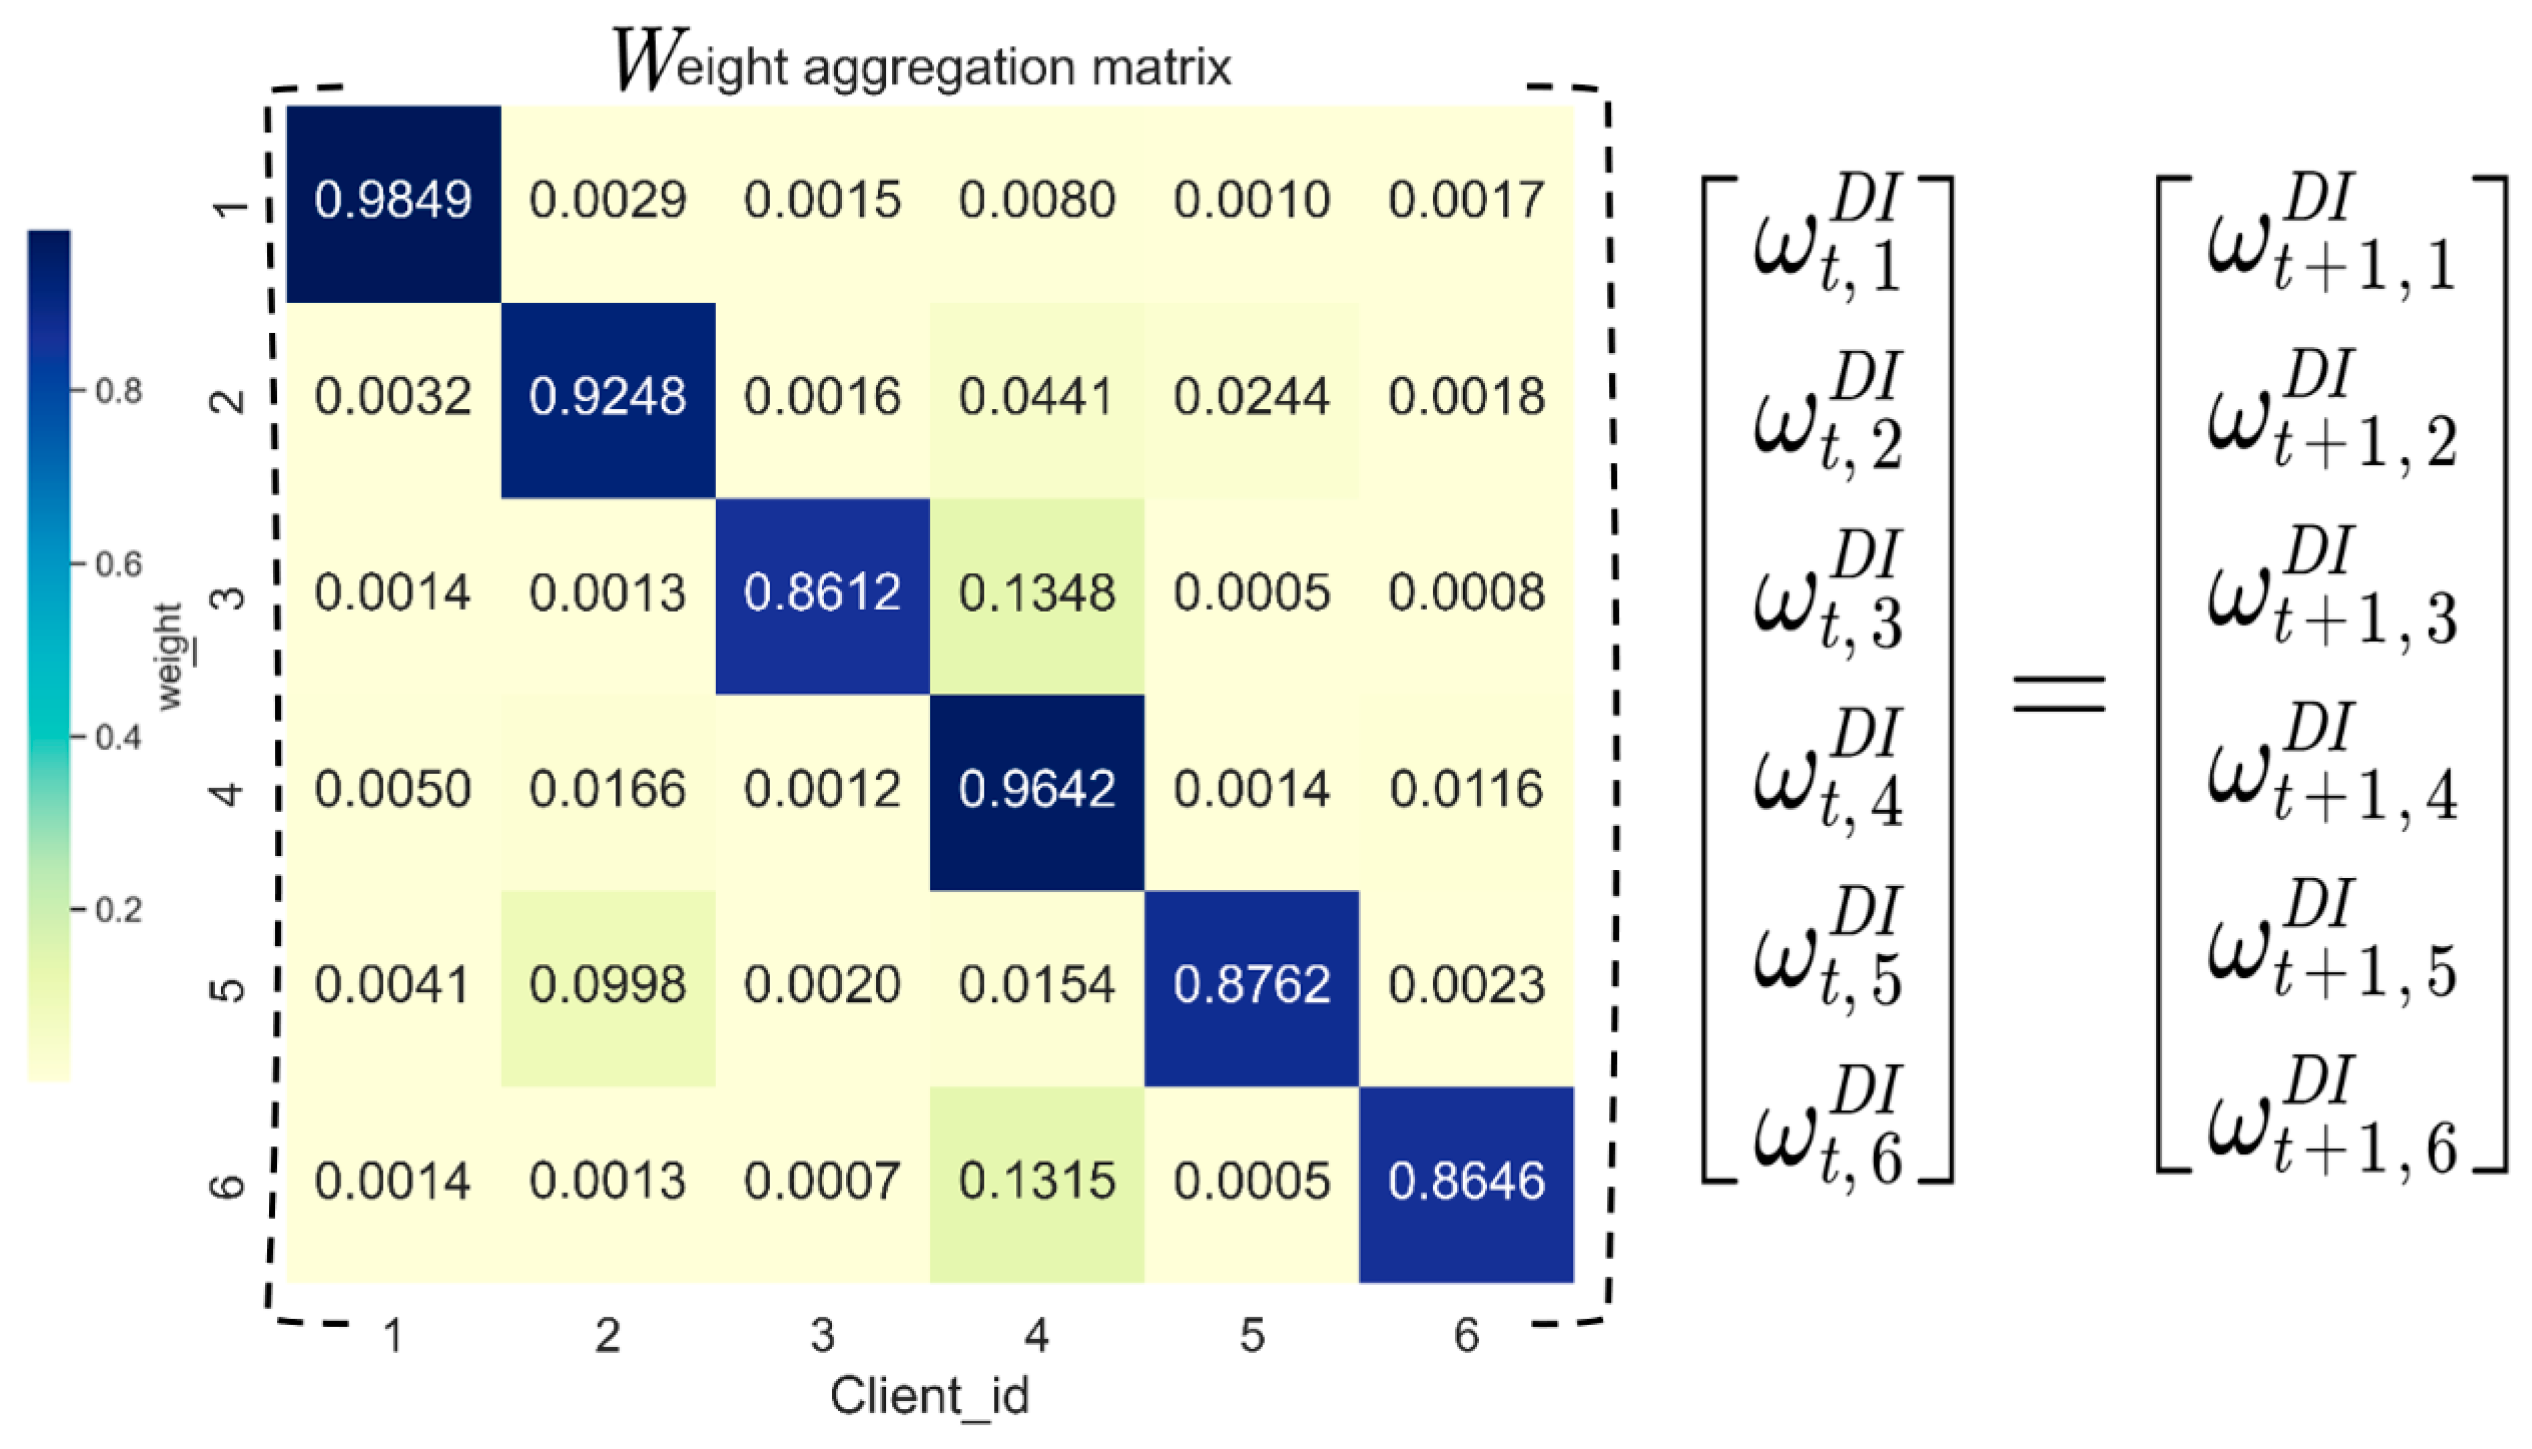
Appendix B. The Aggregation Weight Matrix in the Experiments
References
- Zhang, Y.; Liu, Z. Research on Finger Vein Recognition Based on Sub-Convolutional Neural Network. In Proceedings of the International Conference on Computer Network, Electronic and Automation (ICCNEA), Xi’an, China, 25–27 September 2020. [Google Scholar]
- Wan, Z.C.; Chen, L.; Wang, T.; Wan, G.C. An Optimization Algorithm to Improve the Accuracy of Finger Vein Recognition. IEEE Access 2022, 10, 127440–127449. [Google Scholar] [CrossRef]
- Al-Obaidy, N.A.I.; Mahmood, B.S.; Alkababji, A.M.F. Finger Veins Verification by Exploiting the Deep Learning Technique. Ing. Syst. Inf. 2022, 27, 923–931. [Google Scholar] [CrossRef]
- Yang, H.; Fang, P.; Hao, Z. A GAN-Based Method for Generating Finger Vein Dataset. In Proceedings of the 2020 3rd International Conference on Algorithms, Computing and Artificial Intelligence (ACAI), Sanya, China, 24–26 December 2020. [Google Scholar]
- Zhang, J.; Lu, Z.; Li, M.; Wu, H. GAN-Based Image Augmentation for Finger-Vein Biometric Recognition. IEEE Access 2019, 7, 183118–183132. [Google Scholar] [CrossRef]
- Stallings, W. Handling of Personal Information and Deidentified, Aggregated, and Pseudonymized Information Under the California Consumer Privacy Act. IEEE Secur. Priv. 2020, 18, 61–64. [Google Scholar] [CrossRef]
- Goldman, E. An Introduction to the California Consumer Privacy Act (CCPA). SSRN Electron. J. 2018. Available online: https://ssrn.com/abstract=3211013 (accessed on 1 July 2024). [CrossRef]
- Bygrave, L.A. Article 25 Data Protection by Design and by Default. In The EU General Data Protection Regulation (GDPR); Oxford University Press: Oxford, UK, 2020. [Google Scholar]
- Drev, M.; Delak, B. Conceptual Model of Privacy by Design. J. Comput. Inf. Syst. 2022, 62, 888–895. [Google Scholar] [CrossRef]
- Liu, C.-T.; Wang, C.-Y.; Chien, S.-Y.; Lai, S.-H. FedFR: Joint Optimization Federated Framework for Generic and Personalized Face Recognition. In Proceedings of the AAAI Conference on Artificial Intelligence, Vancouver, BC, Canada, 22 February–1 March 2022. [Google Scholar]
- Aggarwal, D.; Zhou, J.; Jain, A.K. FedFace: Collaborative Learning of Face Recognition Model. In Proceedings of the 2021 IEEE International Joint Conference on Biometrics (IJCB), Shenzhen, China, 4–7 August 2021. [Google Scholar]
- Niu, Y.; Deng, W. Federated Learning for Face Recognition with Gradient Correction. In Proceedings of the AAAI Conference on Artificial Intelligence, Vancouver, BC, Canada, 22 February–1 March 2022. [Google Scholar]
- Meng, Q.; Zhou, F.; Ren, H.; Feng, T.; Liu, G.; Lin, Y. Improving Federated Learning Face Recognition via Privacy-Agnostic Clusters. arXiv 2022, arXiv:2201.12467. [Google Scholar]
- Shao, R.; Perera, P.; Yuen, P.C.; Patel, V.M. Federated Generalized Face Presentation Attack Detection. IEEE Trans. Neural Netw. Learn. Syst. 2022, 35, 103–116. [Google Scholar] [CrossRef] [PubMed]
- Gupta, H.; Rajput, T.K.; Vyas, R.; Vyas, O.P.; Puliafito, A. Biometric Iris Identifier Recognition with Privacy Preserving Phenomenon: A Federated Learning Approach. In Proceedings of the Communications in Computer and Information Science, Neural Information Processing, New Delhi, India, 22–26 November 2023. [Google Scholar]
- Luo, Z.; Wang, Y.; Wang, Z.; Sun, Z.; Tan, T. FedIris: Towards More Accurate and Privacy-Preserving Iris Recognition via Federated Template Communication. In Proceedings of the Computer Vision and Pattern Recognition Conference (CVPR), New Orleans, LA, USA, 18–24 June 2022. [Google Scholar]
- Lian, F.-Z.; Huang, J.-D.; Liu, J.-X.; Chen, G.; Zhao, J.-H.; Kang, W.-X. FedFV: A Personalized Federated Learning Framework for Finger Vein Authentication. Mach. Intell. Res. 2023, 20, 683–696. [Google Scholar] [CrossRef]
- Wu, J.-D.; Ye, S.-H. Driver Identification Using Finger-Vein Patterns with Radon Transform and Neural Network. Expert. Syst. Appl. 2009, 36, 5793–5799. [Google Scholar] [CrossRef]
- Miura, N.; Nagasaka, A.; Miyatake, T. Feature Extraction of Finger-Vein Patterns Based on Repeated Line Tracking and Its Application to Personal Identification. Mach. Vis. Appl. 2004, 15, 194–203. [Google Scholar] [CrossRef]
- Miura, N.; Nagasaka, A.; Miyatake, T. Extraction of Finger-Vein Patterns Using Maximum Curvature Points in Image Profiles. Mach. Vis. Appl. 2005, E90-D, 1185–1194. [Google Scholar] [CrossRef]
- Kumar, A.; Zhou, Y. Human Identification Using Finger Images. IEEE Trans. Image Process 2012, 21, 2228–2244. [Google Scholar] [CrossRef] [PubMed]
- Liu, W.; Li, W.; Sun, L.; Zhang, L.; Chen, P. Finger Vein Recognition Based on Deep Learning. In Proceedings of the 2017 12th IEEE Conference on Industrial Electronics and Applications (ICIEA), Siem Reap, Cambodia, 18–20 June 2017. [Google Scholar]
- Azmat, F.; Li, P.; Wu, Z.; Zhang, J.; Chen, C. A Finger Vein Recognition Algorithm Based on Deep Learning. Int. J. Embed. Syst. 2017, 9, 220. [Google Scholar] [CrossRef]
- Abbas, T. Finger Vein Recognition with Hybrid Deep Learning Approach. J. La Multiapp 2023, 4, 23–33. [Google Scholar] [CrossRef]
- Ma, X.; Luo, X. Finger Vein Recognition Method Based on Ant Colony Optimization and Improved EfficientNetV2. Math. Biosci. Eng. 2023, 20, 11081–11100. [Google Scholar] [CrossRef]
- McMahan, H.B.; Moore, E.; Ramage, D.; Hampson, S.; Arcas, B. Communication-Efficient Learning of Deep Networks from Decentralized Data. arXiv 2016, arXiv:1602.05629. [Google Scholar]
- Arivazhagan, M.; Aggarwal, V.; Singh, A.; Choudhary, S. Federated Learning with Personalization Layers. arXiv 2019, arXiv:1912.00818. [Google Scholar]
- Collins, L.; Hassani, H.; Mokhtari, A.; Shakkottai, S. Exploiting Shared Representations for Personalized Federated Learning. arXiv 2021, arXiv:2102.07078. [Google Scholar]
- Howard, A.; Sandler, M.; Chen, B.; Wang, W.; Chen, L.-C.; Tan, M.; Chu, G.; Vasudevan, V.; Zhu, Y.; Pang, R.; et al. Searching for MobileNetV3. In Proceedings of the 2019 IEEE/CVF International Conference on Computer Vision (ICCV), Seoul, Republic of Korea, 27 October–2 November 2019. [Google Scholar]
- Liu, W.; Wen, Y.; Yu, Z.; Yang, M. Large-Margin Softmax Loss for Convolutional Neural Networks. arXiv 2017, arXiv:1612.02295. [Google Scholar]
- Lu, Y.; Xie, S.J.; Yoon, S.; Wang, Z.; Park, D.S. An Available Database for the Research of Finger Vein Recognition. In Proceedings of the 2013 6th International Congress on Image and Signal Processing (CISP), Hangzhou, China, 16–18 December 2013. [Google Scholar]
- Li, T.; Sahu, A.; Zaheer, M.; Sanjabi, M.; Talwalkar, A.; Smith, V. Federated Optimization in Heterogeneous Networks. arXiv 2018, arXiv:1812.06127. [Google Scholar]
- Yin, Y.; Liu, L.; Sun, X. SDUMLA-HMT: A Multimodal Biometric Database. In Proceedings of the Biometric Recognition, Lecture Notes in Computer Science (CCBR), Beijing, China, 3–4 December 2011. [Google Scholar]
- Ren, H.; Sun, L.; Guo, J.; Han, C. A Dataset and Benchmark for Multimodal Biometric Recognition Based on Fingerprint and Finger Vein. IEEE Trans. Inf. Forensics Secur. 2022, 17, 2030–2043. [Google Scholar] [CrossRef]
- Tome, P.; Vanoni, M.; Marcel, S. On the Vulnerability of Finger Vein Recognition to Spoofing. In Proceedings of the 2014 International Conference of the Biometrics Special Interest Group (BIOSIG), Darmstadt, Germany, 10–12 September 2014. [Google Scholar]
- Ton, B.T.; Veldhuis, R.N.J. A High Quality Finger Vascular Pattern Dataset Collected Using a Custom Designed Capturing Device. In Proceedings of the 2013 International Conference on Biometrics (ICB), Madrid, Spain, 4–7 June 2013. [Google Scholar]
- Mu, H.; Guo, J.; Han, C.; Sun, L. PAFedFV: Personalized and Asynchronous Federated Learning for Finger Vein Recognition. arXiv 2024, arXiv:2404.13237. [Google Scholar]
- Huang, Y.; Wang, J.; Li, P.; Xiang, L.; Li, P.; He, Z. Generative Iris Prior Embedded Transformer for Iris Restoration. In Proceedings of the 2023 IEEE International Conference on Multimedia and Expo (ICME), Brisbane, Australia, 10–14 July 2023. [Google Scholar]
- Alonso-Fernandez, F.; Farrugia, R.A.; Bigun, J.; Fierrez, J.; Gonzalez-Sosa, E. A survey of super-resolution in iris biometrics with evaluation of dictionary-learning. IEEE Access 2018, 7, 6519–6544. [Google Scholar] [CrossRef]
- Liu, J.; Qin, H.; Wu, Y.; Liang, D. Anchorface: Boosting tar@far for practical face recognition. In Proceedings of the AAAI Conference on Artificial Intelligence, Vancouver, BC, Canada, 22 February–1 March 2022. [Google Scholar]
- Selvaraju, R.R.; Cogswell, M.; Das, A.; Vedantam, R.; Parikh, D.; Batra, D. Grad-CAM: Visual Explanations from Deep Networks via Gradient-Based Localization. In Proceedings of the 2017 IEEE International Conference on Computer Vision (ICCV), Venice, Italy, 22–29 October 2017. [Google Scholar]
- Li, Q.; He, B.; Song, D. Model-Contrastive Federated Learning. In Proceedings of the 2021 IEEE/CVF Conference on Computer Vision and Pattern Recognition (CVPR), Nashville, TN, USA, 20–25 June 2021. [Google Scholar]
- Tan, J.; Zhou, Y.; Liu, G.; Wang, J.; Yu, S. pFedSim: Similarity-Aware Model Aggregation Towards Personalized Federated Learning. arXiv 2023, arXiv:2305.15706. [Google Scholar]


| FV Datasets | Number of Fingers | Total Images | Training Set | Test Set | Number of Authentication Pairs |
|---|---|---|---|---|---|
| SDUMLA-HMT | 636 | 3816 | 3054 | 976 | 289,941 |
| MMCBNU-6000 | 600 | 6000 | 4800 | 1200 | 719,400 |
| HKPU-FV | 312 | 1872 | 1500 | 372 | 69,006 |
| NUPT-FV | 1680 | 16,800 | 13,440 | 3360 | 5,643,120 |
| VERA | 220 | 440 | 352 | 88 | 3828 |
| UTFVP | 360 | 1440 | 1152 | 288 | 41,328 |
| Datasets | Local | Centralized_1 | Centralized_2 | DDP-FedFV | ||||
|---|---|---|---|---|---|---|---|---|
| EER | TAR@FAR = 0.01 | EER | TAR@FAR = 0.01 | EER | TAR@FAR = 0.01 | EER | TAR@FAR = 0.01 | |
| SDU | 3.687% | 92.05% | 3.485% | 91.27% | 4.280% | 92.47% | 2.163% | 96.92% |
| MMC | 1.365% | 98.13% | 1.272% | 98.43% | 0.647% | 99.78% | ||
| HKPU | 2.265% | 95.47% | 2.072% | 96.03% | 1.225% | 98.59% | ||
| NUPT | 1.025% | 98.93% | 1.048% | 98.86% | 0.995% | 99.02% | ||
| VERA | 8.749% | 65.43% | 6.685% | 82.07% | 2.563% | 95.29% | ||
| UTFVP | 4.802% | 82.45% | 5.236% | 87.90% | 2.141% | 95.15% | ||
| Best | 1.025% | 98.93% | 1.048% | 98.86% | 4.280% | 92.47% | 0.647% | 99.78% |
| Worst | 8.749% | 63.43% | 6.685% | 82.07% | 2.563% | 95.15% | ||
| Average | 3.649% | 88.74% | 3.300% | 92.43% | 1.622% | 97.46% | ||
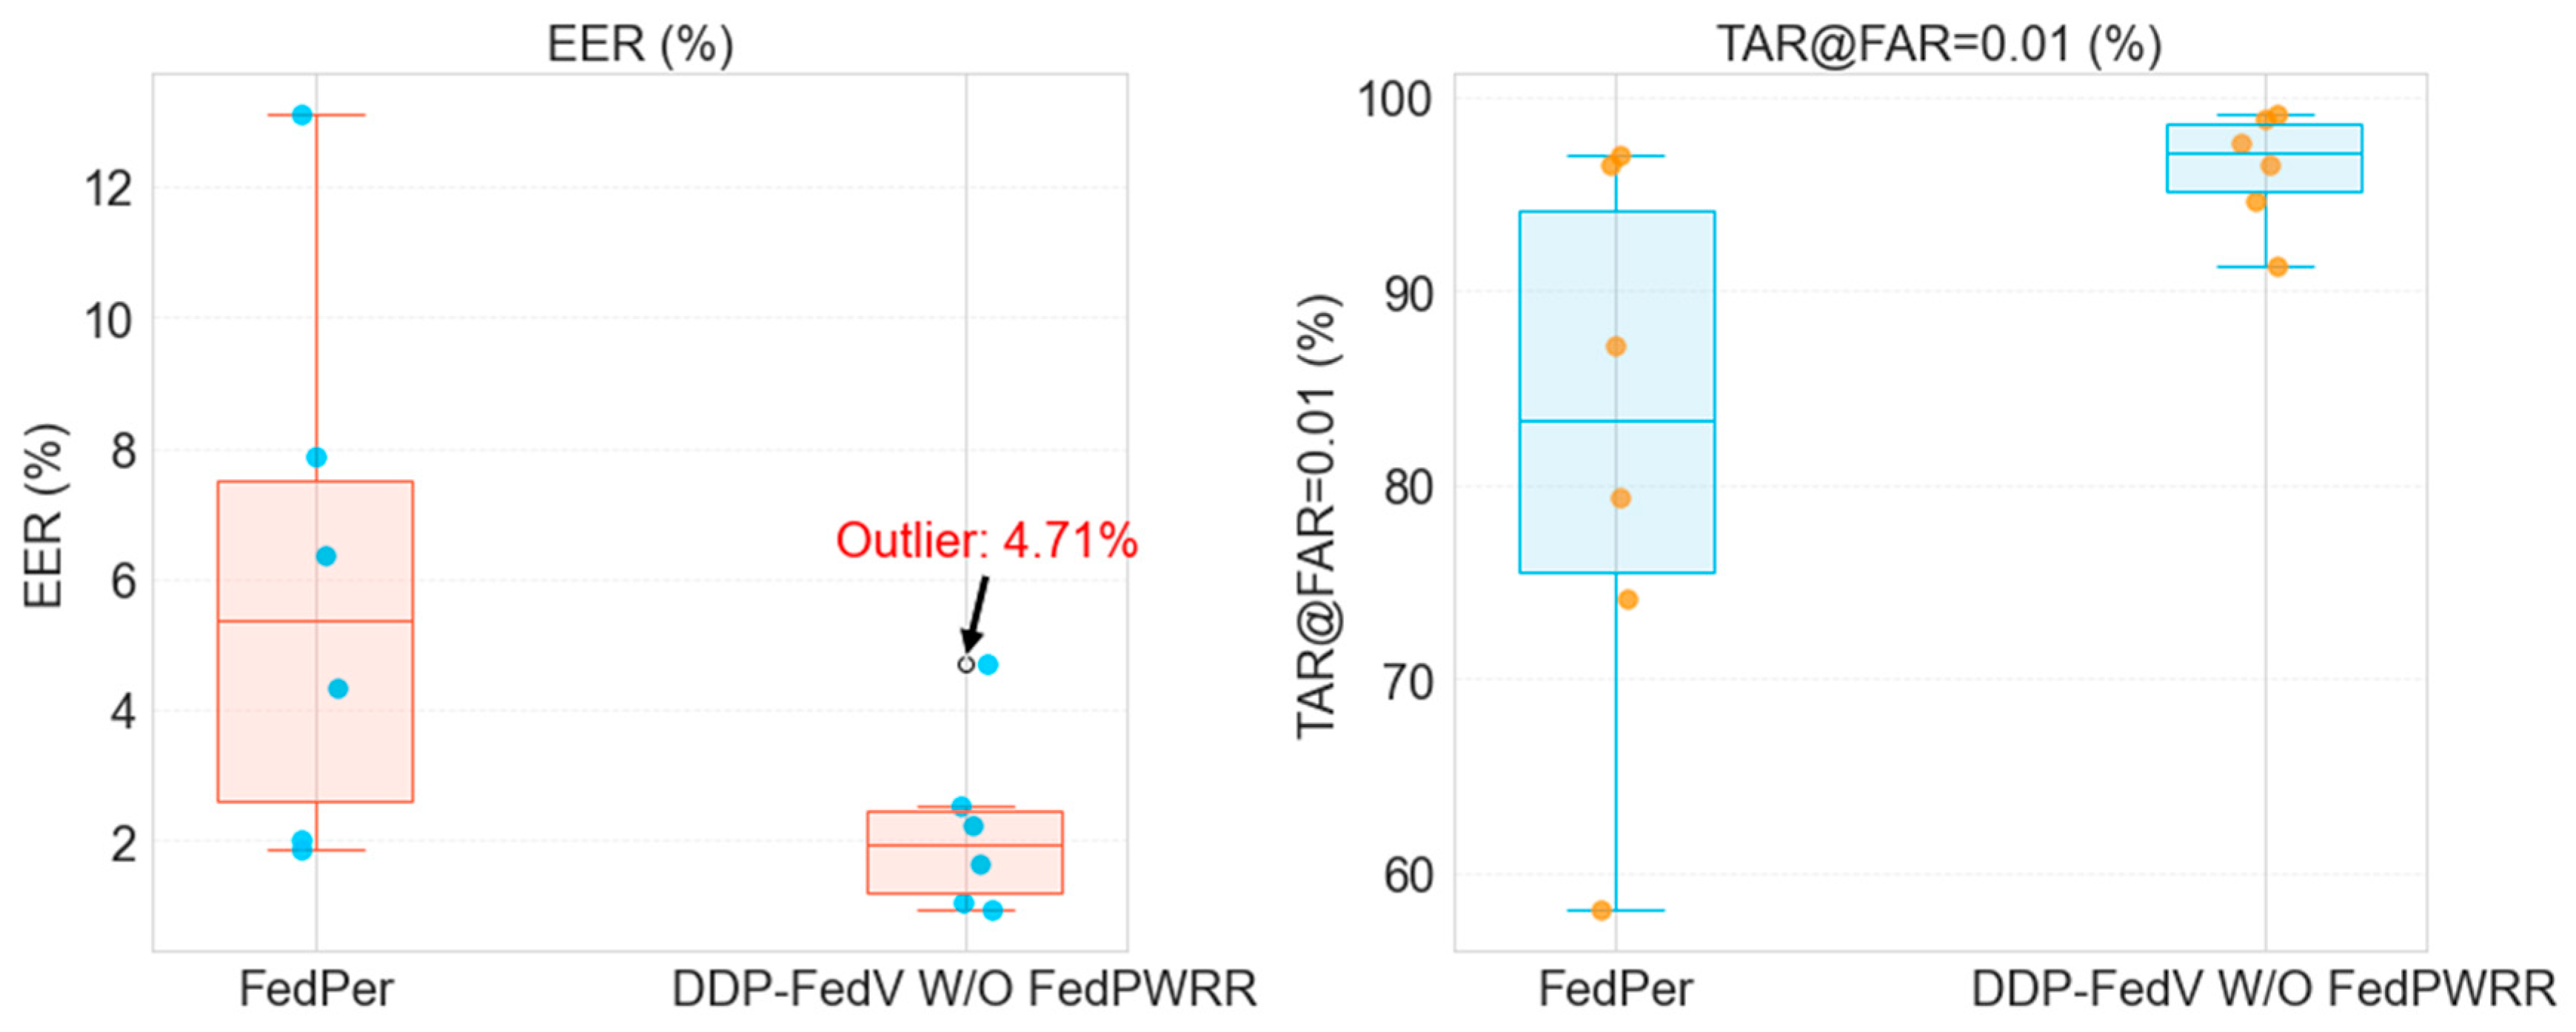
| Datasets | FedPer | The First Phase Method | ||
|---|---|---|---|---|
| EER | TAR@FAR = 0.01 | EER | TAR@FAR = 0.01 | |
| SDU | 7.875% | 79.41% | 2.239% | 96.58% |
| MMC | 1.867% | 96.49% | 0.930% | 99.14% |
| HKPU | 4.348% | 87.19% | 1.654% | 97.59% |
| NUPT | 2.026% | 97.06% | 1.063% | 98.90% |
| VERA | 13.111% | 58.05% | 4.710% | 91.24% |
| UTFVP | 6.362% | 74.17% | 2.540% | 94.61% |
| Best | 1.867% | 97.06% | 0.930% | 99.14% |
| Worst | 13.111% | 58.05% | 4.710% | 91.24% |
| Average | 5.931% | 82.06% | 2.189% | 96.34% |
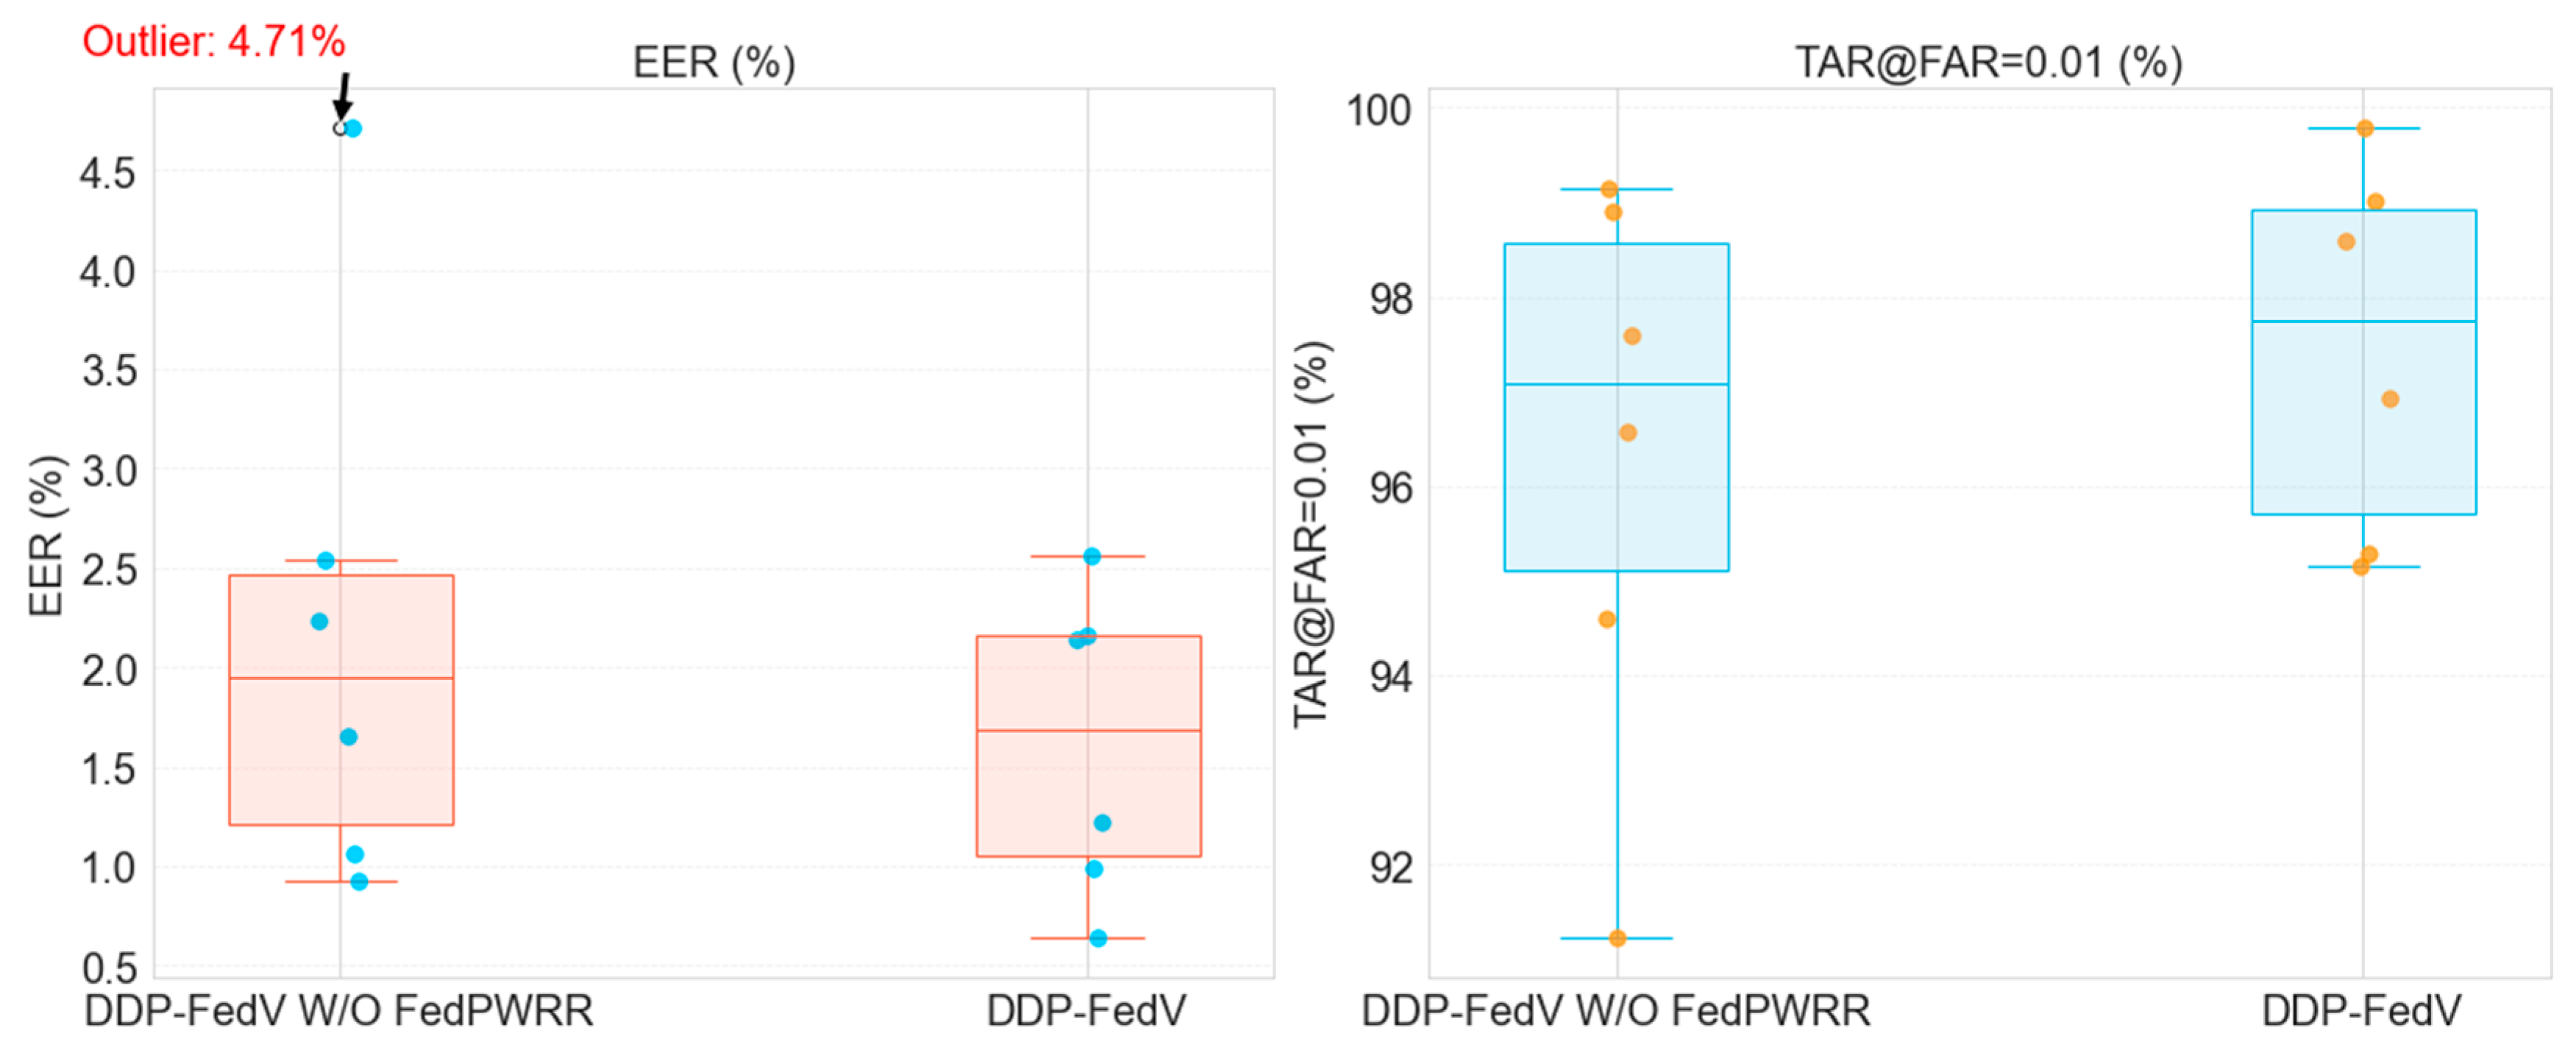
| Datasets | DDP-FedFV W/O FedPWRR | DDP-FedFV | ||
|---|---|---|---|---|
| EER | TAR@FAR = 0.01 | EER | TAR@FAR = 0.01 | |
| SDU | 2.239% | 96.58% | 2.163% | 96.92% |
| MMC | 0.930% | 99.14% | 0.647% | 99.78% |
| HKPU | 1.654% | 97.59% | 1.225% | 98.59% |
| NUPT | 1.063% | 98.90% | 0.995% | 99.02% |
| VERA | 4.710% | 91.24% | 2.563% | 95.29% |
| UTFVP | 2.540% | 94.61% | 2.141% | 95.15% |
| Best | 0.930% | 99.14% | 0.647% | 99.78% |
| Worst | 4.710% | 91.24% | 2.563% | 95.15% |
| Average | 2.189% | 96.34% | 1.622% | 97.46% |
| Datasets | Moon [42] | pFedSim [43] | FedFV [17] | DDP-FedFV | ||||
|---|---|---|---|---|---|---|---|---|
| EER | TAR@FAR = 0.01 | EER | TAR@FAR = 0.01 | EER | TAR@FAR = 0.01 | EER | TAR@FAR = 0.01 | |
| SDU | 2.383% | 94.43% | 2.211% | 95.61% | 1.938% | 97.10% | 2.163% | 96.92% |
| MMC | 1.013% | 98.90% | 0.596% | 99.68% | 0.719% | 99.41% | 0.647% | 99.78% |
| HKPU | 1.416% | 97.80% | 1.557% | 97.40% | 0.736% | 99.26% | 1.225% | 98.59% |
| NUPT | 0.740% | 99.39% | 1.098% | 98.80% | 0.995% | 99.03% | 0.995% | 99.02% |
| VERA | 2.330% | 93.24% | 3.779% | 89.81% | 2.731% | 77.36% | 2.563% | 95.29% |
| UTFVP | 2.636% | 92.96% | 3.438% | 93.02% | 1.837% | 96.45% | 2.141% | 95.15% |
| Best | 0.740% | 99.39% | 0.596% | 99.68% | 0.719% | 99.41% | 0.647% | 99.78% |
| Worst | 2.636% | 92.96% | 3.779% | 89.81% | 2.731% | 77.36% | 2.563% | 95.15% |
| Average | 1.753% | 96.12% | 2.113% | 95.72% | 1.493% | 94.77% | 1.622% | 97.46% |
Disclaimer/Publisher’s Note: The statements, opinions and data contained in all publications are solely those of the individual author(s) and contributor(s) and not of MDPI and/or the editor(s). MDPI and/or the editor(s) disclaim responsibility for any injury to people or property resulting from any ideas, methods, instructions or products referred to in the content. |
© 2024 by the authors. Licensee MDPI, Basel, Switzerland. This article is an open access article distributed under the terms and conditions of the Creative Commons Attribution (CC BY) license (https://creativecommons.org/licenses/by/4.0/).
Share and Cite
Guo, Z.; Guo, J.; Huang, Y.; Zhang, Y.; Ren, H. DDP-FedFV: A Dual-Decoupling Personalized Federated Learning Framework for Finger Vein Recognition. Sensors 2024, 24, 4779. https://doi.org/10.3390/s24154779
Guo Z, Guo J, Huang Y, Zhang Y, Ren H. DDP-FedFV: A Dual-Decoupling Personalized Federated Learning Framework for Finger Vein Recognition. Sensors. 2024; 24(15):4779. https://doi.org/10.3390/s24154779
Chicago/Turabian StyleGuo, Zijie, Jian Guo, Yanan Huang, Yibo Zhang, and Hengyi Ren. 2024. "DDP-FedFV: A Dual-Decoupling Personalized Federated Learning Framework for Finger Vein Recognition" Sensors 24, no. 15: 4779. https://doi.org/10.3390/s24154779
APA StyleGuo, Z., Guo, J., Huang, Y., Zhang, Y., & Ren, H. (2024). DDP-FedFV: A Dual-Decoupling Personalized Federated Learning Framework for Finger Vein Recognition. Sensors, 24(15), 4779. https://doi.org/10.3390/s24154779