
Electronic Noses: From Gas-Sensitive Components and Practical Applications to Data Processing


Abstract
1. Introduction
2. Sensors in the e-Nose System
2.1. MOS-Based Gas Sensors
2.1.1. ZnO

| Sensing Materials | Temperature (°C) | Gas | Type | LOD (ppm) | Ref. |
|---|---|---|---|---|---|
| ZnO-NPs/MEMS | RT | NH3 | Resistance | 0.1 | [19] |
| ZnO nanosheet | 300 | CO | Resistance | 0.134 | [16] |
| NiO-ZnO | RT | Acetone | Resistance | 10 | [20] |
| CuO-ZnO | 225 | H2S | Resistance | 2 | [21] |
| CuO-ZnO | 100 | H2S | Resistance | 100 | [22] |
| CuO/ZnO nanorods | 500 | H2S | Resistance | 50 | [23] |
| CeO2/ZnO | 120 | NO2 | Resistance | 0.1 | [24] |
| 25 | NO2 | Resistance | 0.5 | ||
| ZnO nanowire | 60 | Ethanol | Resistance | 50 | [25] |
| ZnO nanowire | 300 | CO | Resistance | 0.139 | [17] |
| 350 | NO2 | Resistance | 0.1 | ||
| CuO/ZnO | 250 | NO2 | Resistance | 1 | [26] |
| α-Fe2O3/ZnO | 250 | H2S | Resistance | 1 | [27] |
| CdO-ZnO | 350 | Formaldehyde | Resistance | 50 | [28] |
| Porous-ZnO | 200 | NO2 | Resistance | 0.5 | [29] |
| ZnO/CuO nanorods | 50 | H2S | Resistance | 1 | [30] |
| ZnO/MoO3 | 180 | Triethylamine | Resistance | 0.1 | [31] |
| Pt-ZnO | 200 | Triethylamine | Resistance | 8 | [32] |
| Pt1-ZnO | 200 | Triethyamine | Resistance | 0.1 | [33] |
| Pd-ZnO | 280 | Aniline | Resistance | 0.5 | [34] |
| Al-ZnO | 200 | O2 | Resistance | 25,000 (2.5%) | [35] |
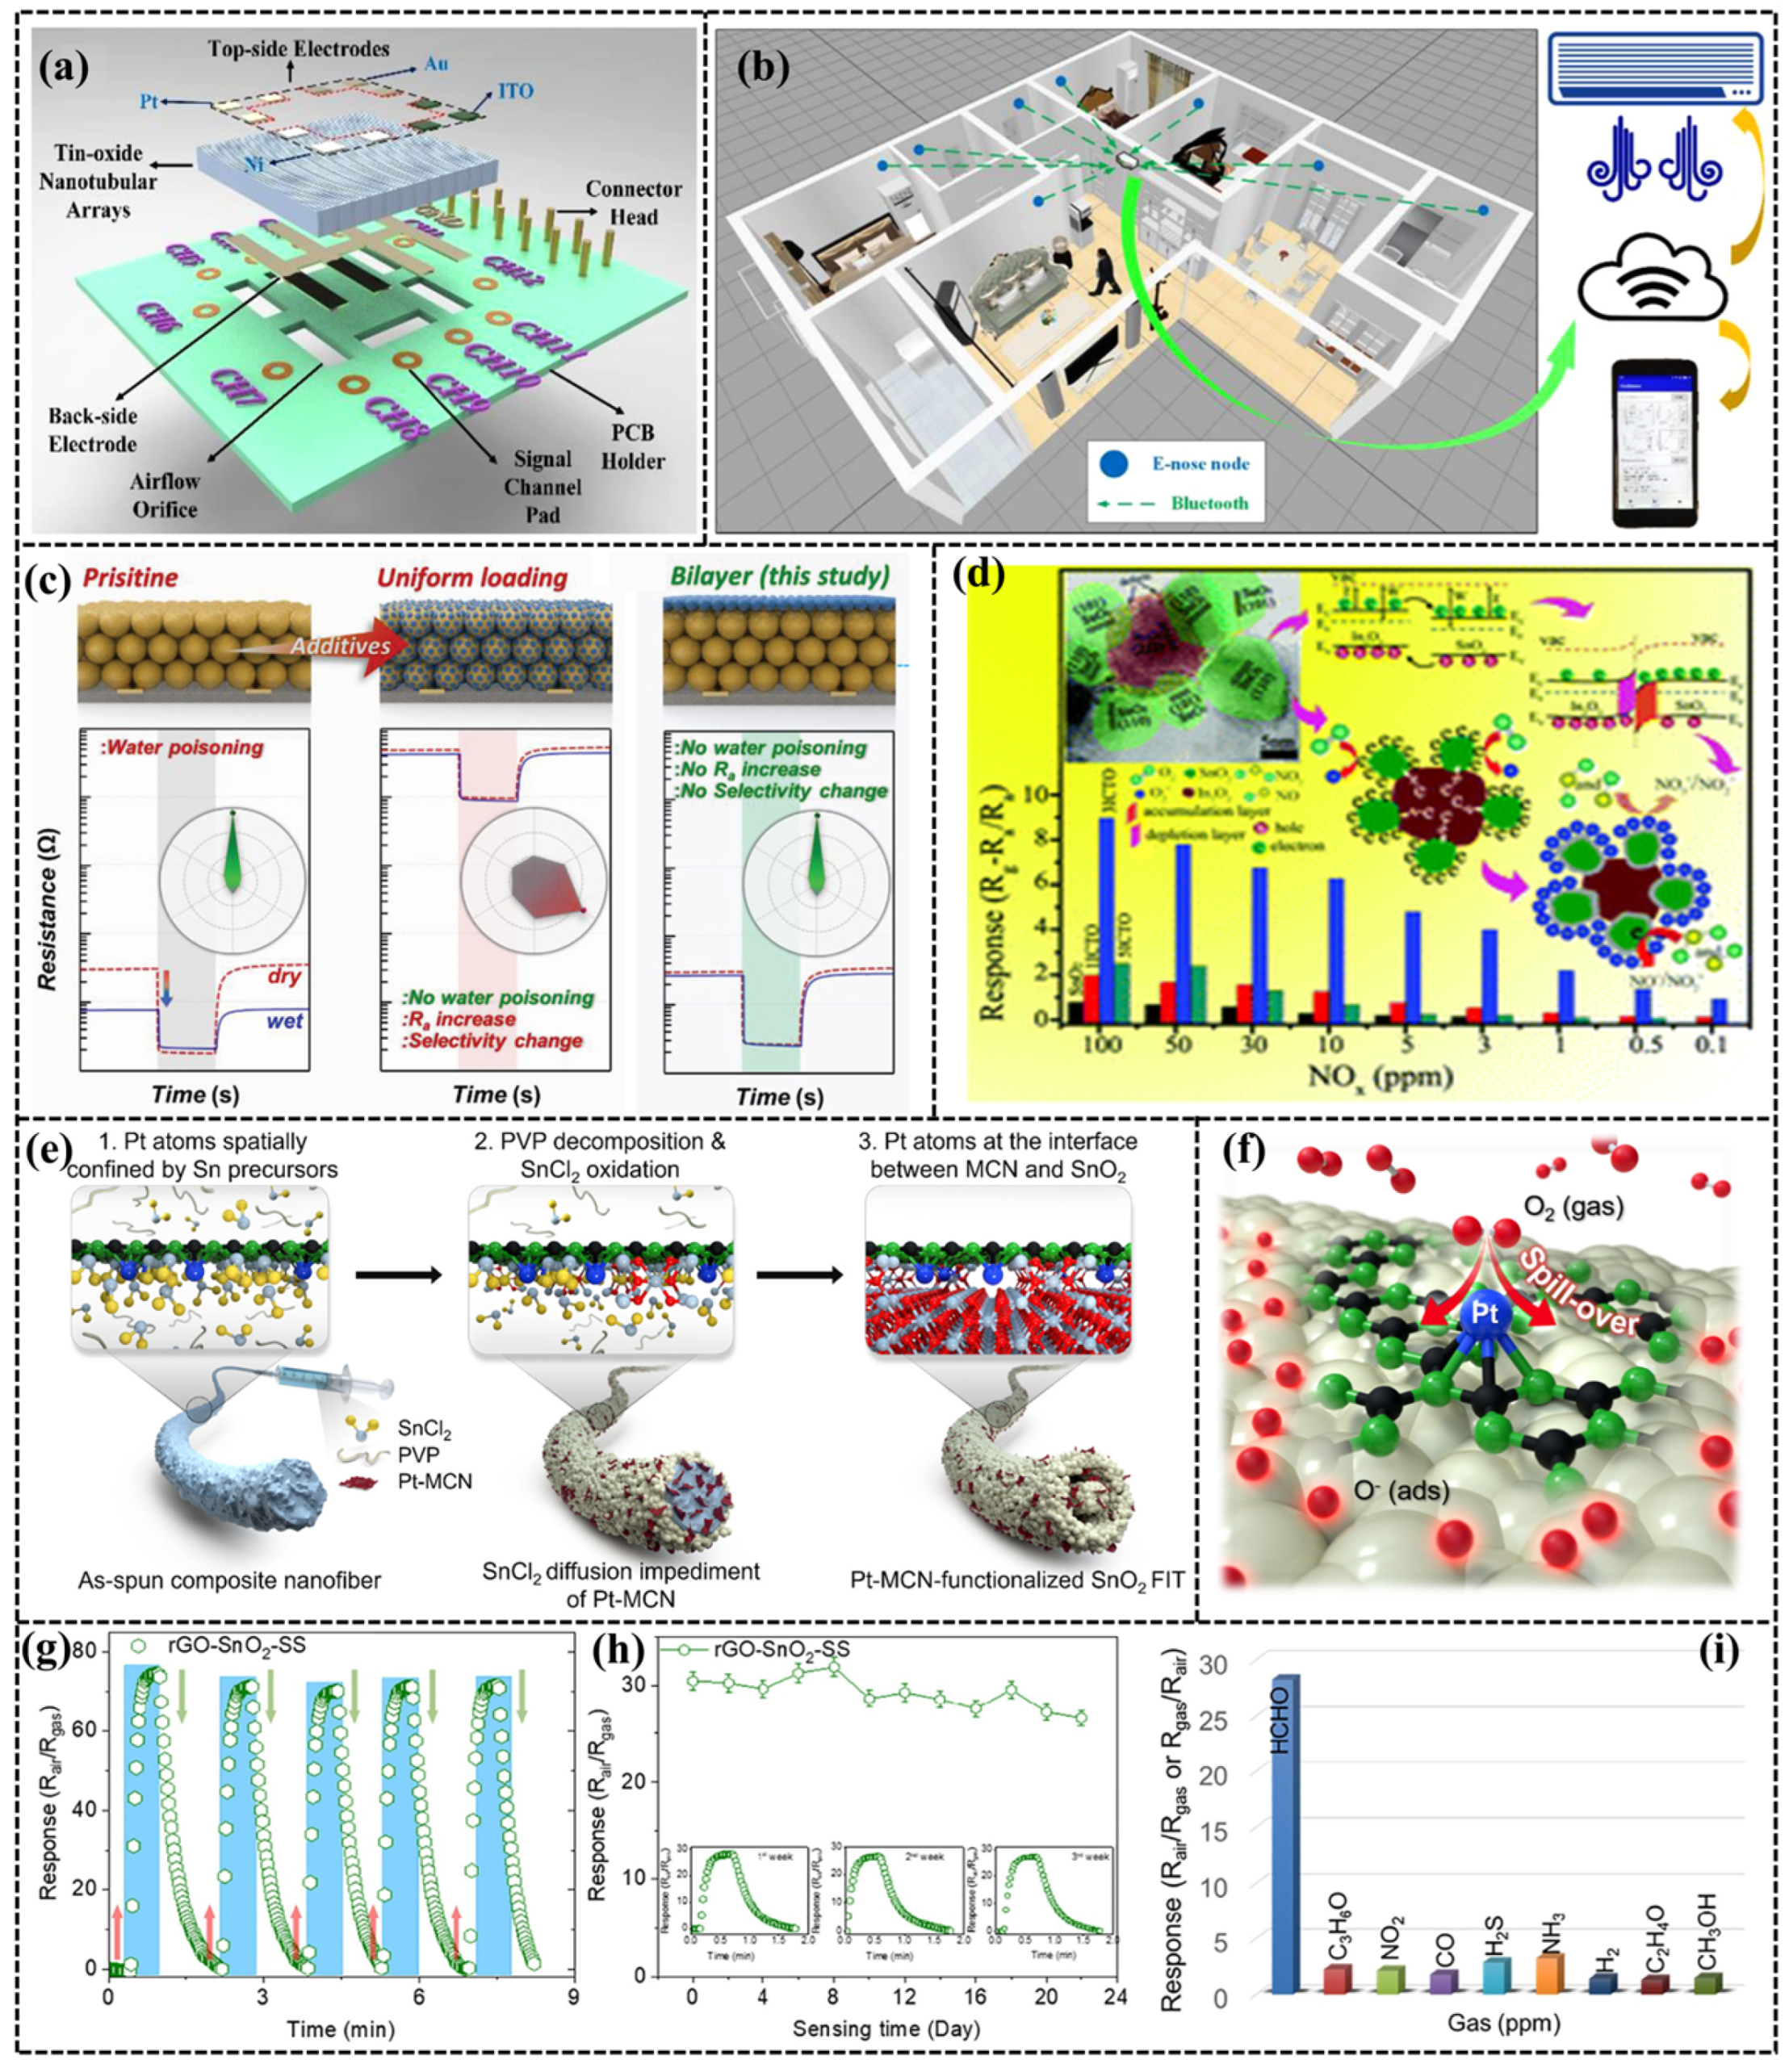
2.1.2. SnO2
| Sensing Materials | Temperature (°C) | Gas | Type | LOD (ppm) | Ref. |
|---|---|---|---|---|---|
| Pt- carbon nitride/SnO2 | 275 | Formaldehyde | Resistance | 0.05 | [43] |
| F-SnO2 hollow fibers | RT | Ethanol | Resistance | 10 | [44] |
| CNTs/SnO2 | RT-UV | NO2 | Resistance | 0.02 | [41] |
| rGO-SnO2 | 100 | Formaldehyde | Resistance | 0.01 | [45] |
| SnO2-Ti3C2Tx | 150 | NO2 | Resistance | 24.8 | [46] |
| ZnO quantum dots@SnO2 | 225 | Formaldehyde | Resistance | 0.005 | [47] |
| SnO2/ZnO | 275 | Ethanol | Resistance | 18.1 | [48] |
| SnO2 nanoflower | RT-UV | NO2 | Resistance | 0.2 | [49] |
| Sb-SnO2 | 40 | H2S | Resistance | 0.004 | [50] |
| Pt-SnO2 nanotube | RT | H2 | Resistance | 50 | [42] |
| NO2 | Resistance | 5 | |||
| Benzene | Resistance | 2 | |||
| Tb4O7-SnO2 | 350–450 | Acetone | Resistance | - | [51] |
| In2O3-SnO2 | RT | NOx | Resistance | 0.1 | [52] |
| WO3-SnO2 | 110 | Methane | Resistance | 10 | [53] |
| SnO2-6 squama-wrapped tubes | 92 | NO2 | Resistance | 0.1 | [54] |
| 170 | Diisopropylamine | Resistance | 1 |
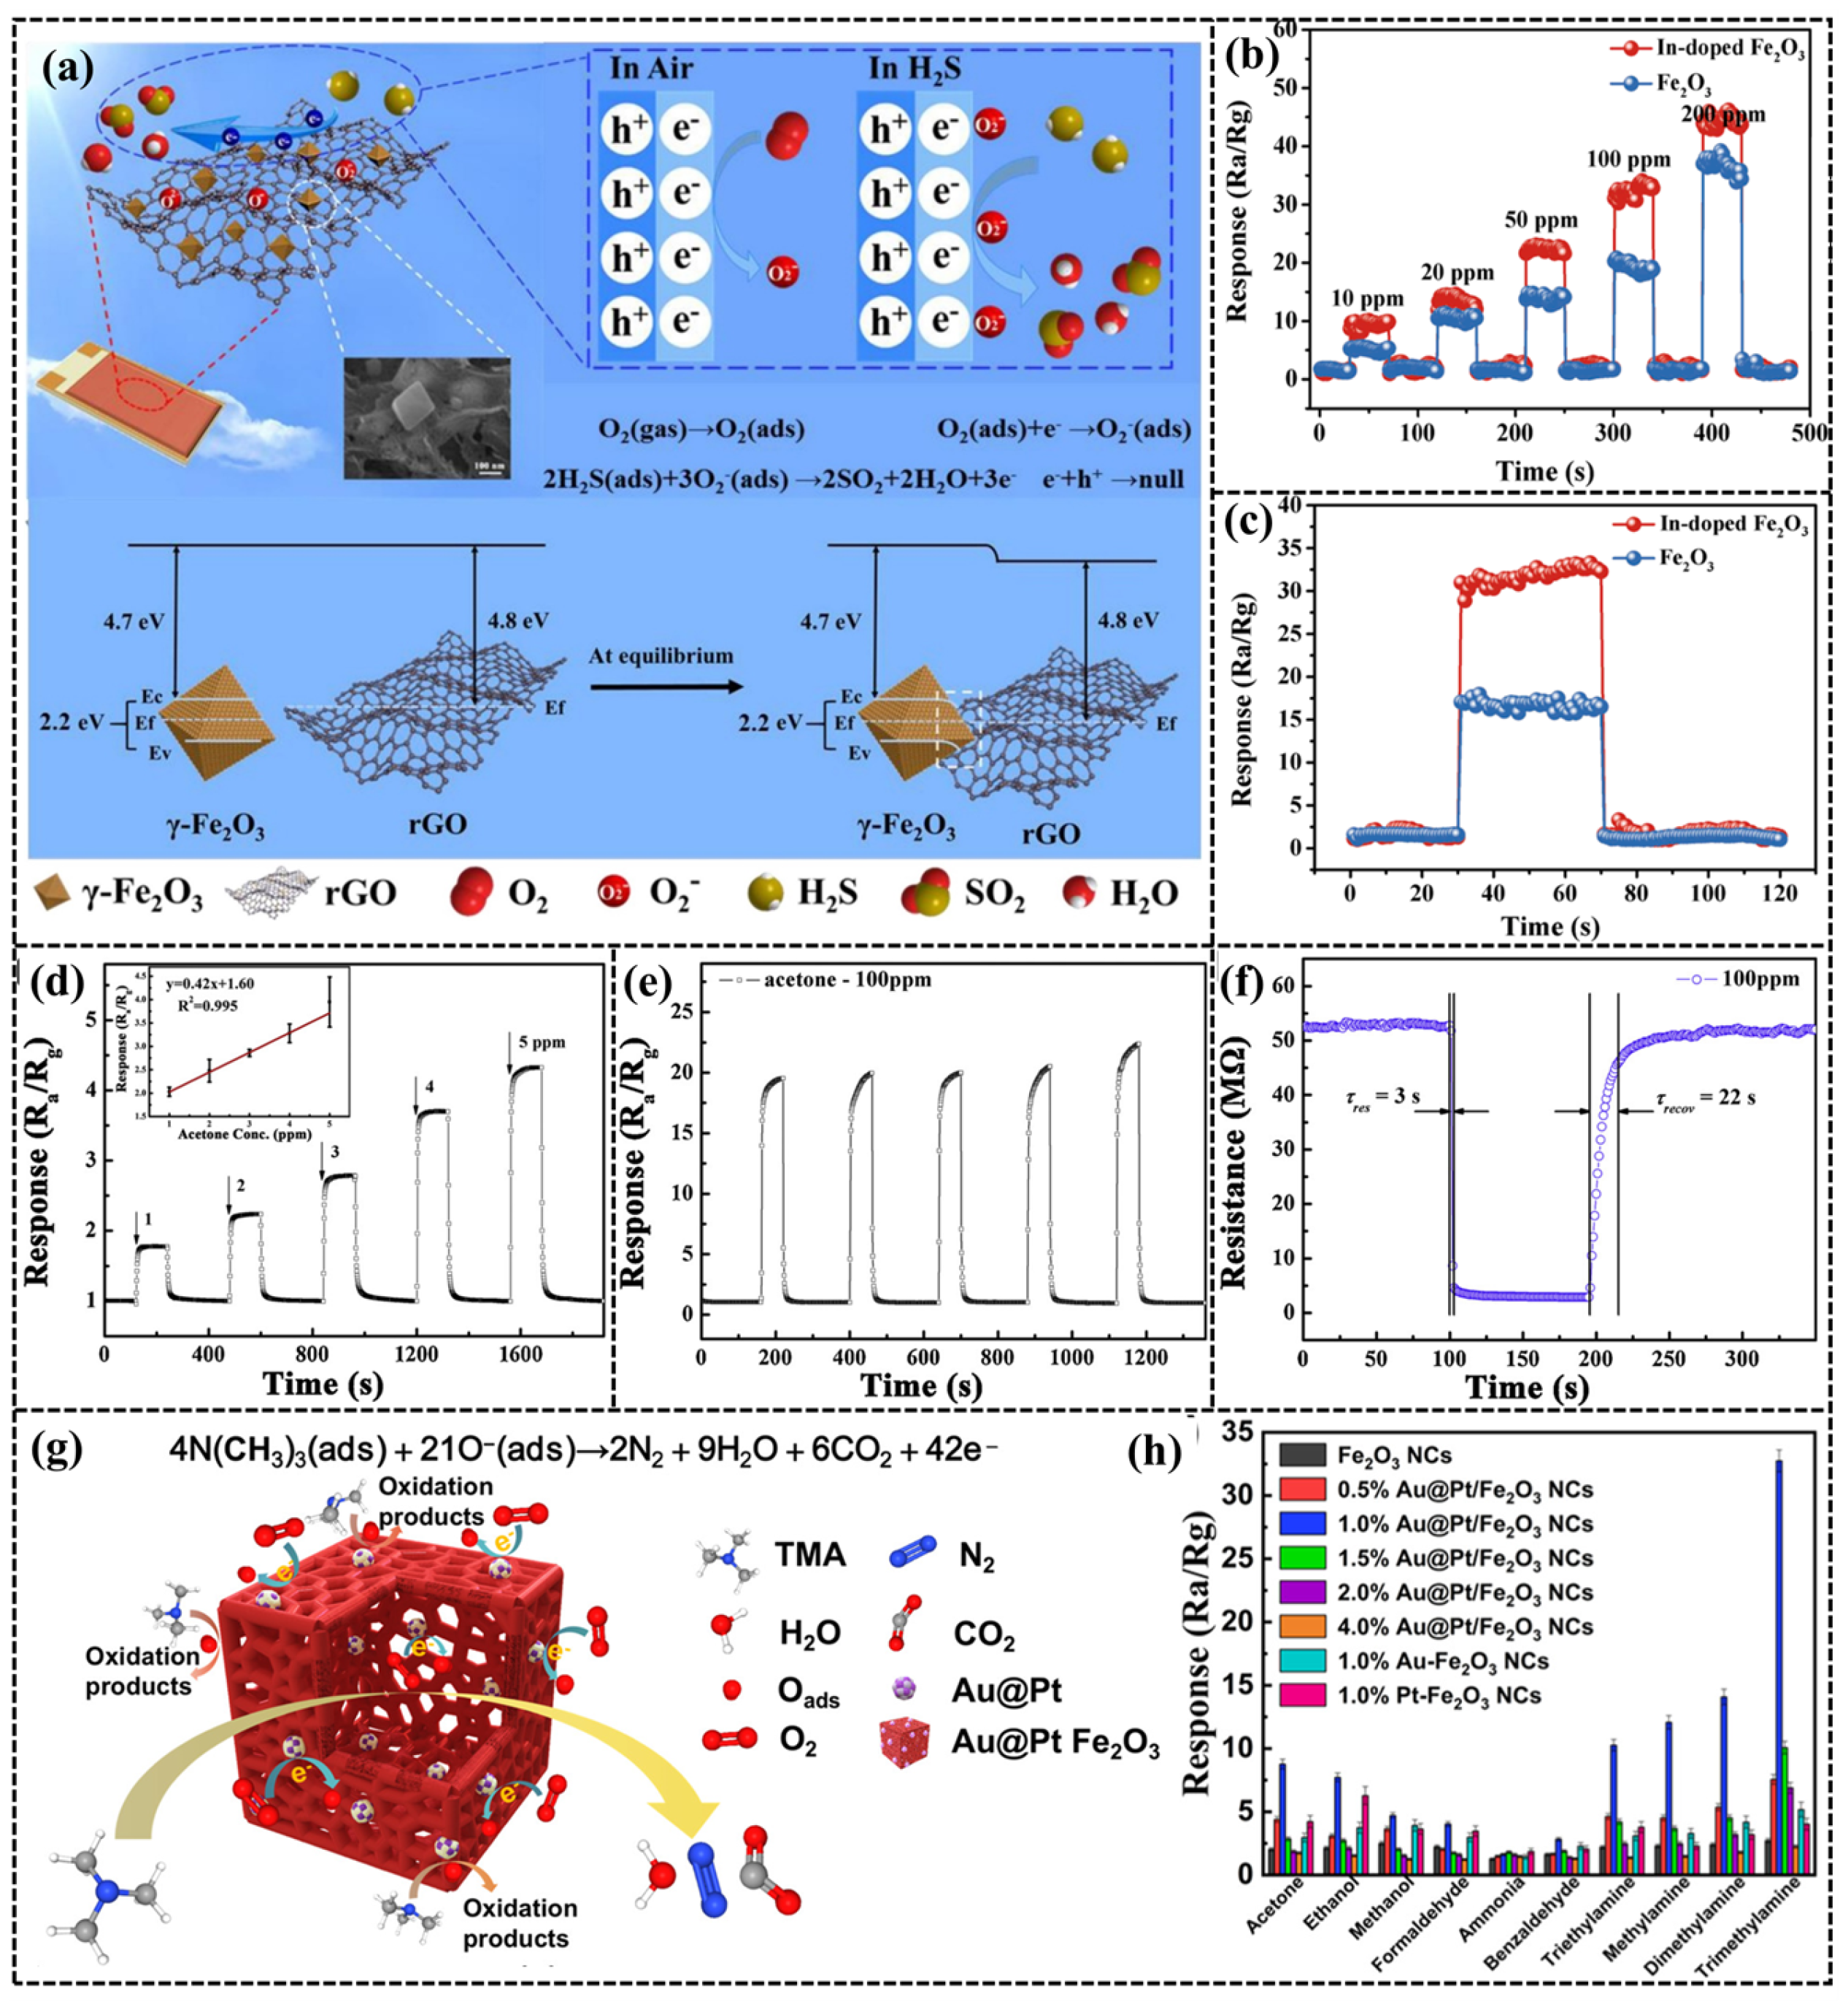
2.1.3. Fe2O3
| Sensing Materials | Temperature (°C) | Gas | Type | LOD (ppm) | Ref. |
|---|---|---|---|---|---|
| γ-Fe2O3/rGO | RT | H2S | Resistance | 0.39 | [62] |
| α-Fe2O3 | RT | NO2 | Resistance | 1 | [63] |
| α-Fe2O3/ZnO | 250 | H2S | Resistance | 1 | [27] |
| α-Fe2O3/graphene | 280 | Ethanol | Resistance | 1 | [64] |
| In-Fe2O3 | 320 | Acetone | Resistance | 31.7 | [65] |
| Fe2O3/In2O3 | 200 | Acetone | Resistance | 10 | [66] |
| α-Fe2O3 | 150 | Ethanol | Resistance | 50 | [67] |
| Pt-α-Fe2O3 | 375 | Dimethyl disulfide | Resistance | 5 | [68] |
| Pt-Fe2O3 | 139 | Acetone | Resistance | 0.2 | [69] |
| Mn-α-Fe2O3 | 300 | H2 | Resistance | 10 | [70] |
| Au@Pt/α-Fe2O3 | 150 | Trimethylamine | Resistance | 1 | [71] |
| Fe2O3 (Hierarchical and Hollow) | 50 | H2S | Resistance | 0.25 | [72] |
| α-Fe2O3@ZnO@ZIF-8 | 200 | H2S | Resistance | 0.2 | [73] |
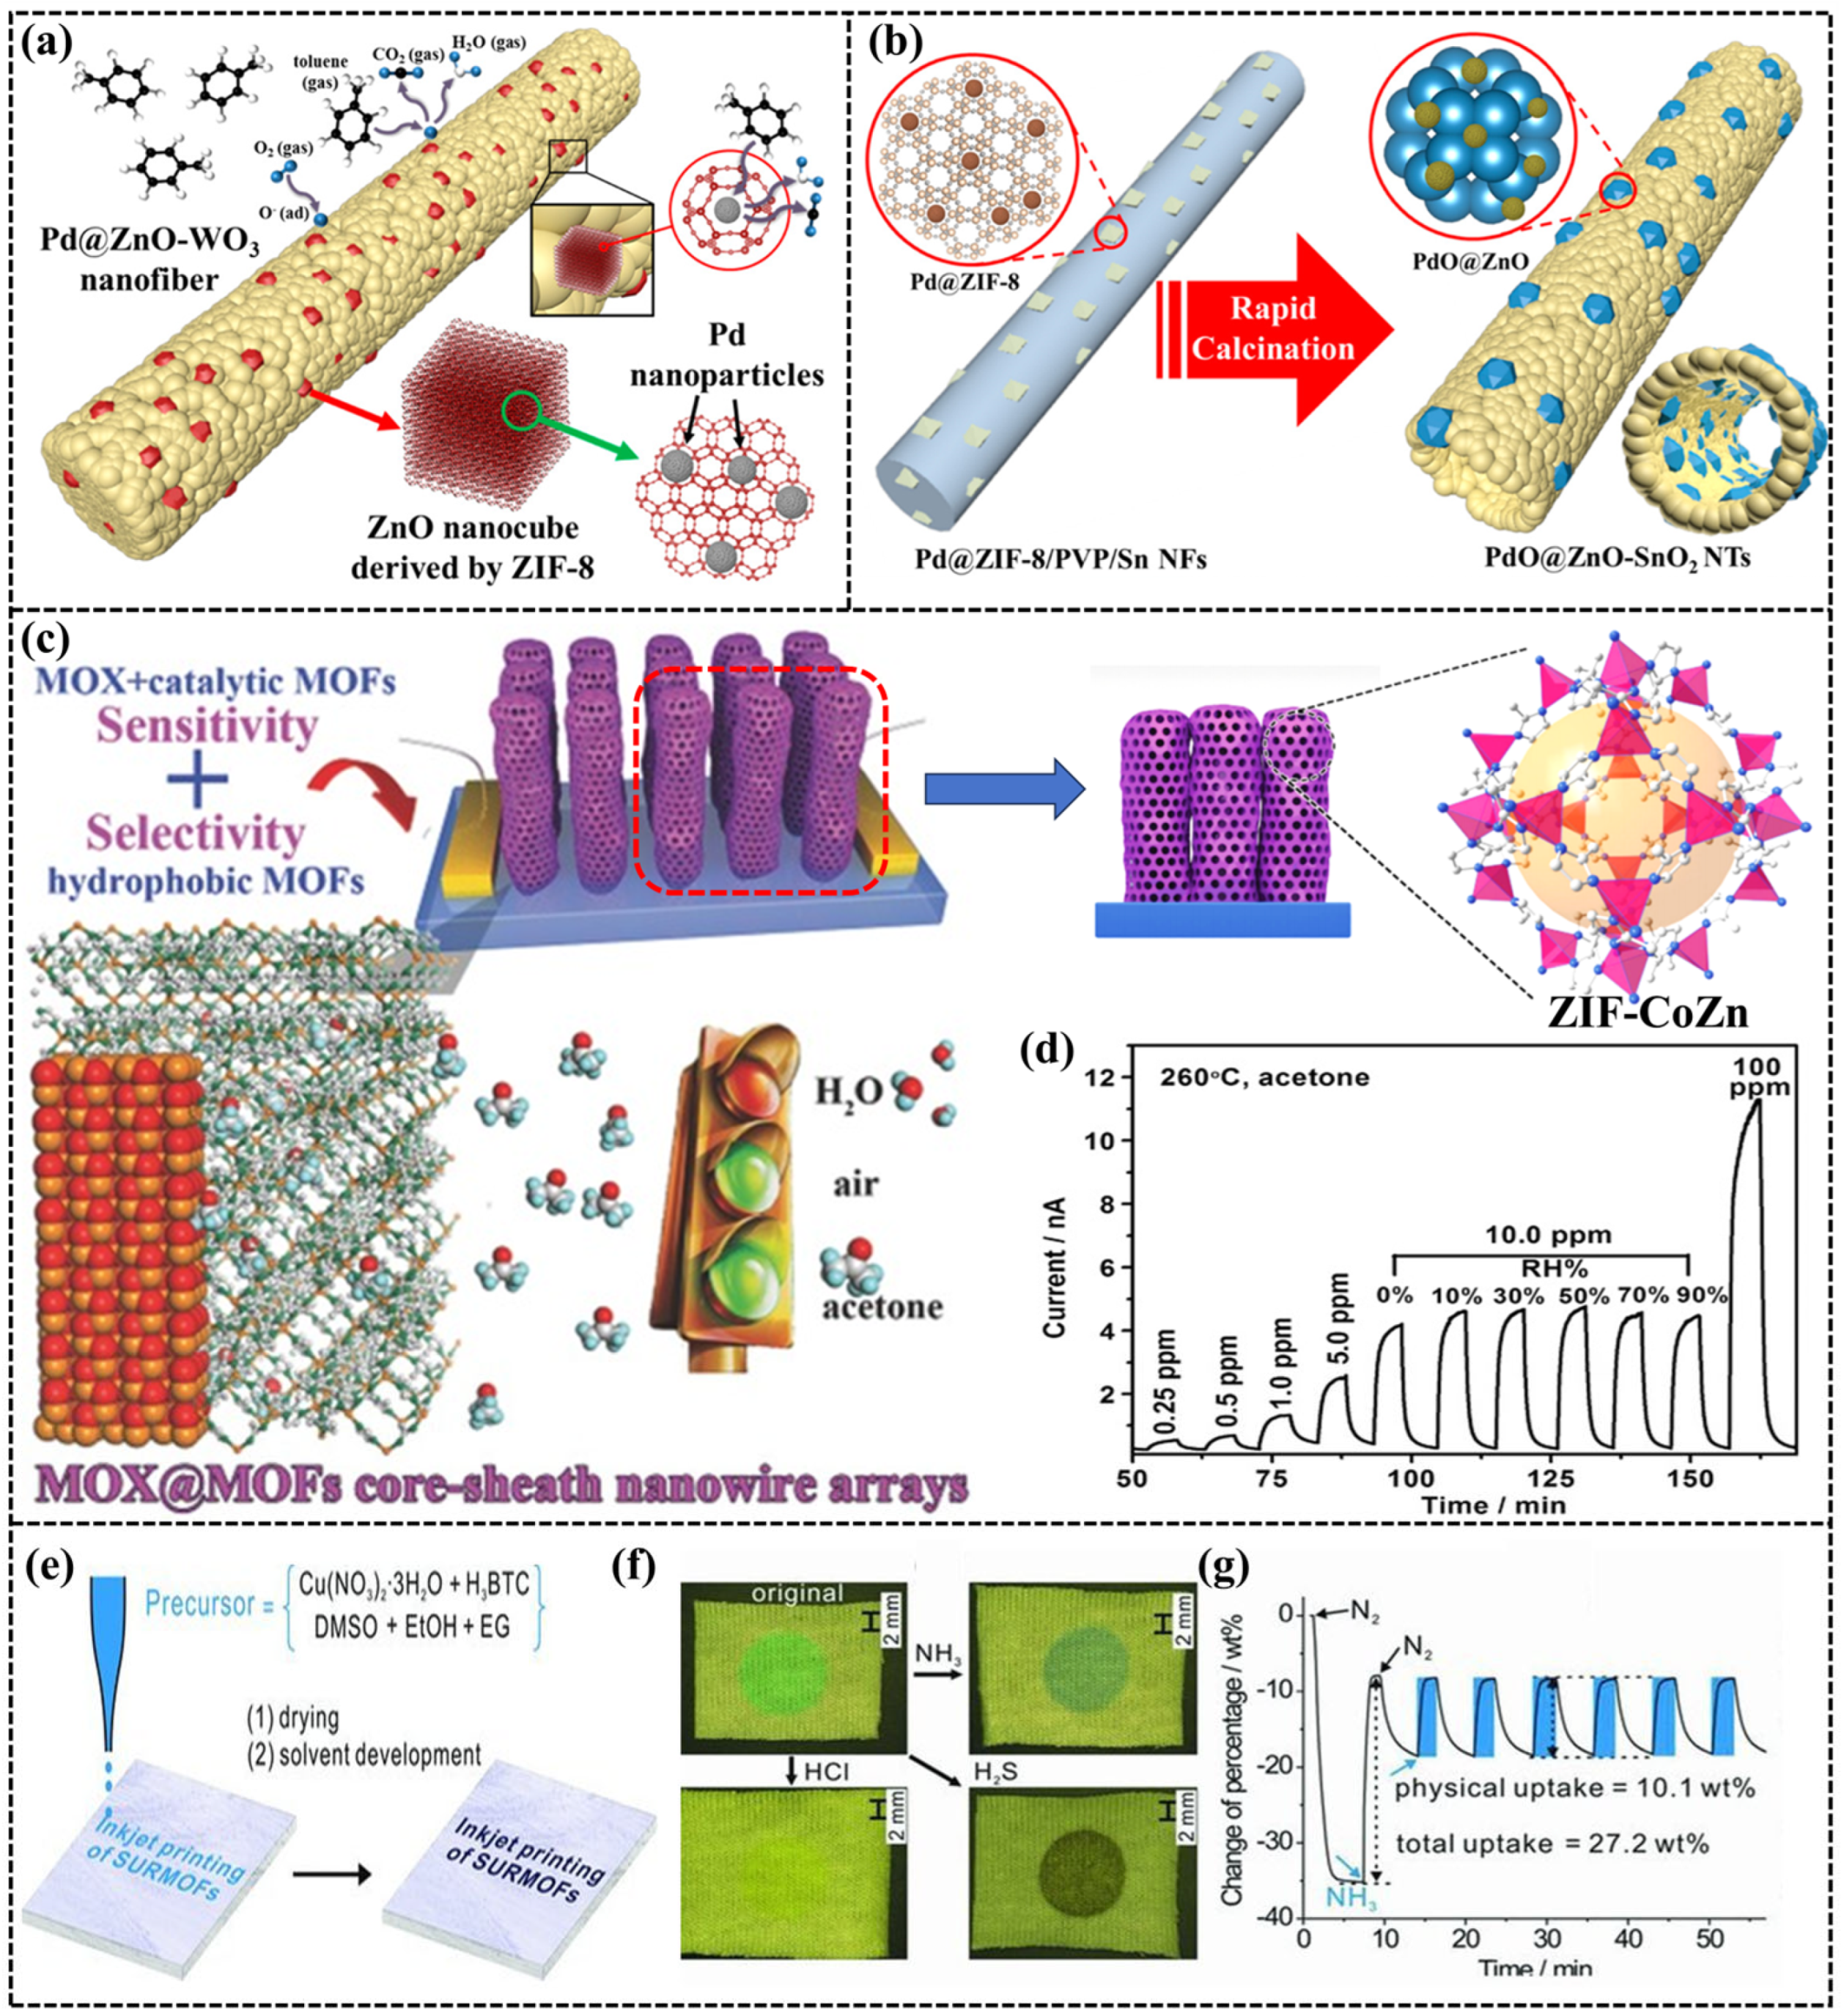
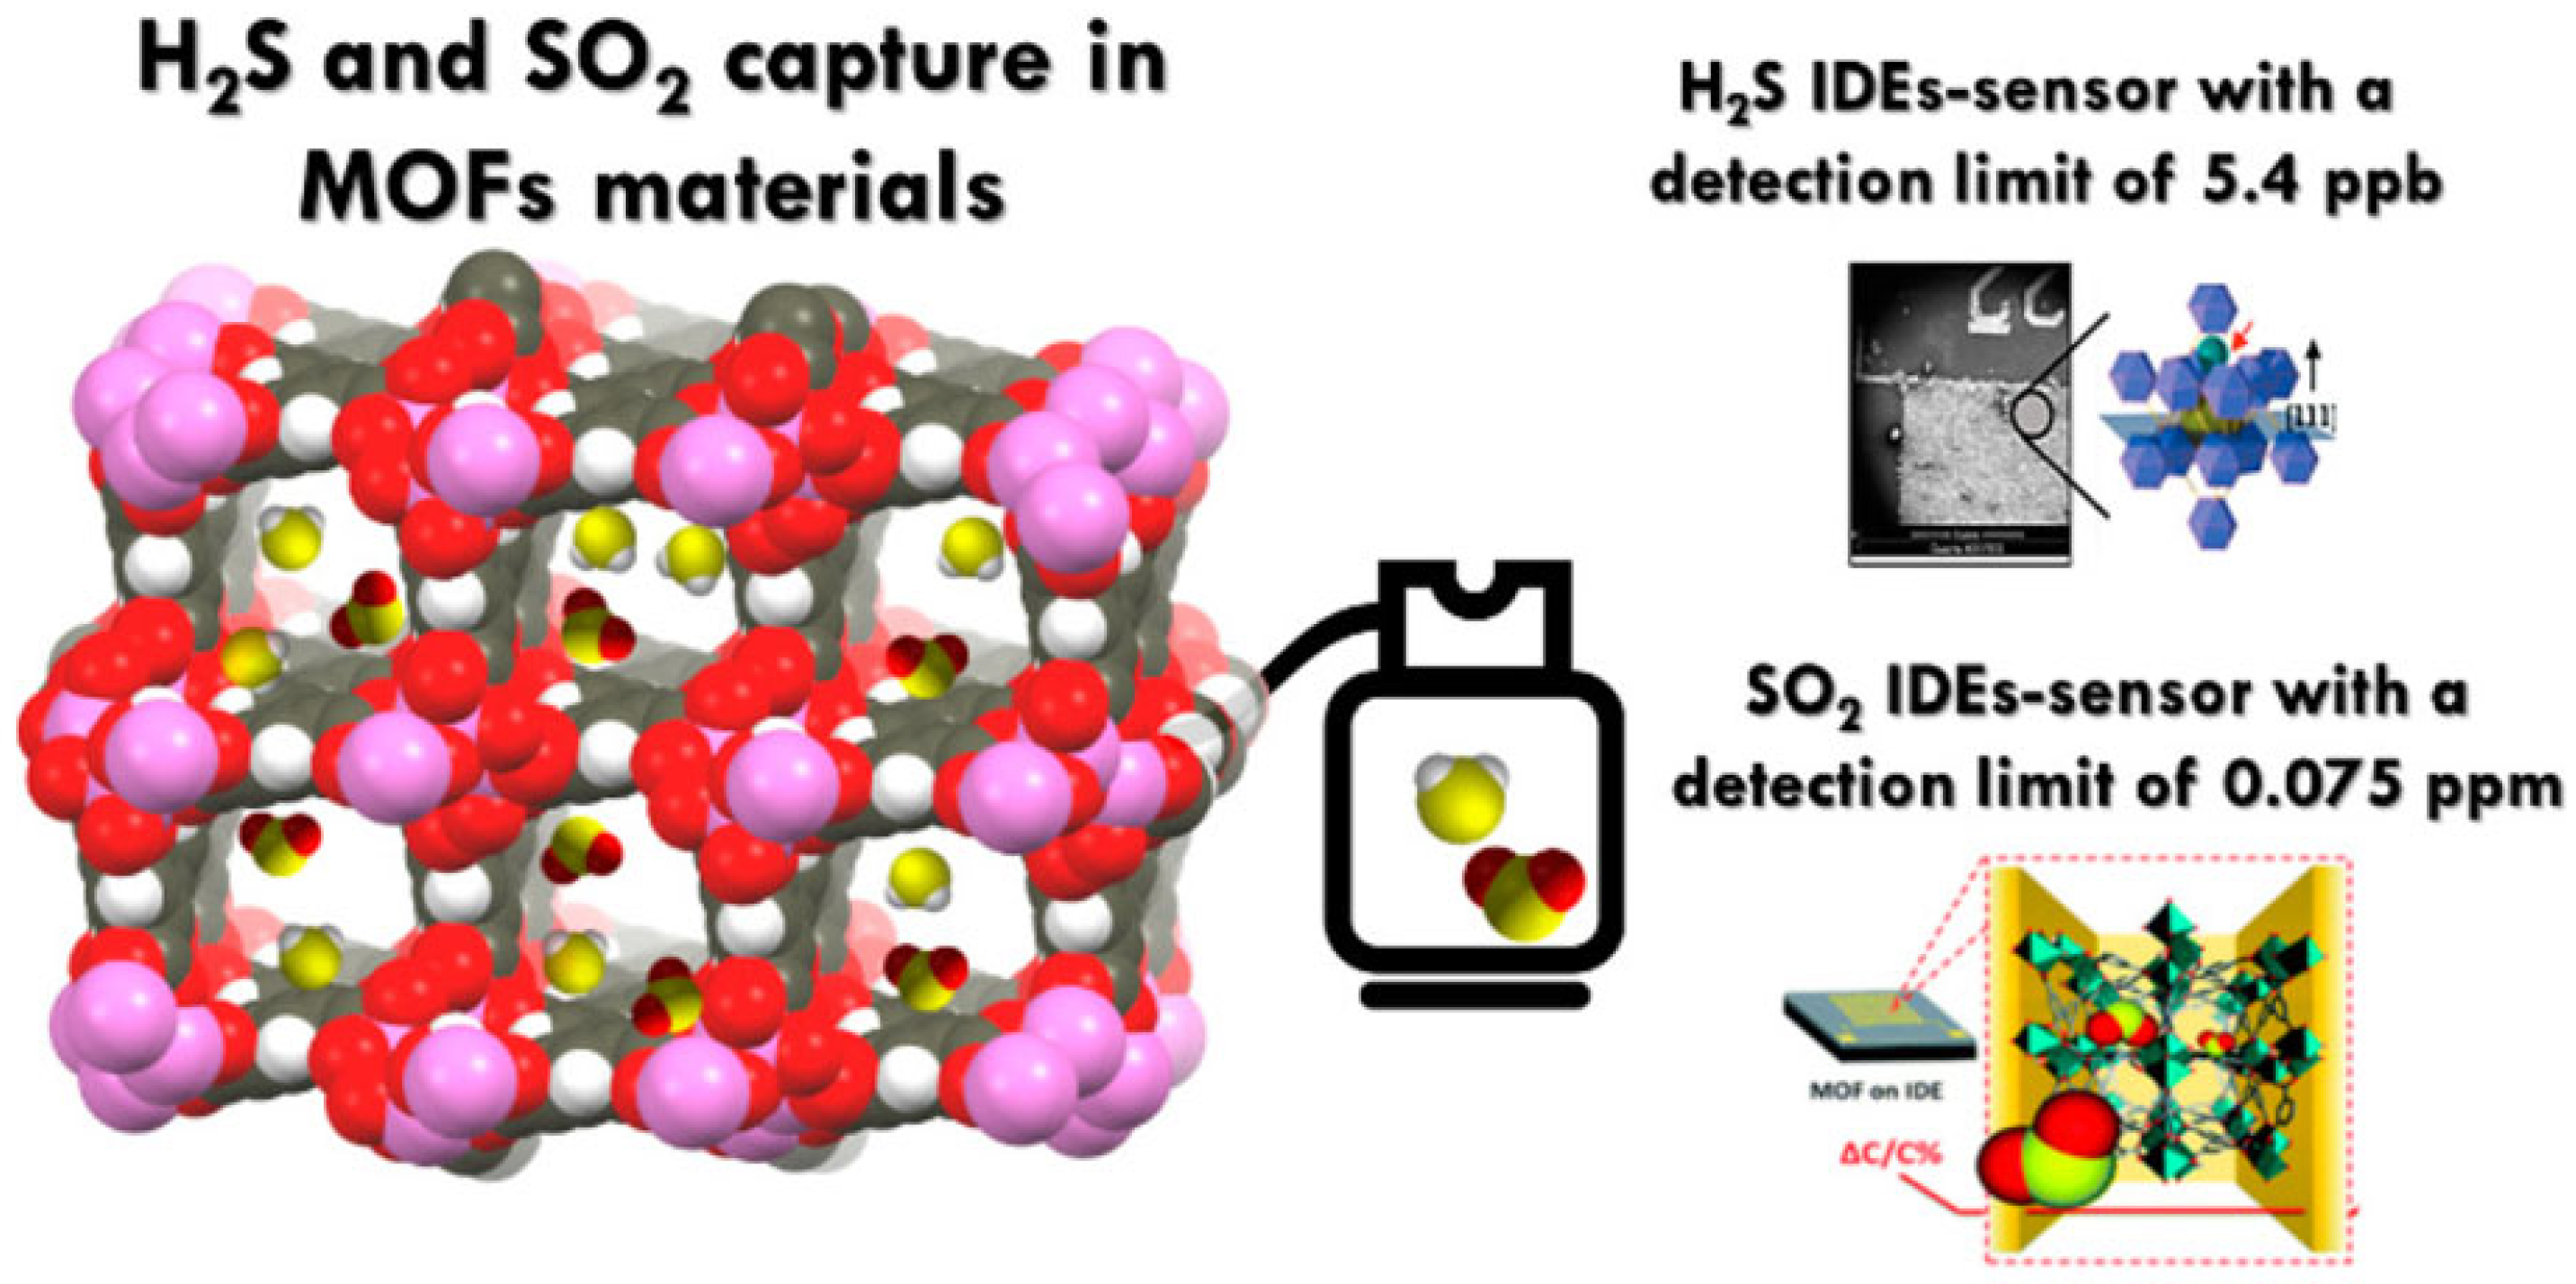
2.2. MOF-Based Gas Sensors
| Gas | Sensing Materials | Temperature (°C) | Type | LOD (ppm) | Ref. |
|---|---|---|---|---|---|
| H2S | fum-fcu-MOF | RT | Capacitive | 5.4 ppb | [83] |
| H2S | Ag2O@UiO-66-NO2 | RT | Capacitive | 1 ppm | [84] |
| CO2 | NbOFFIVE-1-Ni | 105 | Capacitive | 400 ppm | [85] |
| CO2 | Mg-MOF-74 | RT | Capacitive | 200 ppm | [86] |
| SO2 | MFM-300 | RT | Capacitive | 5 ppb | [87] |
| NH3 | NDC-Y-fuc-MOF | RT | Capacitive | 100 ppb | [88] |
| Methanol | NH2-MIL-53 (Al) | RT | Capacitive | - | [89] |
| Methanol | MIL-96 (Al) | - | Capacitive | - | [90] |
| Methanol | Cu-BTC | 30 | Capacitive | 100 ppm | [91] |
| Methanol | Cu-BTC | 25 | Capacitive | 47.3 ppm | [92] |
| Ethanol | Cu-BTC | 25 | Capacitive | 150.5 ppm | [92] |
| H2O | Cu-BTC | RT | Capacitive | 11.3 RH% | [93] |
| Toluene | Pd@ZnO-WO3 (ZIF-8) | 350 | Resistive | 100 ppb | [81] |
| Acetone | Pd@ZnO-SnO2 | 400 | Resistive | 10 ppb | [82] |
| H2S | ZIF-8/ZnO | 25 | Resistive | 50 ppb | [94] |
| Acetone | ZnO@ZIF-CoZn | 260 | Resistive | 0.25 ppm | [95] |
| NH3 | Cu-BTC | RT | Mass | - | [96] |
3. Applications of e-Nose
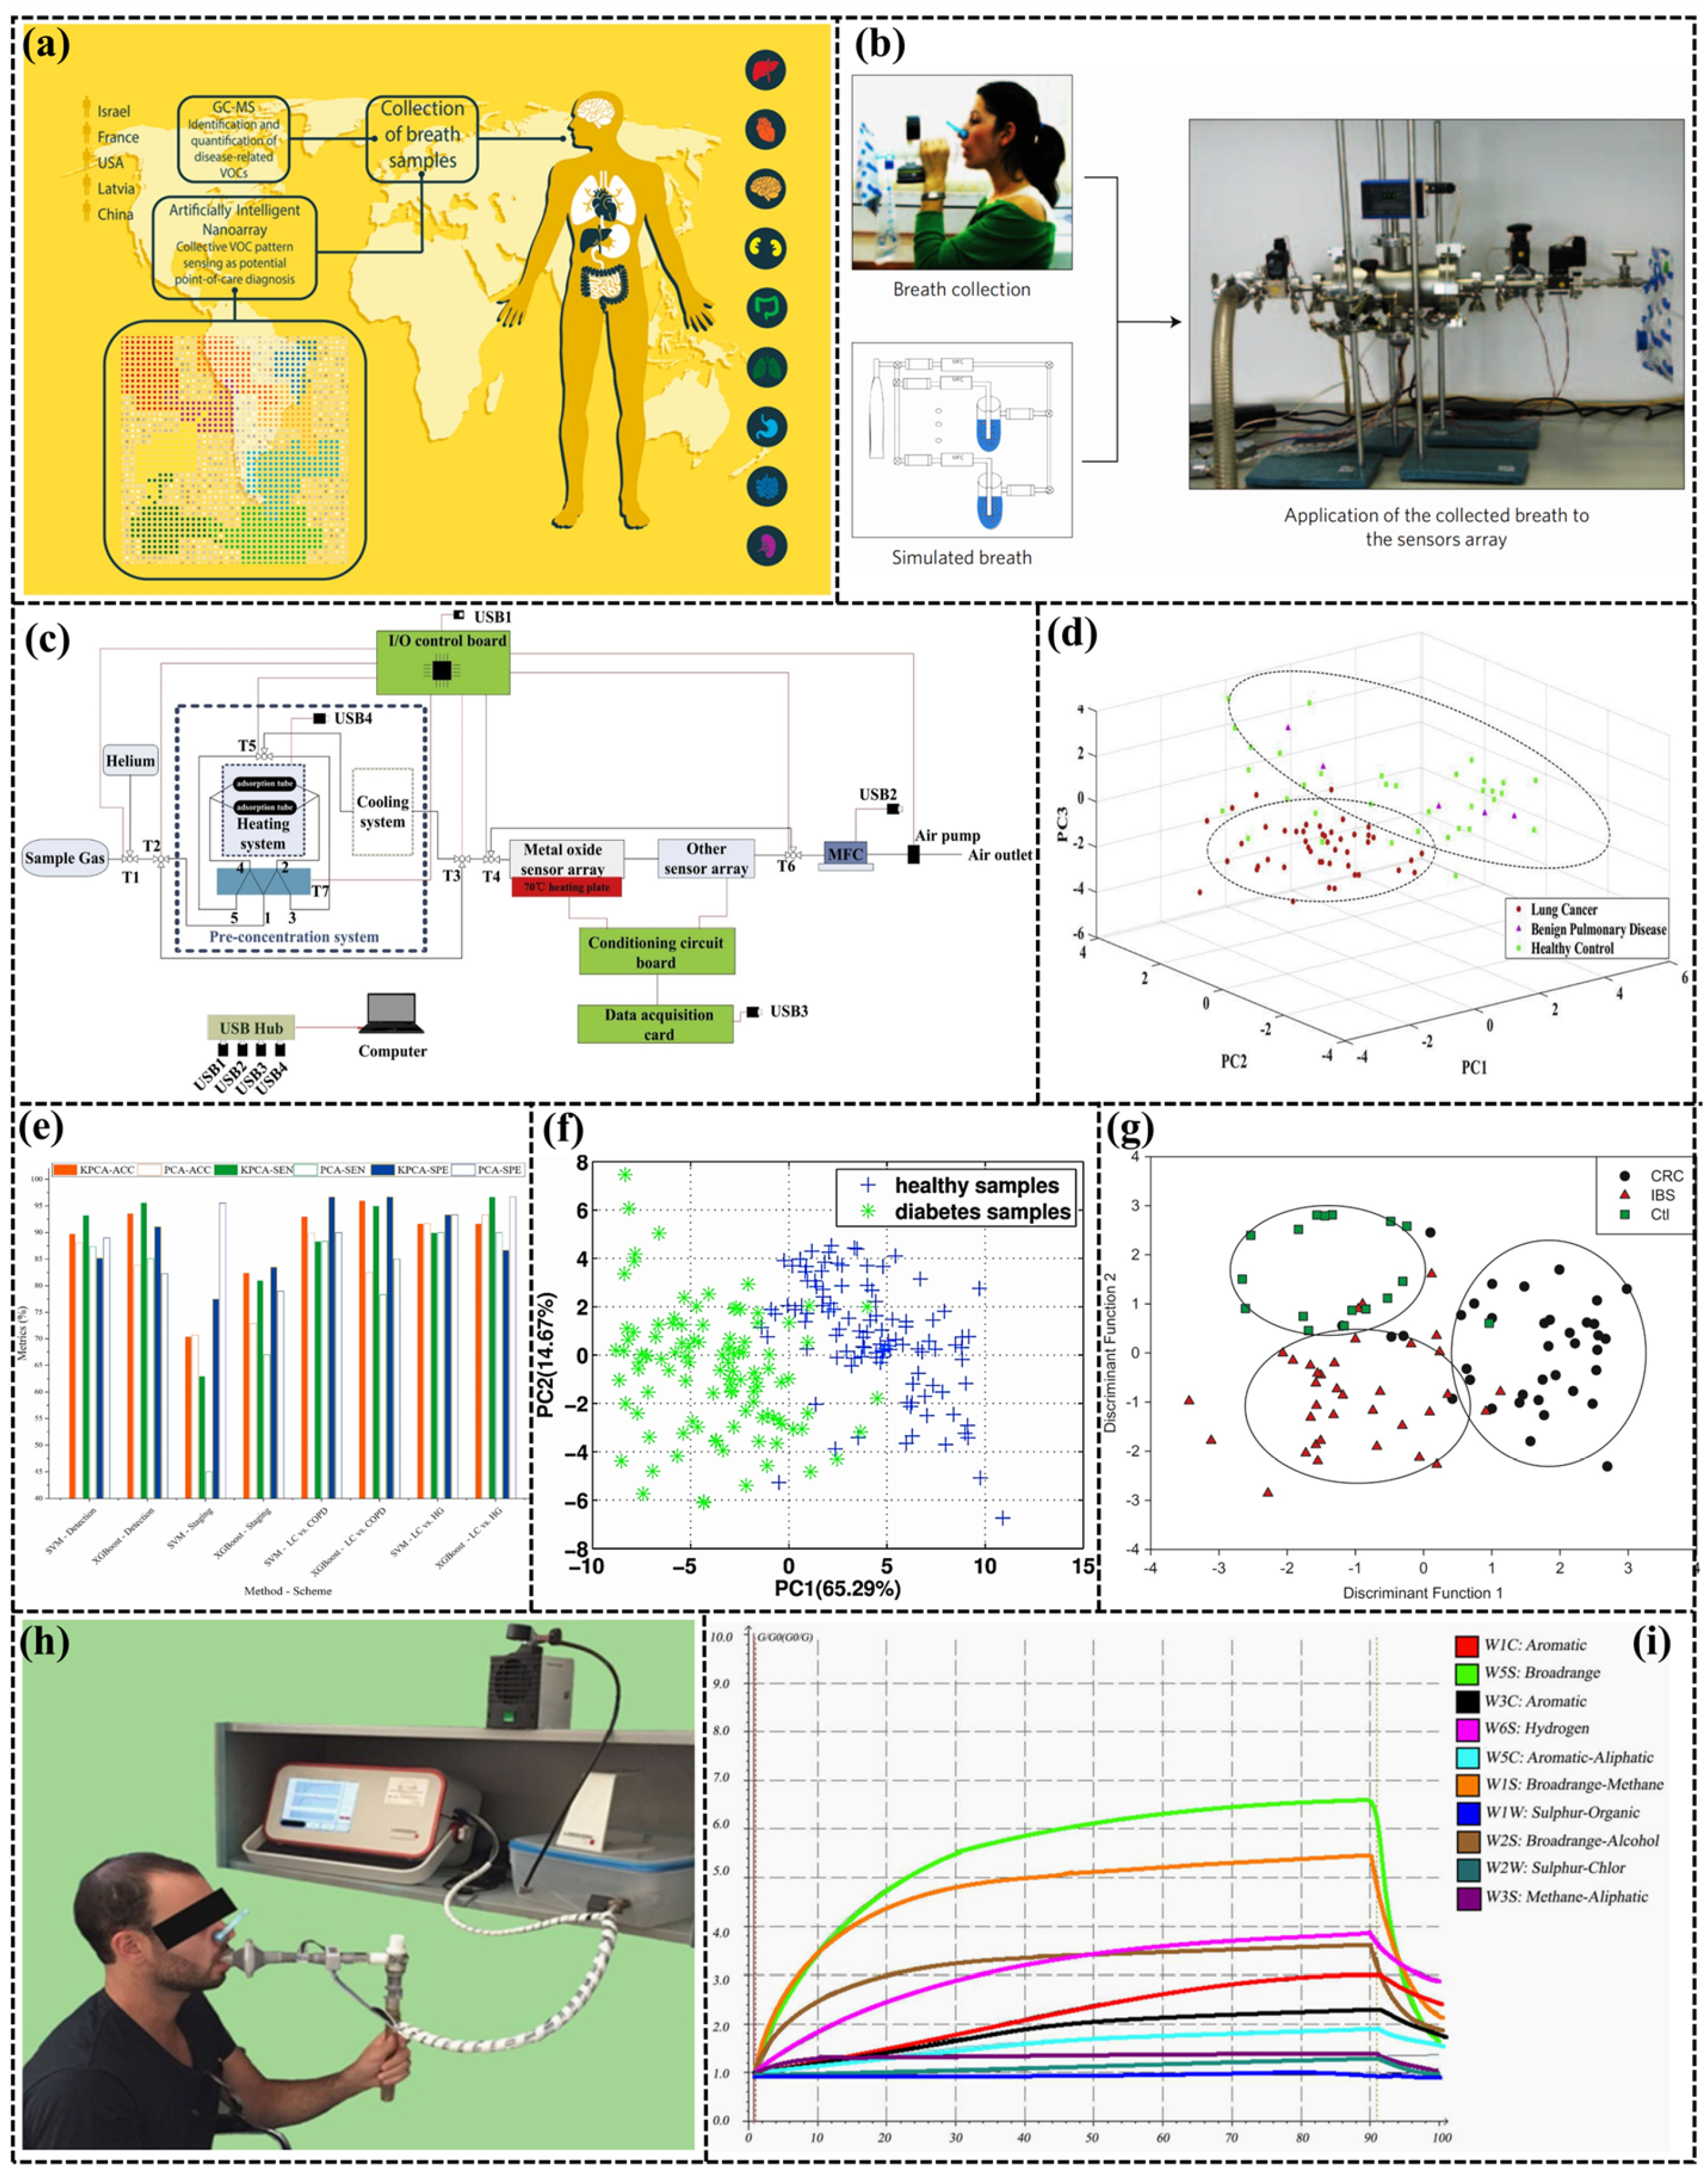
3.1. Medical Care
| Disease | Gas | e-Nose | Sensor Type | Number | Accuracy (%) | Ref. |
|---|---|---|---|---|---|---|
| Diabetes | Acetone, Ethanol, CO, etc. | FIGARO | MOS | 12 | 68.66 | [120] |
| Self-assembly | MOS | 3 | 100 | [108] | ||
| Hanwei | MOS | 6 | 54 | [107] | ||
| Self-assembly | MOS | 3 | - | [121] | ||
| Hanwei | MOS | 5 | 99.44 | [106] | ||
| Self-assembly | QCM | 8 | 74.76 | [122] | ||
| Lung cancer | Formaldehyde, Butane etc. | Self-assembly | MOS, Hot Wire, Solid Electrolyte, Electrochemistry | 19 | 94.25 | [112] |
| Self-assembly | MOS | 5 | 77 | [114] | ||
| Self-assembly | MOS | 7 | 75 | [123] | ||
| Self-assembly | MOS (Pt-, Si-, Pd-, Ti-SnO2) | 4 | - | [115] | ||
| Cyranose320 | Conducting polymer | 32 | 72 | [124] | ||
| Cyranose320 | Conducting polymer | 32 | 70 | [125] | ||
| Cyranose320 | Conducting polymer | 32 | >80 | [126] | ||
| Cyranose320 | Conducting polymer | 32 | 93.4 | [110] | ||
| Self-assembly | QCM | 8 | 85.7 | [111] | ||
| Self-assembly | MOS | 11 | 93.59 | [116] | ||
| Self-assembly | QCM | 8 | 85 | [127] | ||
| Intestinal diseases | H2, Methane etc. | Aeonose | MOS | 3 | 84 | [128] |
| WOLF | Electro-chemical; Infra-red Optical; Photo-ionisation | 13 | 78 | [129] | ||
| Cyranose320 | Conducting polymer | 32 | 85 | [130] | ||
| PEN3 | MOS | 10 | 91 | [131] | ||
| Self-assembly | MOS | 5 | 95 | [132] |
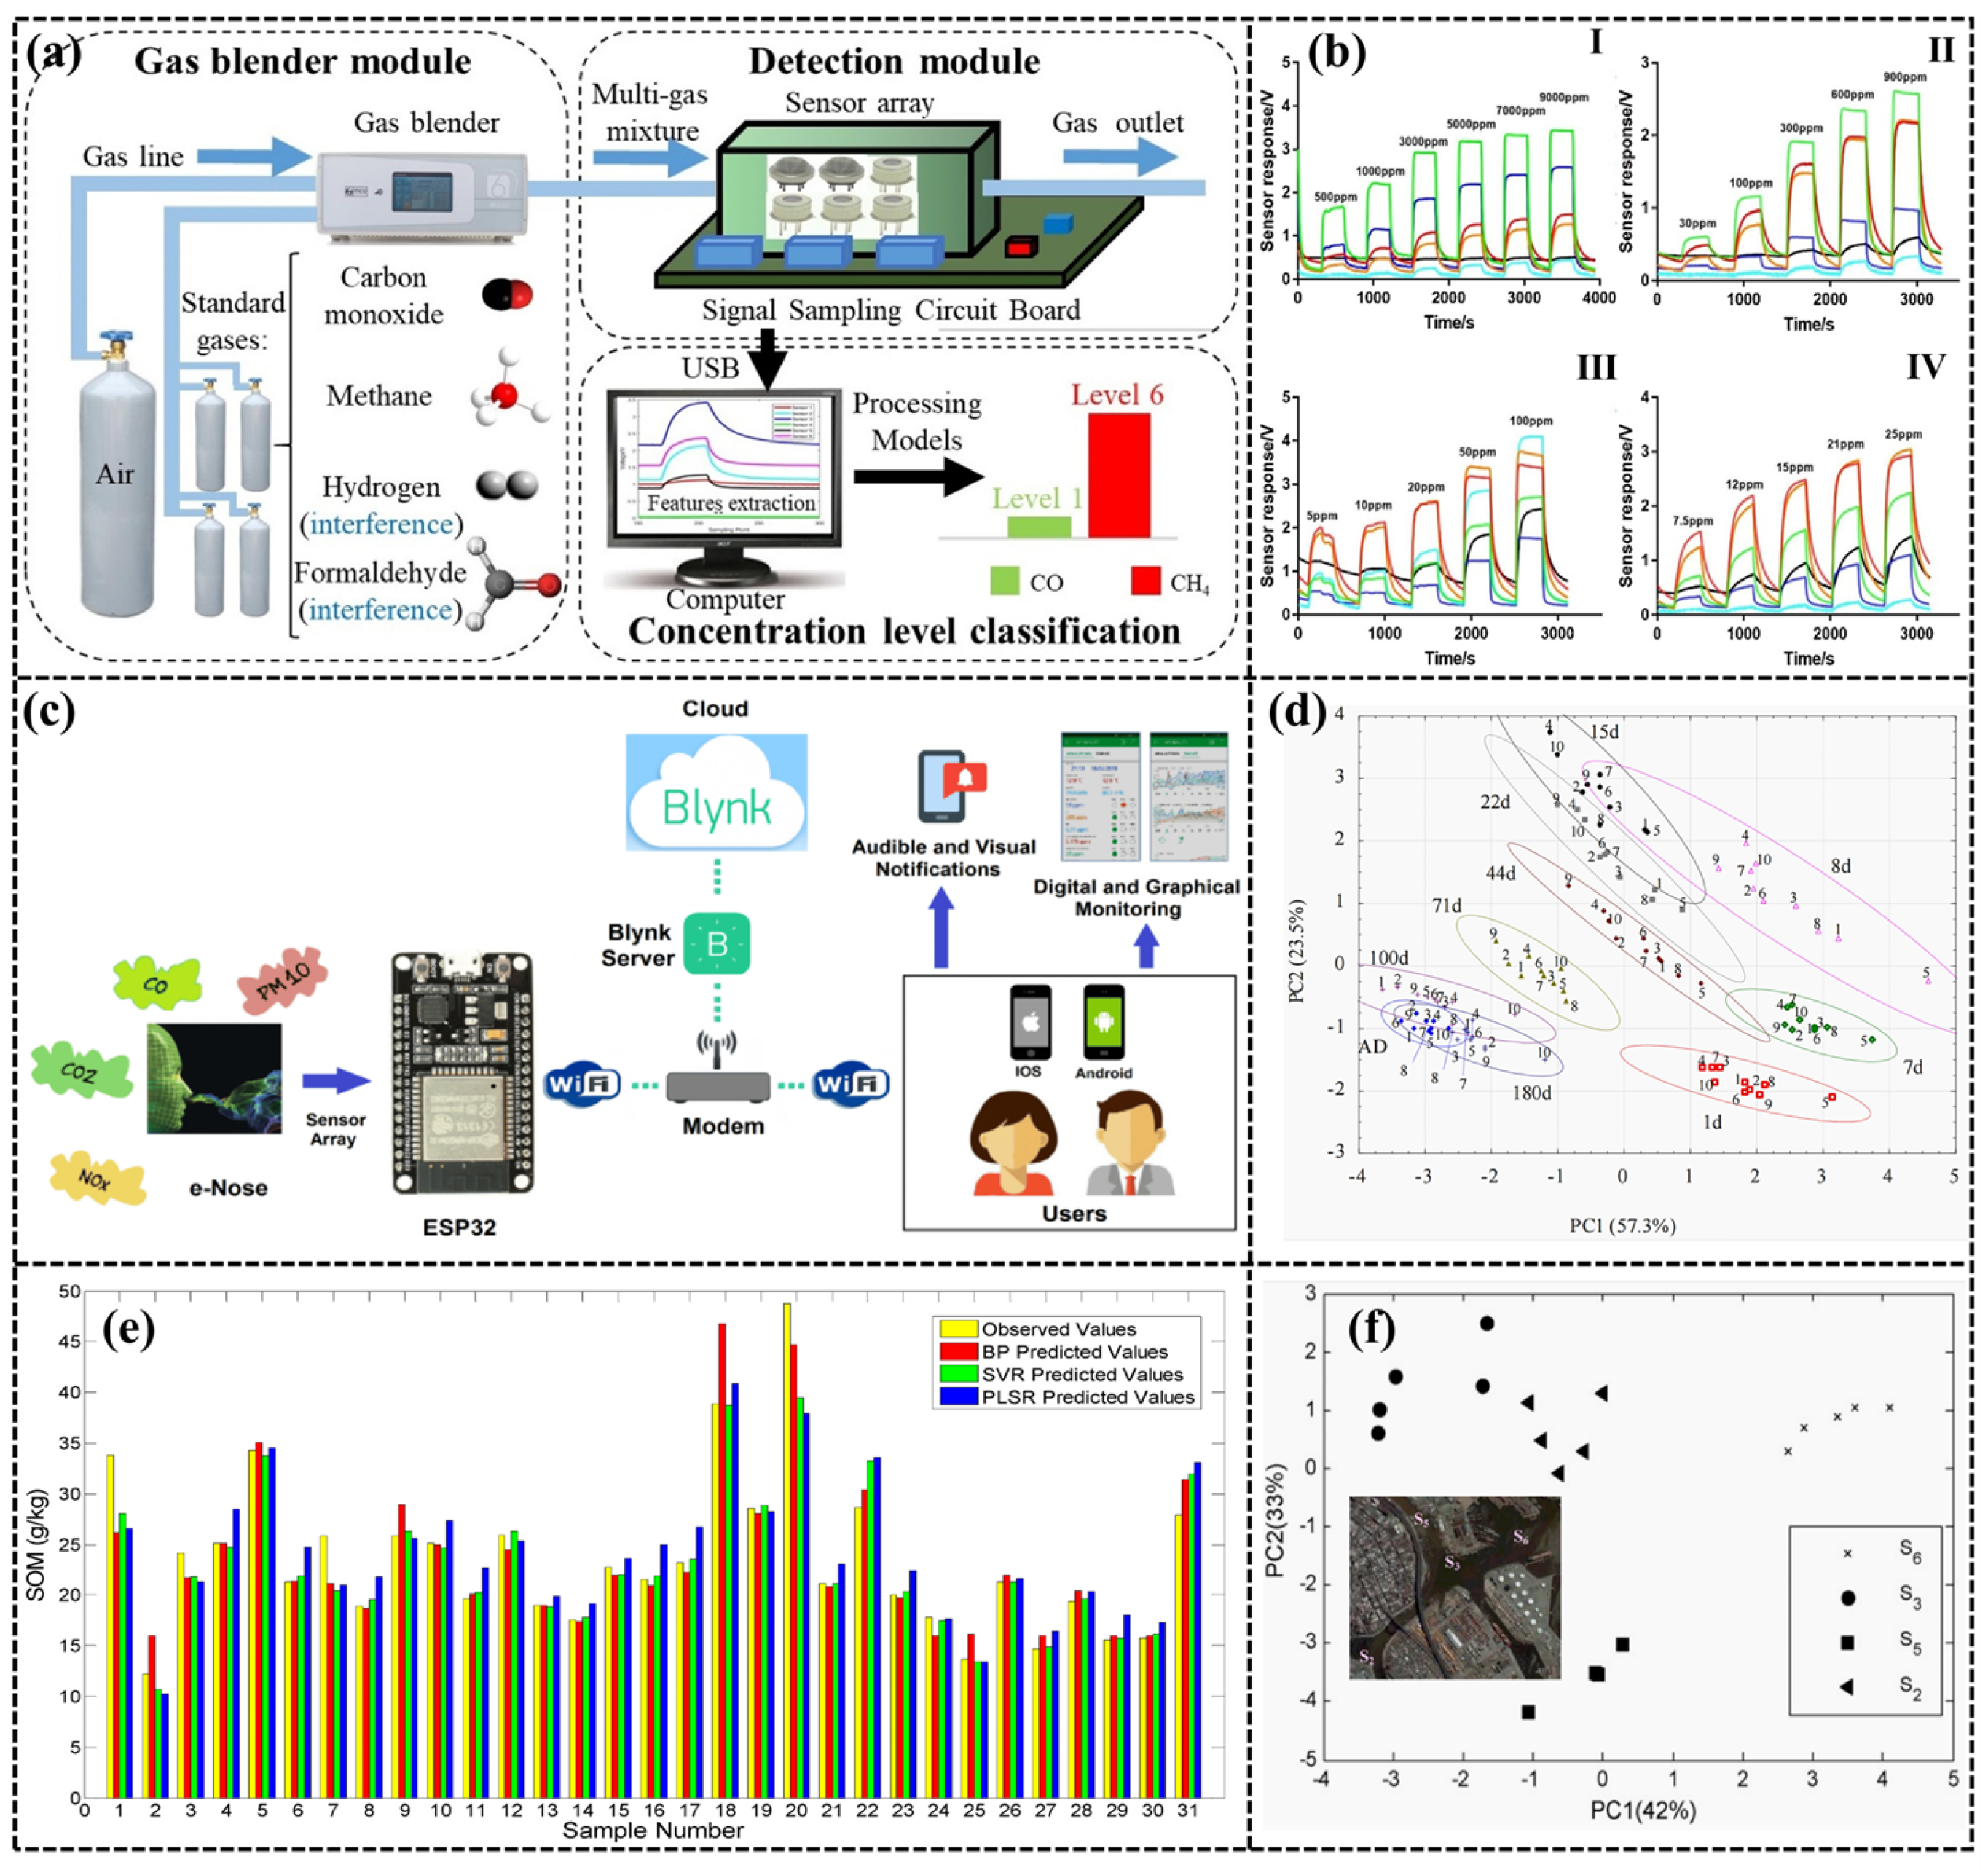
3.2. Environment Monitoring
| Application | Gas Detection | Date Analysis Methods | Sensor Number | Accuracy (%) | Ref. |
|---|---|---|---|---|---|
| Indoor air monitoring | Formaldehyde, Benzene | BP, PSO | 4 | - | [166] |
| Indoor air monitoring | Formaldehyde, Toluene, CO | S4VM | - | 84.37–86.92 | [167] |
| Indoor air monitoring | Benzene | LVQ | 12 | - | [42] |
| Indoor air monitoring | Toluene, CO, NH3 | ISVMEN | 7 | 92.58 | [151] |
| Indoor air monitoring | CO2, CO, NO2 | - | 4 | - | [154] |
| Indoor air monitoring | Formaldehyde, Benzene, Toluene, CO, NH3, CO2 | EDC, SFAM, MLP-BP, individual FLDA, single SVM | 6 | 93.74 | [152] |
| Indoor air monitoring | Formaldehyde, Benzene, Toluene, CO, NH3, NO2 | LSSVM | 4 | 99.38 | [168] |
| Indoor air monitoring | CO, Methane | PCA, LDA, | 6 | 93.35 (CO); 93.22 (Methane) | [153] |
| Indoor air monitoring | Formaldehyde | BP, RBF, SVR | 4 | - | [150] |
| Vehicle Exhaust | NOx | ELM, | - | - | [169] |
| Ambient air quality | Limonene, Ethanol, Dimethyl sulfide | PCA | 6 | >85 | [170] |
| Soil | H2O | PCA, ANN | 8 | [157] |
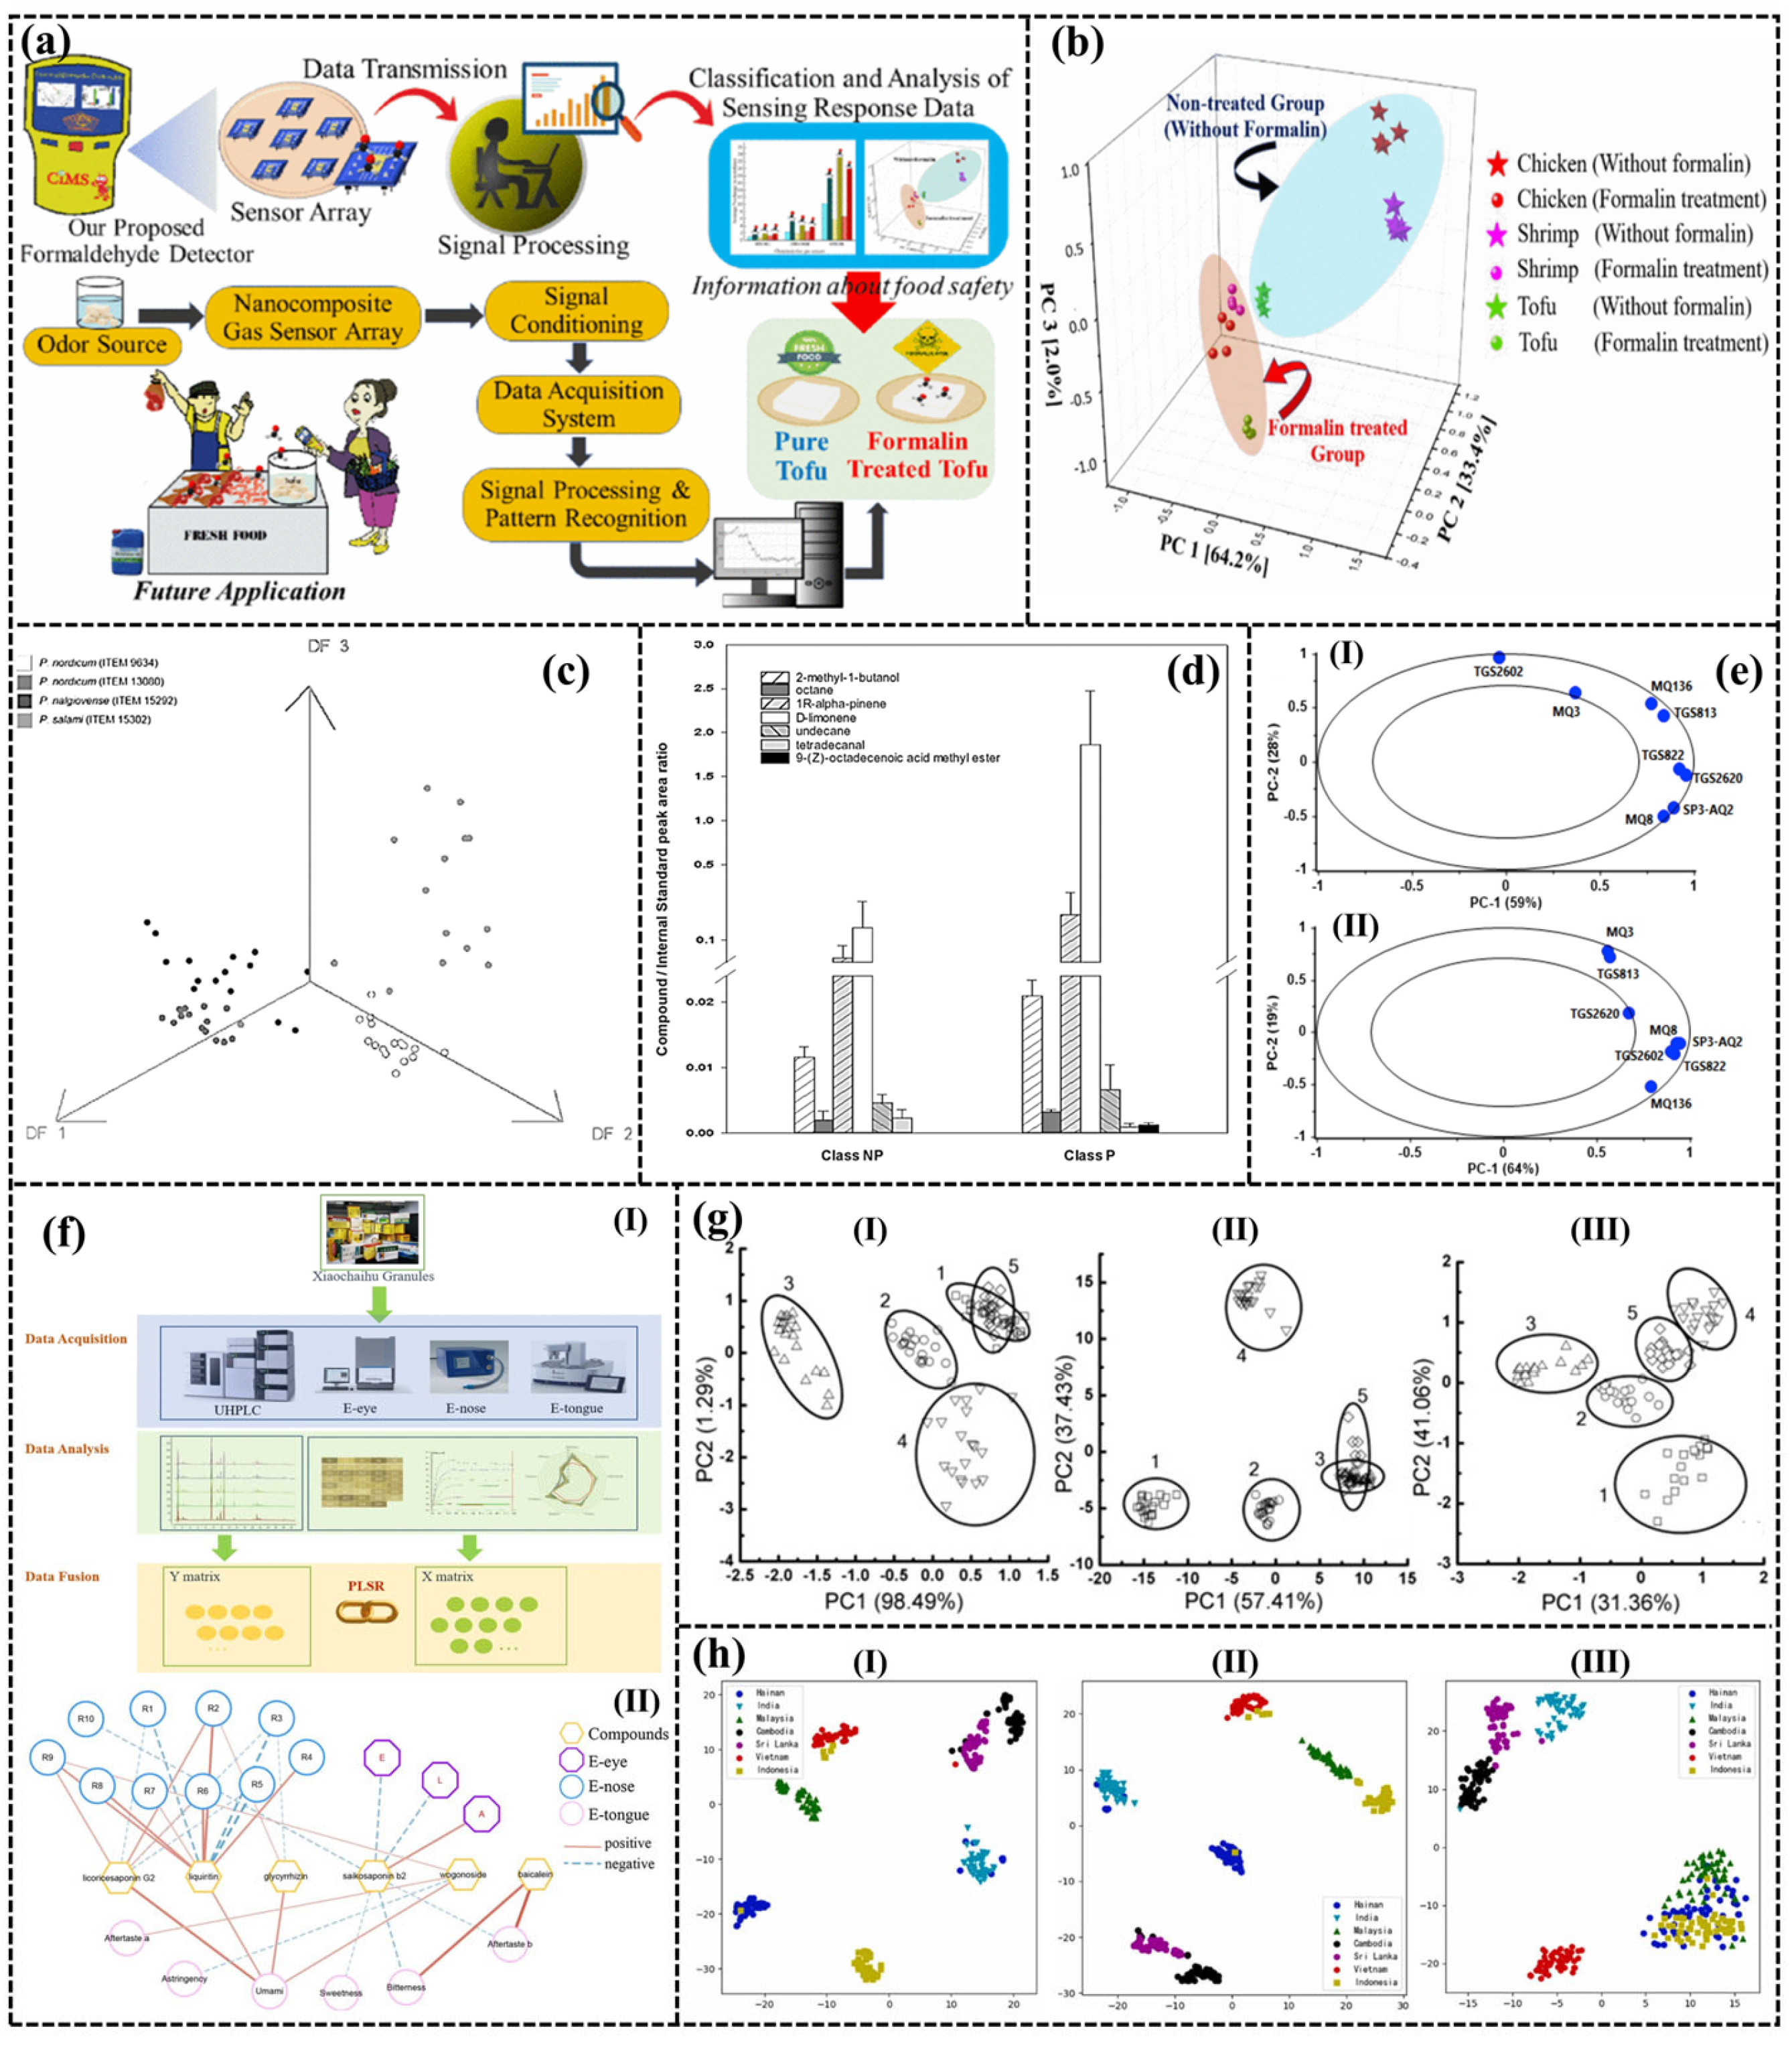
3.3. Agriculture and Food Safety Monitoring
| Application | Gas | Number | Methods | Ref. | |
|---|---|---|---|---|---|
| Meat | Detection of formalin in pork | Formaldehyde | 3 | PCA | [175] |
| Prediction of ochratoxin A on dry-cured meat | 2-Methyl-1-Butanol, Octane, 1R-α-Pinene, et al. | 12 | DFA | [185] | |
| Detection of Meat Spoilage | NH3, Amines, Volatile Sulphur compounds etc. | 8 | PCA, CFWN1111N | [204] | |
| Quality changes of oxidized chicken fat | 2-Alkenal, 2,4-Alkadienal, Carboxylic acid | 18 | PLSR | [205] | |
| Fruit | Penicillium digitatum in post-harvest oranges | Penicillium digitatum | 4 | PCA | [206] |
| Mango quality | Alkenes, Alcohols, Carbon monoxide | 8 | PCA, SR | [207] | |
| Peach quality | Terpenes, Aromatic compounds | 10 | PCA, PLSR | [208] | |
| Agricultural product | Peanut quality | Acid and Peroxide values | 10 | CA, PCA, PLSR | [209] |
| Soft-rot infection in potatoes | CO, NO, Ethylene Oxide | 9 | PCA | [210] | |
| Classification of garlic cultivars | Vinyldithiins | 8 | PCA | [187] | |
| Quality of cherry tomato | - | 14 | PCA, ELM, PLSA | [211] | |
| Caraway cultivars | Aromatic | 8 | PCA, LDA, SVM | [186] | |
| Identification of Tobacco Types and Cigarette Brands | Propanone, ethanol, ethyl acetate, and toluene | 3 | - | [212] | |
| Soft drink | characterize and classify 7 Chinese robusta coffee | - | PCA, KNN, PLSA, BP-ANN | [213] | |
| Monitoring of black tea | Linalool, Nerolidol, Benzaldehyde, Phenyl ethanol, etc. | 8 | PCA, 2NM, MDM | [190] | |
| Aroma profiling of milk adulteration | Formalin, Hydrogen Peroxide, Sodium Hypochlorite | 8 | PCA, LDA | [188] | |
| Analysis of the influence of the type of closure in the organoleptic characteristics of a red wine | Phenol | 15 | PCA, PLS-DA | [202] |
4. Pattern Recognition and Drift Compensation Algorithms
4.1. Pattern Recognition Algorithms
4.1.1. Selection and Classification of Features
4.1.2. Classification Model Selection
4.2. Drift Compensation Algorithm
5. Conclusions
Author Contributions
Funding
Institutional Review Board Statement
Informed Consent Statement
Data Availability Statement
Conflicts of Interest
References
- Craven, M.A.; Gardner, J.W.; Bartlett, P.N. Electronic noses—Development and future prospects. TrAC Trends Anal. Chem. 1996, 15, 486–493. [Google Scholar] [CrossRef]
- Gardner, J.W.; Bartlett, P.N. A brief history of electronic noses. Sens. Actuators B Chem. 1994, 18, 210–211. [Google Scholar] [CrossRef]
- Hu, W.; Wan, L.; Jian, Y.; Ren, C.; Jin, K.; Su, X.; Bai, X.; Haick, H.; Yao, M.; Wu, W. Electronic noses: From advanced materials to sensors aided with data processing. Adv. Mater. Technol. 2019, 4, 1800488–1800525. [Google Scholar] [CrossRef]
- Lu, Y.; Ma, Y.H.; Ma, S.Y.; Jin, W.X.; Yan, S.H.; Xu, X.L.; Jiang, X.H.; Wang, T.T.; Yang, H.M.; Chen, H.; et al. Synthesis of cactus-like NiO nanostructure and their gas-sensing properties. Mater. Lett. 2016, 164, 48–51. [Google Scholar] [CrossRef]
- Patil, V.L.; Vanalakar, S.A.; Patil, P.S.; Kim, J.H. Fabrication of nanostructured ZnO thin films based NO2 gas sensor via SILAR technique. Sens. Actuators B Chem. 2017, 239, 1185–1193. [Google Scholar] [CrossRef]
- Van Toan, N.; Viet Chien, N.; Van Duy, N.; Si Hong, H.; Nguyen, H.; Duc Hoa, N.; Van Hieu, N. Fabrication of highly sensitive and selective H2 gas sensor based on SnO2 thin film sensitized with microsized Pd islands. J. Hazard. Mater. 2016, 301, 433–442. [Google Scholar] [CrossRef]
- Wei, W.; Zhang, H.; Tao, T.; Xia, X.; Bao, Y.; Lourenço, M.; Homewood, K.; Huang, Z.; Gao, Y. A CuO/TiO2 heterojunction based CO sensor with high response and selectivity. Energy Environ. Mater. 2023, 6, 12570–12577. [Google Scholar] [CrossRef]
- Li, J.; Kuppler, R.J.; Zhou, H. Selective gas adsorption and separation in metal–organic frameworks. Chem. Soc. Rev. 2009, 38, 1477–1504. [Google Scholar] [CrossRef]
- Furukawa, H.; Cordova, K.E.; O’Keeffe, M.; Yaghi, O.M. The chemistry and applications of metal-organic frameworks. Science 2013, 341, 1230444–1230456. [Google Scholar] [CrossRef]
- Yan, K.; Kou, L.; Zhang, D. Learning domain-invariant subspace using domain features and independence maximization. IEEE Trans. Cybern. 2018, 48, 288–299. [Google Scholar] [CrossRef]
- Fonollosa, J.; Fernández, L.; Gutiérrez-Gálvez, A.; Huerta, R.; Marco, S. Calibration transfer and drift counteraction in chemical sensor arrays using Direct Standardization. Sens. Actuators B Chem. 2016, 236, 1044–1053. [Google Scholar] [CrossRef]
- Yan, K.; Zhang, D. Feature selection and analysis on correlated gas sensor data with recursive feature elimination. Sens. Actuators B Chem. 2015, 212, 353–363. [Google Scholar] [CrossRef]
- Wojnowski, W.; Majchrzak, T.; Dymerski, T.; Gębicki, J.; Namieśnik, J. Electronic noses: Powerful tools in meat quality assessment. Meat Sci. 2017, 131, 119–131. [Google Scholar] [CrossRef]
- Chen, M.; Wang, Z.; Han, D.; Gu, F.; Guo, G. Porous ZnO polygonal nanoflakes: Synthesis, use in high-sensitivity NO2 gas sensor, and proposed mechanism of gas sensing. J. Phys. Chem. C 2011, 115, 12763–12773. [Google Scholar] [CrossRef]
- Önsten, A.; Stoltz, D.; Palmgren, P.; Yu, S.; Göthelid, M.; Karlsson, U.O. Water adsorption on ZnO(0001): Transition from triangular surface structures to a disordered hydroxyl terminated phase. J. Phys. Chem. C 2010, 114, 11157–11161. [Google Scholar] [CrossRef]
- Yuan, H.; Aljneibi, S.A.A.A.; Yuan, J.; Wang, Y.; Liu, H.; Fang, J.; Tang, C.; Yan, X.; Cai, H.; Gu, Y.; et al. ZnO nanosheets abundant in oxygen vacancies derived from metal-organic frameworks for ppb-level gas sensing. Adv. Mater. 2019, 31, 1807161–1807170. [Google Scholar] [CrossRef]
- Kim, J.-H.; Mirzaei, A.; Kim, H.W.; Kim, S.S. Low-voltage-driven sensors based on ZnO nanowires for room-temperature detection of NO2 and CO Gases. ACS Appl. Mater. Interfaces 2019, 11, 24172–24183. [Google Scholar] [CrossRef]
- Xu, J.; Yu, Y.; He, X.; Sun, J.; Liu, F.; Lu, G. Synthesis of hierarchical ZnO orientation-ordered film by chemical bath deposition and its gas sensing properties. Mater. Lett. 2012, 81, 145–147. [Google Scholar] [CrossRef]
- Hsueh, T.J.; Ding, R.Y. A room temperature ZnO-NPs/MEMS ammonia gas sensor. Nanomaterials 2022, 12, 3287. [Google Scholar] [CrossRef]
- Liu, C.; Wang, B.; Liu, T.; Sun, P.; Gao, Y.; Liu, F.; Lu, G. Facile synthesis and gas sensing properties of the flower-like NiO-decorated ZnO microstructures. Sens. Actuators B Chem. 2016, 235, 294–301. [Google Scholar] [CrossRef]
- Park, S.; Kim, S.; Kheel, H.; Hyun, S.K.; Jin, C.; Lee, C. Enhanced H2S gas sensing performance of networked CuO-ZnO composite nanoparticle sensor. Mater. Res. Bull. 2016, 82, 130–135. [Google Scholar] [CrossRef]
- Wang, L.; Kang, Y.; Wang, Y.; Zhu, B.; Zhang, S.; Huang, W.; Wang, S. CuO nanoparticle decorated ZnO nanorod sensor for low-temperature H2S detection. Mater. Sci. Eng. C 2012, 32, 2079–2085. [Google Scholar] [CrossRef]
- Kim, J.; Kim, W.; Yong, K. CuO/ZnO heterostructured nanorods: Photochemical synthesis and the mechanism of H2S gas sensing. J. Phys. Chem. C 2012, 116, 15682–15691. [Google Scholar] [CrossRef]
- Sun, K.; Zhan, G.; Chen, H.; Lin, S. Low-operating-temperature NO2 sensor based on a CeO2/ZnO heterojunction. Sensors 2021, 21, 8269. [Google Scholar] [CrossRef] [PubMed]
- Lin, C.H.; Hsueh, T.J. A low-temperature ZnO nanowire ethanol gas sensor prepared on plastic substrate. Mater. Res. Express 2016, 3, 095002–095009. [Google Scholar] [CrossRef]
- Han, T.-H.; Bak, S.-Y.; Kim, S.; Lee, S.H.; Han, Y.-J.; Yi, M. Decoration of CuO NWs gas sensor with ZnO NPs for improving NO2 sensing characteristics. Sensors 2021, 21, 2103. [Google Scholar] [CrossRef] [PubMed]
- Fan, K.; Guo, J.; Cha, L.; Chen, Q.; Ma, J. Atomic layer deposition of ZnO onto Fe2O3 nanoplates for enhanced H2S sensing. J. Alloys Compd. 2017, 698, 336–340. [Google Scholar] [CrossRef]
- Umar, A.; Ibrahim, A.A.; Kumar, R.; Algadi, H.; Albargi, H.; Alsairi, M.A.; Alhmami, M.A.M.; Zeng, W.; Ahmed, F.; Akbar, S. CdO–ZnO nanorices for enhanced and selective formaldehyde gas sensing applications. Environ. Res. 2021, 200, 111377–111386. [Google Scholar] [CrossRef] [PubMed]
- Sik Choi, M.; Young Kim, M.; Mirzaei, A.; Kim, H.S.; Kim, S.; Baek, S.H.; Won Chun, D.; Jin, C.; Hyoung Lee, K. Selective, sensitive, and stable NO2 gas sensor based on porous ZnO nanosheets. Appl. Surf. Sci. 2021, 568, 150910–150924. [Google Scholar] [CrossRef]
- Li, D.; Qin, L.; Zhao, P.; Zhang, Y.; Liu, D.; Liu, F.; Kang, B.; Wang, Y.; Song, H.; Zhang, T.; et al. Preparation and gas-sensing performances of ZnO/CuO rough nanotubular arrays for low-working temperature H2S detection. Sens. Actuators B Chem. 2018, 254, 834–841. [Google Scholar] [CrossRef]
- Zhang, S.; Song, P.; Wang, Q.; Ding, Y. Ultra-sensitive triethylamine gas sensor based on ZnO/MoO3 heterostructures with ppb level detection. Sens. Actuators B Chem. 2023, 379, 133239–133247. [Google Scholar] [CrossRef]
- Guo, L.; Wang, Y.; Shang, Y.; Yang, X.; Zhang, S.; Wang, G.; Wang, Y.; Zhang, B.; Zhang, Z. Preparation of Pd/PdO@ZnO-ZnO nanorods by using metal organic framework templated catalysts for selective detection of triethylamine. Sens. Actuators B Chem. 2022, 350, 130840–164771. [Google Scholar] [CrossRef]
- Liu, L.; Mao, C.; Fu, H.; Qu, X.; Zheng, S. ZnO nanorod-immobilized Pt single-atoms as an ultrasensitive sensor for triethylamine detection. ACS Appl. Mater. Interfaces 2023, 15, 16654–16663. [Google Scholar] [CrossRef] [PubMed]
- Zhang, Y.; Wang, C.; Gong, F.; Wang, P.; Guharoy, U.; Yang, C.; Zhang, H.; Fang, S.; Liu, J. Ultrathin agaric-like ZnO with Pd dopant for aniline sensor and DFT investigation. J. Hazard. Mater. 2020, 388, 122069–122079. [Google Scholar] [CrossRef] [PubMed]
- Kei, C.-C.; Wang, C.-C.; Perng, T.-P. Modulation of wall thickness of Al-doped ZnO nanotubes by nanolamination of atomic layer deposition for oxygen sensing. J. Am. Ceram. Soc. 2021, 104, 4938–4945. [Google Scholar] [CrossRef]
- Su, X.; Duan, G.; Xu, Z.; Zhou, F.; Cai, W. Structure and thickness-dependent gas sensing responses to NO2 under UV irradiation for the multilayered ZnO micro/nanostructured porous thin films. J. Colloid Interface Sci. 2017, 503, 150–158. [Google Scholar] [CrossRef]
- Wu, T.; Wang, Z.; Tian, M.; Miao, J.; Zhang, H.; Sun, J. UV excitation NO2 gas sensor sensitized by ZnO quantum dots at room temperature. Sens. Actuators B Chem. 2018, 259, 526–531. [Google Scholar] [CrossRef]
- Wang, J.; Shen, Y.; Li, X.; Xia, Y.; Yang, C. Synergistic effects of UV activation and surface oxygen vacancies on the room-temperature NO2 gas sensing performance of ZnO nanowires. Sens. Actuators B Chem. 2019, 298, 126858–126866. [Google Scholar] [CrossRef]
- Liu, H.; Zhang, L.; Li, H.; Tan, O. Microhotplates for metal oxide semiconductor gas sensor applications—Towards the CMOS-MEMS monolithic approach. Micromachines 2018, 9, 557. [Google Scholar] [CrossRef]
- Huang, J.; Meng, C.; Wang, H.; Ren, H.; Lu, X.; Joo, S.W. Preparation of cross-linked porous SnO2 nanosheets using three-dimensional reduced graphene oxide as a template and their gas sensing property. J. Alloys Compd. 2022, 910, 164763–164771. [Google Scholar] [CrossRef]
- Inaba, M.; Oda, T.; Kono, M.; Phansiri, N.; Morita, T.; Nakahara, S.; Nakano, M.; Suehiro, J. Effect of mixing ratio on NO2 gas sensor response with SnO2-decorated carbon nanotube channels fabricated by one-step dielectrophoretic assembly. Sens. Actuators B Chem. 2021, 344, 130257–130265. [Google Scholar] [CrossRef]
- Chen, J.; Chen, Z.; Boussaid, F.; Zhang, D.; Pan, X.; Zhao, H.; Bermak, A.; Tsui, C.-Y.; Wang, X.; Fan, Z. Ultra-low-power smart electronic nose system based on three-dimensional tin oxide nanotube arrays. ACS Nano 2018, 12, 6079–6088. [Google Scholar] [CrossRef] [PubMed]
- Shin, H.; Jung, W.G.; Kim, D.H.; Jang, J.S.; Kim, Y.H.; Koo, W.T.; Bae, J.; Park, C.; Cho, S.H.; Kim, B.J.; et al. Single-atom Pt stabilized on one-dimensional nanostructure support via carbon nitride/SnO2 heterojunction trapping. ACS Nano 2020, 14, 11394–11405. [Google Scholar] [CrossRef] [PubMed]
- Nascimento, E.P.; Firmino, H.C.T.; Santos, A.M.C.; Sales, H.B.; Silva, V.D.; Macedo, D.A.; Neves, G.A.; Medeiros, E.S.; Menezes, R.R. Facile synthesis of hollow F-doped SnO2 nanofibers and their efficiency in ethanol sensing. J. Am. Ceram. Soc. 2021, 104, 1297–1308. [Google Scholar] [CrossRef]
- Shanmugasundaram, A.; Manorama, S.V.; Kim, D.S.; Jeong, Y.J.; Weon Lee, D. Toward Point-of-Care chronic disease Management: Biomarker detection in exhaled breath using an E-Nose sensor based on rGO/SnO2 superstructures. Chem. Eng. J. 2022, 448, 137736–137749. [Google Scholar] [CrossRef]
- Kang, S.; Mirzaei, A.; Shin, K.Y.; Oum, W.; Yu, D.J.; Kim, S.S.; Kim, H.W. Highly selective NO2 gas sensing with SnO2-Ti3C2Tx nanocomposites synthesized via the microwave process. Sens. Actuators B Chem. 2023, 375, 132882–132893. [Google Scholar] [CrossRef]
- Sun, Y.; Yang, H.; Zhao, Z.; Suematsu, K.; Li, P.; Yu, Z.; Zhang, W.; Hu, J. Fabrication of ZnO quantum dots@SnO2 hollow nanospheres hybrid hierarchical structures for effectively detecting formaldehyde. Sens. Actuators B Chem. 2020, 318, 128222–128231. [Google Scholar] [CrossRef]
- Yang, X.; Zhang, S.; Yu, Q.; Zhao, L.; Sun, P.; Wang, T.; Liu, F.; Yan, X.; Gao, Y.; Liang, X.; et al. One step synthesis of branched SnO2/ZnO heterostructures and their enhanced gas-sensing properties. Sens. Actuators B Chem. 2019, 281, 415–423. [Google Scholar] [CrossRef]
- Li, Y.; Zu, B.; Guo, Y.; Li, K.; Zeng, H.; Dou, X. Surface superoxide complex defects-boosted ultrasensitive ppb-level NO2 gas sensors. Small 2016, 12, 1420–1424. [Google Scholar] [CrossRef]
- Song, Z.; Hu, Z.; Liu, J.; Yan, J.; Li, H.; Jiang, J.; Tang, J.; Liu, H. Metastable antimony-doped SnO2 quantum wires for ultrasensitive gas sensors. Adv. Electron. Mater. 2022, 8, 2101049–2101058. [Google Scholar] [CrossRef]
- Jeong, S.-Y.; Moon, Y.K.; Kim, J.K.; Park, S.-W.; Jo, Y.K.; Kang, Y.C.; Lee, J.-H. Bilayer sensors: A general solution to mitigate water poisoning of oxide chemiresistors: Bilayer sensors with Tb4O7 overlayer. Adv. Funct. Mater. 2021, 31, 2170035–2170046. [Google Scholar] [CrossRef]
- Xu, S.; Gao, J.; Wang, L.; Kan, K.; Xie, Y.; Shen, P.; Li, L.; Shi, K. Role of the heterojunctions in In2O3-composite SnO2 nanorod sensors and their remarkable gas-sensing performance for NOx at room temperature. Nanoscale 2015, 7, 14643–14651. [Google Scholar] [CrossRef]
- Xue, D.; Wang, Y.; Cao, J.; Sun, G.; Zhang, Z. Improving methane gas sensing performance of flower-like SnO2 decorated by WO3 nanoplates. Talanta 2019, 199, 603–611. [Google Scholar] [CrossRef]
- Song, B.; Chen, C.; Li, Y.; Zhang, X.; Cheng, X.; Deng, Z.; Xu, Y.; Huo, L.; Gao, S. Temperature-dependent NO2/diisopropylamine sensor based on SnO2 squama-wrapped tubes derived from waste bamboo shoot skin. Chem. Eng. J. 2023, 473, 145083–145091. [Google Scholar] [CrossRef]
- Liu, J.; Wang, X.; Peng, Q.; Li, Y. Vanadium pentoxide nanobelts: Highly selective and stable ethanol sensor materials. Adv. Mater. 2005, 17, 764–767. [Google Scholar] [CrossRef]
- Kwak, C.H.; Kim, T.H.; Jeong, S.Y.; Yoon, J.W.; Kim, J.S.; Lee, J.H. Humidity-independent oxide semiconductor chemiresistors using terbium-doped SnO2 yolk–shell spheres for real-time breath analysis. ACS Appl. Mater. Interfaces 2018, 10, 18886–18894. [Google Scholar] [CrossRef]
- Sun, Y.; Zhao, Z.; Suematsu, K.; Li, P.; Yu, Z.; Zhang, W.; Hu, J.; Shimanoe, K. Rapid and stable detection of carbon monoxide in changing humidity atmospheres using clustered In2O3/CuO nanospheres. ACS Sens. 2020, 5, 1040–1049. [Google Scholar] [CrossRef]
- Kim, H.-R.; Haensch, A.; Kim, I.-D.; Barsan, N.; Weimar, U.; Lee, J.-H. The role of NiO doping in reducing the impact of humidity on the performance of SnO2-based gas sensors: Synthesis strategies, and phenomenological and spectroscopic studies. Adv. Funct. Mater. 2011, 21, 4456–4463. [Google Scholar] [CrossRef]
- Wang, A.; Li, J.; Zhang, T. Heterogeneous single-atom catalysis. Nat. Rev. Chem. 2018, 2, 65–81. [Google Scholar] [CrossRef]
- Duy, L.T.; Kim, D.-J.; Trung, T.Q.; Dang, V.Q.; Kim, B.Y.; Moon, H.K.; Lee, N.-E. High performance three-dimensional chemical sensor platform using reduced graphene oxide formed on high aspect-ratio micro-pillars. Adv. Funct. Mater. 2015, 25, 883–890. [Google Scholar] [CrossRef]
- Hu, J.; Zou, C.; Su, Y.; Li, M.; Hu, N.; Ni, H.; Yang, Z.; Zhang, Y. Enhanced NO2 sensing performance of reduced graphene oxide by in situ anchoring carbon dots. J. Mater. Chem. C 2017, 5, 6862–6871. [Google Scholar] [CrossRef]
- Zhang, C.; Zhang, S.; Yang, Y.; Yu, H.; Dong, X. Highly sensitive H2S sensors based on metal-organic framework driven γ-Fe2O3 on reduced graphene oxide composites at room temperature. Sens. Actuators B Chem. 2020, 325, 128804–128814. [Google Scholar] [CrossRef]
- Sangale, S.S.; Jadhav, V.V.; Shaikh, S.F.; Shinde, P.V.; Ghule, B.G.; Raut, S.D.; Tamboli, M.S.; Al-Enizi, A.M.; Mane, R.S. Facile one-step hydrothermal synthesis and room-temperature NO2 sensing application of α-Fe2O3 sensor. Mater. Chem. Phys. 2020, 246, 122799–122803. [Google Scholar] [CrossRef]
- Liang, S.; Zhu, J.; Wang, C.; Yu, S.; Bi, H.; Liu, X.; Wang, X. Fabrication of α-Fe2O3@graphene nanostructures for enhanced gas-sensing property to ethanol. Appl. Surf. Sci. 2014, 292, 278–284. [Google Scholar] [CrossRef]
- Zhang, S.; Song, P.; Liu, M.; Zheng, Y.; Wang, Q. Metal-organic framework-derived In-doped Fe2O3 spindles with enhanced acetone gas sensing performance. Inorg. Chem. Commun. 2022, 142, 109658–109665. [Google Scholar] [CrossRef]
- Kim, S.; Park, S.; Sun, G.J.; Hyun, S.K.; Kim, K.K.; Lee, C. Enhanced acetone gas sensing performance of the multiple-networked Fe2O3-functionalized In2O3 nanowire sensor. Curr. Appl. Phys. 2015, 15, 947–952. [Google Scholar] [CrossRef]
- Shoorangiz, M.; Shariatifard, L.; Roshan, H.; Mirzaei, A. Selective ethanol sensor based on α-Fe2O3 nanoparticles. Inorg. Chem. Commun. 2021, 133, 108961–108967. [Google Scholar] [CrossRef]
- Zhuang, Z.; Zhang, L.; Huang, C.; Wang, X.; Guo, H.; Thomas, T.; Qu, F.; Wang, P.; Yang, M. A dimethyl disulfide gas sensor based on nanosized Pt-loaded tetrakaidecahedral α-Fe2O3 nanocrystals. Nanotechnology 2022, 33, 405502–405511. [Google Scholar] [CrossRef]
- Zhang, S.; Yang, M.; Liang, K.; Turak, A.; Zhang, B.; Meng, D.; Wang, C.; Qu, F.; Cheng, W.; Yang, M. An acetone gas sensor based on nanosized Pt-loaded Fe2O3 nanocubes. Sens. Actuators B Chem. 2019, 290, 59–67. [Google Scholar] [CrossRef]
- Ai, T.; Li, J.; Nie, S.; Yin, Y.; Lu, J.; Bao, S.; Yan, L. High-performance H2 gas sensor based on Mn-doped α-Fe2O3 polyhedrons from N, N-dimethylformamide assisted hydrothermal synthesis. Int. J. Hydrogen Energy 2022, 47, 20561–20571. [Google Scholar] [CrossRef]
- Shen, J.; Xu, S.; Zhao, C.; Qiao, X.; Liu, H.; Zhao, Y.; Wei, J.; Zhu, Y. Bimetallic Au@Pt nanocrystal sensitization mesoporous α-Fe2O3 hollow nanocubes for highly sensitive and rapid detection of fish freshness at low temperature. ACS Appl. Mater. Interfaces 2021, 13, 57597–57608. [Google Scholar] [CrossRef]
- Tian, K.; Wang, X.; Yu, Z.; Li, H.; Guo, X. Hierarchical and Hollow Fe2O3 Nanoboxes Derived from Metal–Organic Frameworks with Excellent Sensitivity to H2S. ACS Appl. Mater. Interfaces 2017, 9, 29669–29676. [Google Scholar] [CrossRef] [PubMed]
- Zhu, L.; Miao, X.; Ou, L.; Mao, L.; Yuan, K.; Sun, S.; Devi, A.; Lu, H. Heterostructured α-Fe2O3@ZnO@ZIF-8 core–shell nanowires for a highly selective MEMS-based ppb-level H2S gas sensor system. Small 2022, 18, 2204828–2204842. [Google Scholar] [CrossRef]
- Zhang, Y.; Liu, Y.; Zhou, L.; Liu, D.; Liu, F.; Liu, F.; Liang, X.; Yan, X.; Gao, Y.; Lu, G. The role of Ce doping in enhancing sensing performance of ZnO-based gas sensor by adjusting the proportion of oxygen species. Sens. Actuators B Chem. 2018, 273, 991–998. [Google Scholar] [CrossRef]
- Ou, L.X.; Liu, M.Y.; Zhu, L.Y.; Zhang, D.W.; Lu, H.L. Recent progress on flexible room-temperature gas sensors based on metal oxide semiconductor. Nano-Micro Lett. 2022, 14, 206–248. [Google Scholar] [CrossRef]
- Gao, C.; Tian, H.; Ai, J.; Li, L.; Dang, S.; Lan, Y.; Sun, Z. Correction: A microporous Cu-MOF with optimized open metal sites and pore spaces for high gas storage and active chemical fixation of CO2. Chem. Commun. 2018, 54, 7093–7094. [Google Scholar] [CrossRef]
- Zhu, Y.-M.; Zeng, C.-H.; Chu, T.-S.; Wang, H.-M.; Yang, Y.-Y.; Tong, Y.-X.; Su, C.-Y.; Wong, W.-T. A novel highly luminescent LnMOF film: A convenient sensor for Hg2+ detecting. J. Mater. Chem. A 2013, 1, 11312–11319. [Google Scholar] [CrossRef]
- Qin, X.; Sun, Y.; Wang, N.; Wei, Q.; Xie, L.; Xie, Y.; Li, J.-R. Nanostructure array assisted aggregation-based growth of a Co-MOF-74 membrane on a Ni-foam substrate for gas separation. RSC Adv. 2016, 6, 94177–94183. [Google Scholar] [CrossRef]
- Wang, T.; Gao, L.; Hou, J.; Herou, S.J.A.; Griffiths, J.T.; Li, W.; Dong, J.; Gao, S.; Titirici, M.-M.; Kumar, R.V.; et al. Rational approach to guest confinement inside MOF cavities for low-temperature catalysis. Nat. Commun. 2019, 10, 1340–1348. [Google Scholar] [CrossRef]
- Assen, A.H.; Belmabkhout, Y.; Adil, K.; Bhatt, P.M.; Xue, D.-X.; Jiang, H.; Eddaoudi, M. Ultra-tuning of the rare-earth fcu-MOF aperture size for selective molecular exclusion of branched paraffins. Angew. Chem. Int. Ed. 2015, 54, 14353–14358. [Google Scholar] [CrossRef]
- Koo, W.-T.; Choi, S.-J.; Kim, S.-J.; Jang, J.-S.; Tuller, H.L.; Kim, I.-D. Heterogeneous sensitization of metal–organic framework driven metal@metal oxide complex catalysts on an oxide nanofiber scaffold toward superior gas sensors. J. Am. Chem. Soc. 2016, 138, 13431–13437. [Google Scholar] [CrossRef]
- Koo, W.-T.; Jang, J.-S.; Choi, S.-J.; Cho, H.-J.; Kim, I.-D. Metal–organic framework templated catalysts: Dual sensitization of PdO–ZnO composite on hollow SnO2 nanotubes for selective acetone sensors. ACS Appl. Mater. Interfaces 2017, 9, 18069–18077. [Google Scholar] [CrossRef]
- Yassine, O.; Shekhah, O.; Assen, A.H.; Belmabkhout, Y.; Salama, K.N.; Eddaoudi, M. H2S sensors: Fumarate-based fcu-MOF thin film grown on a capacitive interdigitated electrode. Angew. Chem. Int. Ed. 2016, 55, 15879–15883. [Google Scholar] [CrossRef]
- Surya, S.G.; Bhanoth, S.; Majhi, S.M.; More, Y.D.; Teja, V.M.; Chappanda, K.N. A silver nanoparticle-anchored UiO-66(Zr) metal–organic framework (MOF)-based capacitive H2S gas sensor. CrystEngComm 2019, 21, 7303–7312. [Google Scholar] [CrossRef]
- Tchalala, M.R.; Belmabkhout, Y.; Adil, K.; Chappanda, K.N.; Cadiau, A.; Bhatt, P.M.; Salama, K.N.; Eddaoudi, M. Concurrent sensing of CO2 and H2O from air using ultramicroporous fluorinated metal–organic frameworks: Effect of transduction mechanism on the sensing performance. ACS Appl. Mater. Interfaces 2019, 11, 1706–1712. [Google Scholar] [CrossRef]
- Yuan, H.; Tao, J.; Li, N.; Karmakar, A.; Tang, C.; Cai, H.; Pennycook, S.J.; Singh, N.; Zhao, D. On-chip tailorability of capacitive Gas Sensors Integrated with Metal–Organic Framework Films. Angew. Chem. Int. Ed. 2019, 58, 14089–14094. [Google Scholar] [CrossRef]
- Chernikova, V.; Yassine, O.; Shekhah, O.; Eddaoudi, M.; Salama, K.N. Highly sensitive and selective SO2 MOF sensor: The integration of MFM-300 MOF as a sensitive layer on a capacitive interdigitated electrode. J. Mater. Chem. A 2018, 6, 5550–5554. [Google Scholar] [CrossRef]
- Assen, A.H.; Yassine, O.; Shekhah, O.; Eddaoudi, M.; Salama, K.N. MOFs for the sensitive detection of ammonia: Deployment of fcu-MOF thin films as effective chemical capacitive sensors. ACS Sens. 2017, 2, 1294–1301. [Google Scholar] [CrossRef] [PubMed]
- Sachdeva, S.; Soccol, D.; Gravesteijn, D.J.; Kapteijn, F.; Sudhölter, E.J.R.; Gascon, J.; de Smet, L.C.P.M. Polymer–metal organic framework composite films as affinity layer for capacitive sensor devices. ACS Sens. 2016, 1, 1188–1192. [Google Scholar] [CrossRef]
- Andrés, M.A.; Vijjapu, M.T.; Surya, S.G.; Shekhah, O.; Salama, K.N.; Serre, C.; Eddaoudi, M.; Roubeau, O.; Gascón, I. Methanol and humidity capacitive sensors based on thin films of MOF nanoparticles. ACS Appl. Mater. Interfaces 2020, 12, 4155–4162. [Google Scholar] [CrossRef] [PubMed]
- Sachdeva, S.; Venkatesh, M.R.; Mansouri, B.E.; Wei, J.; Bossche, A.; Kapteijn, F.; Zhang, G.Q.; Gascon, J.; de Smet, L.C.P.M.; Sudhölter, E.J.R. Sensitive and reversible detection of methanol and water vapor by in situ electrochemically grown CuBTC MOFs on interdigitated electrodes. Small 2017, 13, 1604150–1604155. [Google Scholar] [CrossRef]
- Hosseini, M.S.; Zeinali, S.; Sheikhi, M.H. Fabrication of capacitive sensor based on Cu-BTC (MOF-199) nanoporous film for detection of ethanol and methanol vapors. Sens. Actuators B Chem. 2016, 230, 9–16. [Google Scholar] [CrossRef]
- Liu, J.; Sun, F.; Zhang, F.; Wang, Z.; Zhang, R.; Wang, C.; Qiu, S. In situ growth of continuous thin metal–organic framework film for capacitive humidity sensing. J. Mater. Chem. 2011, 21, 3775–3778. [Google Scholar] [CrossRef]
- Wu, X.; Xiong, S.; Gong, Y.; Gong, Y.; Wu, W.; Mao, Z.; Liu, Q.; Hu, S.; Long, X. MOF-SMO hybrids as a H2S sensor with superior sensitivity and selectivity. Sens. Actuators B Chem. 2019, 292, 32–39. [Google Scholar] [CrossRef]
- Yao, M.S.; Tang, W.X.; Wang, G.E.; Nath, B.; Xu, G. MOF thin film-coated metal oxide nanowire array: Significantly improved chemiresistor sensor performance. Adv. Mater. 2016, 28, 5229–5234. [Google Scholar] [CrossRef]
- Zhuang, J.-L.; Ar, D.; Yu, X.-J.; Liu, J.-X.; Terfort, A. Patterned deposition of metal-organic frameworks onto plastic, paper, and textile substrates by inkjet printing of a precursor solution. Adv. Mater. 2013, 25, 4631–4635. [Google Scholar] [CrossRef]
- Konvalina, G.; Haick, H. Sensors for breath testing: From nanomaterials to comprehensive disease detection. Acc. Chem. Res. 2014, 47, 66–76. [Google Scholar] [CrossRef]
- Hakim, M.; Broza, Y.Y.; Barash, O.; Peled, N.; Phillips, M.; Amann, A.; Haick, H. Volatile organic compounds of lung cancer and possible biochemical pathways. Chem. Rev. 2012, 112, 5949–5966. [Google Scholar] [CrossRef]
- Di Natale, C.; Paolesse, R.; Martinelli, E.; Capuano, R. Solid-state gas sensors for breath analysis: A review. Anal. Chim. Acta 2014, 824, 1–17. [Google Scholar] [CrossRef] [PubMed]
- Turner, C. Techniques and issues in breath and clinical sample headspace analysis for disease diagnosis. Bioanalysis 2016, 8, 677–690. [Google Scholar] [CrossRef] [PubMed]
- Boots, A.W.; van Berkel, J.J.B.N.; Dallinga, J.W.; Smolinska, A.; Wouters, E.F.; van Schooten, F.J. The versatile use of exhaled volatile organic compounds in human health and disease. J. Breath Res. 2012, 6, 027108–027129. [Google Scholar] [CrossRef]
- Peng, G.; Tisch, U.; Adams, O.; Hakim, M.; Shehada, N.; Broza, Y.Y.; Billan, S.; Abdah-Bortnyak, R.; Kuten, A.; Haick, H. Diagnosing lung cancer in exhaled breath using gold nanoparticles. Nat. Nanotechnol. 2009, 4, 669–673. [Google Scholar] [CrossRef]
- Wolf, A.; Baumbach, J.I.; Kleber, A.; Maurer, F.; Maddula, S.; Favrod, P.; Jang, M.; Fink, T.; Volk, T.; Kreuer, S. Multi-capillary column-ion mobility spectrometer (MCC-IMS) breath analysis in ventilated rats: A model with the feasibility of long-term measurements. J. Breath Res. 2014, 8, 016006–016017. [Google Scholar] [CrossRef] [PubMed]
- Collins, A.J.; Kasiske, B.; Herzog, C.; Chavers, B.; Foley, R.; Gilbertson, D.; Grimm, R.; Liu, J.; Louis, T.; Manning, W.; et al. United states renal data system 2006 annual data report abstract. Am. J. Kidney Dis. 2007, 49, 6–7. [Google Scholar] [CrossRef] [PubMed]
- Zhan, X.; Wang, Z.; Yang, M.; Luo, Z.; Wang, Y.; Li, G. An electronic nose-based assistive diagnostic prototype for lung cancer detection with conformal prediction. Measurement 2020, 158, 107588–107597. [Google Scholar] [CrossRef]
- Zaim, O.; Bouchikhi, B.; Motia, S.; Abelló, S.; Llobet, E.; El Bari, N. Discrimination of diabetes mellitus patients and healthy individuals based on volatile organic compounds (VOCs): Analysis of exhaled breath and urine samples by using e-nose and VE-tongue. Chemosensors 2023, 11, 350. [Google Scholar] [CrossRef]
- Saidi, T.; Zaim, O.; Moufid, M.; El Bari, N.; Ionescu, R.; Bouchikhi, B. Exhaled breath analysis using electronic nose and gas chromatography–mass spectrometry for non-invasive diagnosis of chronic kidney disease, diabetes mellitus and healthy subjects. Sens. Actuators B Chem. 2018, 257, 178–188. [Google Scholar] [CrossRef]
- Boumali, S.; Benhabiles, M.T.; Bouziane, A.; Kerrour, F.; Aguir, K. Acetone discriminator and concentration estimator for diabetes monitoring in human breath. Semicond. Sci. Technol. 2021, 36, 085010–085018. [Google Scholar] [CrossRef]
- Staerz, A.; Weimar, U.; Barsan, N. Understanding the potential of WO3 based sensors for breath analysis. Sensors 2016, 16, 1815. [Google Scholar] [CrossRef]
- Machado, R.; Laskowski, D.; Deffenderfer, O.; Burch, T.; Zheng, S.; Mazzone, P.; Mekhail, T.; Jennings, C.; Stoller, J.; Pyle, J.; et al. Detection of lung cancer by sensor array analyses of exhaled breath. Am. J. Respir. Crit. Care Med. 2005, 171, 1286–1291. [Google Scholar] [CrossRef]
- D’Amico, A.; Pennazza, G.; Santonico, M.; Martinelli, E.; Roscioni, C.; Galluccio, G.; Paolesse, R.; Di Natale, C. An investigation on electronic nose diagnosis of lung cancer. Lung Cancer 2010, 68, 170–176. [Google Scholar] [CrossRef] [PubMed]
- Liu, B.; Yu, H.; Zeng, X.; Zhang, D.; Gong, J.; Tian, L.; Qian, J.; Zhao, L.; Zhang, S.; Liu, R. Lung cancer detection via breath by electronic nose enhanced with a sparse group feature selection approach. Sens. Actuators B Chem. 2021, 339, 129896–129907. [Google Scholar] [CrossRef]
- Reji, R.P.; Balaji, S.K.C.; Sivalingam, Y.; Kawazoe, Y.; Velappa Jayaraman, S. First-principles density functional theory calculations on the potential of Sc2CO2 MXene nanosheets as a dual-mode sensor for detection of volatile organic compounds in exhaled human breath. ACS Appl. Nano Mater. 2023, 6, 5345–5356. [Google Scholar] [CrossRef]
- Marzorati, D.; Mainardi, L.; Sedda, G.; Gasparri, R.; Spaggiari, L.; Cerveri, P. MOS sensors array for the discrimination of lung cancer and At-risk subjects with exhaled breath analysis. Chemosensors 2021, 9, 209. [Google Scholar] [CrossRef]
- Güntner, A.T.; Koren, V.; Chikkadi, K.; Righettoni, M.; Pratsinis, S.E. E-Nose Sensing of Low-ppb Formaldehyde in Gas Mixtures at High Relative Humidity for Breath Screening of Lung Cancer? ACS Sens. 2016, 1, 528–535. [Google Scholar] [CrossRef]
- Chen, K.; Liu, L.; Nie, B.; Lu, B.; Fu, L.; He, Z.; Li, W.; Pi, X.; Liu, H. Recognizing lung cancer and stages using a self-developed electronic nose system. Comput. Biol. Med. 2021, 131, 104294–104302. [Google Scholar] [CrossRef]
- Kischkel, S.; Miekisch, W.; Sawacki, A.; Straker, E.M.; Trefz, P.; Amann, A.; Schubert, J.K. Breath biomarkers for lung cancer detection and assessment of smoking related effects—confounding variables, influence of normalization and statistical algorithms. Clin. Chim. Acta 2010, 411, 1637–1644. [Google Scholar] [CrossRef] [PubMed]
- Heuser, V.D.; Erdtmann, B.; Kvitko, K.; Rohr, P.; da Silva, J. Evaluation of genetic damage in Brazilian footwear-workers: Biomarkers of exposure, effect, and susceptibility. Toxicology 2007, 232, 235–247. [Google Scholar] [CrossRef]
- Nakhleh, M.K.; Amal, H.; Jeries, R.; Broza, Y.Y.; Aboud, M.; Gharra, A.; Ivgi, H.; Khatib, S.; Badarneh, S.; Har-Shai, L.; et al. Diagnosis and classification of 17 diseases from 1404 subjects via pattern analysis of exhaled molecules. ACS Nano 2017, 11, 112–125. [Google Scholar] [CrossRef]
- Guo, D.; Zhang, D.; Zhang, L.; Lu, G. Non-invasive blood glucose monitoring for diabetics by means of breath signal analysis. Sens. Actuators B Chem. 2012, 173, 106–113. [Google Scholar] [CrossRef]
- Jeon, J.Y.; Choi, J.S.; Yu, J.B.; Lee, H.R.; Jang, B.K.; Byun, H.G. Sensor array optimization techniques for exhaled breath analysis to discriminate diabetics using an electronic nose. ETRI J. 2018, 40, 802–812. [Google Scholar] [CrossRef]
- Saraoğlu, H.M.; Selvi, A.O.; Ebeoğlu, M.A.; Taşaltin, C. Electronic nose system based on Quartz Crystal Microbalance sensor for blood glucose and HbA1c levels from exhaled breath odor. IEEE Sens. J. 2013, 13, 4229–4235. [Google Scholar] [CrossRef]
- Chang, J.E.; Lee, D.S.; Ban, S.W.; Oh, J.; Jung, M.Y.; Kim, S.H.; Park, S.; Persaud, K.; Jheon, S. Analysis of volatile organic compounds in exhaled breath for lung cancer diagnosis using a sensor system. Sens. Actuators B Chem. 2018, 255, 800–807. [Google Scholar] [CrossRef]
- Bikov, A.; Hernadi, M.; Korosi, B.Z.; Kunos, L.; Zsamboki, G.; Sutto, Z.; Tarnoki, A.D.; Tarnoki, D.L.; Losonczy, G.; Horvath, I. Expiratory flow rate, breath hold and anatomic dead space influence electronic nose ability to detect lung cancer. BMC Pulm. Med. 2014, 14, 202–210. [Google Scholar] [CrossRef] [PubMed]
- Hubers, A.J.; Paul, B.; Remco, J.B.; Robert, J.R.; Birgit, I.W.; Aeilko, H.Z.; Daniëlle, A.M.H.; Sylvia, D.; Remco, K.; Renske, D.M.S.; et al. Combined sputum hypermethylation and eNose analysis for lung cancer diagnosis. J. Clin. Pathol. 2014, 67, 707–711. [Google Scholar] [CrossRef] [PubMed]
- McWilliams, A.; Beigi, P.; Srinidhi, A.; Lam, S.; MacAulay, C.E. Sex and smoking status effects on the early detection of early lung cancer in high-risk smokers using an electronic nose. IEEE Trans. Biomed. Eng. 2015, 62, 2044–2054. [Google Scholar] [CrossRef]
- Santonico, M.; Lucantoni, G.; Pennazza, G.; Capuano, R.; Galluccio, G.; Roscioni, C.; La Delfa, G.; Consoli, D.; Martinelli, E.; Paolesse, R.; et al. In situ detection of lung cancer volatile fingerprints using bronchoscopic air-sampling. Lung Cancer 2012, 77, 46–50. [Google Scholar] [PubMed]
- Van de Goor, R.M.G.E.; Leunis, N.; van Hooren, M.R.A.; Francisca, E.; Masclee, A.; Kremer, B.; Kross, K.W. Feasibility of electronic nose technology for discriminating between head and neck, bladder, and colon carcinomas. Eur. Arch. Oto-Rhino-Laryngol. 2017, 274, 1053–1060. [Google Scholar] [CrossRef]
- Westenbrink, E.; Arasaradnam, R.P.; O’Connell, N.; Bailey, C.; Nwokolo, C.; Bardhan, K.D.; Covington, J.A. Development and application of a new electronic nose instrument for the detection of colorectal cancer. Biosens. Bioelectron. 2015, 67, 733–738. [Google Scholar]
- de Meij, T.G.; Larbi, I.B.; van der Schee, M.P.; Lentferink, Y.E.; Paff, T.; Terhaar sive Droste, J.S.; Mulder, C.J.; van Bodegraven, A.A.; de Boer, N.K. Electronic nose can discriminate colorectal carcinoma and advanced adenomas by fecal volatile biomarker analysis: Proof of principle study. Int. J. Cancer 2014, 134, 1132–1138. [Google Scholar] [CrossRef]
- Altomare, D.F.; Porcelli, F.; Picciariello, A.; Pinto, M.; Di Lena, M.; Caputi Iambrenghi, O.; Ugenti, I.; Guglielmi, A.; Vincenti, L.; De Gennaro, G. The use of the PEN3 e-nose in the screening of colorectal cancer and polyps. Tech. Coloproctol. 2016, 20, 405–409. [Google Scholar] [CrossRef]
- Zonta, G.; Anania, G.; Fabbri, B.; Gaiardo, A.; Gherardi, S.; Giberti, A.; Landini, N.; Malagù, C.; Scagliarini, L.; Guidi, V. Preventive screening of colorectal cancer with a device based on chemoresistive sensors. Sens. Actuators B Chem. 2017, 238, 1098–1101. [Google Scholar] [CrossRef]
- Righettoni, M.; Schmid, A.; Amann, A.; Pratsinis, S.E. Correlations between blood glucose and breath components from portable gas sensors and PTR-TOF-MS. J. Breath Res. 2013, 7, 037110–037120. [Google Scholar] [CrossRef] [PubMed]
- Deng, C.; Zhang, J.; Yu, X.; Zhang, W.; Zhang, X. Determination of acetone in human breath by gas chromatography–mass spectrometry and solid-phase microextraction with on-fiber derivatization. J. Chromatogr. B 2004, 810, 269–275. [Google Scholar] [CrossRef]
- Ping, W.; Yi, T.; Haibao, X.; Farong, S. A novel method for diabetes diagnosis based on electronic nose 1 Paper presented at biosensors. Biosens. Bioelectron. 1997, 12, 1031–1036. [Google Scholar] [CrossRef] [PubMed]
- Lin, Y.; Guo, H.; Chang, Y.H.; Kao, M.T.; Wang, H.H.; Hong, R.I. Application of the electronic nose for uremia diagnosis. Sens. Actuators B Chem. 2001, 76, 177–180. [Google Scholar] [CrossRef]
- Guo, D.; Zhang, D.; Li, N.; Zhang, L.; Yang, J. A novel breath analysis system based on electronic olfaction. IEEE Trans. Biomed. Eng. 2010, 57, 2753–2763. [Google Scholar]
- Zbar, A.P. Exhaled volatile organic compounds identify patients with colorectal cancer. Br. J. Surg. 2013, 100, 151. [Google Scholar] [CrossRef]
- Arasaradnam, R.P.; Ouaret, N.; Thomas, M.G.; Gold, P.; Quraishi, M.N.; Nwokolo, C.U.; Bardhan, K.D.; Covington, J.A. Evaluation of gut bacterial populations using an electronic e-nose and field asymmetric ion mobility spectrometry: Further insights into ‘fermentonomics’. J. Med. Eng. Technol. 2012, 36, 333–337. [Google Scholar] [CrossRef]
- Berger, M.; Dorge, S.; Nouali, H.; Habermacher, D.; Fiani, E.; Vierling, M.; Molière, M.; Brilhac, J.F.; Patarin, J. Role of the process conditions on the sulphation and stability of a CuO/SBA-15 type SOx adsorbent in cycling operations. Chem. Eng. J. 2018, 350, 729–738. [Google Scholar] [CrossRef]
- Gourdji, S. Review of plants to mitigate particulate matter, ozone as well as nitrogen dioxide air pollutants and applicable recommendations for green roofs in Montreal, Quebec. Environ. Pollut. 2018, 241, 378–387. [Google Scholar] [CrossRef] [PubMed]
- Zhao, S.; Duan, Y.; Lu, J.; Gupta, R.; Pudasainee, D.; Liu, S.; Liu, M.; Lu, J. Thermal stability, chemical speciation and leaching characteristics of hazardous trace elements in FGD gypsum from coal-fired power plants. Fuel 2018, 231, 94–100. [Google Scholar] [CrossRef]
- Toledo-Cervantes, A.; Morales, T.; González, Á.; Muñoz, R.; Lebrero, R. Long-term photosynthetic CO2 removal from biogas and flue-gas: Exploring the potential of closed photobioreactors for high-value biomass production. Sci. Total Environ. 2018, 640–641, 1272–1278. [Google Scholar]
- Joshi, N.; da Silva, L.F.; Jadhav, H.S.; Shimizu, F.M.; Suman, P.H.; M’Peko, J.-C.; Orlandi, M.O.; Seo, J.G.; Mastelaro, V.R.; Oliveira, O.N. Yolk-shelled ZnCo2O4 microspheres: Surface properties and gas sensing application. Sens. Actuators B Chem. 2018, 257, 906–915. [Google Scholar] [CrossRef]
- Urasinska-Wojcik, B.; Vincent, T.A.; Chowdhury, M.F.; Gardner, J.W. Ultrasensitive WO3 gas sensors for NO2 detection in air and low oxygen environment. Sens. Actuators B Chem. 2017, 239, 1051–1059. [Google Scholar] [CrossRef]
- De Vito, S.; Massera, E.; Piga, M.; Martinotto, L.; Di Francia, G. On field calibration of an electronic nose for benzene estimation in an urban pollution monitoring scenario. Sens. Actuators B Chem. 2008, 129, 750–757. [Google Scholar] [CrossRef]
- Sakai, K.; Norbäck, D.; Mi, Y.; Shibata, E.; Kamijima, M.; Yamada, T.; Takeuchi, Y. A comparison of indoor air pollutants in Japan and Sweden: Formaldehyde, nitrogen dioxide, and chlorinated volatile organic compounds. Environ. Res. 2004, 94, 75–85. [Google Scholar] [CrossRef] [PubMed]
- Bu, F.; Wen, X.; Wan, M.; Liu, R.; Cai, Q.; Chen, L.; Zhang, Y. Applicability of an electronic nose for detection of volatile chlorinated hydrocarbons in soil. Environ. Sci. 2011, 32, 3641–3647. [Google Scholar]
- Misselbrook, T.H.; Hobbs, P.J.; Persaud, K.C. Use of an Electronic Nose to Measure Odour Concentration Following Application of Cattle Slurry to Grassland. J. Agric. Eng. Res. 1997, 66, 213–220. [Google Scholar] [CrossRef]
- Xu, L.; He, J.; Duan, S.; Wu, X.; Wang, Q. Comparison of machine learning algorithms for concentration detection and prediction of formaldehyde based on electronic nose. Sens. Rev. 2016, 36, 207–216. [Google Scholar] [CrossRef]
- Dang, L.; Tian, F.; Zhang, L.; Kadri, C.; Yin, X.; Peng, X.; Liu, S. A novel classifier ensemble for recognition of multiple indoor air contaminants by an electronic nose. Sens. Actuators A Phys. 2014, 207, 67–74. [Google Scholar] [CrossRef]
- Zhang, L.; Tian, F.; Zhang, D. (Eds.) Discriminative support vector machine-based odor classification. In Electronic Nose: Algorithmic Challenges; Springer: Singapore, 2018; pp. 79–93. [Google Scholar]
- Zhang, J.; Xue, Y.; Sun, Q.; Zhang, T.; Chen, Y.; Yu, W.; Xiong, Y.; Wei, X.; Yu, G.; Wan, H.; et al. A miniaturized electronic nose with artificial neural network for anti-interference detection of mixed indoor hazardous gases. Sens. Actuators B Chem. 2021, 326, 128822–128830. [Google Scholar] [CrossRef]
- Taştan, M.; Gökozan, H. Real-time monitoring of indoor air quality with internet of things-based e-nose. Appl. Sci. 2019, 9, 3435. [Google Scholar] [CrossRef]
- Kobayashi, T.; Shimizu, Y.; Urano, K. Estimation of adsorbed amounts of volatile chlorinated organic compounds to wet soil based on the properties of the compounds and soils. Sci. Total Environ. 2003, 301, 215–223. [Google Scholar] [CrossRef]
- Zhang, R.; Zhong, M.; Jiang, L.; Fu, Q.; Wang, S.; Zhang, W.; Li, X.; Ma, L. Effect of vapour-solid interfacial adsorption on benzene multiphase partition and its implication to vapour exposure assessment of contaminated soil in arid area. J. Environ. Manag. 2022, 315, 115182–115190. [Google Scholar] [CrossRef] [PubMed]
- Bieganowski, A.; Jaromin-Glen, K.; Guz, Ł.; Łagód, G.; Jozefaciuk, G.; Franus, W.; Suchorab, Z.; Sobczuk, H. Evaluating soil moisture status using an e-nose. Sensors 2016, 16, 886. [Google Scholar] [CrossRef] [PubMed]
- Lavanya, S.; Deepika, B.; Narayanan, S.; Krishna Murthy, V.; Uma, M.V. Indicative extent of humic and fulvic acids in soils determined by electronic nose. Comput. Electron. Agric. 2017, 139, 198–203. [Google Scholar] [CrossRef]
- Zhu, L.; Jia, H.; Chen, Y.; Wang, Q.; Li, M.; Huang, D.; Bai, Y. A novel method for soil organic matter determination by using an artificial olfactory system. Sensors 2019, 19, 3417. [Google Scholar] [CrossRef] [PubMed]
- Baby, R.E.; Cabezas, M.; Walsöe de Reca, E.N. Electronic nose: A useful tool for monitoring environmental contamination. Sens. Actuators B Chem. 2000, 69, 214–218. [Google Scholar] [CrossRef]
- Stuetz, R.; Fenner, R.A.; Hall, S.J.; Stratful, I.; Loke, D. Monitoring of wastewater odours using an electronic nose. Water Sci. Technol. 2000, 41, 41–47. [Google Scholar] [CrossRef]
- Lamagna, A.; Reich, S.; Rodríguez, D.; Boselli, A.; Cicerone, D. The use of an electronic nose to characterize emissions from a highly polluted river. Sens. Actuators B Chem. 2008, 131, 121–124. [Google Scholar] [CrossRef]
- Goschnick, J.; Koronczi, I.; Frietsch, M.; Kiselev, I. Water pollution recognition with the electronic nose KAMINA. Sens. Actuators B Chem. 2005, 106, 182–186. [Google Scholar] [CrossRef]
- Musatov, V.Y.; Sysoev, V.V.; Sommer, M.; Kiselev, I. Assessment of meat freshness with metal oxide sensor microarray electronic nose: A practical approach. Sens. Actuators B Chem. 2010, 144, 99–103. [Google Scholar] [CrossRef]
- Haeringer, D.; Goschnick, J. Characterization of smelling contaminations on textiles using a gradient microarray as an electronic nose. Sens. Actuators B Chem. 2008, 132, 644–649. [Google Scholar] [CrossRef]
- Zhang, L.; Tian, F.; Liu, S.; Guo, J.; Hu, B.; Ye, Q.; Dang, L.; Peng, X.; Kadri, C.; Feng, J. Chaos based neural network optimization for concentration estimation of indoor air contaminants by an electronic nose. Sens. Actuators A Phys. 2013, 189, 161–167. [Google Scholar] [CrossRef]
- Huang, T.; Jia, P.; He, P.; Duan, S.; Yan, J.; Wang, L. A novel semi-supervised method of electronic nose for indoor pollution detection trained by M-S4VMs. Sensors 2016, 16, 1462. [Google Scholar] [CrossRef] [PubMed]
- Zhang, L.; Tian, F.; Dang, L.; Li, G.; Peng, X.; Yin, X.; Liu, S. A novel background interferences elimination method in electronic nose using pattern recognition. Sens. Actuators A Phys. 2013, 201, 254–263. [Google Scholar] [CrossRef]
- Ouyang, T.; Wang, C.; Yu, Z.; Stach, R.; Mizaikoff, B.; Huang, G.B.; Wang, Q.J. NOx measurements in vehicle exhaust using advanced deep ELM networks. IEEE Trans. Instrum. Meas. 2021, 70, 7000310. [Google Scholar] [CrossRef]
- Dentoni, L.; Capelli, L.; Sironi, S.; Rosso, R.D.; Zanetti, S.; Torre, M.D. Development of an electronic nose for environmental odour monitoring. Sensors 2012, 12, 14363–14381. [Google Scholar] [CrossRef] [PubMed]
- Śliwińska, M.; Wiśniewska, P.; Dymerski, T.; Namieśnik, J.; Wardencki, W. Food analysis using artificial senses. J. Agric. Food Chem. 2014, 62, 1423–1448. [Google Scholar] [CrossRef]
- Anwar, H.; Anwar, T.; Murtaza, S. Review on food quality assessment using machine learning and electronic nose system. Biosens. Bioelectron. X 2023, 14, 100365–100372. [Google Scholar] [CrossRef]
- Sun, Y.; Wang, J.; Cheng, S. Discrimination among tea plants either with different invasive severities or different invasive times using MOS electronic nose combined with a new feature extraction method. Comput. Electron. Agric. 2017, 143, 293–301. [Google Scholar] [CrossRef]
- Henderson, W.G.; Khalilian, A.; Han, Y.J.; Greene, J.K.; Degenhardt, D.C. Detecting stink bugs/damage in cotton utilizing a portable electronic nose. Comput. Electron. Agric. 2010, 70, 157–162. [Google Scholar] [CrossRef]
- Thazin, Y.; Eamsa-Ard, T.; Pobkrut, T.; Kerdcharoen, T. Formalin adulteration detection in food using e-nose based on nanocomposite gas sensors. In Proceedings of the 2019 IEEE International Conference on Consumer Electronics—Asia (ICCE-Asia), Bangkok, Thailand, 12–14 June 2019; pp. 64–67. [Google Scholar]
- Chen, J.; Yan, W.; Fu, Y.; Wang, L.; Lv, X.; Dai, R.; Li, X.; Jia, F. The use of electronic nose in the quality evaluation and adulteration identification of beijing-you chicken. Foods 2022, 11, 782. [Google Scholar] [CrossRef] [PubMed]
- Wen, R.; Kong, B.; Yin, X.; Zhang, H.; Chen, Q. Characterisation of flavour profile of beef jerky inoculated with different autochthonous lactic acid bacteria using electronic nose and gas chromatography–ion mobility spectrometry. Meat Sci. 2022, 183, 108658–108666. [Google Scholar] [CrossRef] [PubMed]
- Huang, C.; Gu, Y. A machine learning method for the quantitative detection of adulterated meat using a MOS-based e-nose. Foods 2022, 11, 602. [Google Scholar] [CrossRef] [PubMed]
- Gao, S.; Wang, R.; Bi, Y.; Qu, H.; Chen, Y.; Zheng, L. Identification of frozen/thawed beef based on label-free detection of hemin (Iron Porphyrin) with solution-gated graphene transistor sensors. Sens. Actuators B Chem. 2020, 305, 127167–127173. [Google Scholar] [CrossRef]
- Bai, Y.; Liu, H.; Zhang, B.; Zhang, J.; Wu, H.; Zhao, S.; Qie, M.; Guo, J.; Wang, Q.; Zhao, Y. Research progress on traceability and authenticity of beef. Food Rev. Int. 2023, 39, 1645–1665. [Google Scholar] [CrossRef]
- Pulluri, K.K.; Kumar, V.N. Qualitative and quantitative detection of food adulteration using a smart e-nose. Sensors 2022, 22, 7789. [Google Scholar] [CrossRef]
- Hong, X.; Wang, J.; Qi, G. E-nose combined with chemometrics to trace tomato-juice quality. J. Food Eng. 2015, 149, 38–43. [Google Scholar] [CrossRef]
- Falasconi, M.; Gobbi, E.; Pardo, M.; Della Torre, M.; Bresciani, A.; Sberveglieri, G. Detection of toxigenic strains of Fusarium verticillioides in corn by electronic olfactory system. Sens. Actuators B Chem. 2005, 108, 250–257. [Google Scholar] [CrossRef]
- Gębicki, J.; Szulczyński, B. Discrimination of selected fungi species based on their odour profile using prototypes of electronic nose instruments. Measurement 2018, 116, 307–313. [Google Scholar] [CrossRef]
- Lippolis, V.; Ferrara, M.; Cervellieri, S.; Damascelli, A.; Epifani, F.; Pascale, M.; Perrone, G. Rapid prediction of ochratoxin A-producing strains of Penicillium on dry-cured meat by MOS-based electronic nose. Int. J. Food Microbiol. 2016, 218, 71–77. [Google Scholar] [CrossRef] [PubMed]
- Ghasemi-Varnamkhasti, M.; Tohidi, M.; Mishra, P.; Izadi, Z. Temperature modulation of electronic nose combined with multi-class support vector machine classification for identifying export caraway cultivars. Postharvest Biol. Technol. 2018, 138, 134–139. [Google Scholar] [CrossRef]
- Trirongjitmoah, S.; Juengmunkong, Z.; Srikulnath, K.; Somboon, P. Classification of garlic cultivars using an electronic nose. Comput. Electron. Agric. 2015, 113, 148–153. [Google Scholar] [CrossRef]
- Tohidi, M.; Ghasemi-Varnamkhasti, M.; Ghafarinia, V.; Bonyadian, M.; Mohtasebi, S.S. Development of a metal oxide semiconductor-based artificial nose as a fast, reliable and non-expensive analytical technique for aroma profiling of milk adulteration. Int. Dairy J. 2018, 77, 38–46. [Google Scholar] [CrossRef]
- Gutiérrez-Méndez, N.; Vallejo-Cordoba, B.; González-Córdova, A.F.; Nevárez-Moorillón, G.V.; Rivera-Chavira, B. Evaluation of aroma generation of Lactococcus iactis with an electronic nose and sensory analysis. J. Dairy Sci. 2008, 91, 49–57. [Google Scholar] [CrossRef] [PubMed]
- Bhattacharyya, N.; Seth, S.; Tudu, B.; Tamuly, P.; Jana, A.; Ghosh, D.; Bandyopadhyay, R.; Bhuyan, M. Monitoring of black tea fermentation process using electronic nose. J. Food Eng. 2007, 80, 1146–1156. [Google Scholar] [CrossRef]
- Lu, X.; Wang, J.; Lu, G.; Lin, B.; Chang, M.; He, W. Quality level identification of West Lake Longjing green tea using electronic nose. Sens. Actuators B Chem. 2019, 301, 127056–127065. [Google Scholar] [CrossRef]
- Buratti, S.; Benedetti, S.; Giovanelli, G. Application of electronic senses to characterize espresso coffees brewed with different thermal profiles. Eur. Food Res. Technol. 2017, 243, 511–520. [Google Scholar] [CrossRef]
- Severini, C.; Ricci, I.; Marone, M.; Derossi, A.; De Pilli, T. Changes in the aromatic profile of espresso coffee as a function of the grinding grade and extraction time: A study by the electronic nose system. J. Agric. Food Chem. 2015, 63, 2321–2327. [Google Scholar] [CrossRef]
- Palacín, J.; Rubies, E.; Clotet, E. Application of a single-type enose to discriminate the brewed aroma of one caffeinated and decaffeinated encapsulated espresso coffee type. Chemosensors 2022, 10, 421. [Google Scholar] [CrossRef]
- Michishita, T.; Akiyama, M.; Hirano, Y.; Ikeda, M.; Sagara, Y.; Araki, T. Gas chromatography/olfactometry and electronic nose analyses of retronasal aroma of espresso and correlation with sensory evaluation by an artificial neural network. J. Food Sci. 2010, 75, S477–S489. [Google Scholar] [CrossRef]
- Cui, S.; Ling, P.; Zhu, H.; Keener, H.M. Plant pest detection using an artificial nose system: A review. Sensors 2018, 18, 378. [Google Scholar] [CrossRef]
- Zheng, Z.; Zhang, C. Electronic noses based on metal oxide semiconductor sensors for detecting crop diseases and insect pests. Comput. Electron. Agric. 2022, 197, 106988–106999. [Google Scholar] [CrossRef]
- Qiu, S.; Wang, J.; Gao, L. Qualification and quantisation of processed strawberry juice based on electronic nose and tongue. LWT—Food Sci. Technol. 2015, 60, 115–123. [Google Scholar] [CrossRef]
- Zhang, X.; Wu, H.; Lin, L.; Du, X.; Tang, S.; Liu, H.; Yang, H. The qualitative and quantitative assessment of xiaochaihu granules based on e-eye, e-nose, e-tongue and chemometrics. J. Pharm. Biomed. Anal. 2021, 205, 114298–114307. [Google Scholar] [CrossRef]
- Wang, S.; Zhang, Q.; Liu, C.; Wang, Z.; Gao, J.; Yang, X.; Lan, Y. Synergetic application of an E-tongue, E-nose and E-eye combined with CNN models and an attention mechanism to detect the origin of black pepper. Sens. Actuators A Phys. 2023, 357, 114417. [Google Scholar] [CrossRef]
- Apetrei, C.; Apetrei, I.M.; Villanueva, S.; de Saja, J.A.; Gutierrez-Rosales, F.; Rodriguez-Mendez, M.L. Combination of an e-nose, an e-tongue and an e-eye for the characterisation of olive oils with different degree of bitterness. Anal. Chim. Acta 2010, 663, 91–97. [Google Scholar] [CrossRef]
- Prieto, N.; Gay, M.; Vidal, S.; Aagaard, O.; de Saja, J.A.; Rodriguez-Mendez, M.L. Analysis of the influence of the type of closure in the organoleptic characteristics of a red wine by using an electronic panel. Food Chem. 2011, 129, 589–594. [Google Scholar] [CrossRef]
- Cellini, A.; Blasioli, S.; Biondi, E.; Bertaccini, A.; Braschi, I.; Spinelli, F. Potential applications and limitations of electronic nose devices for plant disease diagnosis. Sensors 2017, 17, 2596. [Google Scholar] [CrossRef]
- Kodogiannis, V.S. Application of an electronic nose coupled with fuzzy-wavelet network for the detection of meat spoilage. Food Bioprocess Technol. 2017, 10, 730–749. [Google Scholar] [CrossRef]
- Song, S.; Yuan, L.; Zhang, X.; Hayat, K.; Chen, H.; Liu, F.; Xiao, Z.; Niu, Y. Rapid measuring and modelling flavour quality changes of oxidised chicken fat by electronic nose profiles through the partial least squares regression analysis. Food Chem. 2013, 141, 4278–4288. [Google Scholar] [CrossRef]
- Gruber, J.; Nascimento, H.M.; Yamauchi, E.Y.; Li, R.W.C.; Esteves, C.H.A.; Rehder, G.P.; Gaylarde, C.C.; Shirakawa, M.A. A conductive polymer based electronic nose for early detection of Penicillium digitatum in post-harvest oranges. Mater. Sci. Eng. C 2013, 33, 2766–2769. [Google Scholar] [CrossRef]
- Lihuan, S.; Liu, W.; Xiaohong, Z.; Guohua, H.; Zhidong, Z. Fabrication of electronic nose system and exploration on its applications in mango fruit (M. indica cv. Datainong) quality rapid determination. J. Food Meas. Charact. 2017, 11, 1969–1977. [Google Scholar] [CrossRef]
- Liu, Q.; Zhao, N.; Zhou, D.; Sun, Y.; Sun, K.; Pan, L.; Tu, K. Discrimination and growth tracking of fungi contamination in peaches using electronic nose. Food Chem. 2018, 262, 226–234. [Google Scholar] [CrossRef]
- Wei, Z.; Wang, J.; Zhang, W. Detecting internal quality of peanuts during storage using electronic nose responses combined with physicochemical methods. Food Chem. 2015, 177, 89–96. [Google Scholar] [CrossRef]
- Rutolo, M.F.; Clarkson, J.P.; Covington, J.A. The use of an electronic nose to detect early signs of soft-rot infection in potatoes. Biosys. Eng. 2018, 167, 137–143. [Google Scholar] [CrossRef]
- Feng, L.; Zhang, M.; Bhandari, B.; Guo, Z. A novel method using MOS electronic nose and ELM for predicting postharvest quality of cherry tomato fruit treated with high pressure argon. Comput. Electron. Agric. 2018, 154, 411–419. [Google Scholar] [CrossRef]
- Esteves, C.H.A.; Iglesias, B.A.; Ogawa, T.; Araki, K.; Hoehne, L.; Gruber, J. Identification of tobacco types and cigarette brands using an electronic nose based on conductive polymer/porphyrin composite sensors. ACS Omega 2018, 3, 6476–6482. [Google Scholar] [CrossRef]
- Dong, W.; Zhao, J.; Hu, R.; Dong, Y.; Tan, L. Differentiation of chinese robusta coffees according to species, using a combined electronic nose and tongue, with the aid of chemometrics. Food Chem. 2017, 229, 743–751. [Google Scholar] [CrossRef]
- Yan, J.; Guo, X.; Duan, S.; Jia, P.; Wang, L.; Peng, C.; Zhang, S. Electronic nose feature extraction methods: A review. Sensors 2015, 15, 27804–27831. [Google Scholar] [CrossRef]
- Yu, H.; Wang, J.; Zhang, H.; Yu, Y.; Yao, C. Identification of green tea grade using different feature of response signal from E-nose sensors. Sens. Actuators B Chem. 2008, 128, 455–461. [Google Scholar] [CrossRef]
- Hierlemann, A.; Gutierrez-Osuna, R. Higher-order chemical sensing. Chem. Rev. 2008, 108, 563–613. [Google Scholar] [CrossRef]
- Marco, S.; Gutierrez-Galvez, A. Signal and data processing for machine olfaction and chemical sensing: A review. IEEE Sens. J. 2012, 12, 3189–3214. [Google Scholar] [CrossRef]
- Narvaez-Montoya, C.; Mahlknecht, J.; Torres-Martínez, J.A.; Mora, A.; Bertrand, G. Seawater intrusion pattern recognition supported by unsupervised learning: A systematic review and application. Sci. Total Environ. 2023, 864, 160933–160952. [Google Scholar] [CrossRef]
- Eom, N.; Messing, M.E.; Johansson, J.; Deppert, K. General trends in core–shell preferences for bimetallic nanoparticles. ACS Nano 2021, 15, 8883–8895. [Google Scholar] [CrossRef]
- Huefner, A.; Kuan, W.-L.; Müller, K.H.; Skepper, J.N.; Barker, R.A.; Mahajan, S. Characterization and visualization of vesicles in the endo-lysosomal pathway with surface-enhanced raman spectroscopy and chemometrics. ACS Nano 2016, 10, 307–316. [Google Scholar] [CrossRef]
- Li, Y.; Wei, X.; Zhou, Y.; Wang, J.; You, R. Research progress of electronic nose technology in exhaled breath disease analysis. Microsyst. Nanoeng. 2023, 9, 129–141. [Google Scholar] [CrossRef]
- Haugen, J.-E.; Tomic, O.; Kvaal, K. A calibration method for handling the temporal drift of solid state gas-sensors. Anal. Chim. Acta 2000, 407, 23–39. [Google Scholar] [CrossRef]
- Ziyatdinov, A.; Chaudry, A.; Persaud, K.; Caminal, P.; Perera, A. Common principal component analysis for drift compensation of gas sensor array data. AIP Conf. Proc. 2009, 1137, 566–569. [Google Scholar]
- Di Carlo, S.; Falasconi, M.; Sanchez, E.; Sberveglieri, G.; Scionti, A.; Squillero, G.; Tonda, A. Covariance matrix adaptation evolutionary srategy for drift correction of electronic nose data. AIP Conf. Proc. 2011, 1362, 25–26. [Google Scholar]
- Martinelli, E.; Magna, G.; De Vito, S.; Di Fuccio, R.; Di Francia, G.; Vergara, A.; Di Natale, C. An adaptive classification model based on the Artificial Immune System for chemical sensor drift mitigation. Sens. Actuators B Chem. 2013, 177, 1017–1026. [Google Scholar] [CrossRef]
- Yan, K.; Zhang, D. Correcting instrumental variation and time-varying drift: A transfer learning approach with autoencoders. IEEE Trans. Instrum. Meas. 2016, 65, 2012–2022. [Google Scholar] [CrossRef]
- Liu, Y.; Zhang, L.; Deng, P.; He, Z. Common subspace learning via cross-domain extreme learning machine. Cogn. Comput. 2017, 9, 555–563. [Google Scholar] [CrossRef]
- Vergara, A.; Vembu, S.; Ayhan, T.; Ryan, M.A.; Homer, M.L.; Huerta, R. Chemical gas sensor drift compensation using classifier ensembles. Sens. Actuators B Chem. 2012, 166–167, 320–329. [Google Scholar] [CrossRef]
- De Vito, S.; Fattoruso, G.; Pardo, M.; Tortorella, F.; Di Francia, G. Semi-supervised learning techniques in AO applications: A novel approach to drift counteraction. AIP Conf. Proc. 2011, 1362, 269–270. [Google Scholar]
- Liu, L.; Na, N.; Yu, J.; Zhao, W.; Wang, Z.; Zhu, Y.; Hu, C. Sniffing like a wine taster: Multiple Overlapping Sniffs (MOSS) strategy enhances electronic nose odor recognition capability. Adv. Sci. 2024, 11, 2305639–2305648. [Google Scholar] [CrossRef]
- Zhang, H.; Zhang, Z.; Li, Z.; Han, H.; Song, W.; Yi, J. A chemiresistive-potentiometric multivariate sensor for discriminative gas detection. Nat. Commun. 2023, 14, 3495–3503. [Google Scholar] [CrossRef]

| q | Advantage | Disadvantage |
|---|---|---|
| MOFs | Selectively adsorb the target gas at room temperature and adjust the adsorption sites according to the target gas; mainly uses capacitive gas sensors, resulting in lower energy consumption; the detection limit is relatively low. | Due to physical adsorption, the response/recovery time is relatively long; usually in powder form, it is not conducive to direct application in electronic devices. |
| MOS | High degree of responsiveness, stability, and maturity in its preparation process. | MOS gas sensors are predominantly resistive and necessitate heating conditions, resulting in high energy consumption. Furthermore, the absence of specific adsorption sites leads to a lack of selectivity. |
Disclaimer/Publisher’s Note: The statements, opinions and data contained in all publications are solely those of the individual author(s) and contributor(s) and not of MDPI and/or the editor(s). MDPI and/or the editor(s) disclaim responsibility for any injury to people or property resulting from any ideas, methods, instructions or products referred to in the content. |
© 2024 by the authors. Licensee MDPI, Basel, Switzerland. This article is an open access article distributed under the terms and conditions of the Creative Commons Attribution (CC BY) license (https://creativecommons.org/licenses/by/4.0/).
Share and Cite
Zhai, Z.; Liu, Y.; Li, C.; Wang, D.; Wu, H. Electronic Noses: From Gas-Sensitive Components and Practical Applications to Data Processing. Sensors 2024, 24, 4806. https://doi.org/10.3390/s24154806
Zhai Z, Liu Y, Li C, Wang D, Wu H. Electronic Noses: From Gas-Sensitive Components and Practical Applications to Data Processing. Sensors. 2024; 24(15):4806. https://doi.org/10.3390/s24154806
Chicago/Turabian StyleZhai, Zhenyu, Yaqian Liu, Congju Li, Defa Wang, and Hai Wu. 2024. "Electronic Noses: From Gas-Sensitive Components and Practical Applications to Data Processing" Sensors 24, no. 15: 4806. https://doi.org/10.3390/s24154806
APA StyleZhai, Z., Liu, Y., Li, C., Wang, D., & Wu, H. (2024). Electronic Noses: From Gas-Sensitive Components and Practical Applications to Data Processing. Sensors, 24(15), 4806. https://doi.org/10.3390/s24154806