
An Investigation into the Effects of Correlated Color Temperature and Illuminance of Urban Motor Vehicle Road Lighting on Driver Alertness


Abstract
1. Introduction
2. Methodology
2.1. Design
2.2. Participants
2.3. CCT and Illuminance Setting Basis
2.3.1. Measurement of Actual Road Lighting Parameters
2.3.2. Illuminance Setting Basis
2.3.3. CCT Setting Basis
2.4. Setting
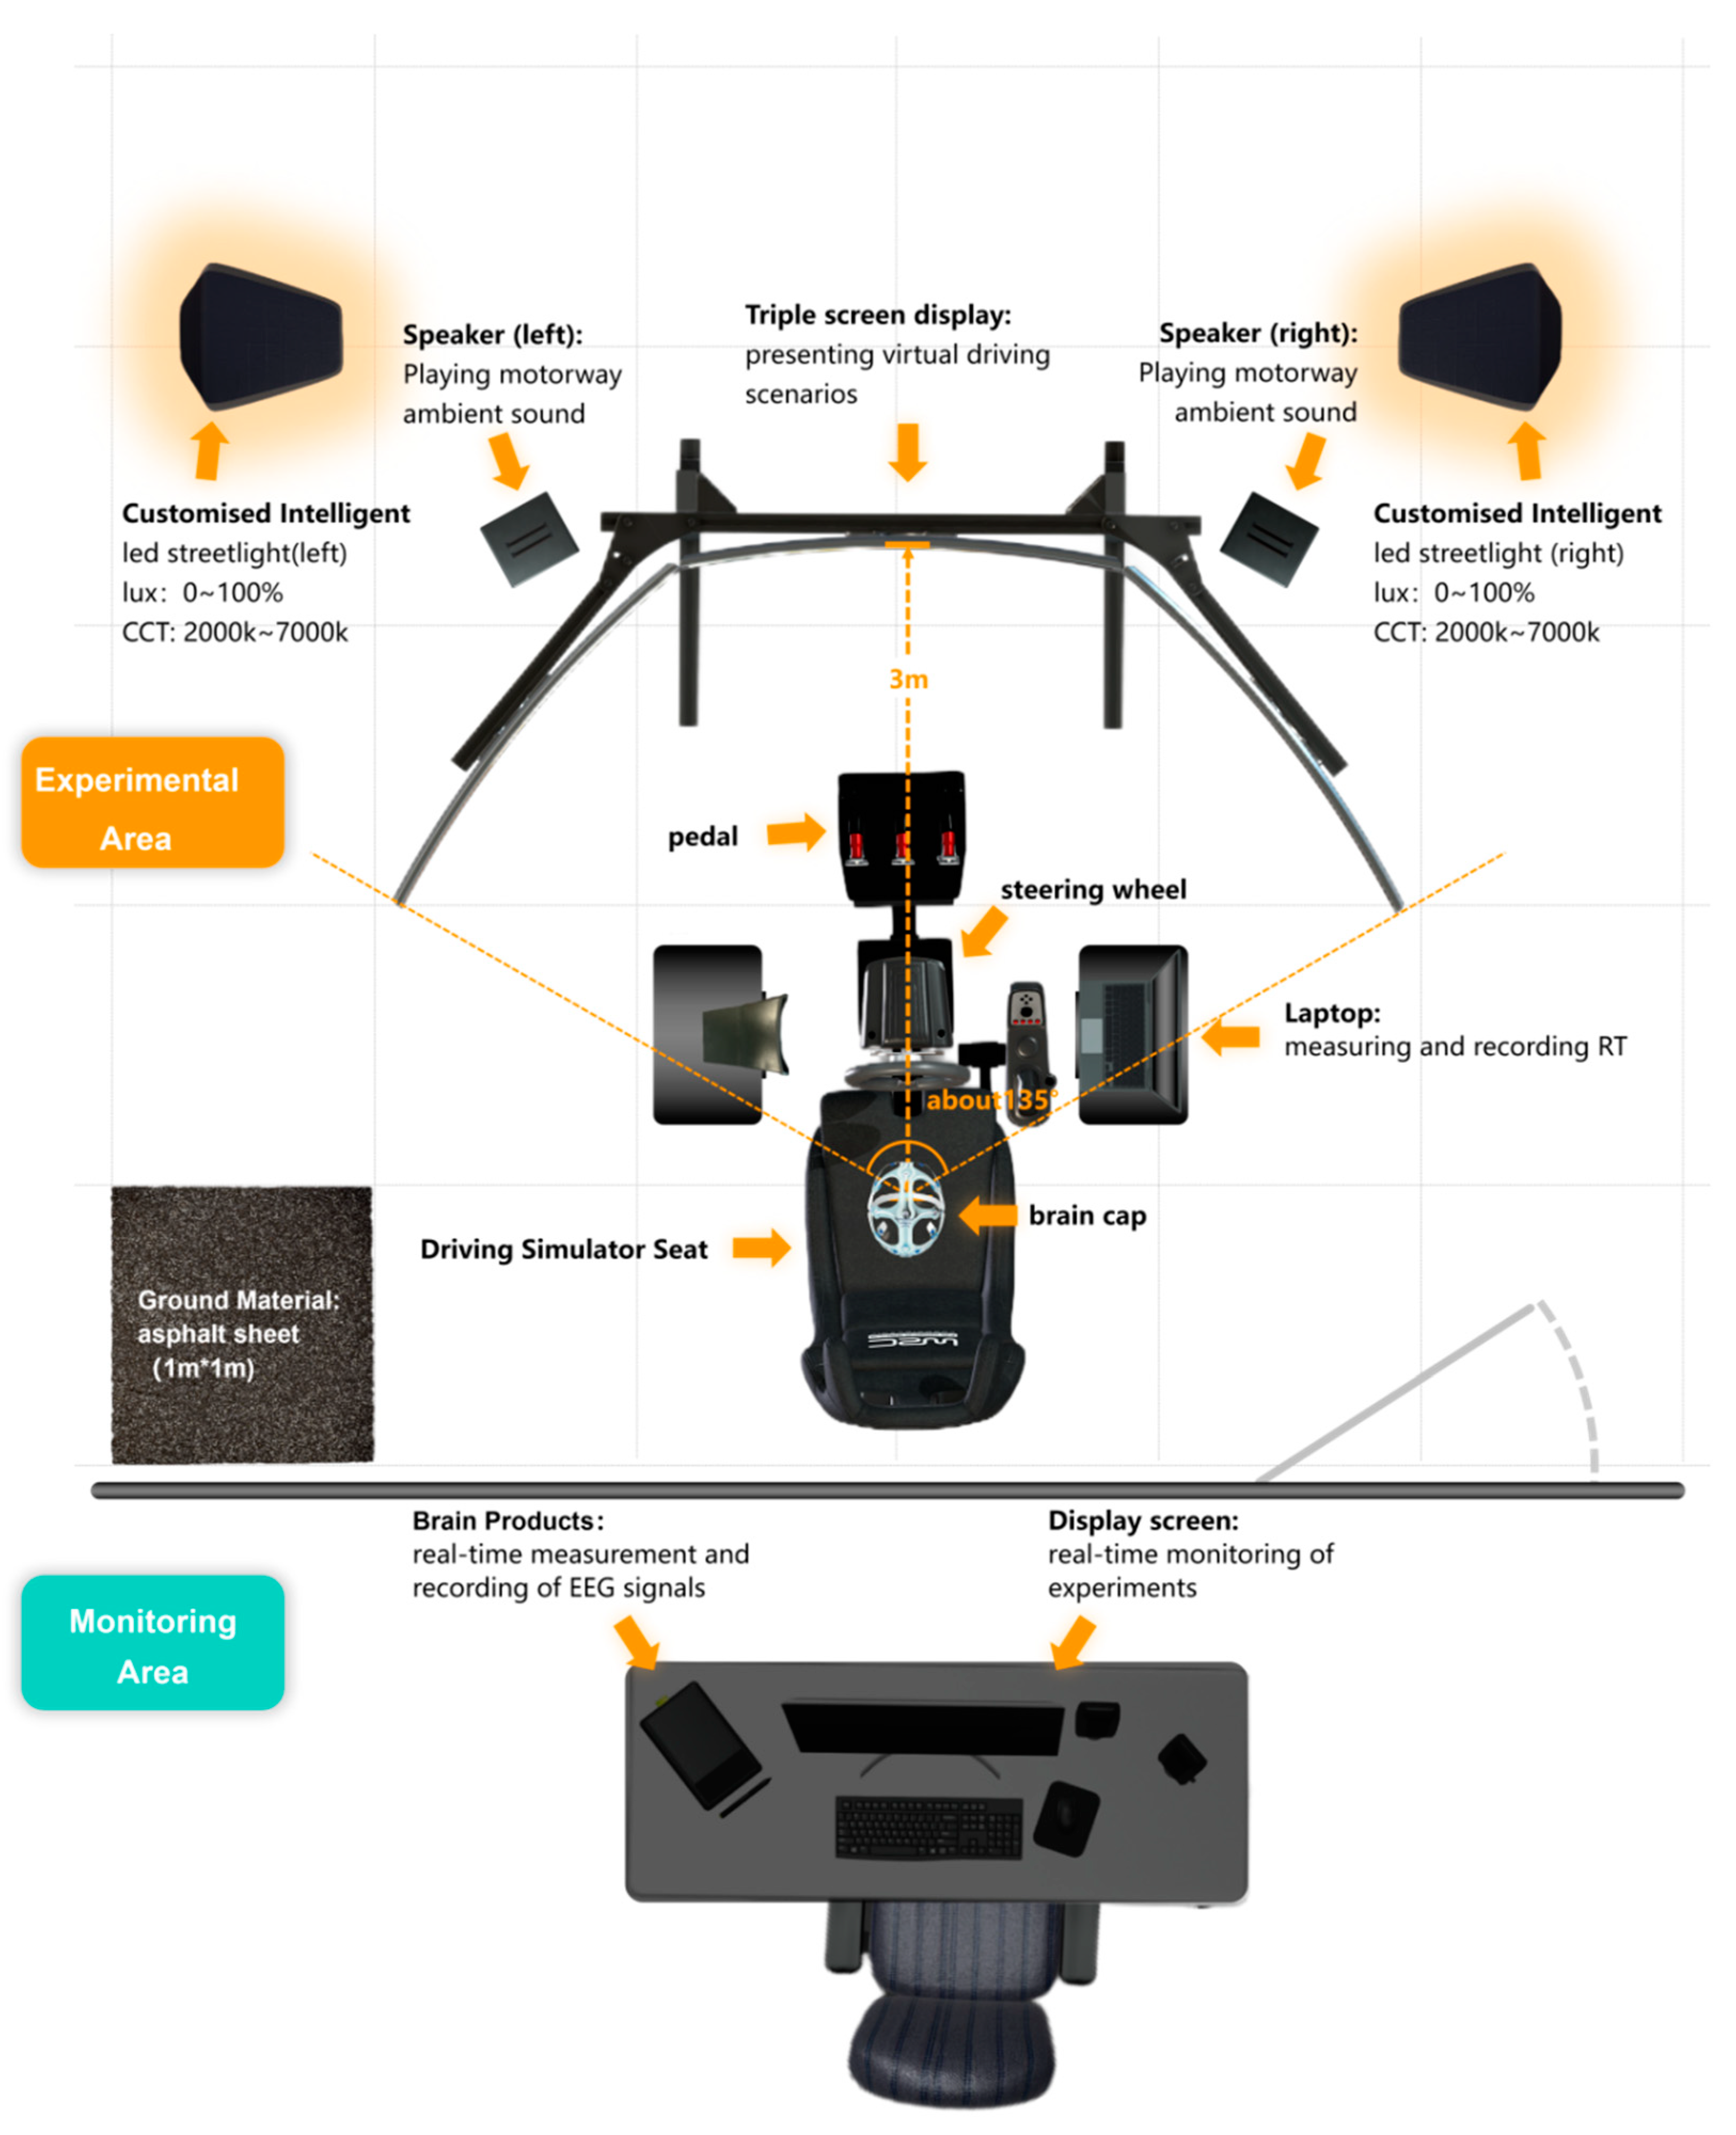
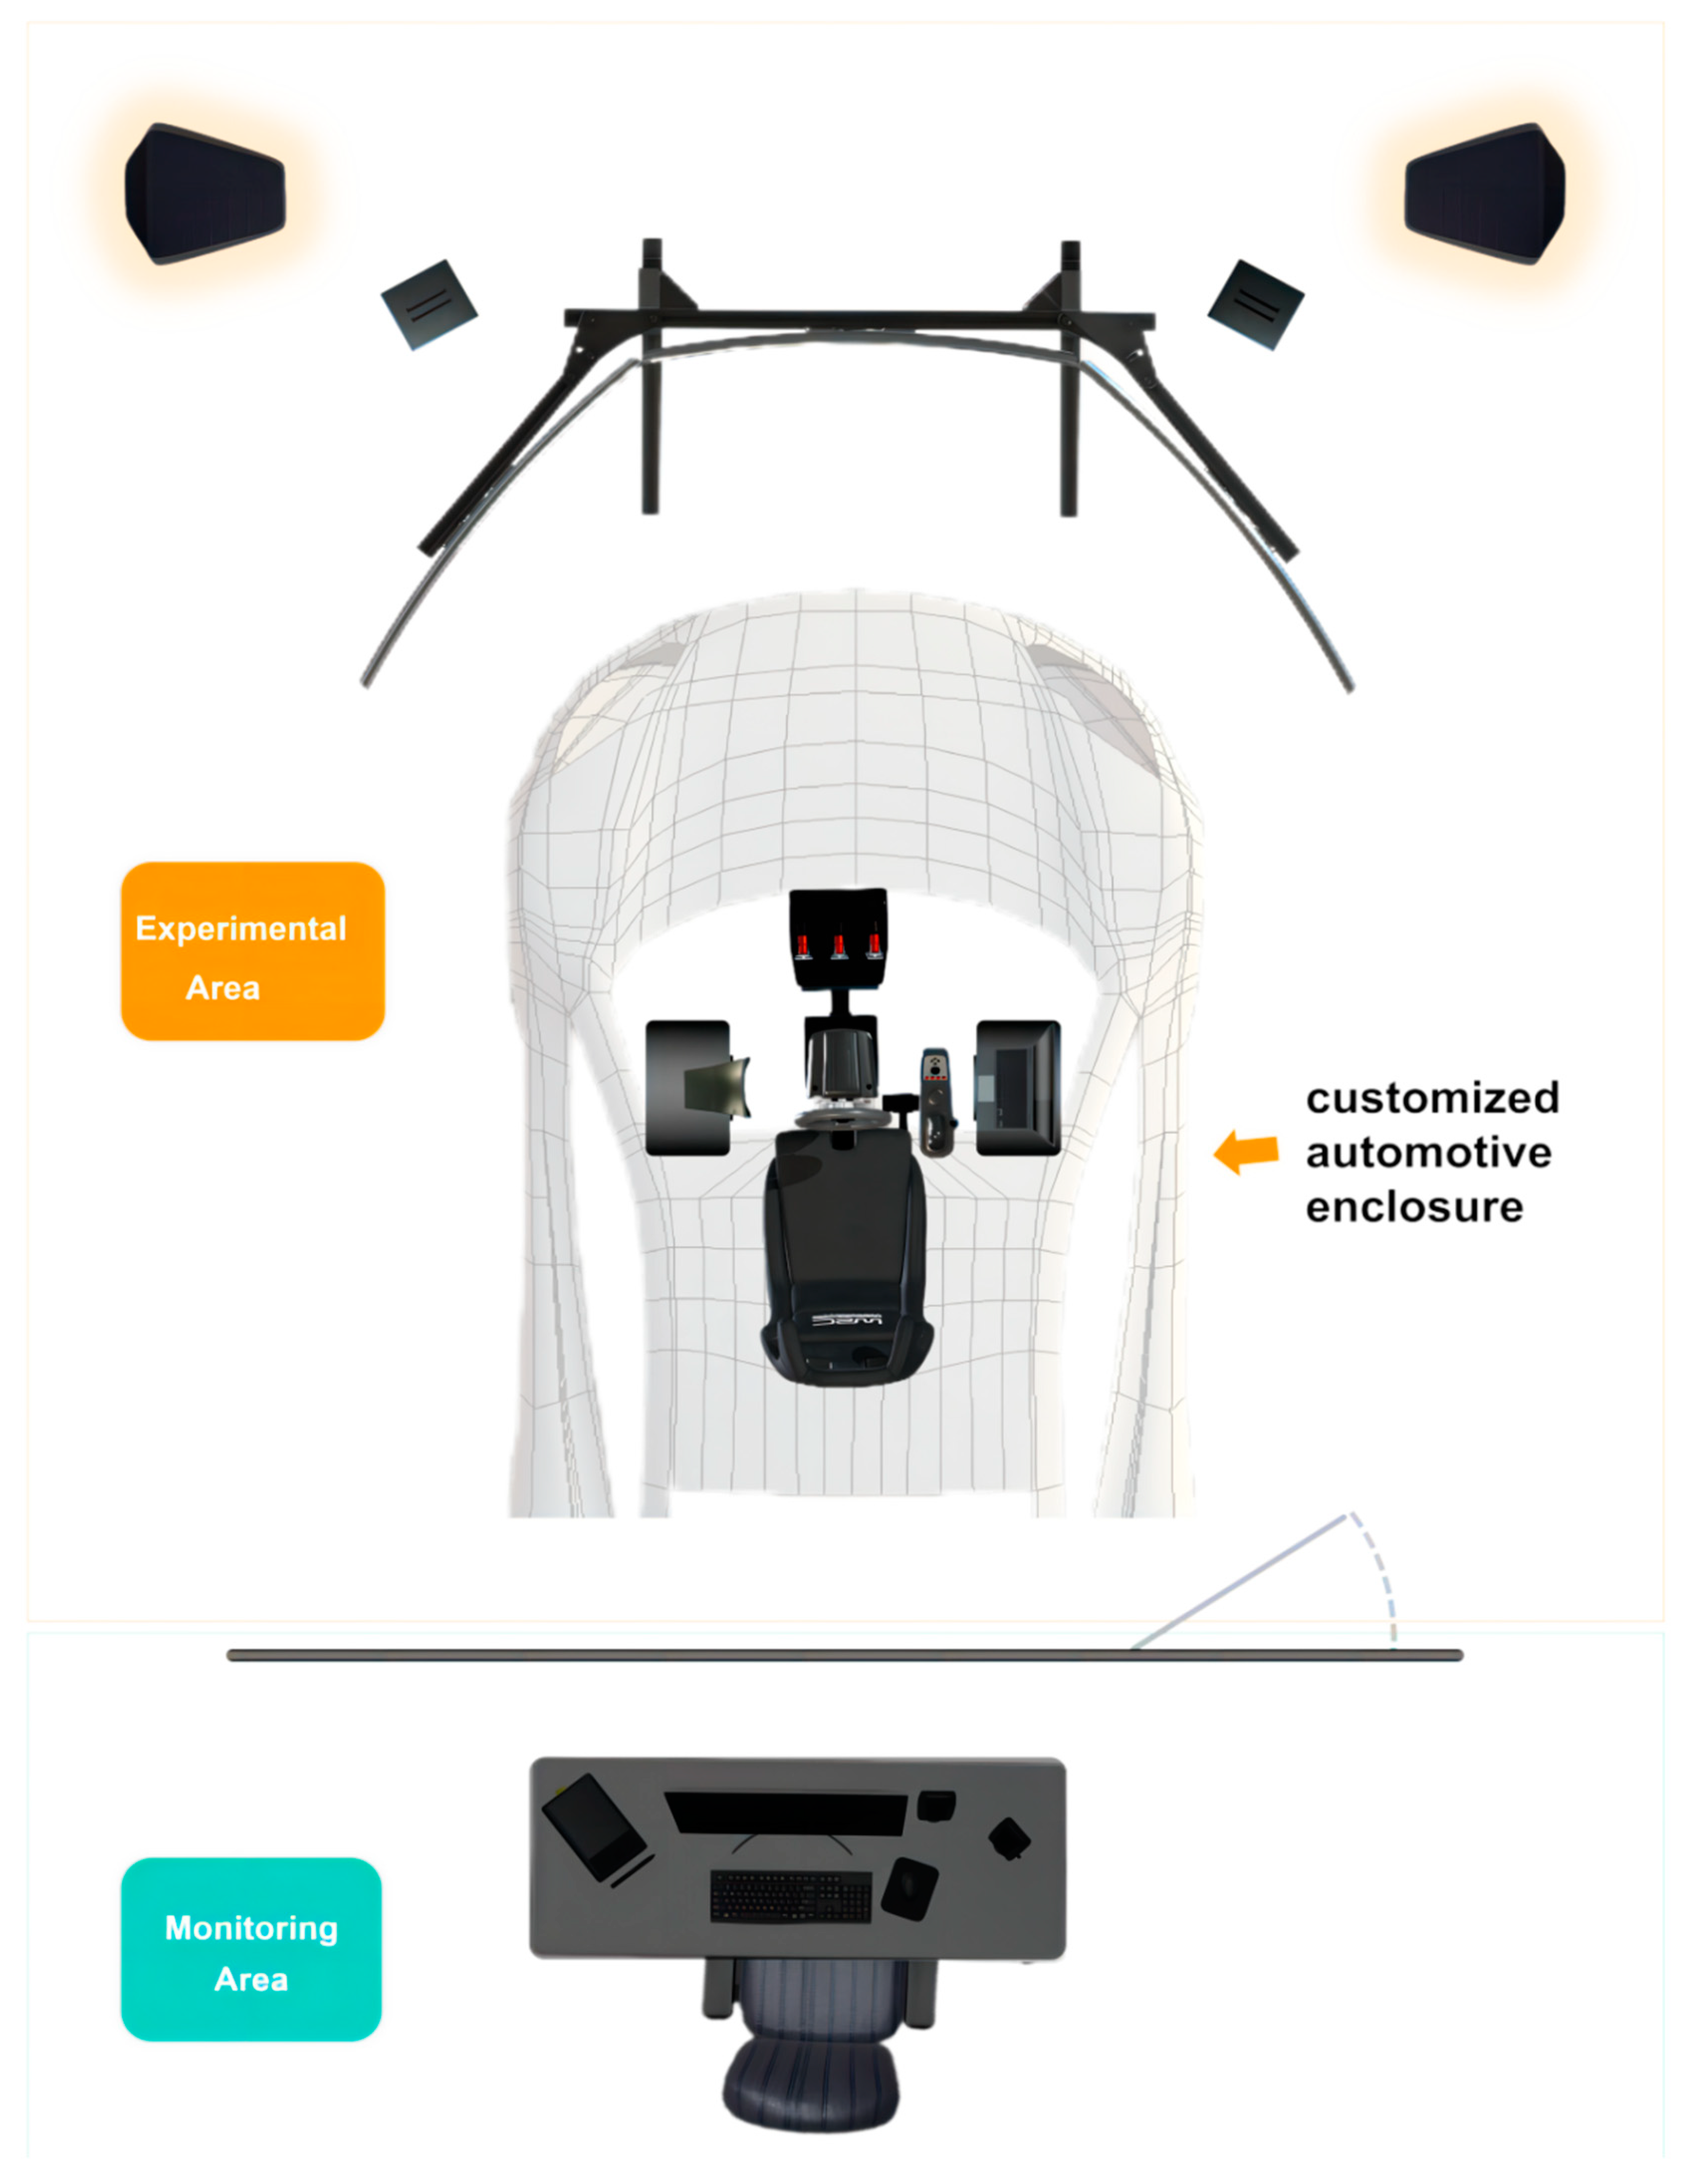
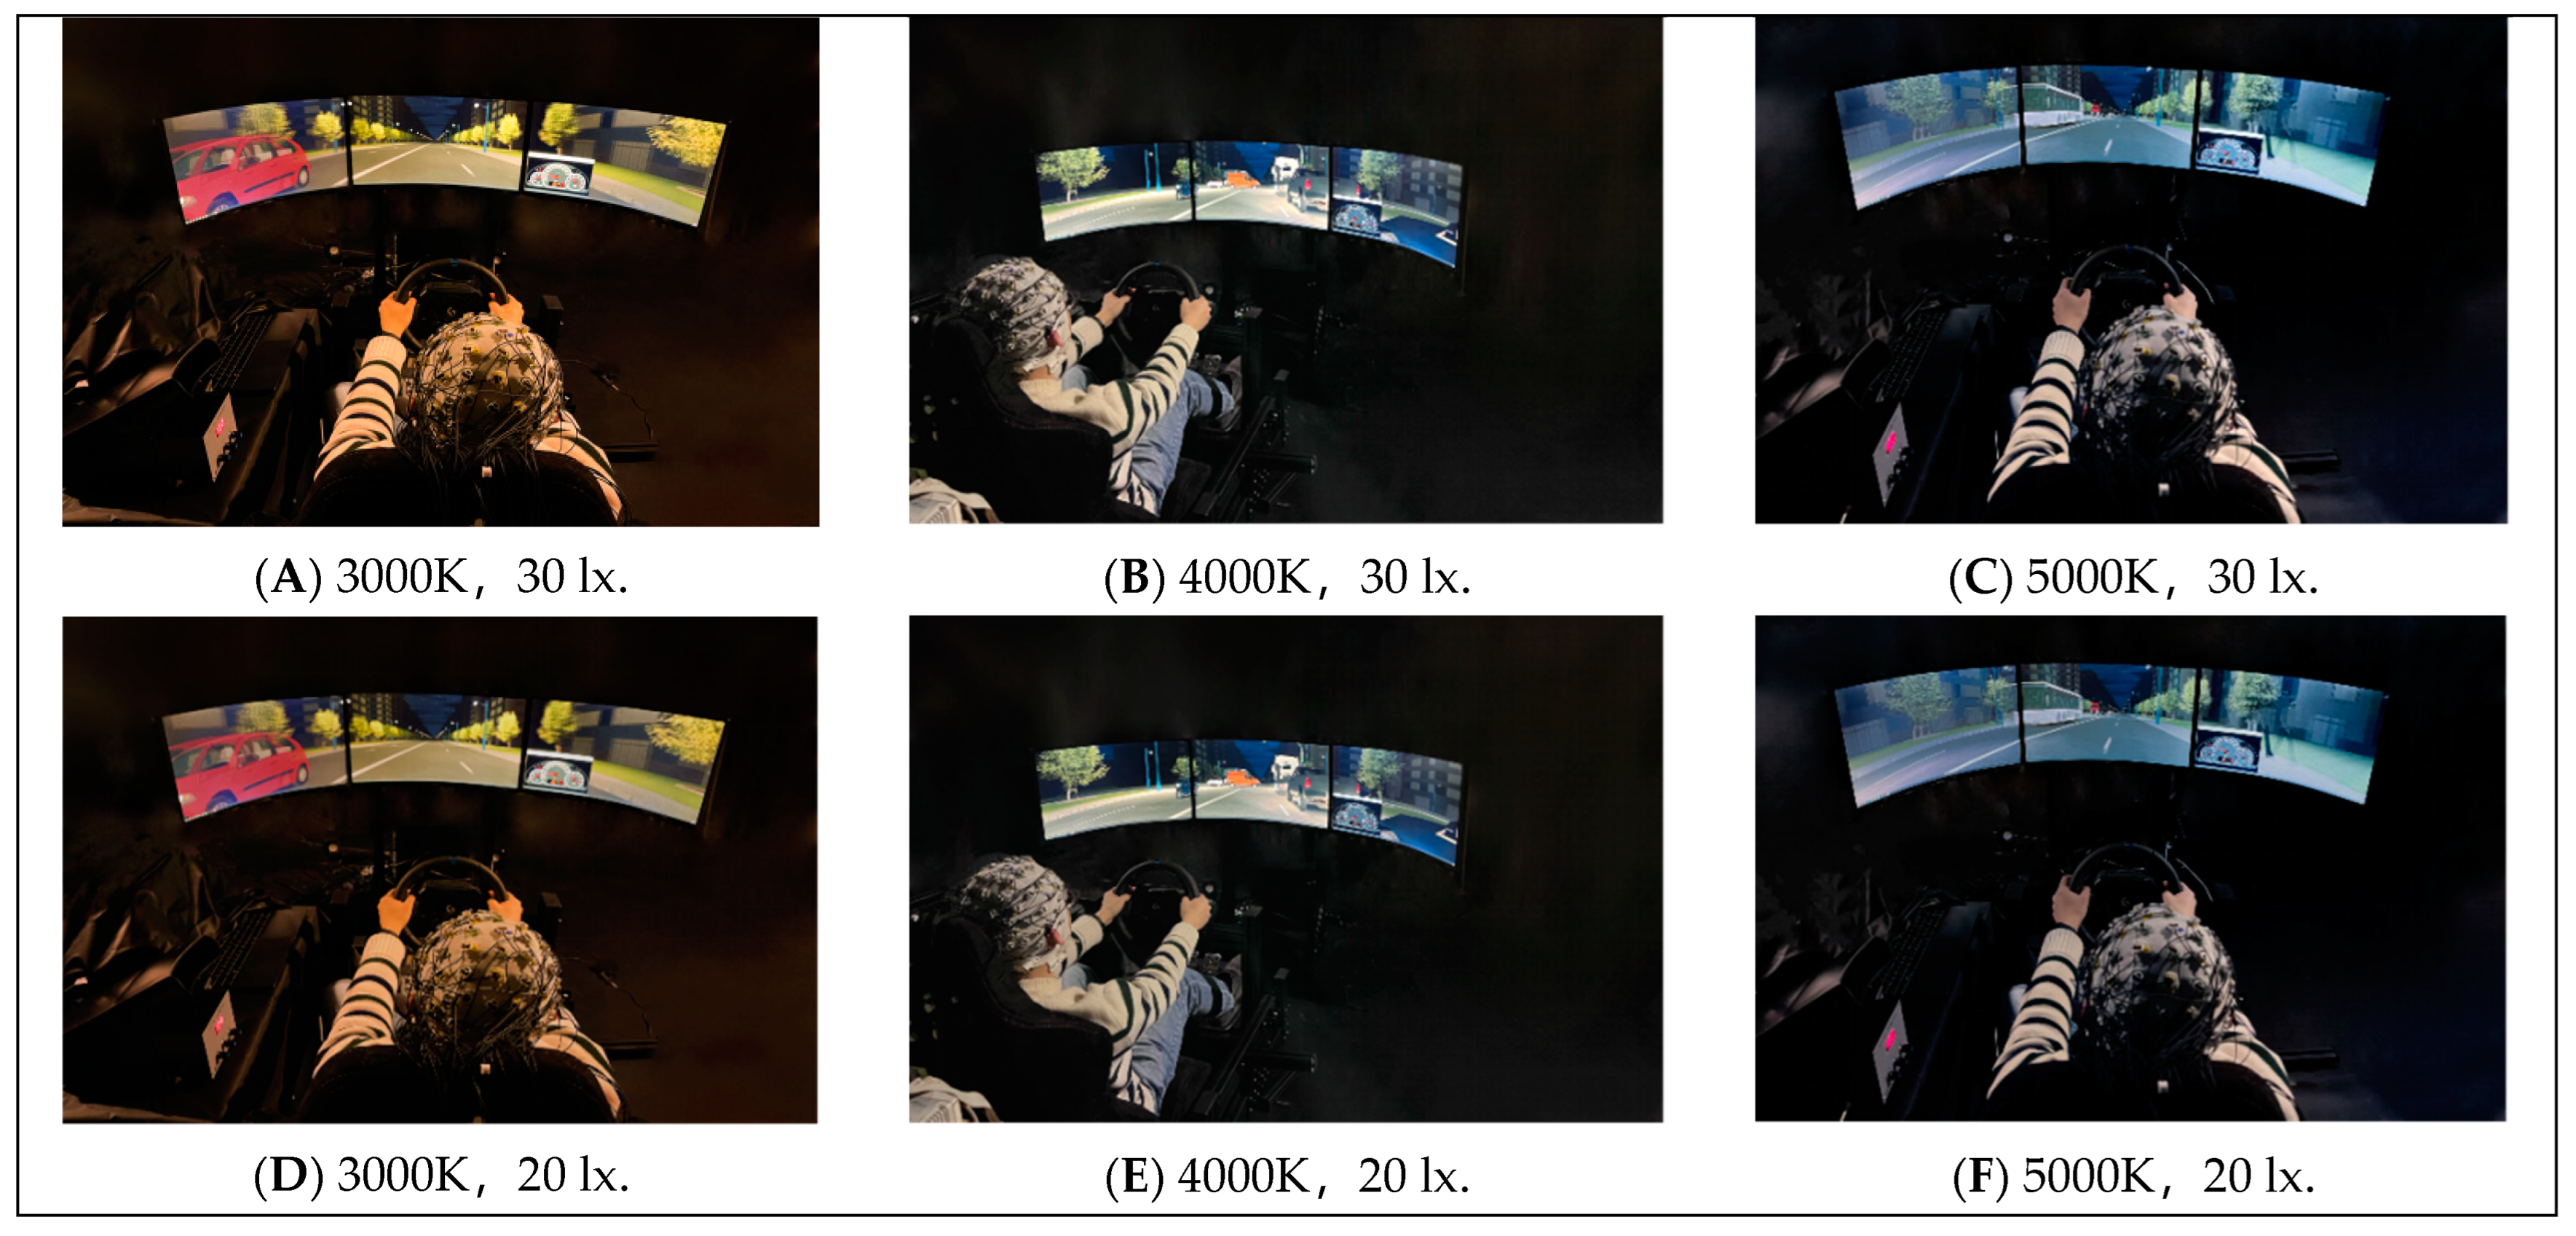
2.4.1. Physical Environment Settings
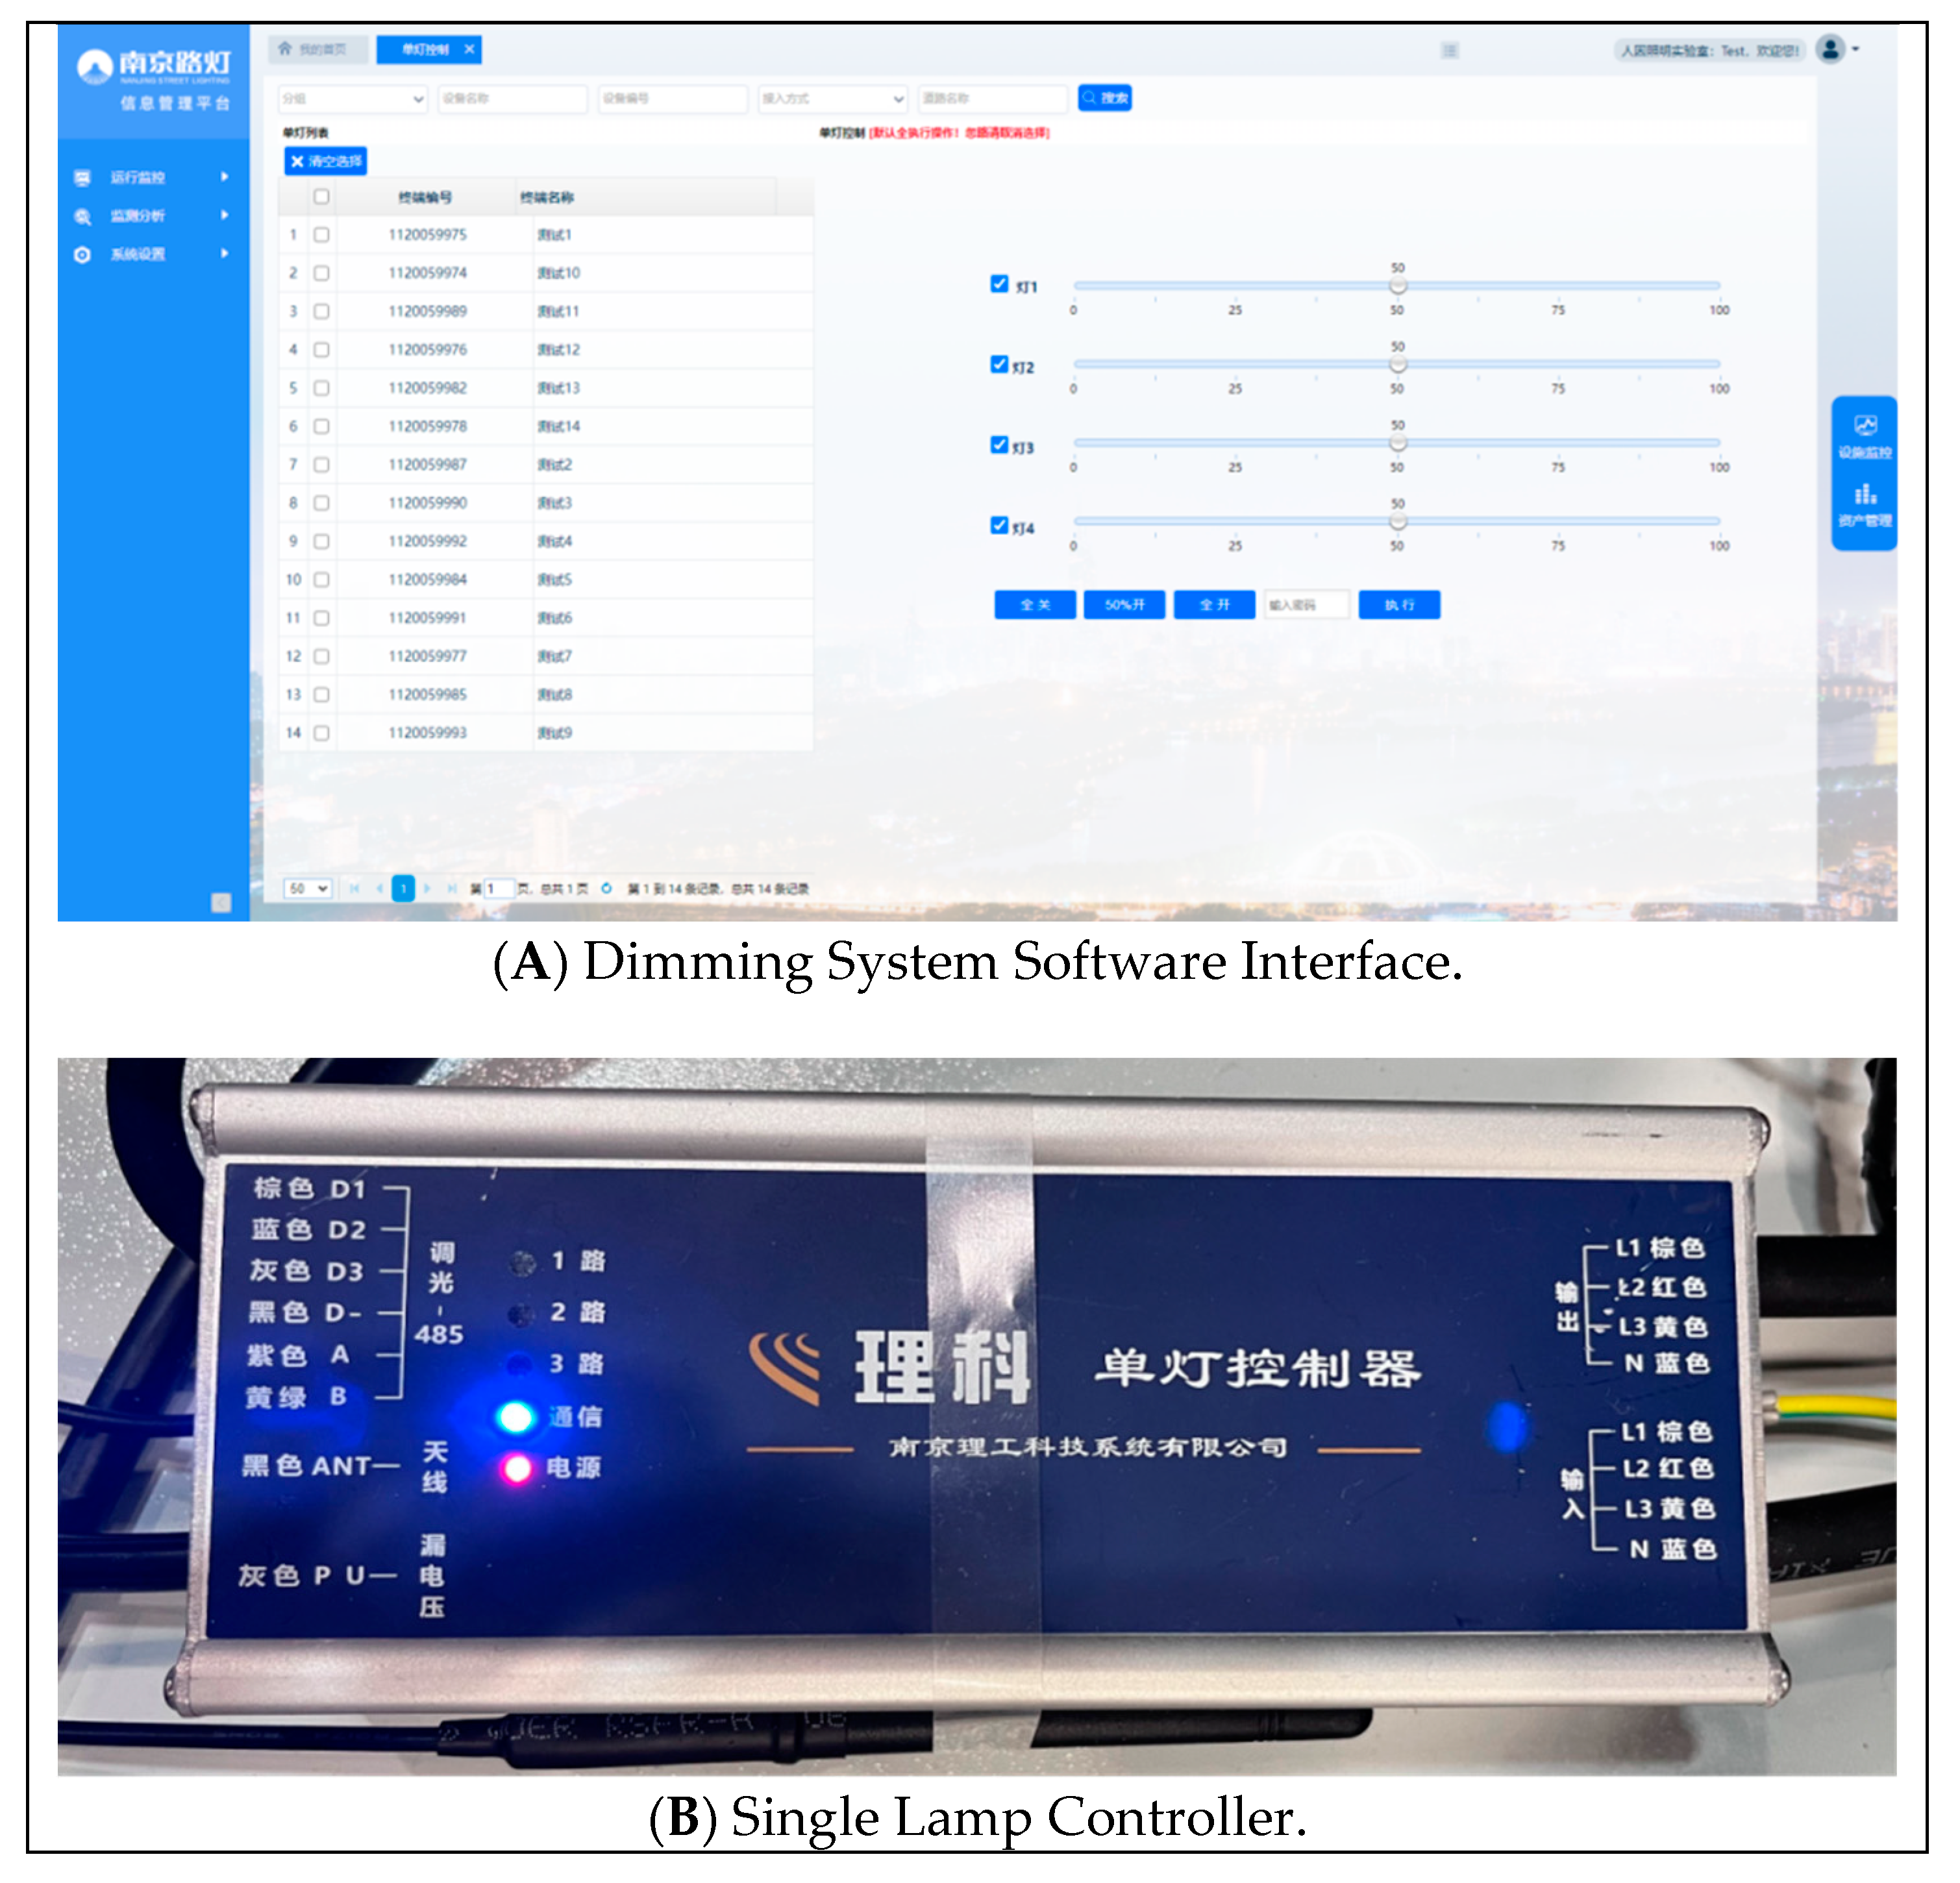
2.4.2. Light Environment Settings
2.5. Experimental Tasks and Procedure
2.5.1. Experimental Tasks
- (1)
- Task 1 (baseline—monotonous driving): Task 1 phase (baseline) was devoid of any unusual stimuli (e.g., traffic lights, obstacles, etc.) to simulate a monotonous driving environment. Participants were instructed to sustain a naturally relaxed state, manage the virtual vehicle at 60 km/h, adhere to traffic regulations, and avoid changing lanes.
- (2)
- Task 2 (waiting for red lights and traffic jams): Task 2 simulated a driving scenario involving frequent waits at red lights and sporadic instances of random traffic congestion. Throughout this phase, the vehicle’s speed limit remained consistent at 60 km/h.
- (3)
- Task 3 (follow-up task and auditory PVT task): Task 3 employed a dual-task experimental paradigm (primary task: follow-up task, secondary task: auditory psychomotor vigilance task (aPVT)) [35] to amplify perceptual load and diminish the likelihood of slower or inaccurate responses due to reduced attention. In this phase, participants were tasked with controlling the simulated vehicle to trail a specified target vehicle (a red pickup truck) while maintaining a self-assessed safe distance. If the target vehicle changed lanes, participants were required to steer the vehicle accordingly without overtaking or tailgating, and no specific speed limit was imposed. Furthermore, concurrently managing the following task, participants were prompted to react to randomized acoustic stimuli (a simulated ringtone resembling an incoming call) by swiftly pressing a designated key (designated as the space bar).
2.5.2. Procedure
2.6. Measures
2.6.1. EEG Indicators (β)
2.6.2. Task Performance (RT)
2.6.3. Subjective Evaluation Scale (KSS)
3. Results
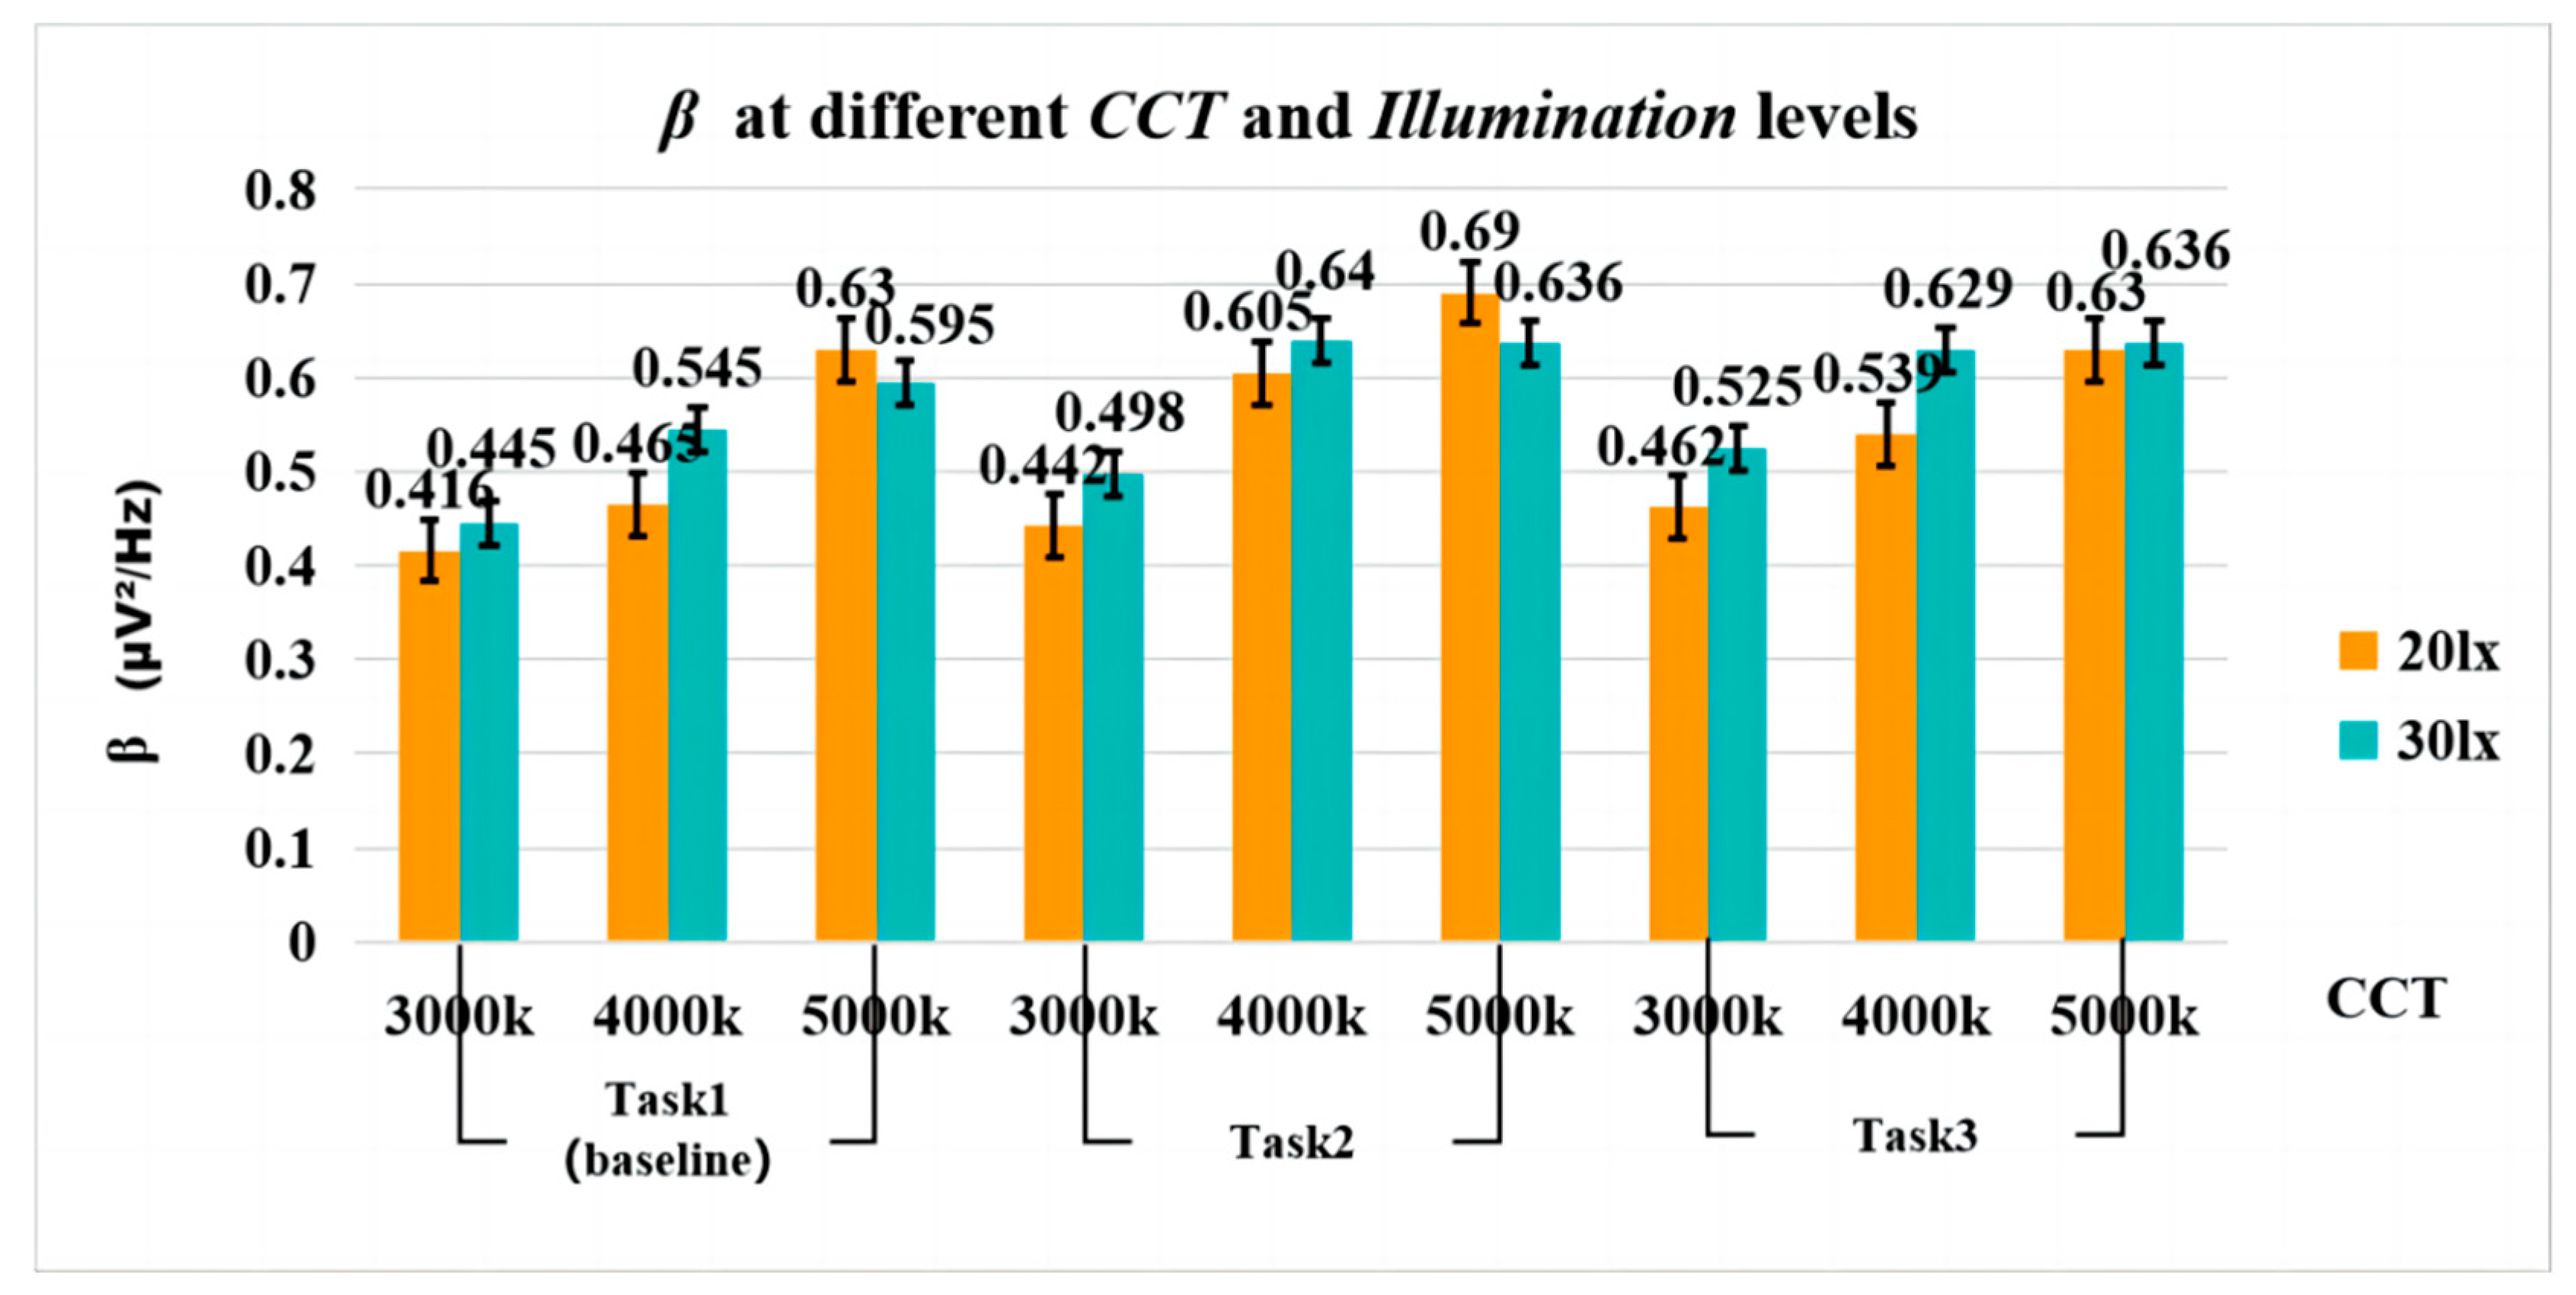
3.1. EEG (β)
3.2. Reaction Time (RT)
3.3. Subjective Evaluation Results (KSS)
4. Discussion
5. Conclusions
- (1)
- In summary, appropriately elevated illuminance (30 lx vs. 20 lx) and CCT (4000K and 5000K vs. 3000K) are more conducive to improving driver alertness and positively impacting driving task performance.
- (2)
- EEG measurements revealed a significant impact of the interaction between CCT × Illuminance and CCT × Task on drivers’ alertness (β). Moreover, a significant interaction effect of CCT × Task on drivers’ subjective alertness was observed. However, no significant main effects of CCT and Illuminance on reaction time (RT) across driving tasks were identified. Nevertheless, observational data indicated that drivers exhibited the shortest reaction time under lighting conditions of 4000K CCT and 30 lx illuminance. This suggests that this specific combination of lighting may help reduce driver reaction time.
Author Contributions
Funding
Data Availability Statement
Acknowledgments
Conflicts of Interest
References
- Berson, D.M.; Dunn, F.A.; Takao, M. Phototransduction by Retinal Ganglion Cells That Set the Circadian Clock. Science 2002, 295, 1070–1073. [Google Scholar] [CrossRef]
- Provencio, I.; Rodriguez, I.R.; Jiang, G.; Hayes, W.P.; Moreira, E.F.; Rollag, M.D. A Novel Human Opsin in the Inner Retina. J. Neurosci. Off. J. Soc. Neurosci. 2000, 20, 600–605. [Google Scholar] [CrossRef]
- Chellappa, S.; Steiner, R.; Blattner, P.; Oelhafen, P.; Götz, T.; Cajochen, C. Non-Visual Effects of Light on Melatonin, Alertness and Cognitive Performance: Can Blue-Enriched Light Keep Us Alert? PLoS ONE 2011, 6, e16429. [Google Scholar] [CrossRef]
- Vandewalle, G.; Gais, S.; Schabus, M.; Balteau, E.; Carrier, J.; Darsaud, A.; Sterpenich, V.; Albouy, G.; Dijk, D.J.; Maquet, P. Wavelength-Dependent Modulation of Brain Responses to a Working Memory Task by Daytime Light Exposure. Cereb. Cortex 2007, 17, 2788–2795. [Google Scholar] [CrossRef]
- Vandewalle, G.; Maquet, P.; Dijk, D.-J. Light as a Modulator of Cognitive Brain Function. Trends Cogn. Sci. 2009, 13, 429–438. [Google Scholar] [CrossRef]
- Chandrakumar, D.; Keage, H.A.D.; Gutteridge, D.; Dorrian, J.; Banks, S.; Loetscher, T. Interactions between Spatial Attention and Alertness in Healthy Adults: A Meta-Analysis. Cortex 2019, 119, 61–73. [Google Scholar] [CrossRef]
- Matthias, E.; Bublak, P.; Müller, H.J.; Schneider, W.X.; Krummenacher, J.; Finke, K. The Influence of Alertness on Spatial and Nonspatial Components of Visual Attention. J. Exp. Psychol. Hum. Percept. Perform. 2010, 36, 38. [Google Scholar] [CrossRef]
- Oken, B.S.; Salinsky, M.C.; Elsas, S.M. Vigilance, Alertness, or Sustained Attention: Physiological Basis and Measurement. Clin. Neurophysiol. 2006, 117, 1885–1901. [Google Scholar] [CrossRef]
- Verwey, W.B.; Zaidel, D.M. Preventing Drowsiness Accidents by an Alertness Maintenance Device. Accid. Anal. Prev. 1999, 31, 199–211. [Google Scholar] [CrossRef]
- Cajochen, C.; Münch, M.; Kobialka, S.; Kräuchi, K.; Steiner, R.; Oelhafen, P.; Orgül, S.; Wirz-Justice, A. High Sensitivity of Human Melatonin, Alertness, Thermoregulation, and Heart Rate to Short Wavelength Light. J. Clin. Endocrinol. Metab. 2005, 90, 1311–1316. [Google Scholar] [CrossRef]
- Łaszewska, K.; Goroncy, A.; Weber, P.; Pracki, T.; Tafil-Klawe, M.; Pracka, D.; Złomańczuk, P. Daytime Acute Non-Visual Alerting Response in Brain Activity Occurs as a Result of Short-and Long-Wavelengths of Light. J. Psychophysiol. 2018, 32, 202. [Google Scholar] [CrossRef]
- Smolders, K.C.H.J.; de Kort, Y.A.W. Bright Light and Mental Fatigue: Effects on Alertness, Vitality, Performance and Physiological Arousal. J. Environ. Psychol. 2014, 39, 77–91. [Google Scholar] [CrossRef]
- Vetter, C.; Juda, M.; Lang, D.; Wojtysiak, A.; Roenneberg, T. Blue-Enriched Office Light Competes with Natural Light as a Zeitgeber. Scand. J. Work. Environ. Health 2011, 37, 437–445. [Google Scholar] [CrossRef] [PubMed]
- Viola, A.U.; James, L.M.; Schlangen, L.J.; Dijk, D.-J. Blue-Enriched White Light in the Workplace Improves Self-Reported Alertness, Performance and Sleep Quality. Scand. J. Work. Environ. Health 2008, 34, 297–306. [Google Scholar] [CrossRef] [PubMed]
- Young, C.R.; Jones, G.E.; Figueiro, M.G.; Soutière, S.E.; Rea, M.S. At-Sea Trial of 24-h-Based Submarine Watchstanding Schedules with High and Low Correlated Color Temperature Light Sources. J. Biol. Rhythm. 2015, 30, 144–154. [Google Scholar] [CrossRef] [PubMed]
- Huiberts, L.M.; Smolders, K.C.H.J.; de Kort, Y.A.W. Non-Image Forming Effects of Illuminance Level: Exploring Parallel Effects on Physiological Arousal and Task Performance. Physiol. Behav. 2016, 164, 129–139. [Google Scholar] [CrossRef] [PubMed]
- Ru, T.; de Kort, Y.A.; Smolders, K.C.; Chen, Q.; Zhou, G. Non-Image Forming Effects of Illuminance and Correlated Color Temperature of Office Light on Alertness, Mood, and Performance across Cognitive Domains. Build. Environ. 2019, 149, 253–263. [Google Scholar] [CrossRef]
- Gabel, V.; Maire, M.; Reichert, C.F.; Chellappa, S.L.; Schmidt, C.; Hommes, V.; Cajochen, C.; Viola, A.U. Dawn Simulation Light Impacts on Different Cognitive Domains under Sleep Restriction. Behav. Brain Res. 2015, 281, 258–266. [Google Scholar] [CrossRef] [PubMed]
- Huiberts, L.M.; Smolders, K.C.H.J.; de Kort, Y.A.W. Shining Light on Memory: Effects of Bright Light on Working Memory Performance. Behav. Brain Res. 2015, 294, 234–245. [Google Scholar] [CrossRef]
- Liang, B.; He, S.; Tähkämö, L.; Tetri, E.; Cui, L.; Dangol, R.; Halonen, L. Lighting for Road Tunnels: The Influence of CCT of Light Sources on Reaction Time. Displays 2020, 61, 101931. [Google Scholar] [CrossRef]
- Li, X.; Ling, J.; Shen, Y.; Lu, T.; Feng, S.; Zhu, H. The Impact of CCT on Driving Safety in the Normal and Accident Situation: A VR-Based Experimental Study. Adv. Eng. Inform. 2021, 50, 101379. [Google Scholar] [CrossRef]
- Peng, L.; Weng, J.; Yang, Y.; Wen, H. Impact of Light Environment on Driver’s Physiology and Psychology in Interior Zone of Long Tunnel. Front. Public Health 2022, 10, 842750. [Google Scholar] [CrossRef]
- Bhagavathula, R.; Gibbons, R.; Hanifin, J.; Brainard, G. LED Roadway Lighting: Impact on Driver Sleep Health and Alertness; National Academies Press: Washington, DC, USA, 2021. [Google Scholar] [CrossRef]
- Jung, T.P.; Makeig, S.; Stensmo, M.; Sejnowski, T.J. Estimating Alertness from the EEG Power Spectrum. IEEE Trans. Biomed. Eng. 1997, 44, 60–69. [Google Scholar] [CrossRef]
- Portera, A.; Bassani, M. Examining the Impact of Different LED Road Stud Layouts on Driving Performance and Gaze Behaviour at Night-Time. Transp. Res. Part F Psychol. Behav. 2024, 103, 430–441. [Google Scholar] [CrossRef]
- Sharkey, K.M.; Carskadon, M.A.; Figueiro, M.G.; Zhu, Y.; Rea, M.S. Effects of an Advanced Sleep Schedule and Morning Short Wavelength Light Exposure on Circadian Phase in Young Adults with Late Sleep Schedules. Sleep Med. 2011, 12, 685–692. [Google Scholar] [CrossRef]
- Smith, W.J. Modern Optical Engineering 4E (PB); McGraw Hill Professional: New York, NY, USA, 2007; ISBN 978-0-07-159375-5. [Google Scholar]
- Hu, J.; Gao, X.; Wang, R. Study on the Drivers’ Recognition Law under Different Lighting Environment along the Tunnel Exit Section at Nighttime. In Proceedings of the 2019 6th International Conference on Frontiers of Industrial Engineering (ICFIE), London, UK, 10–12 September 2019; pp. 56–61. [Google Scholar] [CrossRef]
- Shamsul, B.; Sia, C.C.; Ng, Y.; Karmegan, K. Effects of Light’s Colour Temperatures on Visual Comfort Level, Task Performances, and Alertness among Students. Am. J. Public Health Res. 2013, 1, 159–165. [Google Scholar] [CrossRef]
- Sheu, M.; Chang, L.; Hsia, S.-C.; Sun, C.-C. Intelligent System Design for Variable Color Temperature LED Street Light. In Proceedings of the 2016 IEEE International Conference on Consumer Electronics-Taiwan (ICCE-TW), Nantou, Taiwan, 27–29 May 2016; pp. 1–2. [Google Scholar] [CrossRef]
- Pan, C.; Wu, J.; Pan, Z.; Chen, Q.; Xue, C. Non-Visual Effects of CCT and Illuminance and Driving Task on Driver’s Mood: Evidence from an EEG Study. In Proceedings of the Eighth International Conference on Electromechanical Control Technology and Transportation (ICECTT 2023), Hangzhou, China, 19–21 May 2023; Volume 12790, pp. 1399–1406. [Google Scholar] [CrossRef]
- Pan, Z.; Wang, H.; Wu, J.; Chen, Q. Non-Visual Effects of CCT on Drivers, Evidence from EEG. In Proceedings of the 6th International Conference on Intelligent Human Systems Integration IHSI 2023 Integrating People Intelligent Systems, Venice, Italy, 22–24 February 2023. [Google Scholar] [CrossRef]
- Niemierzycka, A.; Tomczuk, K.; Mikicin, M.; Zdrodowska, A.; Orzechowski, G.; Kowalczyk, M. Examinations of the Methods Used to Power Supply of Different Light Sources and Their Effect on Bioelectrical Brain Activity. Neurol. Neurochir. Pol. 2018, 52, 505–513. [Google Scholar] [CrossRef]
- Dinges, D.F.; Pack, F.; Williams, K.; Gillen, K.A.; Powell, J.W.; Ott, G.E.; Aptowicz, C.; Pack, A.I. Cumulative Sleepiness, Mood Disturbance, and Psychomotor Vigilance Performance Decrements during a Week of Sleep Restricted to 4–5 Hours per Night. Sleep 1997, 20, 267–277. [Google Scholar]
- Kubicki, S.; Herrmann, W.M.; Fichte, K.; Freund, G. Reflections on the Topics: EEG Frequency Bands and Regulation of Vigilance. Pharmakopsychiatr. Neuropsychopharmakol. 1979, 12, 237–245. [Google Scholar] [CrossRef]
- Liang, S.F.; Lin, C.T.; Wu, R.C.; Chen, Y.C.; Huang, T.Y.; Jung, T.P. Monitoring Driver’s Alertness Based on the Driving Performance Estimation and the EEG Power Spectrum Analysis. In Proceedings of the 2005 IEEE Engineering in Medicine and Biology 27th Annual Conference, Shanghai, China, 17–18 January 2005; pp. 5738–5741. [Google Scholar] [CrossRef]
- Makeig, S.; Inlow, M. Lapse in Alertness: Coherence of Fluctuations in Performance and EEG Spectrum. Electroencephalogr. Clin. Neurophysiol. 1993, 86, 23–35. [Google Scholar] [CrossRef]
- Lal, S.K.L.; Craig, A. Driver Fatigue: Electroencephalography and Psychological Assessment. Psychophysiology 2002, 39, 313–321. [Google Scholar] [CrossRef] [PubMed]
- Morales, J.M.; Díaz-Piedra, C.; Rieiro, H.; Roca-González, J.; Romero, S.; Catena, A.; Fuentes, L.J.; Di Stasi, L.L. Monitoring Driver Fatigue Using a Single-Channel Electroencephalographic Device: A Validation Study by Gaze-Based, Driving Performance, and Subjective Data. Accid. Anal. Prev. 2017, 109, 62–69. [Google Scholar] [CrossRef] [PubMed]
- Jap, B.T.; Lai, S.; Fischer, P.; Bekiaris, E. Using EEG Spectral Components to Assess Algorithms for Detecting Fatigue. Expert Syst. Appl. Int. J. 2009, 36, 2352–2359. [Google Scholar] [CrossRef]
- da Silveira, T.L.T.; Kozakevicius, A.J.; Rodrigues, C.R. Automated Drowsiness Detection through Wavelet Packet Analysis of a Single EEG Channel. Expert Syst. Appl. 2016, 55, 559–565. [Google Scholar] [CrossRef]
- Lee, B.G.; Lee, B.-L.; Chung, W.-Y. Mobile Healthcare for Automatic Driving Sleep-Onset Detection Using Wavelet-Based EEG and Respiration Signals. Available online: https://pubmed.ncbi.nlm.nih.gov/25264954/ (accessed on 28 January 2024).
- Chang, A.M.; Scheer, F.A.; Czeisler, C.A.; Aeschbach, D. Direct Effects of Light on Alertness, Vigilance, and the Waking Electroencephalogram in Humans Depend on Prior Light History. Sleep 2013, 36, 1239–1246. [Google Scholar] [CrossRef]
- Rosinvil, T.; Daneault, V.; Vanderwalle, G.; Desaultels, A.; Forcier, P.; Gaudet-Fex, B.; Apinis-Deshaies, A.; Aumont, T.; Constantin, I.M.; Matute, A. 280 Is Blue-Enriched Light More Effective than Red Light to Enhance Vigilance and Cognitive Performance in Parkinson’s Disease? Sleep 2021, 44, A112–A113. [Google Scholar] [CrossRef]
- Akerstedt, T.; Gillberg, M. Subjective and Objective Sleepiness in the Active Individual. Int. J. Neurosci. 1990, 52, 29–37. [Google Scholar] [CrossRef] [PubMed]
- Bekdash, M.; Asirvadam, V.; Kamel, N.; Yanti, D.K. Estimation of Driver Alertness to Different Colors and Intensities Using Brain Visual Evoked Potentials. In Proceedings of the 2016 6th International Conference on Intelligent and Advanced Systems (ICIAS), Kuala Lumpur, Malaysia, 15–17 August 2016; pp. 1–4. [Google Scholar] [CrossRef]
- Keis, O.; Helbig, H.; Streb, J.; Hille, K. Influence of Blue-Enriched Classroom Lighting on Students’ Cognitive Performance. Trends Neurosci. Educ. 2014, 3, 86–92. [Google Scholar] [CrossRef]
- He, S.; Yan, Y. Impact of Advance Light Exposure on Assembly-Line Workers’ Subjective Work Alertness and Sleep Quality. Light. Res. Technol. 2022, 55, 105–128. [Google Scholar] [CrossRef]
- Li, Y.; Ru, T.; Chen, Q.-W.; Qian, L.; Luo, X.; Zhou, G. Effects of Illuminance and Correlated Color Temperature of Indoor Light on Emotion Perception. Sci. Rep. 2021, 11, 14351. [Google Scholar] [CrossRef]
- Bao, J.; Song, X.; Li, Y.; Bai, Y.; Zhou, Q. Effect of Lighting Illuminance and Colour Temperature on Mental Workload in an Office Setting. Sci. Rep. 2021, 11, 15284. [Google Scholar] [CrossRef] [PubMed]
- Kahaki, Z.R.; Jahangiri, H.; Smith, A.P.; Kazemi, R. Subjective and Objective Survey of Office Lighting: Effects on Alertness, Comfort, Satisfaction, and Safety. Med. Lav. 2022, 113, e2022024. [Google Scholar] [CrossRef]
- Zhu, Y.; Yang, M.; Yao, Y.; Xiong, X.; Li, X.; Zhou, G.; Ma, N. Effects of Illuminance and Correlated Color Temperature on Daytime Cognitive Performance, Subjective Mood, and Alertness in Healthy Adults. Environ. Behav. 2019, 51, 199–230. [Google Scholar] [CrossRef]
- Min, B.-K.; Jung, Y.-C.; Kim, E.; Park, J.Y. Bright Illumination Reduces Parietal EEG Alpha Activity during a Sustained Attention Task. Brain Res. 2013, 1538, 83–92. [Google Scholar] [CrossRef] [PubMed]


| Variable | Level | Parameters | |
|---|---|---|---|
| Independent variable | CCT | 3 | 3000K, 4000K, 5000K |
| Illumination (the average illuminance of the road surface) | 2 | 20 lx, 30 lx | |
| Task | 3 | Task 1 (baseline): Monotonous driving. Task 2: Waiting for traffic lights and experiencing traffic congestion. Task 3: Auditory Psychomotor Vigilance Task (aPVT; Dual-task experimental paradigm) | |
| Implicit variable | EEG (β waves) | ||
| Reaction time (RT) |
| Lane 1 L1 | Lane 2 L2 | Lane 3 L3 | Lane 4 L4 | The Average Illuminance (Eye-Level) of the Entire Road = (L1 + L2 + L3 + L4)/4 | |
|---|---|---|---|---|---|
| Dynamic average (eye-level) illuminance (lx) | 3.857 | 2.771 | 2.706 | 2.942 | 3.069 |
| Static average (eye-level) illuminance (lx) | 3.214 | 3.229 | 3.100 | 3.229 | 3.193 |
| Maintained average illuminance of road surface (lx) | 28.5 | ||||
| Setting Objects | Parameters | ||
|---|---|---|---|
| CCT (Actual Luminaires) | 3000k | 4000k | 5000k |
| RGB (3D Max models) | (255, 161, 72) | (255, 209, 163) | (255, 228, 206) |
| Item | Score |
|---|---|
| 1 | |
| Very alert | 2 |
| Alert | 3 |
| Rather alert | 4 |
| Neither alert nor sleepy | 5 |
| Some signs of sleepiness | 6 |
| Sleepy, but no effort to keep awake | 7 |
| Sleepy, but some effort to keep awake | 8 |
| Very sleepy, great effort to keep awake, fighting sleep | 9 |
| Extremely sleepy, can’t keep awake | 10 |
Disclaimer/Publisher’s Note: The statements, opinions and data contained in all publications are solely those of the individual author(s) and contributor(s) and not of MDPI and/or the editor(s). MDPI and/or the editor(s) disclaim responsibility for any injury to people or property resulting from any ideas, methods, instructions or products referred to in the content. |
© 2024 by the authors. Licensee MDPI, Basel, Switzerland. This article is an open access article distributed under the terms and conditions of the Creative Commons Attribution (CC BY) license (https://creativecommons.org/licenses/by/4.0/).
Share and Cite
Chen, Q.; Pan, Z.; Wu, J.; Xue, C. An Investigation into the Effects of Correlated Color Temperature and Illuminance of Urban Motor Vehicle Road Lighting on Driver Alertness. Sensors 2024, 24, 4927. https://doi.org/10.3390/s24154927
Chen Q, Pan Z, Wu J, Xue C. An Investigation into the Effects of Correlated Color Temperature and Illuminance of Urban Motor Vehicle Road Lighting on Driver Alertness. Sensors. 2024; 24(15):4927. https://doi.org/10.3390/s24154927
Chicago/Turabian StyleChen, Quan, Zelei Pan, Jinchun Wu, and Chengqi Xue. 2024. "An Investigation into the Effects of Correlated Color Temperature and Illuminance of Urban Motor Vehicle Road Lighting on Driver Alertness" Sensors 24, no. 15: 4927. https://doi.org/10.3390/s24154927
APA StyleChen, Q., Pan, Z., Wu, J., & Xue, C. (2024). An Investigation into the Effects of Correlated Color Temperature and Illuminance of Urban Motor Vehicle Road Lighting on Driver Alertness. Sensors, 24(15), 4927. https://doi.org/10.3390/s24154927