
EEG Functional Connectivity Analysis for the Study of the Brain Maturation in the First Year of Life

 , , , and
Abstract
1. Introduction
2. Materials and Methods
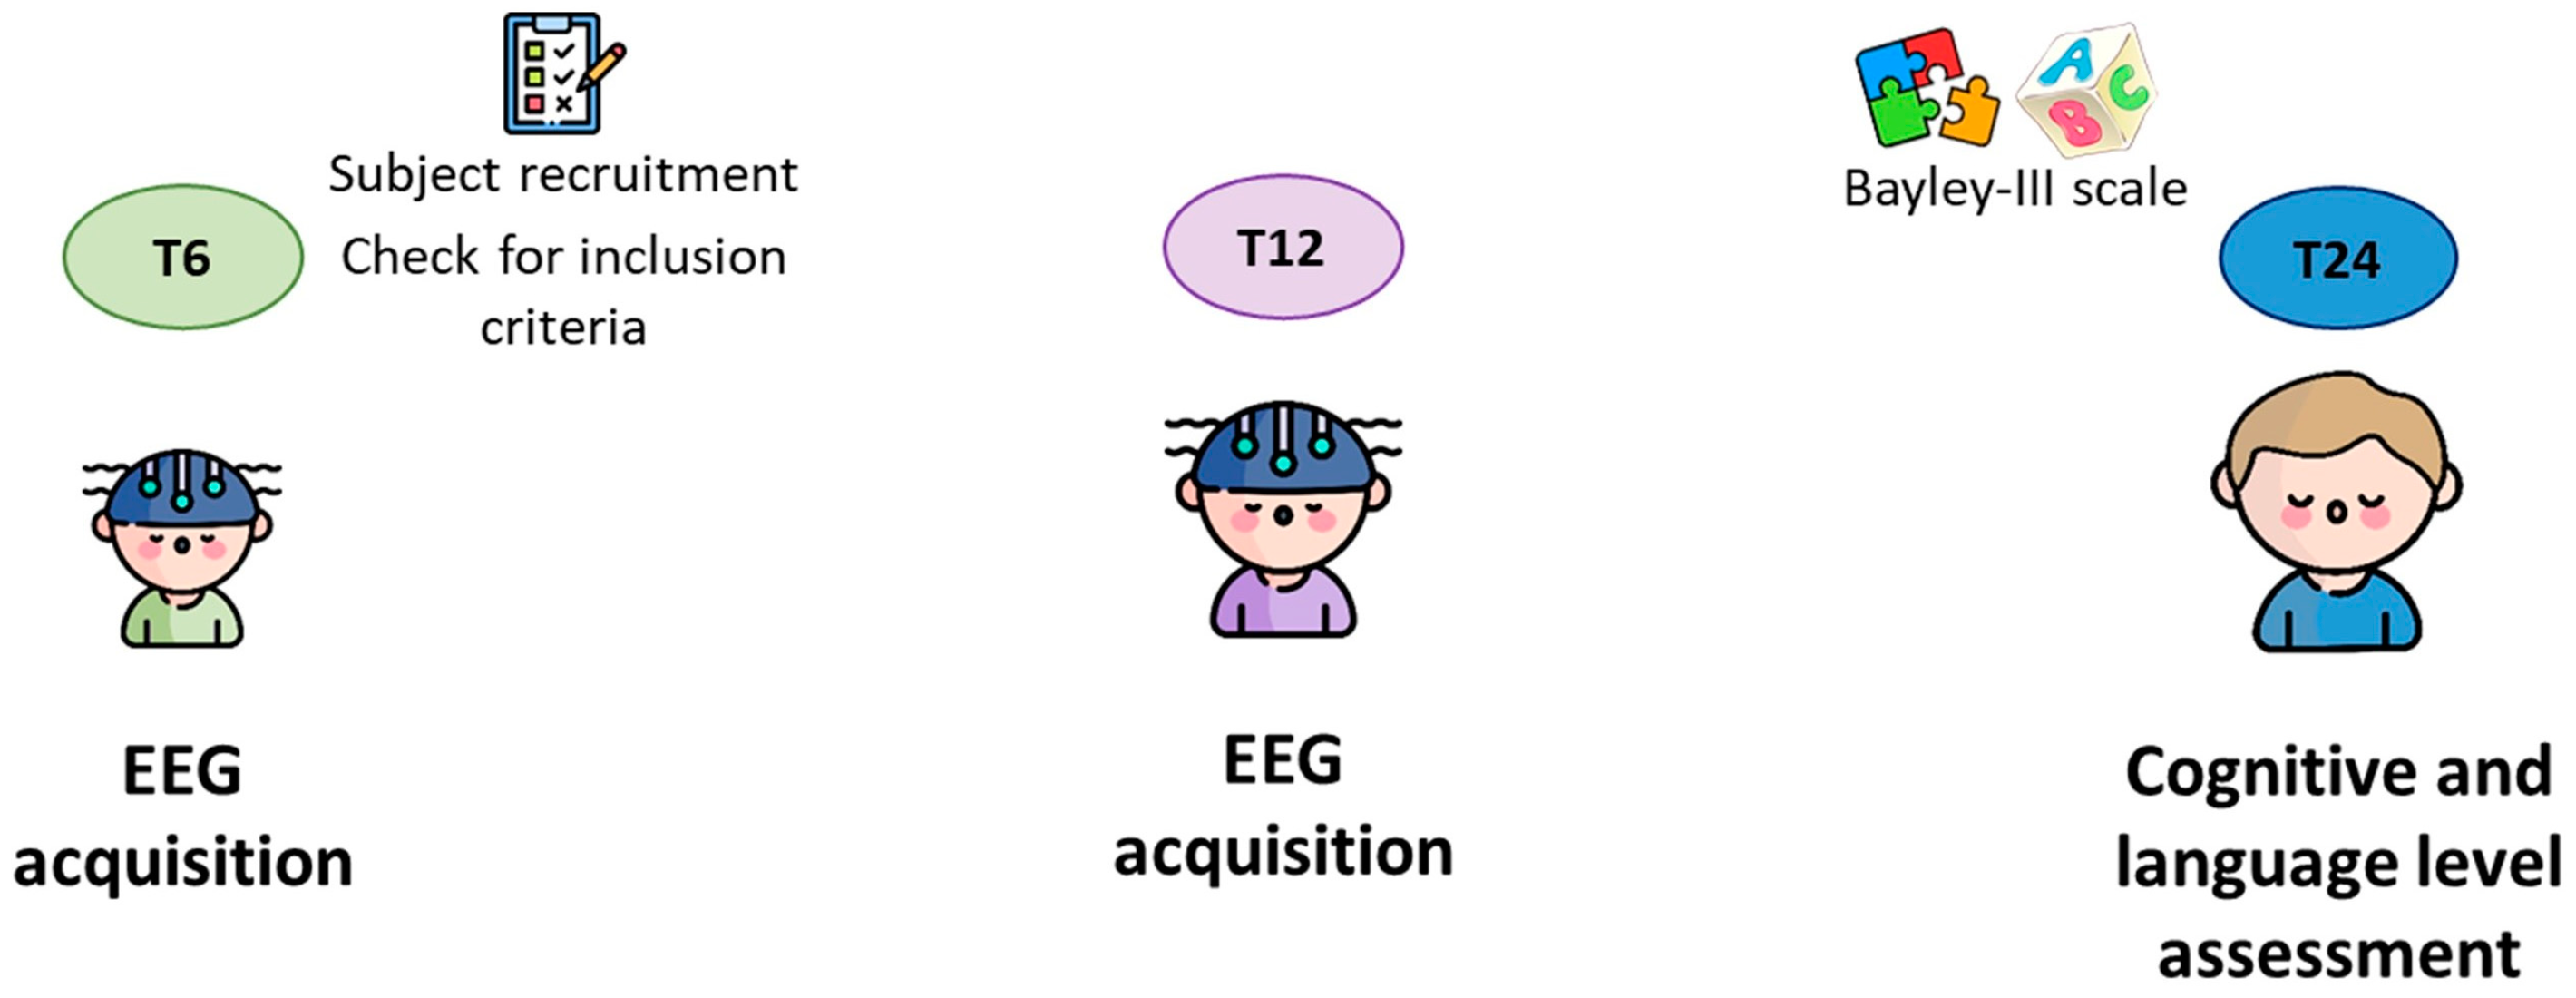
2.1. Participants
- Gestational age ≥ 36 weeks;
- No certified diagnosis of intellectual deficiency or neurodevelopmental disorders;
- At least one native Italian-speaking parent.
2.2. EEG Data Acquisition and Pre-Processing

2.3. Functional Connectivity Analysis
2.4. Cognitive and Language Outcome Assessment at 24 Months of Age
2.5. Statistical Analysis
3. Results
4. Discussion
Author Contributions
Funding
Institutional Review Board Statement
Informed Consent Statement
Data Availability Statement
Acknowledgments
Conflicts of Interest
References
- Lemaître, H.; Augé, P.; Saitovitch, A.; Vinçon-Leite, A.; Tacchella, J.M.; Fillon, L.; Calmon, R.; Dangouloff-Ros, V.; Lévy, R.; Grévent, D.; et al. Rest Functional Brain Maturation during the First Year of Life. Cereb. Cortex 2021, 31, 1776–1785. [Google Scholar] [CrossRef] [PubMed]
- Cao, M.; Huang, H.; He, Y. Developmental Connectomics from Infancy through Early Childhood. Trends Neurosci. 2017, 40, 494–506. [Google Scholar] [CrossRef] [PubMed]
- Sporns, O. Structure and function of complex brain networks. Dialogues Clin. Neurosci. 2013, 15, 247–262. [Google Scholar] [CrossRef]
- Sakkalis, V. Review of advanced techniques for the estimation of brain connectivity measured with EEG/MEG. Comput. Biol. Med. 2011, 41, 1110–1117. [Google Scholar] [CrossRef] [PubMed]
- Sarmukadam, K.; Sharpley, C.F.; Bitsika, V.; McMillan, M.M.E.; Agnew, L.L. A review of the use of EEG connectivity to measure the neurological characteristics of the sensory features in young people with autism. Rev. Neurosci. 2019, 30, 497–510. [Google Scholar] [CrossRef] [PubMed]
- van Straaten, E.C.W.; Stam, C.J. Structure out of chaos: Functional brain network analysis with EEG, MEG, and functional MRI. Eur. Neuropsychopharmacol. 2013, 23, 7–18. [Google Scholar] [CrossRef]
- Rubinov, M.; Sporns, O. Complex network measures of brain connectivity: Uses and interpretations. Neuroimage 2010, 52, 1059–1069. [Google Scholar] [CrossRef] [PubMed]
- Stam, C.J.; Nolte, G.; Daffertshofer, A. Phase lag index: Assessment of functional connectivity from multi channel EEG and MEG with diminished bias from common sources. Hum. Brain Mapp. 2007, 28, 1178–1193. [Google Scholar] [CrossRef] [PubMed]
- Marzetti, L.; Basti, A.; Chella, F.; D’Andrea, A.; Syrjälä, J.; Pizzella, V. Brain Functional Connectivity Through Phase Coupling of Neuronal Oscillations: A Perspective From Magnetoencephalography. Front. Neurosci. 2019, 13, 964. [Google Scholar] [CrossRef]
- Tsolisou, D. EEG connectivity analysis in infants: A Beginner’s Guide on Preprocessing and Processing Techniques. Brain Sci. Adv. 2023, 9, 242–274. [Google Scholar] [CrossRef]
- Seth, A.K.; Barrett, A.B.; Barnett, L. Granger causality analysis in neuroscience and neuroimaging. J. Neurosci. 2015, 35, 3293–3297. [Google Scholar] [CrossRef]
- Zhao, T.; Xu, Y.; He, Y. Graph theoretical modeling of baby brain networks. Neuroimage 2019, 185, 711–727. [Google Scholar] [CrossRef] [PubMed]
- Zhang, H.; Shen, D.; Lin, W. Resting-State Functional MRI Studies on Infant Brains: A Decade of Gap-Filling Efforts; Elsevier Inc.: Amsterdam, The Netherlands, 2019; Volume 185, ISBN 1919843264. [Google Scholar]
- De Benedictis, A.; Rossi-Espagnet, M.C.; de Palma, L.; Sarubbo, S.; Marras, C.E. Structural networking of the developing brain: From maturation to neurosurgical implications. Front. Neuroanat. 2023, 17, 1242757. [Google Scholar] [CrossRef]
- Gao, W.; Gilmore, J.H.; Giovanello, K.S.; Smith, J.K.; Shen, D.; Zhu, H.; Lin, W. Temporal and spatial evolution of brain network topology during the first two years of life. PLoS ONE 2011, 6, e25278. [Google Scholar] [CrossRef]
- Tóth, B.; Urbán, G.; Háden, G.P.; Márk, M.; Török, M.; Stam, C.J.; Winkler, I. Large-scale network organization of EEG functional connectivity in newborn infants. Hum. Brain Mapp. 2017, 38, 4019–4033. [Google Scholar] [CrossRef] [PubMed]
- Boersma, M.; Smit, D.J.A.; De Bie, H.M.A.; Van Baal, G.C.M.; Boomsma, D.I.; De Geus, E.J.C.; Delemarre-Van De Waal, H.A.; Stam, C.J. Network analysis of resting state EEG in the developing young brain: Structure comes with maturation. Hum. Brain Mapp. 2011, 32, 413–425. [Google Scholar] [CrossRef]
- Bathelt, J.; O’Reilly, H.; Clayden, J.D.; Cross, J.H.; De Haan, M. Functional brain network organisation of children between 2 and 5years derived from reconstructed activity of cortical sources of high-density EEG recordings. Neuroimage 2013, 82, 595–604. [Google Scholar] [CrossRef] [PubMed]
- Norton, E.S.; MacNeill, L.A.; Harriott, E.M.; Allen, N.; Krogh-Jespersen, S.; Smyser, C.D.; Rogers, C.E.; Smyser, T.A.; Luby, J.; Wakschlag, L. EEG/ERP as a pragmatic method to expand the reach of infant-toddler neuroimaging in HBCD: Promises and challenges. Dev. Cogn. Neurosci. 2021, 51, 100988. [Google Scholar] [CrossRef]
- Gong, G.; He, Y.; Evans, A.C. Brain connectivity: Gender makes a difference. Neuroscientist 2011, 17, 575–591. [Google Scholar] [CrossRef]
- Tomasi, D.; Volkow, N.D. Gender differences in brain functional connectivity density. Hum. Brain Mapp. 2012, 33, 849–860. [Google Scholar] [CrossRef]
- Wang, K.; Ji, X.; Li, T. Gender difference in functional activity of 4-months-old infants during sleep: A functional near-infrared spectroscopy study. Front. Psychiatry 2023, 13, 1046821. [Google Scholar] [CrossRef]
- Perani, D.; Saccuman, M.C.; Scifo, P.; Awander, A.; Spada, D.; Baldoli, C.; Poloniato, A.; Lohmann, G.; Friederici, A.D. Neural language networks at birth. Proc. Natl. Acad. Sci. USA 2011, 108, 16056–16061. [Google Scholar] [CrossRef] [PubMed]
- Bruchhage, M.M.K.; Ngo, G.C.; Schneider, N.; D’Sa, V.; Deoni, S.C.L. Functional connectivity correlates of infant and early childhood cognitive development. Brain Struct. Funct. 2020, 225, 669–681. [Google Scholar] [CrossRef] [PubMed]
- Rodriguez, E.; George, N.; Lachaux, J.-P.; Martinerie, J.; Renault, B.; Varela, F.J. Perception’s shadow: Long-distance synchronization of human brain activity. Nature 1999, 397, 430–433. [Google Scholar] [CrossRef] [PubMed]
- Gruber, T.; Müller, M.M.; Keil, A. Modulation of Induced Gamma Band Responses in a Perceptual Learning Task in the Human EEG. J. Cogn. Neurosci. 2002, 14, 732–744. [Google Scholar] [CrossRef]
- Fan, J.; Byrne, J.; Worden, M.S.; Guise, K.G.; McCandliss, B.D.; Fossella, J.; Posner, M.I. The relation of brain oscillations to attentional networks. J. Neurosci. 2007, 27, 6197–6206. [Google Scholar] [CrossRef] [PubMed]
- Tallon-Baudry, C.; Bertrand, O.; Peronnet, F.; Pernier, J. Induced γ-band activity during the delay of a visual short-term memory task in humans. J. Neurosci. 1998, 18, 4244–4254. [Google Scholar] [CrossRef]
- Crone, N.E.; Hao, L.; Hart, J.; Boatman, D.; Lesser, R.P.; Irizarry, R.; Gordon, B. Electrocorticographic gamma activity during word production in spoken and sign language. Neurology 2001, 57, 2045–2053. [Google Scholar] [CrossRef]
- Meyer, L. The neural oscillations of speech processing and language comprehension: State of the art and emerging mechanisms. Eur. J. Neurosci. 2018, 48, 2609–2621. [Google Scholar] [CrossRef]
- Pulvermüller, F.; Lutzenberger, W.; Preil, H.; Birbaumer, N. Spectral responses in the gamma-band: Physiological signs of higher cognitive processes? Neuroreport 1995, 6, 2059–2064. Available online: https://journals.lww.com/neuroreport/fulltext/1995/10010/spectral_responses_in_the_gamma_band_.25.aspx (accessed on 14 June 2024). [CrossRef]
- Gou, Z.; Choudhury, N.; Benasich, A.A. Resting frontal gamma power at 16, 24 and 36 months predicts individual differences in language and cognition at 4 and 5 years. Behav. Brain Res. 2011, 220, 263–270. [Google Scholar] [CrossRef] [PubMed]
- Brito, N.H.; Fifer, W.P.; Myers, M.M.; Elliott, A.J.; Noble, K.G. Associations among family socioeconomic status, EEG power at birth, and cognitive skills during infancy. Dev. Cogn. Neurosci. 2016, 19, 144–151. [Google Scholar] [CrossRef]
- Cantiani, C.; Piazza, C.; Mornati, G.; Molteni, M.; Riva, V. Oscillatory gamma activity mediates the pathway from socioeconomic status to language acquisition in infancy. Infant Behav. Dev. 2019, 57, 101384. [Google Scholar] [CrossRef] [PubMed]
- Piazza, C.; Dondena, C.; Riboldi, E.M.; Riva, V.; Cantiani, C. Baseline EEG in the first year of life: Preliminary insights into the development of autism spectrum disorder and language impairments. iScience 2023, 26, 106987. [Google Scholar] [CrossRef]
- Hollingshead, A. Four-Factor Index of Social Status. 1975. Available online: https://sociology.yale.edu/sites/default/files/files/yjs_fall_2011.pdf#page=21 (accessed on 20 May 2024).
- Bayley, N. Bayley Scales of Infant and Toddler Development: Bayley-III; Giunti OS: Florence, Italy, 2009. [Google Scholar]
- Griffiths, R.; Huntley, M. Griffiths Mental Development Scales-Revised: Birth to 2 Years (GMDS 0-2); Association for Research in Infant & Child Development: Oxford, UK, 1996. [Google Scholar]
- Makeig, S.; Bell, A.J.; Jung, T.P.; Sejnowski, T.J. Independent Component Analysis of Electroencephalographic Data. Adv. Neural Inf. Process. Syst. 1995, 8, 145–151. [Google Scholar]
- Pion-Tonachini, L.; Kreutz-Delgado, K.; Makeig, S. ICLabel: An automated electroencephalographic independent component classifier, dataset, and website. Neuroimage 2019, 198, 181–197. [Google Scholar] [CrossRef]
- Fraga González, G.; Van der Molen, M.J.W.; Žarić, G.; Bonte, M.; Tijms, J.; Blomert, L.; Stam, C.J.; Van der Molen, M.W. Graph analysis of EEG resting state functional networks in dyslexic readers. Clin. Neurophysiol. 2016, 127, 3165–3175. [Google Scholar] [CrossRef] [PubMed]
- Zeng, K.; Kang, J.; Ouyang, G.; Li, J.; Han, J.; Wang, Y.; Sokhadze, E.M.; Casanova, M.F.; Li, X. Disrupted brain network in children with autism spectrum disorder. Sci. Rep. 2017, 7, 16253. [Google Scholar] [CrossRef] [PubMed]
- Chen, J.; Wang, H.; Hua, C.; Wang, Q.; Liu, C. Graph analysis of functional brain network topology using minimum spanning tree in driver drowsiness. Cogn. Neurodyn. 2018, 12, 569–581. [Google Scholar] [CrossRef]
- Electrical Geodesics, I. Geodesic Sensor Net Technical Manual. 2007, pp. 1–150. Available online: https://www.documents.philips.com/assets/20180705/6f388e7ade4d41e38ad5a91401755b6f.pdf (accessed on 4 March 2024).
- Stam, C.J.; Tewarie, P.; Van Dellen, E.; van Straaten, E.C.W.; Hillebrand, A.; Van Mieghem, P. The trees and the forest: Characterization of complex brain networks with minimum spanning trees. Int. J. Psychophysiol. 2014, 92, 129–138. [Google Scholar] [CrossRef]
- Kruskal, J.B. On the Shortest Spanning Subtree of a Graph and the Traveling Salesman Problem (1956). Ideas That Creat. Futur. 1956, 5, 179–182. [Google Scholar] [CrossRef]
- Blomsma, N.; Rooy, B.; Gerritse, F.; van der Spek, R.; Tewarie, P.; Hillebrand, A.; Otte, W.M.; Stam, C.J.; van Dellen, E. Minimum spanning tree analysis of brain networks: A systematic review of network size effects, sensitivity for neuropsychiatric pathology, and disorder specificity. Netw. Neurosci. 2022, 6, 301–319. [Google Scholar] [CrossRef] [PubMed]
- Gu, C.; Gu, X.; Wang, P.; Ren, H.; Weng, T.; Yang, H.; Rohling, J.H.T. Disassortative Network Structure Improves the Synchronization between Neurons in the Suprachiasmatic Nucleus. J. Biol. Rhythm. 2019, 34, 515–524. [Google Scholar] [CrossRef] [PubMed]
- Tierney, A.L.; Gabard-Durnam, L.; Vogel-Farley, V.; Tager-Flusberg, H.; Nelson, C.A. Developmental trajectories of resting eeg power: An endophenotype of autism spectrum disorder. PLoS ONE 2012, 7, e39127. [Google Scholar] [CrossRef] [PubMed]
- Gabard-Durnam, L.J.; Wilkinson, C.; Kapur, K.; Tager-Flusberg, H.; Levin, A.R.; Nelson, C.A. Longitudinal EEG power in the first postnatal year differentiates autism outcomes. Nat. Commun. 2019, 10, 4188. [Google Scholar] [CrossRef] [PubMed]
- Wilkinson, C.L.; Gabard-Durnam, L.J.; Kapur, K.; Tager-Flusberg, H.; Levin, A.R.; Nelson, C.A. Use of Longitudinal EEG Measures in Estimating Language Development in Infants With and Without Familial Risk for Autism Spectrum Disorder. Neurobiol. Lang. 2020, 1, 33–53. [Google Scholar] [CrossRef] [PubMed]
- Huberty, S.; Carter Leno, V.; van Noordt, S.J.R.; Bedford, R.; Pickles, A.; Desjardins, J.A.; Webb, S.J.; Elsabbagh, M.; Baron-Cohen, S.; Bolton, P.; et al. Association between spectral electroencephalography power and autism risk and diagnosis in early development. Autism Res. 2021, 14, 1390–1403. [Google Scholar] [CrossRef] [PubMed]
- Zhang, H.; Wang, C.; Yang, T.; Phua, K.S.; Ng, V.S.H.; Law, E.C.N. Infant EEG Band Power Analysis at 6 Months and 18 Months. In Proceedings of the 2021 43rd Annual International Conference of the IEEE Engineering in Medicine & Biology Society (EMBC), Mexico City, Mexico, 1–5 November 2021; pp. 6353–6356. [Google Scholar] [CrossRef]
- Benjamini, Y.; Yekutieli, D. The control of the false discovery rate in multiple testing under dependency. Ann. Stat. 2001, 29, 1165–1188. [Google Scholar] [CrossRef]
- Field, A. Discovering Statistics Using IBM SPSS Statistics, 4th ed.; Sage: Los Angeles, CA, USA; London, UK; New Delhi, India, 2013. [Google Scholar]
- Bender, R.; Lange, S. Adjusting for multiple testing—When and how? J. Clin. Epidemiol. 2001, 54, 343–349. [Google Scholar] [CrossRef]
- Benasich, A.A.; Gou, Z.; Choudhury, N.; Harris, K.D. Early cognitive and language skills are linked to resting frontal gamma power across the first 3 years. Behav. Brain Res. 2008, 195, 215–222. [Google Scholar] [CrossRef]
- Fjell, A.M.; Sneve, M.H.; Grydeland, H.; Storsve, A.B.; Amlien, I.K.; Yendiki, A.; Walhovd, K.B. Relationship between structural and functional connectivity change across the adult lifespan: A longitudinal investigation. Hum. Brain Mapp. 2017, 38, 561–573. [Google Scholar] [CrossRef] [PubMed]
- Basti, A.; Chella, F.; Guidotti, R.; Ermolova, M.; D’Andrea, A.; Stenroos, M.; Romani, G.L.; Pizzella, V.; Marzetti, L. Looking through the windows: A study about the dependency of phase-coupling estimates on the data length. J. Neural Eng. 2022, 19, 016039. [Google Scholar] [CrossRef] [PubMed]


| Age (days) | T6: 197.6 (13.99) T12: 377.16 (11.98) |
| Sex | 70 M 76 F |
| Gestational age (weeks) | 39.37 (1.33) |
| Birth weight (g) | 3279.85 (401.9) |
| Cognitive Score at T6 a | 107.04 (8.75) |
| Socio-economic status at T6 b | 66.34 (16.18) |
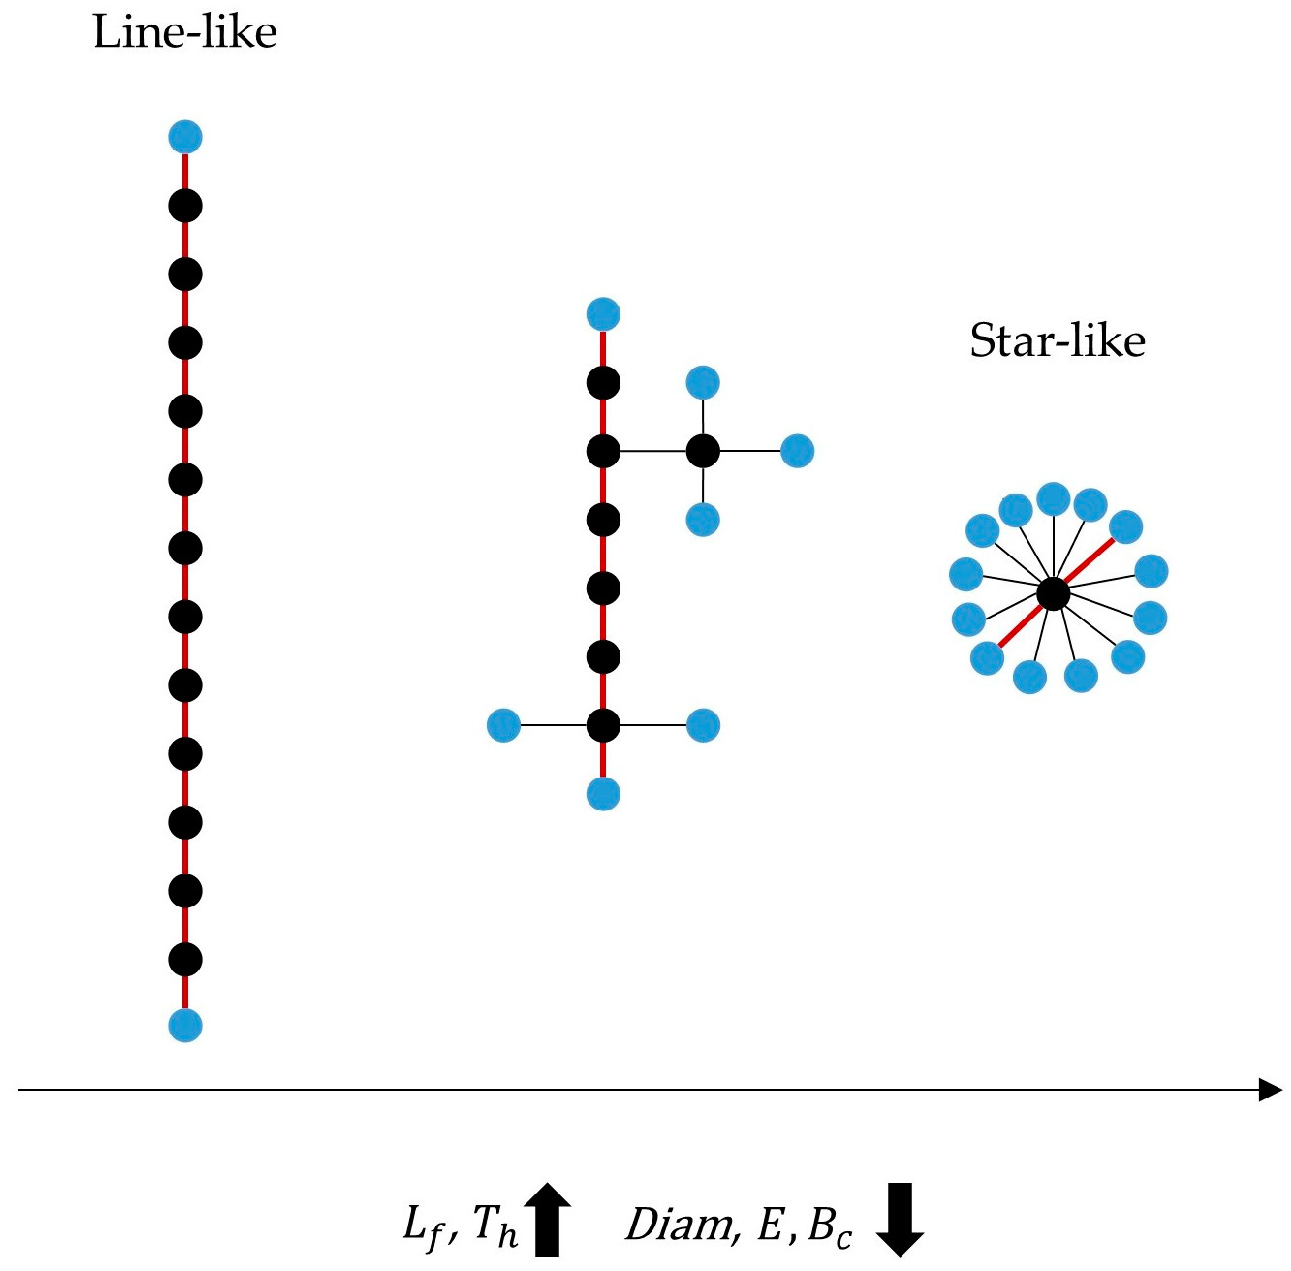
| MST Features | Description |
|---|---|
| Leaf fraction | Number of nodes with a single connection |
| Diameter | Longest distance between any two nodes |
| Eccentricity | Longest distance between a reference node and any other node |
| Betweenness Centrality | Fraction of all shortest paths that pass through a particular node |
| Tree hierarchy | Hierarchical metric of the network organization |
| Degree Correlation | Correlation between the degree of a node and the degree of the nodes to which it is connected |
| Kappa | Degree divergence |
| Time Point Effect | Sex Effect | ||||||
|---|---|---|---|---|---|---|---|
| FC Feature | Frequency Band | F | p Value | adj p Value | F | p Value | adj p Value |
| Mean MSC | Delta | 14.243 | <0.001 | <0.001 *** | 0.0596 | 0.441 | 0.529 |
| Theta | 53.884 | <0.001 | <0.001 *** | 0.200 | 0.655 | 0.655 | |
| Low Alpha | 31.638 | <0.001 | <0.001 *** | 0.817 | 0.367 | 0.529 | |
| High Alpha | 26.201 | <0.001 | <0.001 *** | 2.723 | 0.101 | 0.228 | |
| Beta | 16.135 | <0.001 | <0.001 *** | 2.519 | 0.114 | 0.228 | |
| Gamma | 18.833 | <0.001 | <0.001 *** | 6.532 | 0.011 | 0.066 * | |
| Mean PLI | Delta | 5.012 | 0.026 | 0.052 * | 0.936 | 0.335 | 0.503 |
| Theta | 27.958 | <0.001 | <0.001 *** | 2.174 | 0.142 | 0.426 | |
| Low Alpha | 1.014 | 0.315 | 0.473 | 1.316 | 0.253 | 0.503 | |
| High Alpha | 0.164 | 0.686 | 0.823 | 0.349 | 0.555 | 0.555 | |
| Beta | 8.923 | 0.003 | 0.009 *** | 0.42 | 0.518 | 0.555 | |
| Gamma | 0.013 | 0.909 | 0.909 | 3.761 | 0.054 | 0.324 | |
| Leaf fraction | Delta | 19.385 | <0.001 | <0.001 *** | 0.094 | 0.760 | 0.820 |
| Theta | 13.929 | <0.001 | <0.001 *** | 3.949 | 0.048 | 0.096 | |
| Low Alpha | 14.827 | <0.001 | <0.001 *** | 0.052 | 0.820 | 0.820 | |
| High Alpha | 24.281 | <0.001 | <0.001 *** | 5.124 | 0.025 | 0.075 | |
| Beta | 10.381 | 0.001 | 0.0012 *** | 2.015 | 0.157 | 0.236 | |
| Gamma | 10.292 | 0.002 | 0.002 *** | 6.676 | 0.011 | 0.066 * | |
| Diameter | Delta | 10.359 | 0.002 | 0.004 *** | 0.112 | 0.739 | 0.887 |
| Theta | 11.128 | 0.001 | 0.004 *** | 0.011 | 0.918 | 0.918 | |
| Low Alpha | 7.635 | 0.006 | 0.009 *** | 0.428 | 0.514 | 0.887 | |
| High Alpha | 9.957 | 0.002 | 0.004 *** | 1.398 | 0.239 | 0.726 | |
| Beta | 4.923 | 0.028 | 0.034 ** | 0.205 | 0.651 | 0.887 | |
| Gamma | 3.125 | 0.079 | 0.079 | 1.375 | 0.242 | 0.726 | |
| Eccentricity | Delta | 9.427 | 0.002 | 0.006 *** | 0.213 | 0.645 | 0.821 |
| Theta | 11.483 | 0.001 | 0.006 *** | 0.002 | 0.967 | 0.967 | |
| Low Alpha | 7.567 | 0.007 | 0.011 ** | 0.166 | 0.684 | 0.821 | |
| High Alpha | 8.579 | 0.004 | 0.008 *** | 0.508 | 0.477 | 0.821 | |
| Beta | 4.117 | 0.044 | 0.046 ** | 0.207 | 0.650 | 0.821 | |
| Gamma | 4.051 | 0.046 | 0.046 ** | 0.275 | 0.275 | 0.821 | |
| Betweenness Centrality | Delta | 10.036 | 0.002 | 0.004 *** | 0.185 | 0.668 | 0.992 |
| Theta | 15.703 | <0.001 | <0.001 *** | 0 | 0.992 | 0.992 | |
| Low Alpha | 10.087 | 0.002 | 0.004 *** | 0.007 | 0.931 | 0.992 | |
| High Alpha | 9.317 | 0.003 | 0.0045 *** | 0.587 | 0.445 | 0.992 | |
| Beta | 4.207 | 0.042 | 0.042 ** | 0.219 | 0.640 | 0.992 | |
| Gamma | 4.482 | 0.036 | 0.042 ** | 2.074 | 0.152 | 0.912 | |
| Tree hierarchy | Delta | 20.436 | <0.001 | <0.001 *** | 0.012 | 0.913 | 0.913 |
| Theta | 3.113 | 0.079 | 0.079 | 3.636 | 0.058 | 0.174 | |
| Low Alpha | 9.576 | 0.002 | 0.004 *** | 0.108 | 0.743 | 0.892 | |
| High Alpha | 18.796 | <0.001 | <0.001 *** | 9.19 | 0.003 | 0.018 ** | |
| Beta | 8.192 | 0.005 | 0.0075 *** | 2.015 | 0.157 | 0.236 | |
| Gamma | 5.959 | 0.016 | 0.019 ** | 2.949 | 0.088 | 0.176 | |
| Degree Correlation | Delta | 3.864 | 0.051 | 0.0765 | 1.088 | 0.298 | 0.439 |
| Theta | 1.094 | 0.297 | 0.297 | 2.029 | 0.156 | 0.312 | |
| Low Alpha | 14.582 | <0.001 | <0.001 *** | 0.306 | 0.581 | 0.581 | |
| High Alpha | 7.81 | 0.006 | 0.016 ** | 0.821 | 0.366 | 0.439 | |
| Beta | 7.081 | 0.008 | 0.016 ** | 4.529 | 0.035 | 0.141 | |
| Gamma | 3.173 | 0.076 | 0.0912 | 4.009 | 0.047 | 0.141 | |
| Kappa | Delta | 8.977 | 0.003 | 0.006 *** | 0.344 | 0.558 | 0.665 |
| Theta | 8.256 | 0.005 | 0.006 *** | 4.638 | 0.033 | 0.099 | |
| Low Alpha | 13.531 | <0.001 | <0.001 *** | 0.188 | 0.665 | 0.665 | |
| High Alpha | 20.229 | <0.001 | <0.001 *** | 2.758 | 0.098 | 0.196 | |
| Beta | 3.47 | 0.064 | 0.064 * | 1.509 | 0.221 | 0.332 | |
| Gamma | 8.366 | 0.004 | 0.006 *** | 5.544 | 0.020 | 0.099 | |
| Mean MSC | Mean PLI | Leaf Fraction | Diam | E | Bc | Th | Degree Corr. | Kappa | ||
|---|---|---|---|---|---|---|---|---|---|---|
| T24 Bayley RC | r | −0.033 | 0.118 | −0.031 | 0.151 | 0.138 | 0.106 | −0.077 | 0.072 | −0.040 |
| p value | 0.796 | 0.354 | 0.809 | 0.233 | 0.279 | 0.406 | 0.543 | 0.570 | 0.754 | |
| CI | [−0.32, 0.25] | [−0.13, 0.36] | [−0.3, 0.25] | [−0.1, 0.41] | [−0.12, 0.38] | [−0.16, 0.37] | [−0.33, 0.19] | [−0.22, 0.36] | [−0.33, 0.24] | |
| T24 Bayley RLC | r | −0.116 | 0.111 | 0.075 | −0.141 | −0.183 | −0.203 | −0.076 | 0.080 | 0.106 |
| p value | 0.352 | 0.374 | 0.547 | 0.259 | 0.141 | 0.102 | 0.544 | 0.522 | 0.397 | |
| CI | [−0.38, 0.15] | [−0.14, 0.36] | [−0.2, 0.34] | [−0.39, 0.13] | [−0.43, 0.08] | [−0.45, 0.06] | [−0.34, 0.19] | [−0.18, 0.33] | [−0.14, 0.36] |
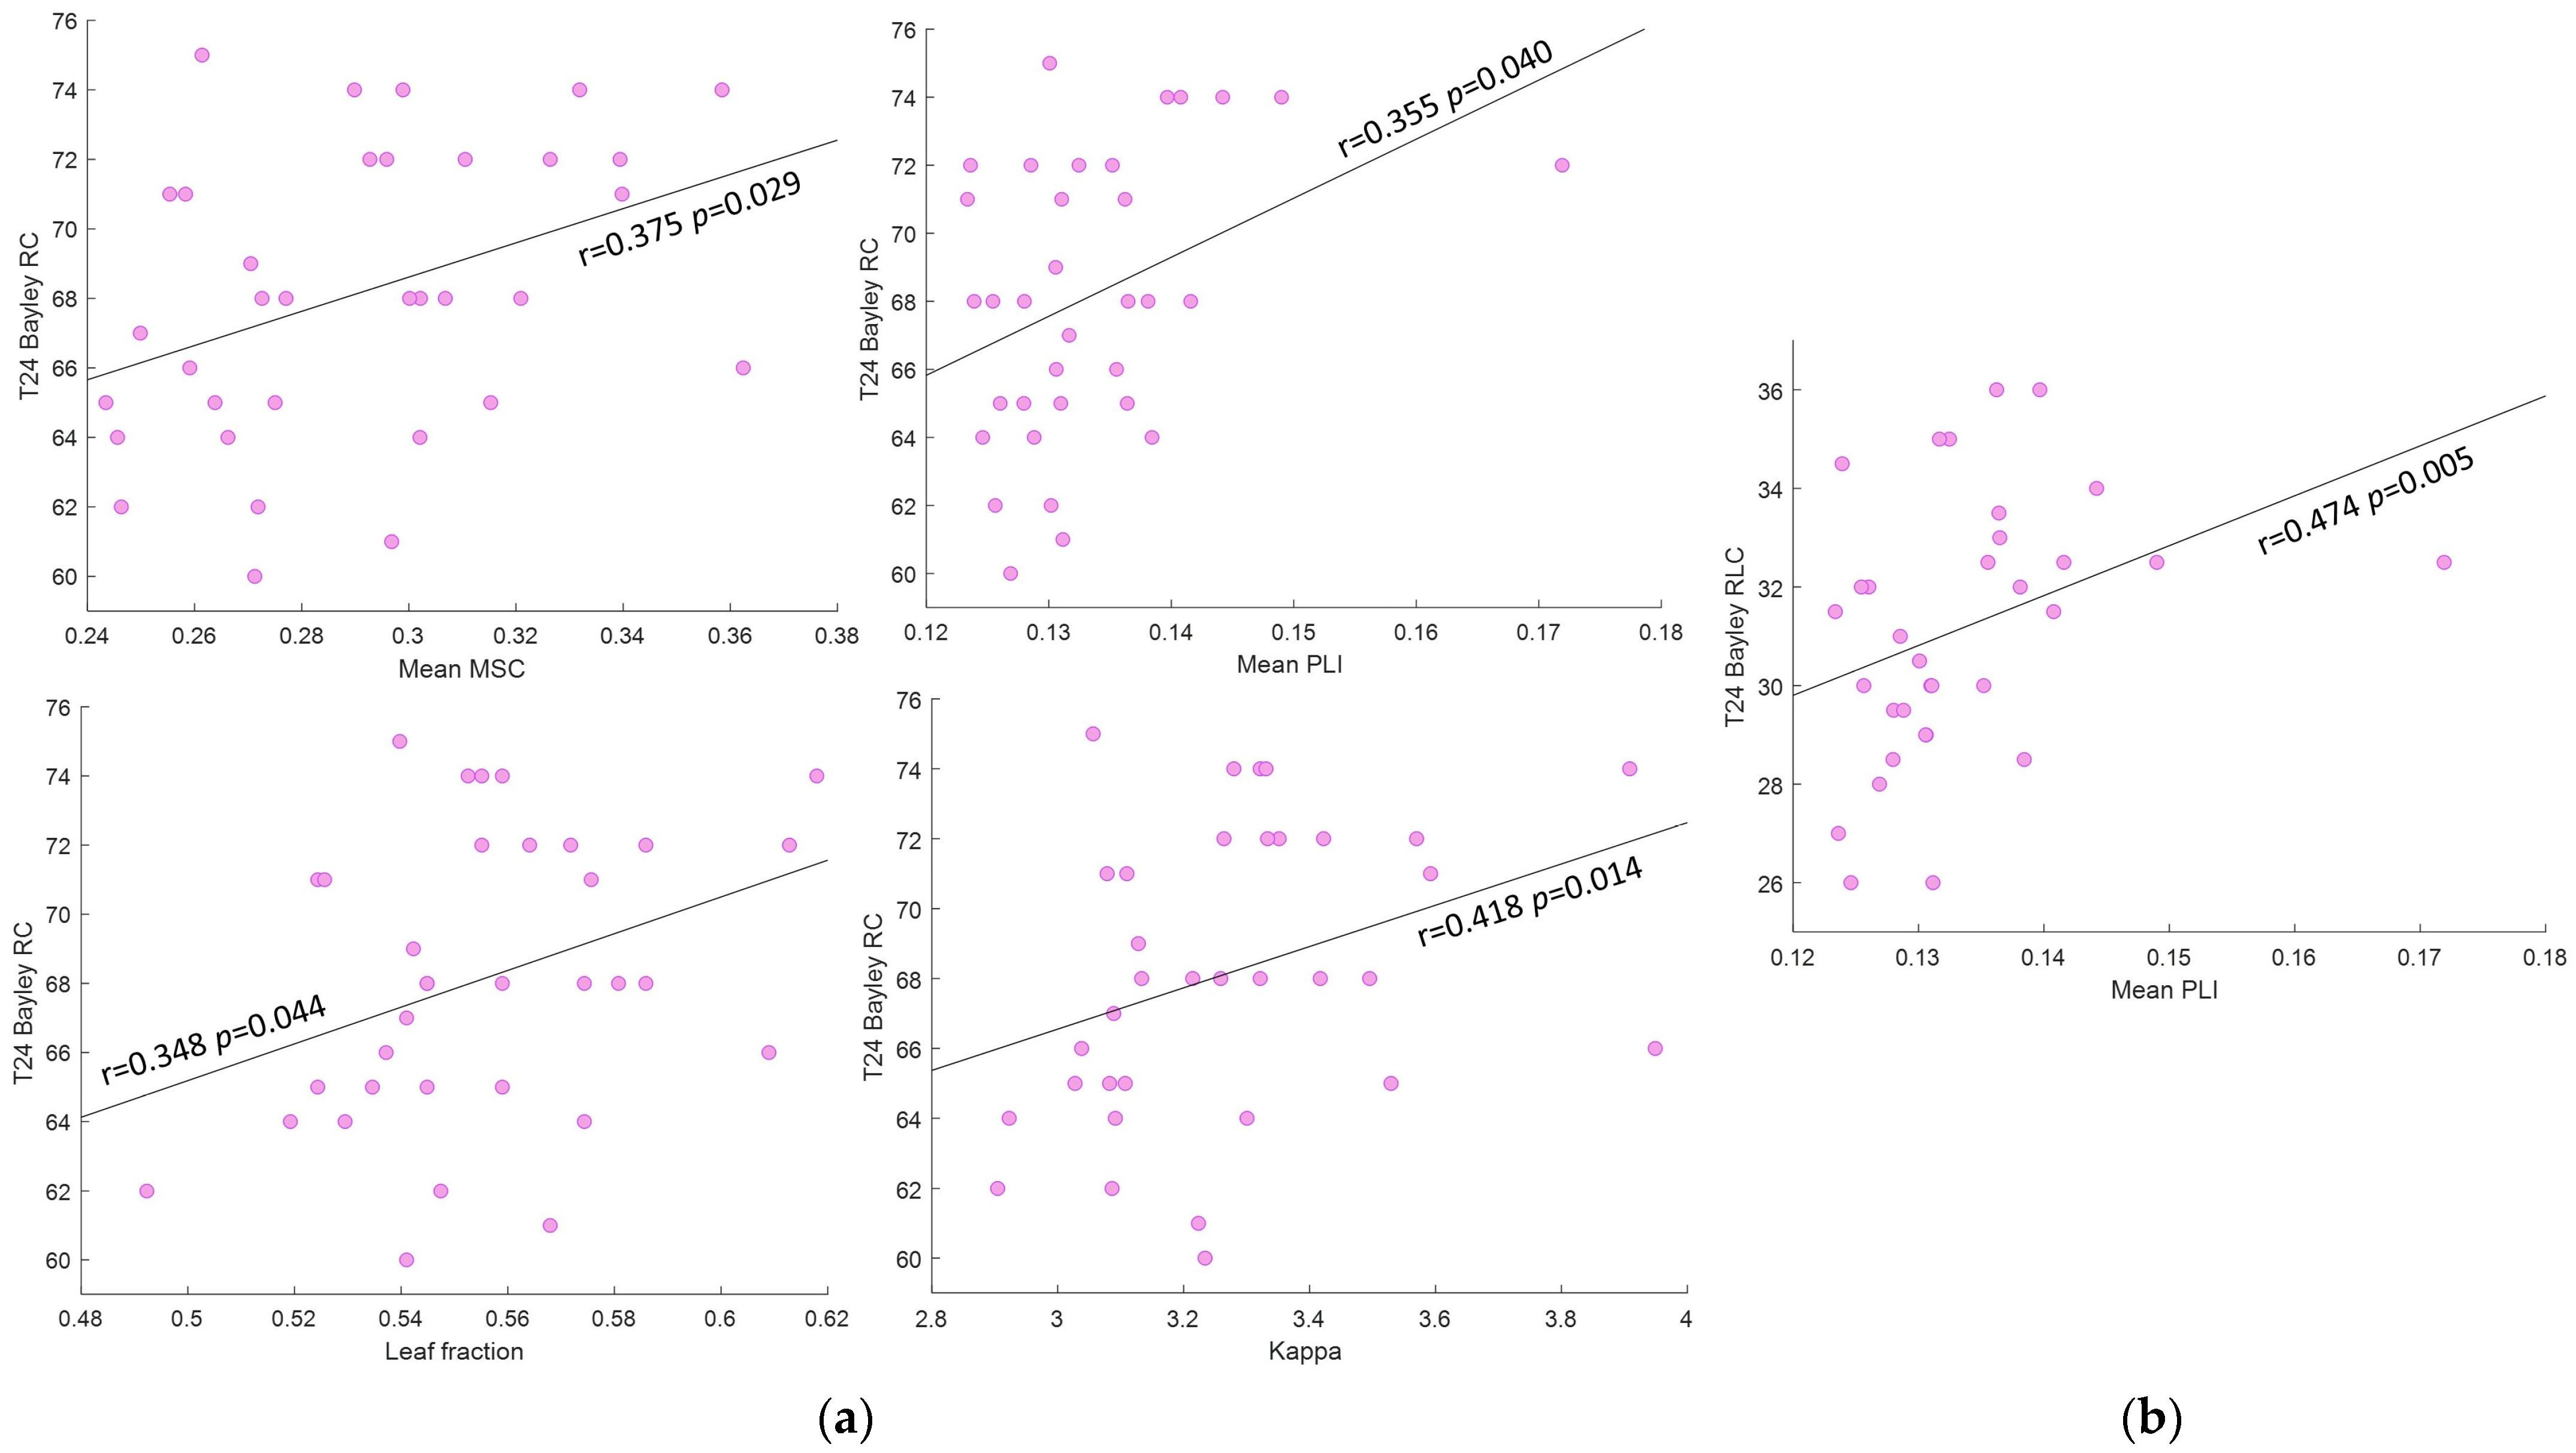
| Mean MSC | Mean PLI | Leaf Fraction | Diam | E | Bc | Th | Degree Corr. | Kappa | ||
|---|---|---|---|---|---|---|---|---|---|---|
| T24 Bayley RC | r | 0.375 | 0.355 | 0.348 | −0.104 | −0.131 | −0.227 | 0.096 | −0.076 | 0.418 |
| p value | 0.029 * | 0.040 * | 0.044 * | 0.560 | 0.459 | 0.197 | 0.589 | 0.670 | 0.014 * | |
| CI | [0.04, 0.63] | [0.01, 0.64] | [−0.001, 0.61] | [−0.44, 0.29] | [−0.46, 0.27] | [−0.53, 0.17] | [−0.28, 0.45] | [−0.39, 0.26] | [0.06, 0.67] | |
| T24 Bayley RLC | r | 0.114 | 0.474 | 0.046 | 0.247 | 0.207 | 0.051 | −0.087 | 0.104 | 0.115 |
| p value | 0.528 | 0.005 * | 0.799 | 0.166 | 0.248 | 0.780 | 0.629 | 0.564 | 0.525 | |
| CI | [−0.24, 0.46] | [0.13, 0.71] | [−0.32, 0.39] | [−0.12, 0.56] | [−0.17, 0.53] | [−0.34, 0.4] | [−0.46, 0.27] | [−0.23, 0.44] | [−0.21, 0.43] |
Disclaimer/Publisher’s Note: The statements, opinions and data contained in all publications are solely those of the individual author(s) and contributor(s) and not of MDPI and/or the editor(s). MDPI and/or the editor(s) disclaim responsibility for any injury to people or property resulting from any ideas, methods, instructions or products referred to in the content. |
© 2024 by the authors. Licensee MDPI, Basel, Switzerland. This article is an open access article distributed under the terms and conditions of the Creative Commons Attribution (CC BY) license (https://creativecommons.org/licenses/by/4.0/).
Share and Cite
Falivene, A.; Cantiani, C.; Dondena, C.; Riboldi, E.M.; Riva, V.; Piazza, C. EEG Functional Connectivity Analysis for the Study of the Brain Maturation in the First Year of Life. Sensors 2024, 24, 4979. https://doi.org/10.3390/s24154979
Falivene A, Cantiani C, Dondena C, Riboldi EM, Riva V, Piazza C. EEG Functional Connectivity Analysis for the Study of the Brain Maturation in the First Year of Life. Sensors. 2024; 24(15):4979. https://doi.org/10.3390/s24154979
Chicago/Turabian StyleFalivene, Anna, Chiara Cantiani, Chiara Dondena, Elena Maria Riboldi, Valentina Riva, and Caterina Piazza. 2024. "EEG Functional Connectivity Analysis for the Study of the Brain Maturation in the First Year of Life" Sensors 24, no. 15: 4979. https://doi.org/10.3390/s24154979
APA StyleFalivene, A., Cantiani, C., Dondena, C., Riboldi, E. M., Riva, V., & Piazza, C. (2024). EEG Functional Connectivity Analysis for the Study of the Brain Maturation in the First Year of Life. Sensors, 24(15), 4979. https://doi.org/10.3390/s24154979