Article

High-Sensitivity Refractive Index Sensor with Dual-Channel Based on Surface Plasmon Resonance Photonic Crystal Fiber

1
Liren College, Yanshan University, Qinhuangdao 066004, China
2
School of Information Science and Engineering, Yanshan University, Qinhuangdao 066004, China
*
Author to whom correspondence should be addressed.
Sensors 2024, 24(15), 5050; https://doi.org/10.3390/s24155050
Submission received: 13 July 2024 / Revised: 30 July 2024 / Accepted: 31 July 2024 / Published: 4 August 2024
(This article belongs to the Collection Optical Fiber Sensors)

Abstract

:
In order to achieve a high-precision synchronous detection of two different refractive index (RI) analytes, a D-type surface plasmon resonance (SPR) photonic crystal fiber (PCF) RI sensor based on two channels is designed in this paper. The sensor uses a D-shaped planar region of the PCF and a large circular air hole below the core as the sensing channels. Surface plasmon resonance is induced by applying a coating of gold film on the surface. The full-vector finite-element method (FEM) is used to optimize the structural parameters of the optical fiber, and the sensing characteristics are studied, including wavelength sensitivity, RI resolution, full width at half maximum (FWHM), figure of merit (FOM), and signal-to-noise ratio (SNR). The results show that the channel 1 (Ch 1) can achieve RI detection of 1.36–1.39 in the wavelength range of 1500–2600 nm, and the channel 2 (Ch 2) can achieve RI detection of 1.46–1.57 in the wavelength range of 2100–3000 nm. The two sensing channels can detect independently or simultaneously measure two analytes with different RIs. The maximum wavelength sensitivity of the sensor can reach 30,000 nm/RIU in Channel 1 and 9900 nm/RIU in Channel 2. The RI resolutions of the two channels are 3.54 × 10⁻⁶ RIU and 10.88 × 10⁻⁶ RIU, respectively. Therefore, the sensor realizes dual-channel high- and low-RI synchronous detection in the ultra-long wavelength band from near-infrared to mid-infrared and achieves an ultra-wide RI detection range and ultra-high wavelength sensitivity. The sensor has a wide application prospect in the fields of chemical detection, biomedical sensing, and water environment monitoring.

1. Introduction

Photonic crystal fiber (PCF) [1] has a periodic array of pores, which are closely arranged in the two-dimensional direction and maintain the structure along the axis, so it is also called microstructured optical fiber (MOF) [2]. Since its inception, PCF has received great attention from the majority of researchers. The new characteristics of low-optical loss and high-optical nonlinearity make PCF more widely used in sensing, detection, optical fiber communication, nonlinear optics, and many other fields [3,4,5,6]. Surface plasmon resonance (SPR) is a physical phenomenon that occurs when the wave vector of incident light matches the wave vector of the surface plasmon wave. The wave vector of surface plasmon waves depends on the refractive index (RI) of the metal and the material combined with the metal so that SPR technology can monitor the change in RI caused by the combination of the material with the metal surface. With the discovery of SPR, the sensor based on surface plasmon resonance photonic crystal fiber (SPR-PCF) came into being. Because of its small size, strong anti-electromagnetic interference ability, high sensitivity, fast response, and other advantages, it has been widely used in the field of sensing [7]. Moreover, the SPR-PCF sensors can be flexibly designed. By changing the design parameters of PCF, the phase matching of the light wave and surface plasma wave can be adjusted so that the RI detection range and sensing band of the sensor can be changed and the sensing performance can be improved [8,9].
With the rise of SPR-PCF sensors, more and more researchers are engaged in this field. In recent years, SPR-PCF sensors have entered an unprecedented stage of development. Researchers from various countries have conducted in-depth research in many sensing fields, such as temperature [10], biology [11], gas [12], pressure [13], and so on [14,15,16], and they have achieved a large number of scientific research results [17]. In 2017, D.F. Santos et al. [18] designed a sensor consisting of a D-type SPR-PCF with metamaterial layers. They demonstrated that the loss and operation wavelength could be controlled in a wide range by changing the relative proportion of different materials that comprise the metamaterial. In 2018, Yundong Liu et al. [19] proposed a gold-plated D-shaped PCF RI sensor with a circular layout of pores and studied the sensing characteristics of the sensor using FEM. In 2019, Shun Wang et al. [20] proposed and analyzed a SPR sensor based on symmetrical side-polished dual-core PCF. In 2022, Ahmed A. Saleh Falah et al. [21] proposed and comprehensively investigated a high-sensitivity gold-coated eccentric core D-shaped SPR-PCF sensor based on uniform circular glass capillaries and solid rods, which had high linearity.
With the diversification of detection target samples and the increasing demand for detection, traditional single-channel SPR-PCF RI sensors cannot meet the needs of practical detection. Therefore, multi-channel SPR-PCF RI sensors have emerged. In 2020, Pibin Bing et al. [22] proposed a double-sample synchronous detection sensor based on up-core PCF, which could simultaneously detect double samples with an RI of 1.34–1.39 in the wavelength range from 550 nm to 900 nm. The maximum wavelength sensitivity could reach 8300 nm/RIU. In 2022, Hairui Fang et al. [23] designed a symmetrical dual-channel D-type PCF-SPR sensor that could simultaneously detect the analyte RI in two non-interference channels. This sensor could achieve an RI detection of 1.33–1.40 in the wavelength range of 500 nm to 1100 nm, with a maximum wavelength sensitivity of 14,000 nm/RIU. In 2023, Farhan Mumtaz et al. [24] proposed a windmill-shaped three-channel SPR sensor for simultaneous detection. The RI detection ranges of the channels were 1.30–1.34, 1.35–1.39, and 1.40–1.44, respectively. In the near-infrared region, the maximum wavelength sensitivities of the three channels were 3292 nm/RIU, 6664 nm/RIU, and 10,243 nm/RIU, respectively. In 2024, Mohd Fahmi Azman et al. [25] developed a dual-channel single-polarization PCF-SPR sensor. The maximum wavelength sensitivity of the sensor in two channels was 11,000 nm/RIU. In the 550–1100 nm band, the detection range of analyte RI was 1.33–1.41. However, the performance of these sensors is not remarkable. The two channels have the same RI detection range, and most of their resonance wavelengths are in the visible and near-infrared bands. Therefore, a sensor with high-wavelength sensitivity, wide RI detection range, and the ability to work in a wider wavelength band is needed.
In this paper, we propose a high-sensitivity, dual-channel, D-shape PCF-SPR RI sensor that can work in the ultra-wide wavelength range from near-infrared to mid-infrared. A large circular pore located in the middle of the fourth layer pores serves as a sensing channel. Another sensing channel is the polished D-shaped plane area. The two sensing channels can independently detect high- and low-RI analytes, or simultaneously detect two analytes with different RIs. The full-vector FEM is used to optimize the structure parameters of the sensor. The sensing characteristics of the optimized sensor are numerically simulated. The wavelength sensitivity, RI resolution, FWHM, FOM, and SNR of the sensor are calculated. The calculation results show that the sensor has an excellent sensing performance. The sensor has a maximum wavelength sensitivity of up to 30,000 nm/RIU in Channel 1 and 9900 nm/RIU in Channel 2, as well as excellent linearity. In addition, the sensor can achieve an ultra-wide RI detection range in the ultra-long wavelength range of 1500–3000 nm, with the RI detection range of 1.36–1.39 in Channel 1 and 1.46–1.57 in Channel 2.

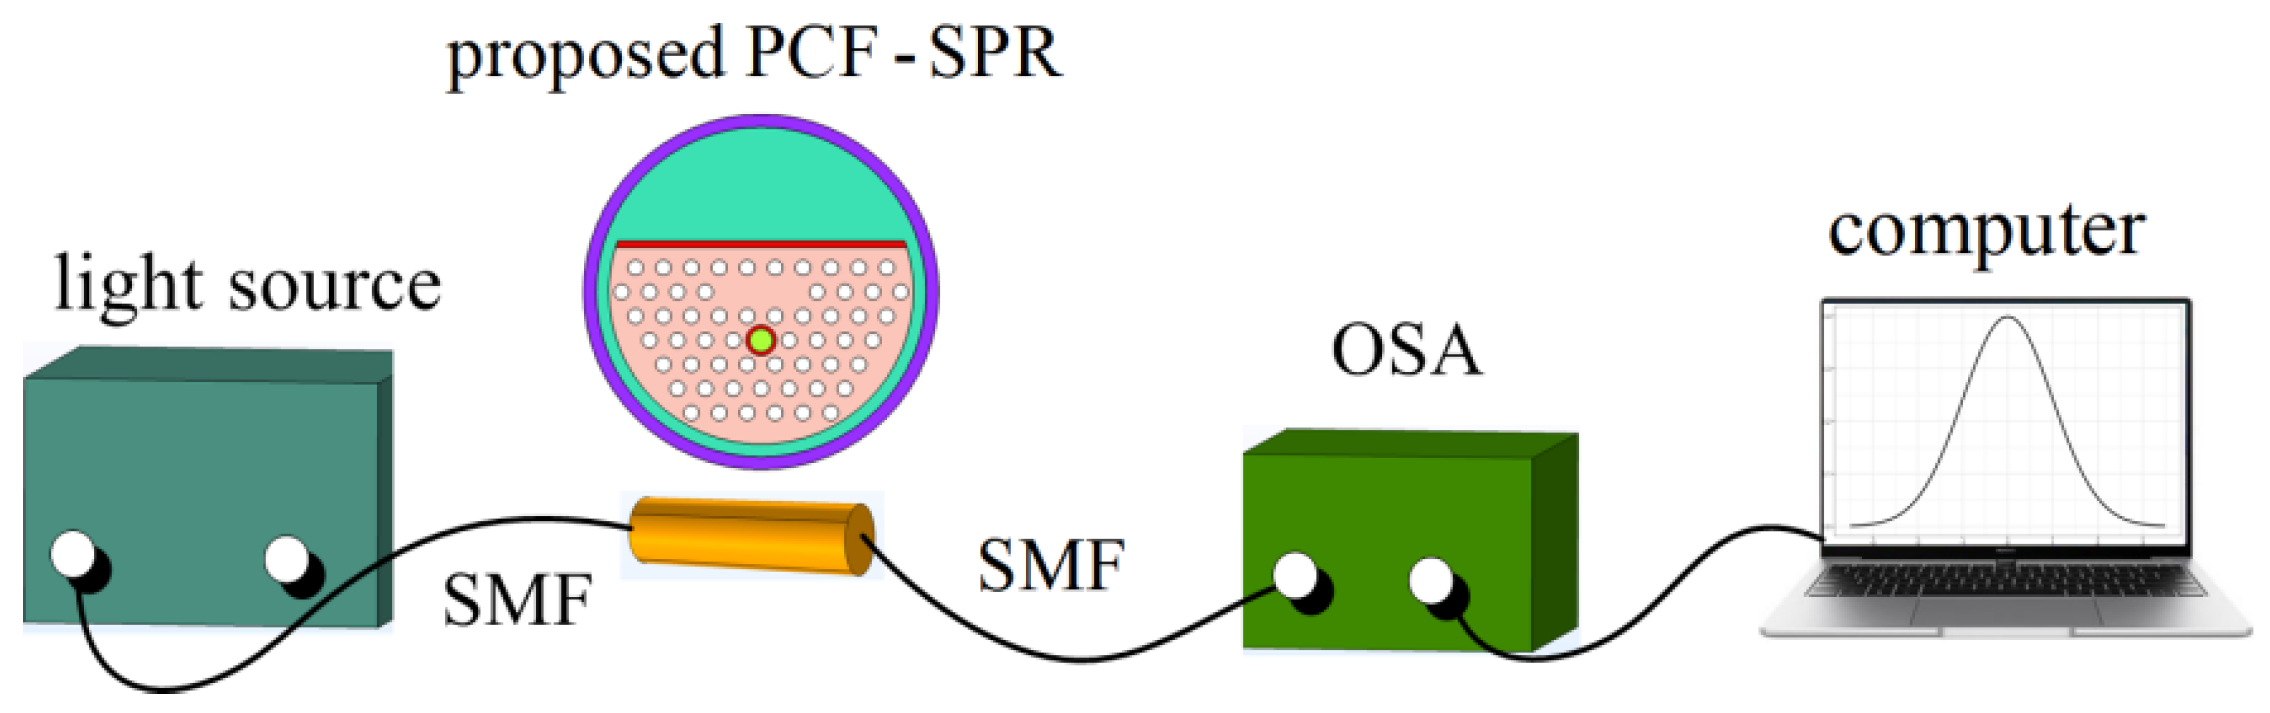
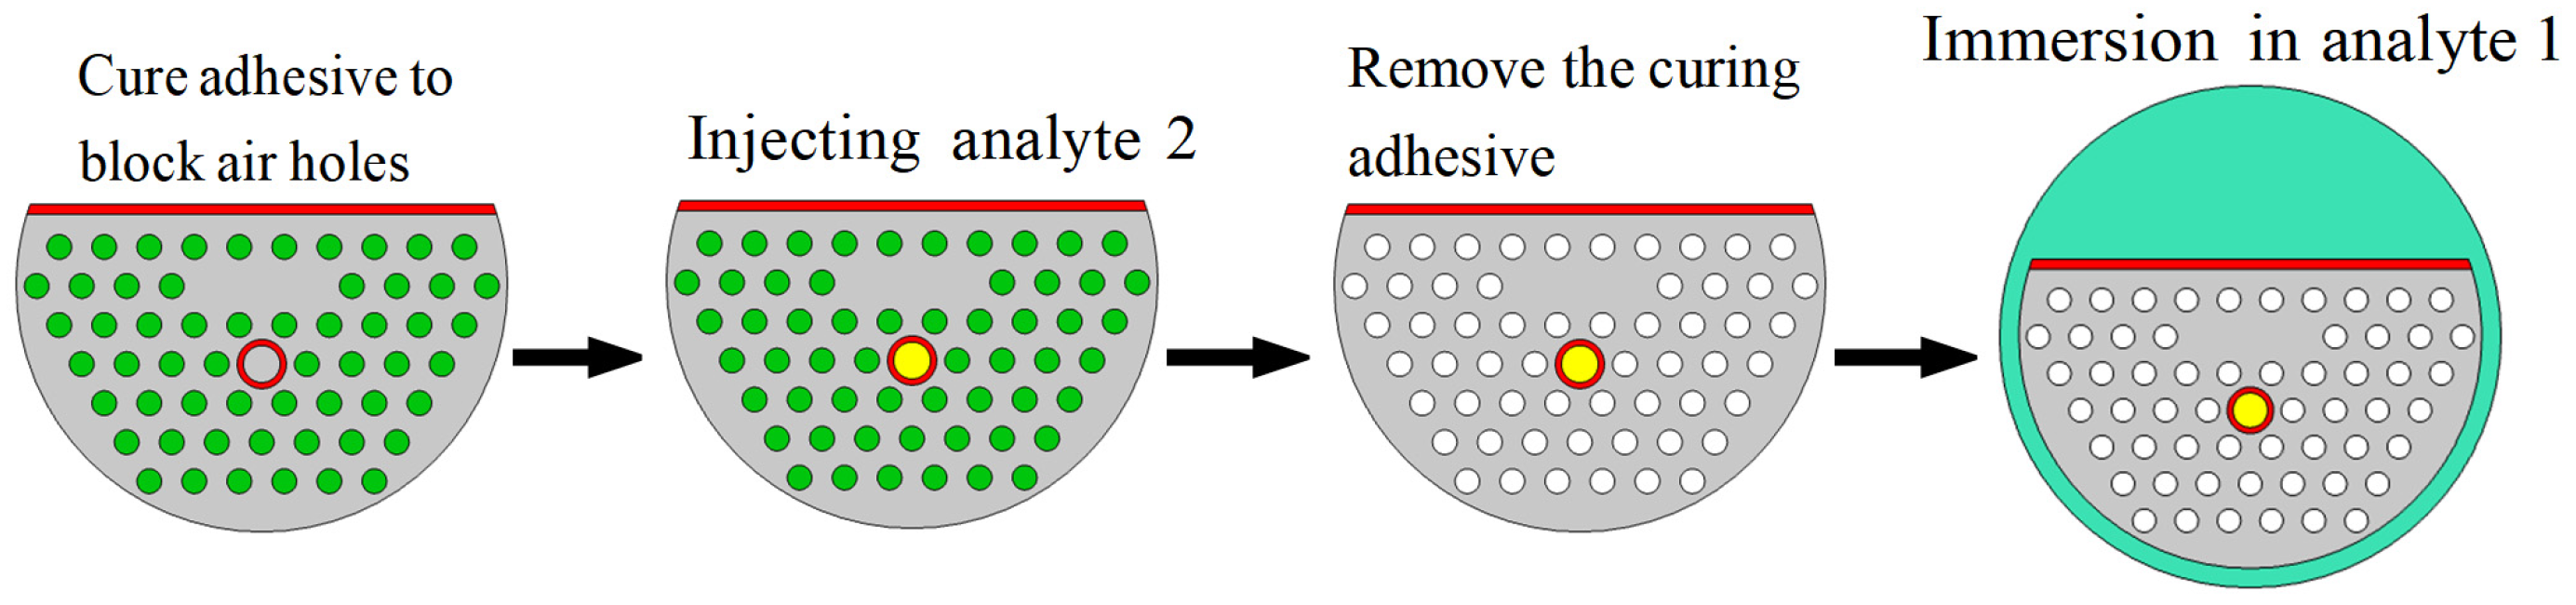
2. Structure Design and Theoretical Modeling

The cross-section of the D-type SPR dual-channel sensor based on PCF designed in this paper is shown in Figure 1. The PCF structure consists of five layers of circular air holes arranged in hexagons. The diameter of the air hole is d1. The lattice constant is Ʌ. The polished D-shaped structure on the upper side of the optical fiber is located h away from the core; that is, the polishing depth is h. This D-type PCF-SPR sensor has two sensing channels. Channel 1 is located in the D-shaped plane area outside the optical fiber, and the thickness of the sensing layer is c. In order to excite surface plasmons, a gold layer with a thickness of t1 is coated on the D-shaped plane. Channel 2 is a large circular air hole with a diameter of d2, which is located in the middle of the fourth layer air hole on the lower side of the core. The outer side of Channel 2 is coated with a layer of gold nanofilm with a thickness of t2 to promote the SPR effect. The RI of the analyte in Channel 1 is n1, and the RI of the analyte in Channel 2 is n2. In comparison to other geometric structures, the D-type PCF discussed in this paper is designed with common circular air holes and a symmetrical layout, making it simpler to manufacture. However, the metal plasma material in the D-shaped region is prone to oxidation when exposed to air, potentially affecting the sensor’s stability. To address this issue, gold, known for its stable chemical properties, has been chosen as the plasma material.
At present, the manufacturing technology of PCF and the metal-coating method are relatively mature, and the production process of the PCF-SPR sensor proposed in this paper can be divided into three steps. One is to draw a conventional circular PCF. There are many techniques for fabricating a conventional circular PCF, such as the stack-and-draw method [26], the sol–gel method [27], drilling [28], and extrusion [29]. Among them, the stack-and-draw technique has become the most important and commonly used method for producing PCF due to its simple operation, low cost, and strong flexibility. The sol–gel method proposed by El Hamzaoui et al. in 2012 can manufacture any PCF structure and can freely adjust the spacing, size, and shape of air holes. Therefore, the PCF and its air-hole structure can be fabricated by the stack-and-draw method or sol–gel method. Next, the desired D-type PCF can be fabricated by the side wheel grinding and polishing technology. The last step is to coat the two sensing channels with a layer of gold film. In previous studies [30,31,32,33], the technology of selectively coating air holes in microstructure optical fibers has been successfully demonstrated in experiments. The vapor-deposition method [33], high-pressure microfluidic chemical-deposition technology [32], and the magnetron-sputtering method [34] are widely used for metal coating. The vapor-deposition method is a common technology in metal-film coating. The high-pressure microfluidic chemical-deposition technology can achieve uniform, dense, and annular sediments in the PCF air holes. The magnetron-sputtering method is a type of Physical Vapor Deposition (PVD). It has the advantages of simple equipment, easy control, uniform coating, and strong adhesion. The air hole of the sensing Channel 2 can be coated by the high-pressure microfluidic chemical-deposition technology. The D-type plane of the sensing Channel 1 can be coated by the magnetron-sputtering method. The fabrication process of the PCF-SPR is shown in Figure 2.
Figure 3 shows the experimental setup for the practical realization of the PCF-SPR RI sensing. The light source produces broadband continuous spectrum and launches light into the single mode fiber (SMF). The SMF transmits the light to the PCF-SPR. In the process of interaction between light and analyte, part of the energy of the light signal is absorbed. The loss information is transmitted to an optical spectrum analyzer (OSA) through another SMF. Finally, the results of calculation and analysis are obtained by a computer.
Figure 4 describes the specific steps of dual-sample detection. Firstly, the air holes that do not need to be filled should be blocked with curing adhesive, and then the analyte 2 is filled into Channel 2 by the capillary-absorption phenomenon. Next, the section of the blocked PCF should be cut off to remove the curing adhesive. Finally, connect the PCF-SPR to the experimental setup illustrated in Figure 3 and submerge the D-type PCF in Analyte 1 for detection. In order to avoid polluting the analyte and ensure the cleanness of the sensing area, the sensor should be repeatedly cleaned with alcohol before and after each test.
In the simulation, we use FEM to conduct structural modeling and mode characteristic analysis through the analysis software COMSOL Multiphysics 5.5. In order to reduce the impact of electromagnetic wave reflection at the computational interface on the computational results, a perfectly matched layer (PML) is added to the outer periphery of the cladding to absorb incident electromagnetic waves. As shown in Figure 1, PML is a cylindrical surface with a thickness of 1000 nm, and the inner radius and outer radius are 12,000 nm and 13,000 nm, respectively. The RI of the material constituting the PML is set to 1.5. At the same time, the scattering boundary condition (SBC) is used to deal with the problem of energy reflection at the boundary. In this paper, free triangular meshes are used to discretize the whole solution domain due to the versatility and ease of control. The whole mesh contains 20,253 domain elements and 1946 boundary elements, with 251 vertex elements. The maximum cell size is 2600 nm, and the minimum cell size is 52 nm.
The background material of the PCF is fused quartz, and its material dispersion model is expressed by the Sellmeier equation [35], as follows:
n 2 λ = 1 + B 1 λ 2 λ 2 C 1 + B 2 λ 2 λ 2 C 2 + B 3 λ 2 λ 2 C 3
where n is the RI of fused quartz, λ is the working wavelength (in m), and Bi and Ci are the Sellmeier coefficients for i = 1, 2, 3. The values of Sellmeier Coefficients B1, B2, B3, C1, C2, and C3 are 0.6961663, 0.4079426, 0.8974794, 4.6791482 × 10⁻¹⁵ m2, 1.35120631 × 10⁻¹⁴ m2, and 9.79340025× 10⁻¹¹ m2, respectively. The dielectric constant of gold can be obtained through the Drude–Lorentz model [36,37]. The RI of the air in the air hole is 1. The confinement loss of the mode can be calculated by the following formula [38]:
α = 8.686 × 2 π λ × Im ( n e f f ) × 10 7 dB / cm
where λ is the wavelength of the incident light, the unit is nm, and Im (neff) is the imaginary part of the effective RI.

3. Simulation Results and Discussion

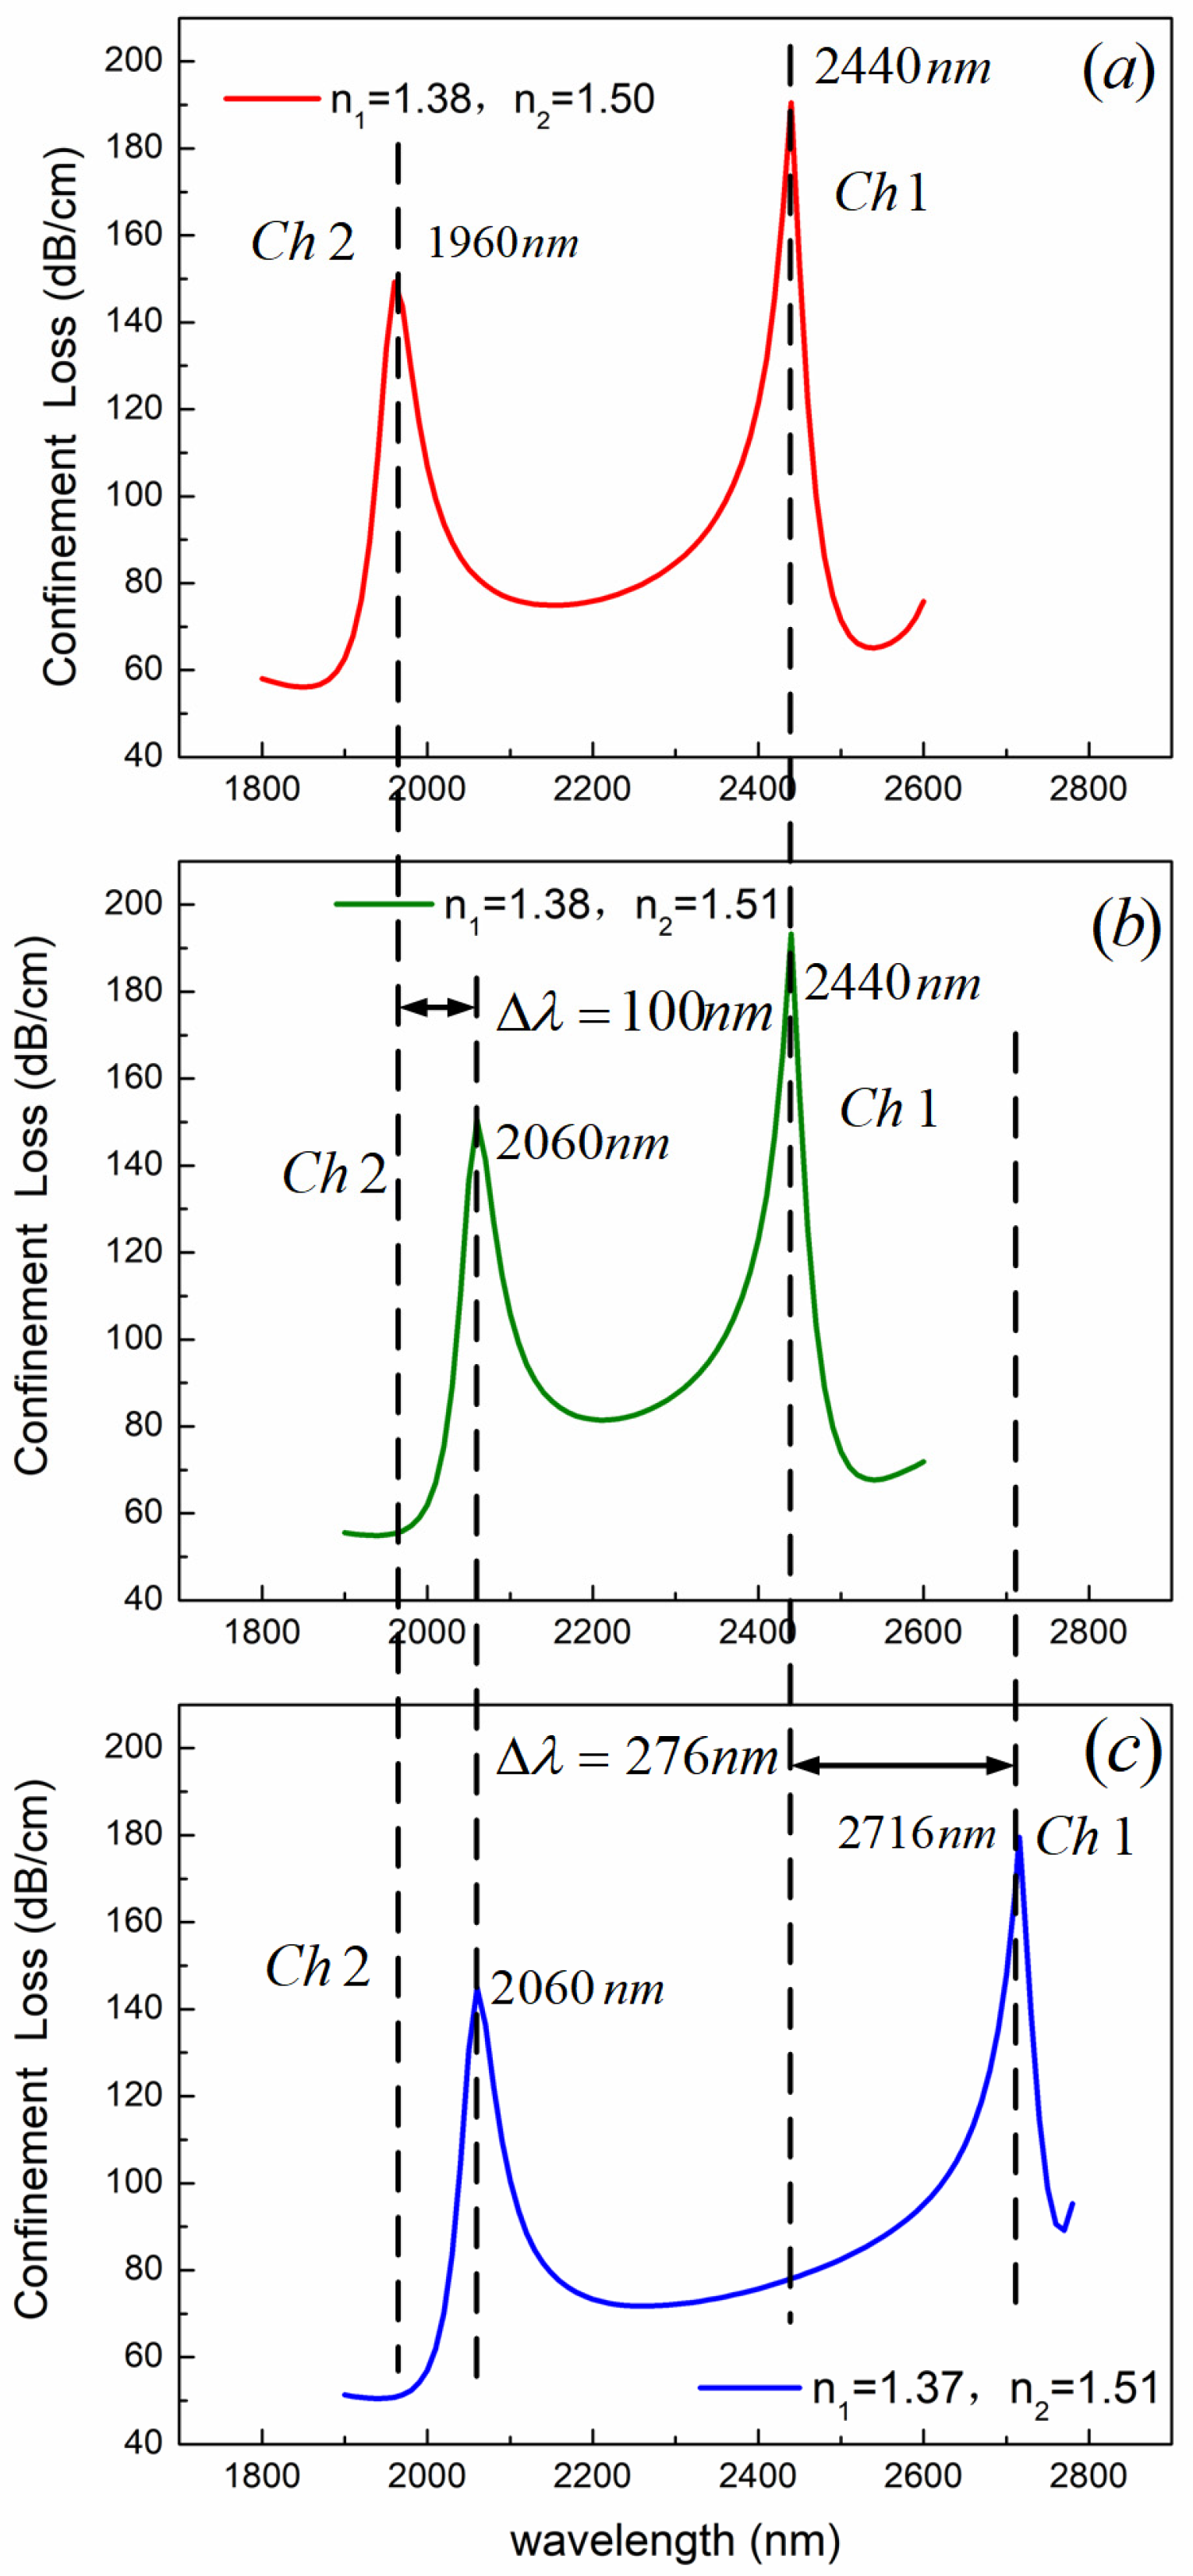
3.1. Mode Analysis of Photonic Crystal Fiber

In order to analyze the mode characteristics of the PCF-SPR sensor, we calculated the confinement loss and dispersion relations of the fundamental mode and surface plasmon polaritons (SPP) mode for two sensing channels. Since the sensing performance of the y polarization mode is better than that of x polarization mode, we only discuss the y polarization mode in this paper. The calculation results are shown in Figure 5 with the parameters d1 = 1080 nm, d2 = 2400 nm, Ʌ = 2000 nm, h = 2400 nm, c = 1000 nm, t1 = 50 nm, t2 = 60 nm, n1 = 1.38, and n2 = 1.51. The illustrations depict the electric field distribution corresponding to different wavelengths. As shown in Figure 5, the short wavelength segment on the left shows the mode characteristics of Channel 2, while the long wavelength segment on the right shows the mode characteristics of Channel 1. For Channel 2, the dispersion curves of the two modes have an intersection, which is called the phase-matching point. According to the illustrations of electric field distribution at Points a–f in the band far away from the phase-matching point, both the fundamental mode and the SPP mode are well confined to their respective regions. When approaching the phase-matching point, a small amount of energy is transferred between the two modes. The largest energy transfer occurs at the phase-matching point. This is called incomplete coupling. The coupling characteristics of the two modes in Channel 1 are different from those in Channel 2. At the h point with the wavelength of 2440 nm, the confinement losses of the fundamental mode and the SPP mode are equal, and the effective RI difference is the smallest. The phase-matching condition and loss-matching condition are satisfied at the same time. The energy is completely transferred between the two modes. At the h point, there is nearly the same electric field distribution for the fundamental mode and the SPP mode. This is called complete coupling.
The control-variable method is used to study the sensing performance of the two channels. Other structural parameters remain unchanged, as above. The shift of the resonance peak is shown in Figure 6 by changing the RI of analytes in Channel 1 and Channel 2, respectively. As shown in Figure 6, the left side is the resonance peak of Channel 2, and the right side is the resonance peak of Channel 1. When the analyte RI in Channel 1 remains unchanged and the analyte RI in Channel 2 changes from 1.50 to 1.51, the resonant wavelength of Channel 1 remains unchanged at 2440 nm, while the resonant wavelength of Channel 2 shifts by 100 nm. This indicates that the change in analyte RI of Channel 2 has no effect on the resonant wavelength of Channel 1. When the RI of the analyte in Channel 2 remains unchanged, and the RI of the analyte in Channel 1 changes from 1.37 to 1.38, the resonant wavelength of Channel 1 shifts by 276 nm, while the resonant wavelength of Channel 2 remains unchanged at 2060 nm. This indicates that the change in RI of the analyte in Channel 1 has no effect on the resonant wavelength of Channel 2. The above results show that the two sensing channels will not affect each other. The two sensing channels are independent of each other and can simultaneously measure two analytes with different RIs.

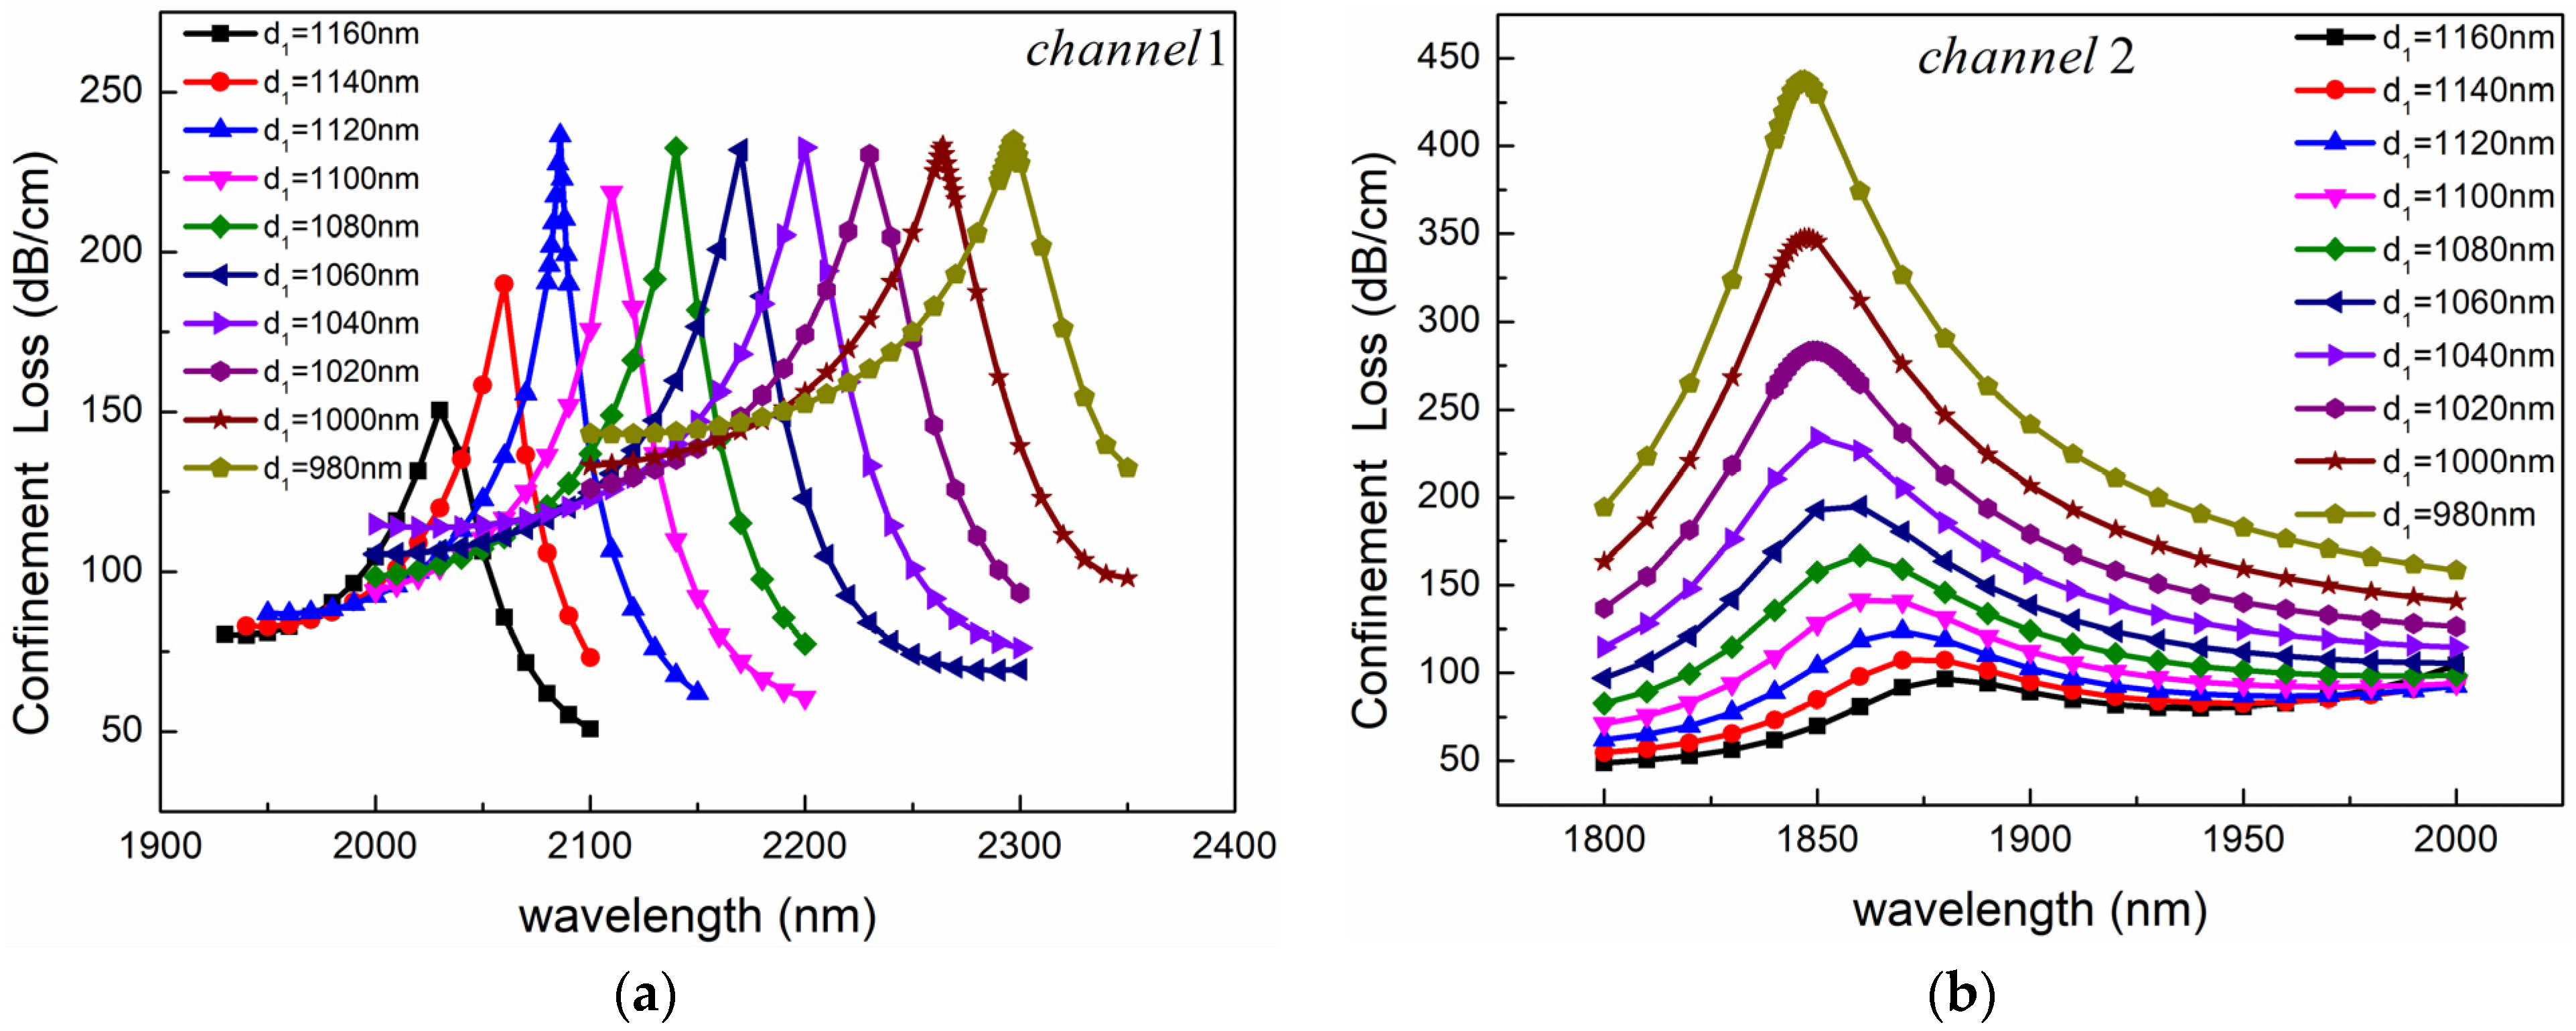
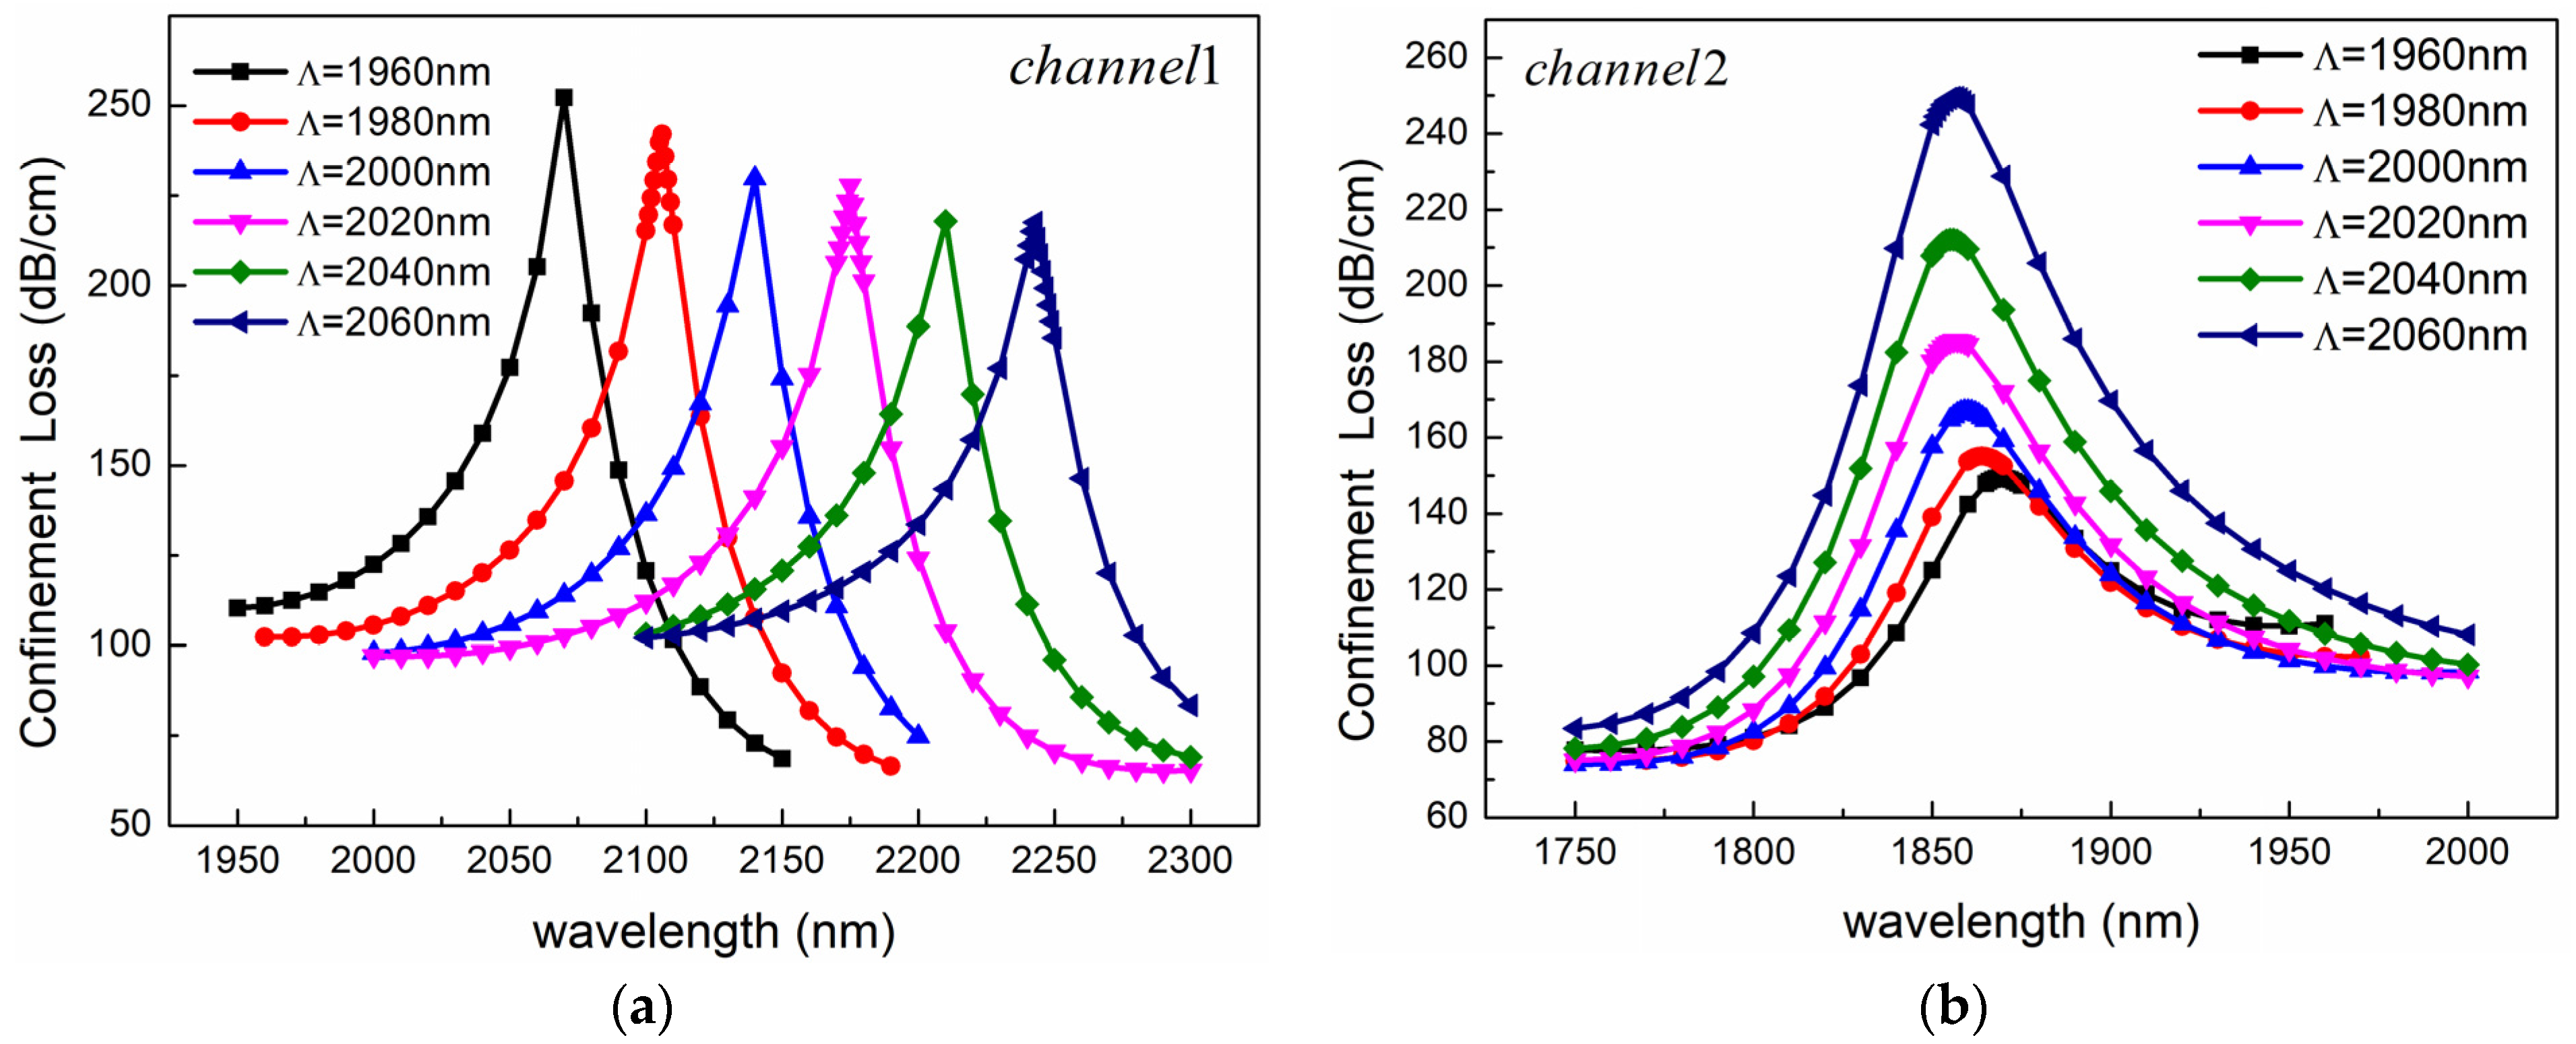
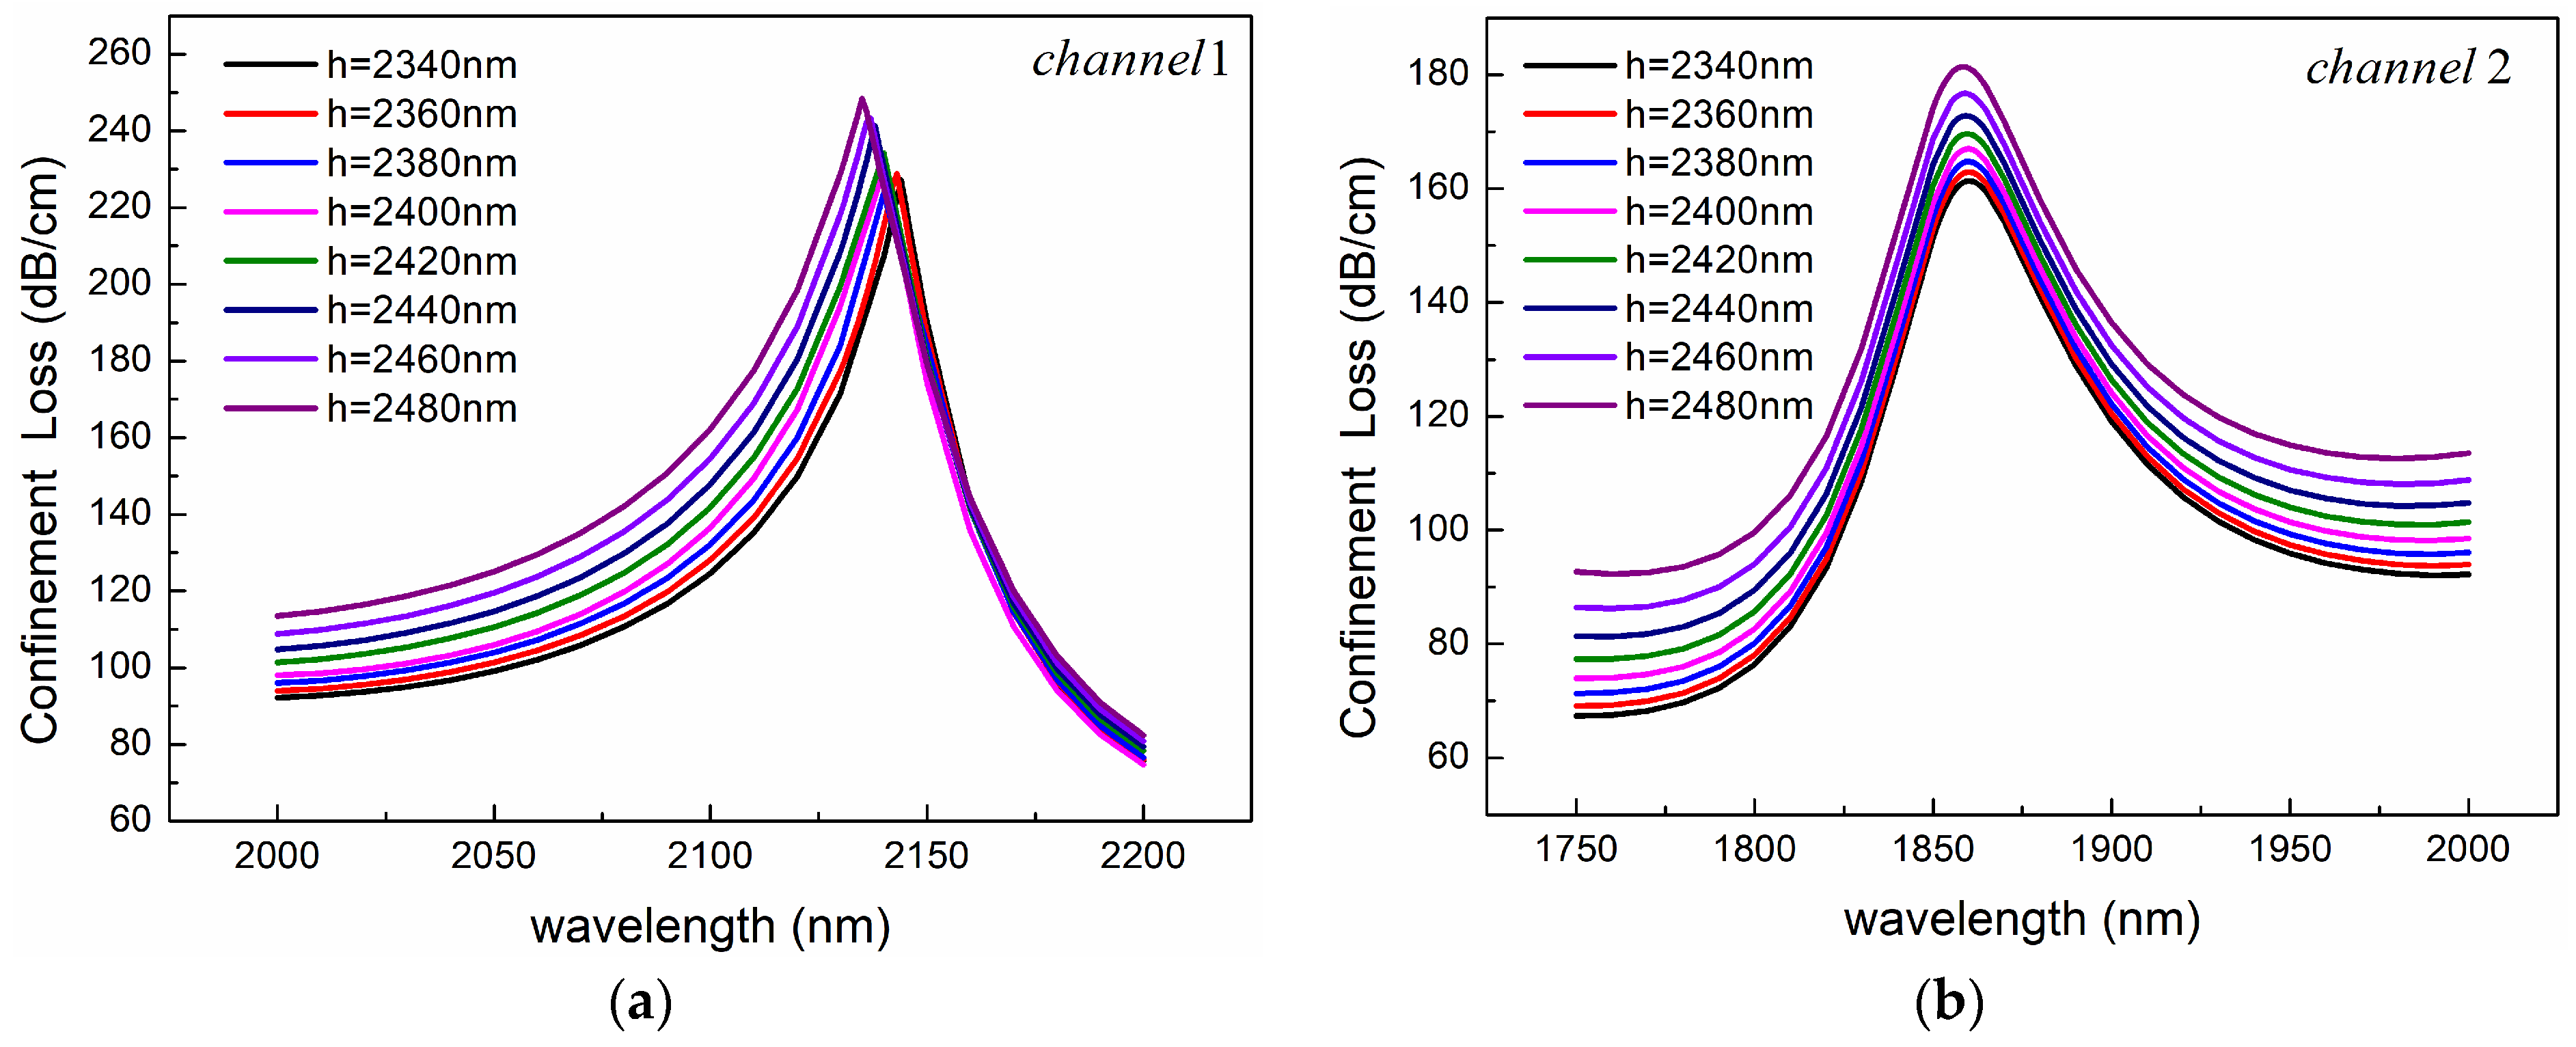
3.2. Effect of Structural Parameters on Sensing Performance

The optimization of structural parameters is crucial for the stability and effective sensing response of sensors. Typically, confinement loss is one of the best parameters for considering the performance of PCF-SPR sensors, so confinement loss is selected as the sensing parameter in this study to optimize structural parameters and evaluate sensing performance. The following discusses the influence of structural parameters on sensor performance. By optimizing parameters, the sensing performance can be optimized.
Firstly, the influence of air-hole diameter on sensing performance was analyzed. With other parameters fixed, the confinement loss of the fundamental mode was calculated when the air-hole diameter increased from 980 nm to 1160 nm. The results are shown in Figure 7. As can be seen from Figure 7, the influence of the air-hole diameter on the sensing performance of the two channels is completely different. As shown in Figure 7a, with the increase of d1, the resonance peak of Channel 1 shows a blue shift, and the spectral width of the peak first decreases and then increases. When d1 is less than 1120 nm, the peak value is almost unchanged, and when d1 is greater than 1120 nm, the peak value decreases significantly. This is because, with the increase of the diameter of the air hole, the effective RI of the mode changes, and the phase-matching point moves to the short wavelength direction. The situation of Channel 2 is different from that of Channel 1, as shown in Figure 7b. As d1 decreases, the position of the resonance peak remains almost unchanged, while the peak value gradually increases. This is because the decrease in air holes promotes the generation of SPR effects in the optical fiber, resulting in an increase in the mode field around the gold nanolayer and an increase in confinement loss.
The effect of hole spacing on sensing performance is also considerable. We calculated the change of confinement loss when the hole spacing Λ increased from 1960 nm to 2060 nm, and other parameters remained unchanged. As shown in Figure 8, with the increase of hole spacing, the fiber core loss of Channel 1 decreases, while that of Channel 2 increases, indicating that the change of hole spacing has the opposite effect on the peak value of the two channels. In addition, with the increase of hole spacing, the resonant wavelength in Channel 1 is red-shifted, while the position of the resonant wavelength in Channel 2 is almost unchanged. Therefore, the change of hole spacing changes the phase-matching point in Channel 1 but has no effect on the phase-matching point in Channel 2.
Figure 9 depicts the effect of sensing Channel 2 diameter on sensing performance. As shown in Figure 9a, the change of the diameter of the sensing channel 2 has little effect on the resonant peak of Channel 1. Only with the increase of the diameter of Sensing Channel 2, the spectral width of the resonant peak gradually decreases. It can be seen from Figure 9b that the change in the diameter of Sensing Channel 2 has a more obvious impact on Channel 2. With the increase of the diameter of Channel 2, the resonance peak decreases significantly, and the resonance wavelength moves to the long wavelength direction. This indicates that the change of Channel 2’s diameter causes the change of effective RI of the modes. Moreover, the larger diameter of Channel 2 makes the core mold well confined in the core area, and the energy leakage is reduced.
The polishing depth determines the distance between the core and the plasma material, so it affects the coupling efficiency between the core mode and the SPP mode. As shown in Figure 10a, with the increase of polishing depth, the resonance peak value of Channel 1 slightly increases, the resonance wavelength shifts slightly to the blue, and the waveform becomes wider. For Channel 2, the increase of polishing depth only changes the height of the resonance peak but does not change the position of the resonance wavelength, as shown in Figure 10b.
Figure 11a shows the effect of the gold-layer thickness t1 on the loss spectrum of channel 1. With the increase of gold-film thickness t1, the loss spectrum shows a significant redshift. The reason is that the increase in the thickness of the gold layer reduces the effective RI of the SPP mode, while the effective RI of the core mode is almost unchanged so that the phase-matching point moves towards the long-wave direction. In addition, Figure 11a,b both show that the resonance peak decreases with the increase of the thickness of the gold layer. As we all know, when the thickness of the gold film becomes larger, the evanescent wave excited by the evanescent field is more difficult to pass through the metal layer, resulting in the reduction of coupling efficiency and resonance strength.
The influence of the gold-layer thickness of Channel 2 on the sensing performance of the two channels is shown in Figure 12. As shown in Figure 12a, the thickness of the gold layer has little effect on the resonance peak of Channel 1, only changing the width of the peak. Compared with Channel 1, the effect of gold-layer thickness on Channel 2 is more significant as shown in Figure 12b. In Channel 2, the dispersion curve of the SPP mode is steeper than that of the fundamental mode. Therefore, as the thickness of the gold layer increases, the RI of the SPP mode gradually decreases, while the RI of the fundamental mode remains almost unchanged, resulting in a blue shift in the resonant wavelength. At the same time, as the thickness of the gold layer increases, the resonance peak gradually decreases due to the increased difficulty of evanescent waves passing through the gold layer.
The above calculation and analysis show that the influence of fiber-structure parameters on the loss curves of the two channels is different, even opposite. This can be observed from the impact of changes in parameters on wavelength sensitivity in Figure 13. Furthermore, simulation results vary depending on the specific parameter combinations. We determine the RI detection range of the two channels according to the characteristics of the loss curves. Considering the impact of structural parameters on the FWHM of the loss curve, the RI detection range of the two channels, and the sensitivity, we choose d1 = 1080 nm, d2 = 2400 nm, Ʌ = 2000 nm, h = 2400 nm, t1 = 50 nm, t2 = 56 nm, and c = 1000 nm as the optimal parameters for the simulation.
In the process of drawing optical fibers, there will be unavoidable variations of 1% to 2% in the diameter of the air holes (d1), Channel 2 diameter (d2), polishing depth (h), and thickness of the gold film (t1, t2) [39]. These variations must be considered. Figure 13 shows the impact of these deviations on wavelength sensitivity based on optimized structural parameters. It has been observed that within the manufacturing deviation range of ±2%, the resonant wavelength of the sensor drifts slightly due to the deviation, but the overall trend changes minimally. This means that the impact on the wavelength sensitivity is small. It is evident that the sensor exhibits stable sensing performances.

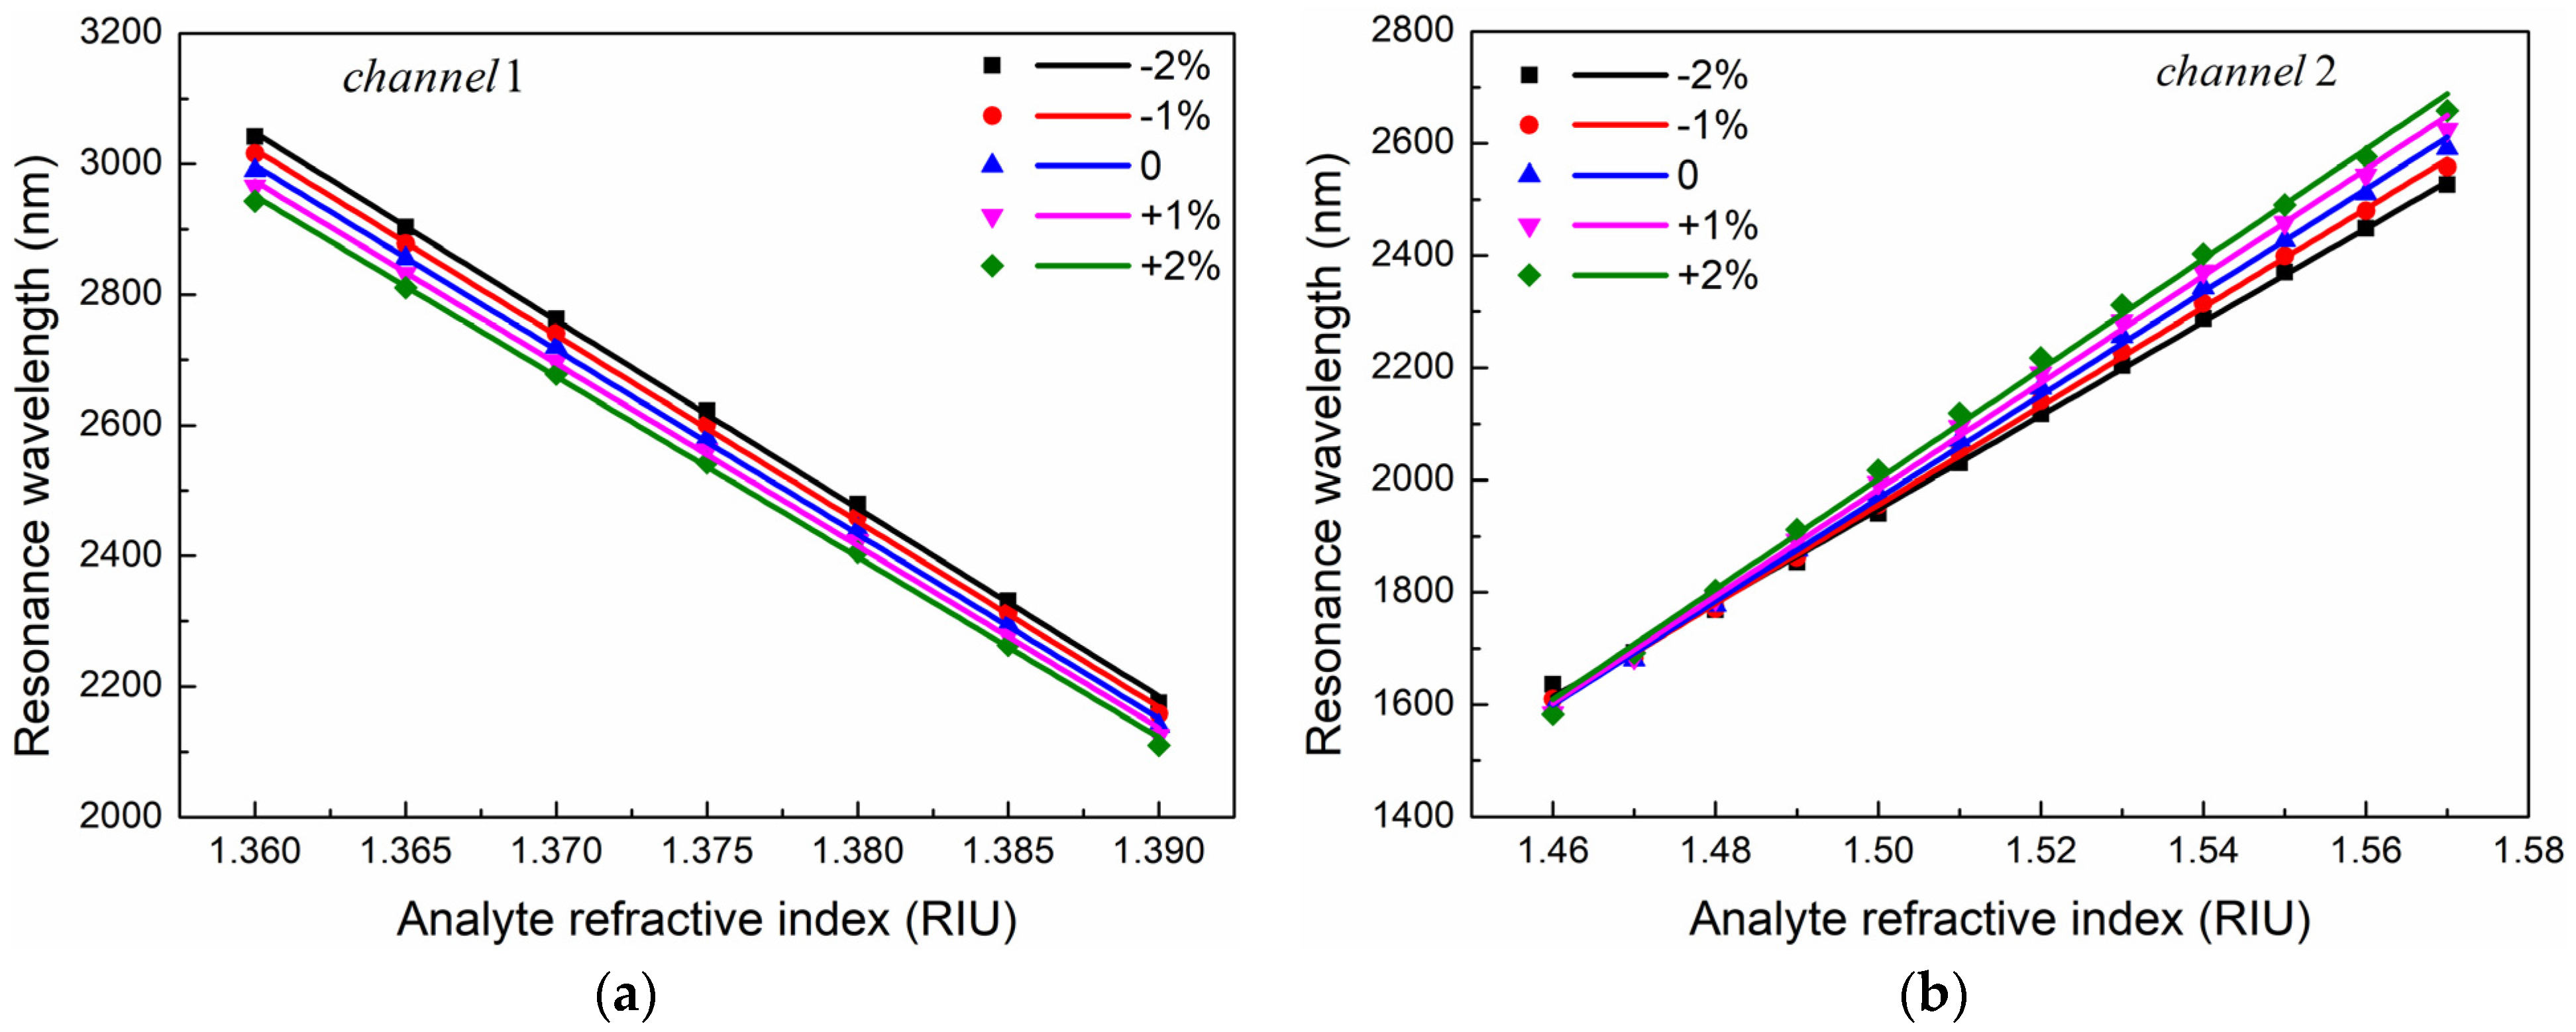
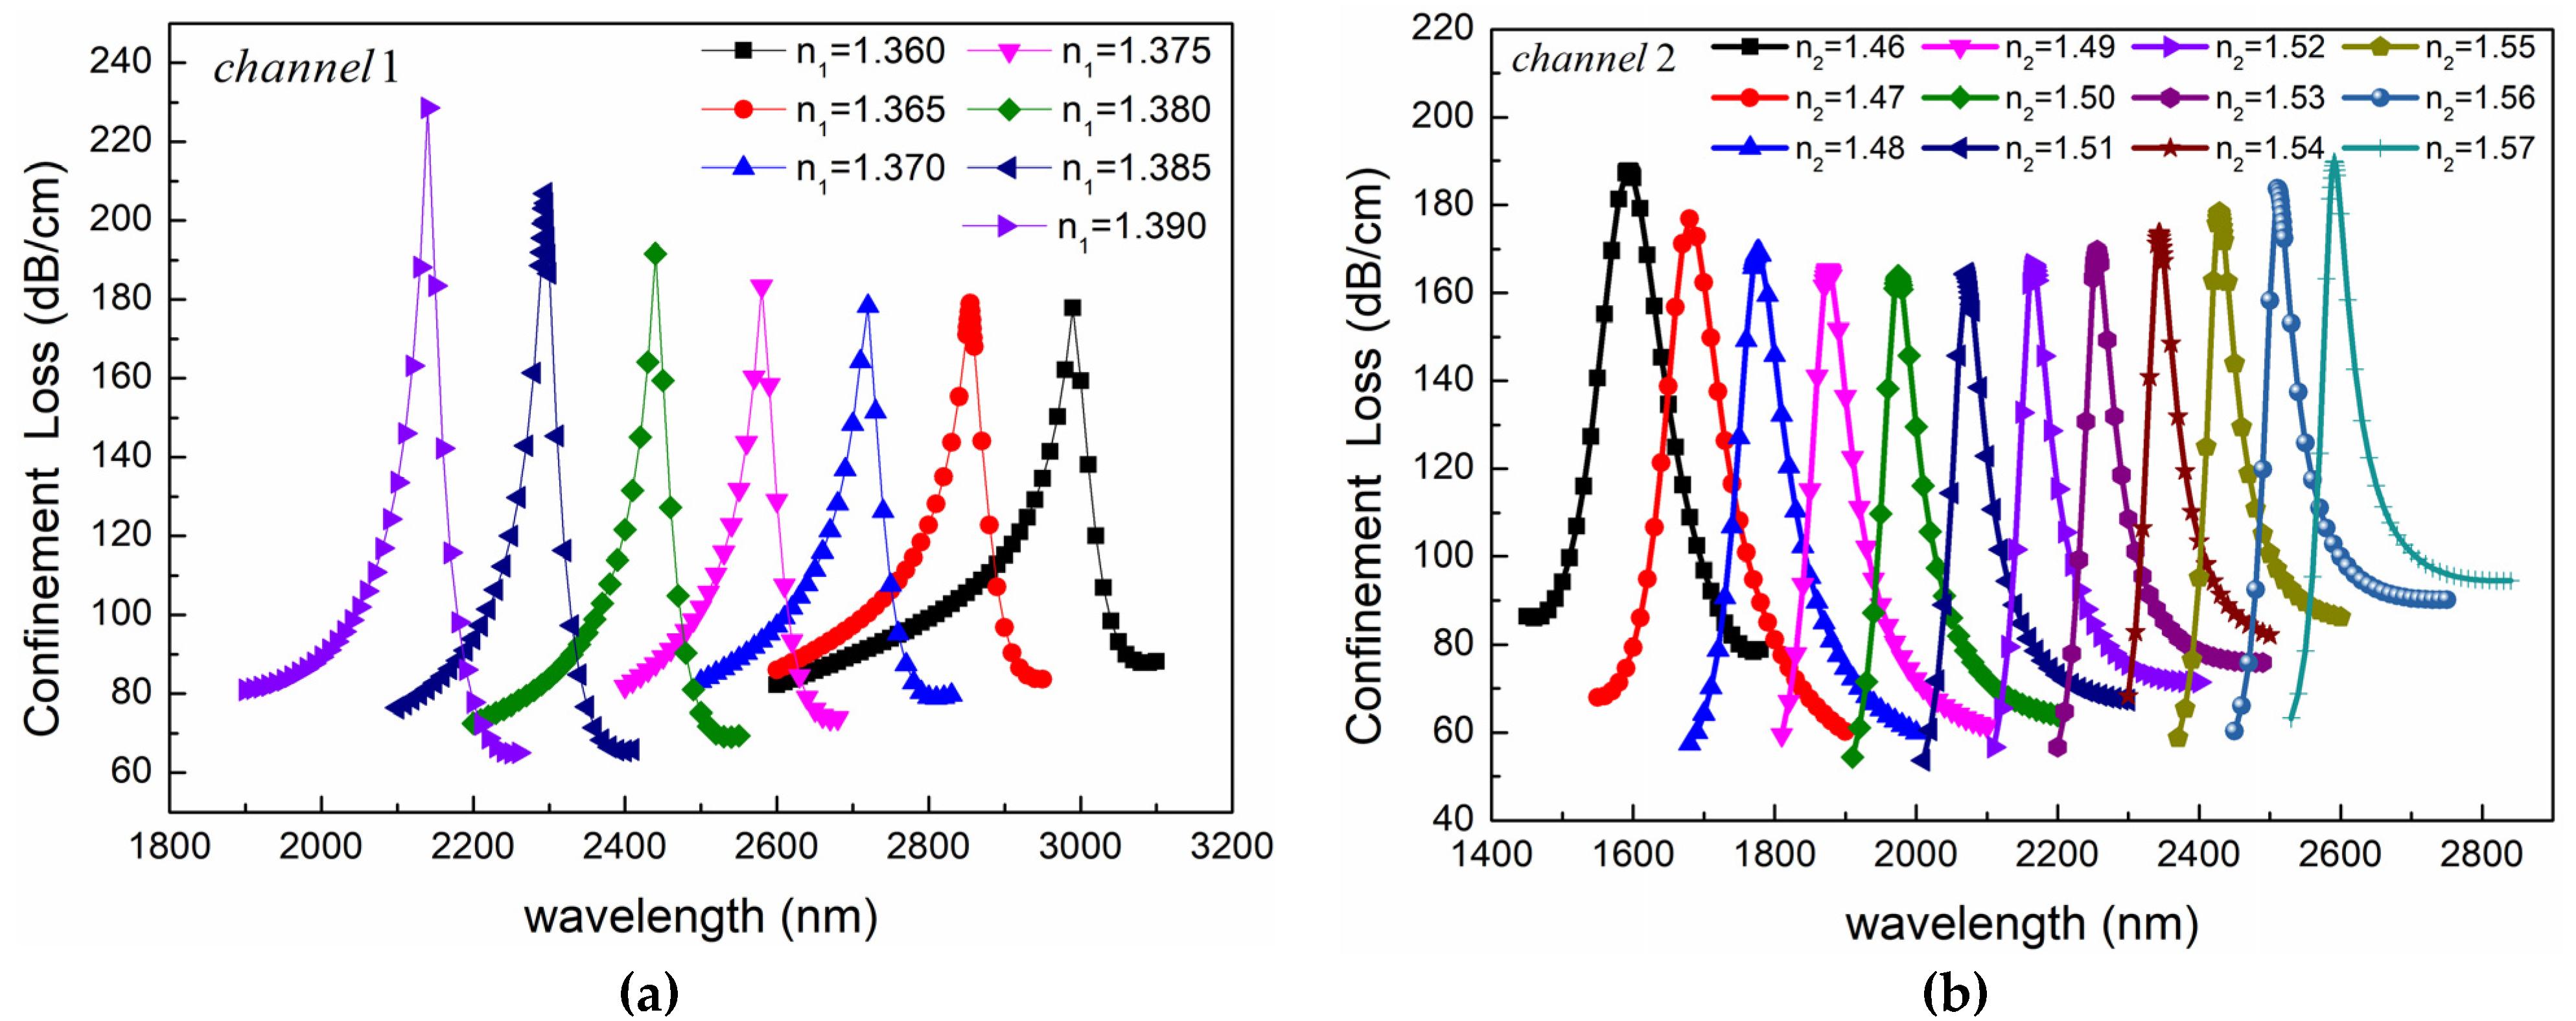
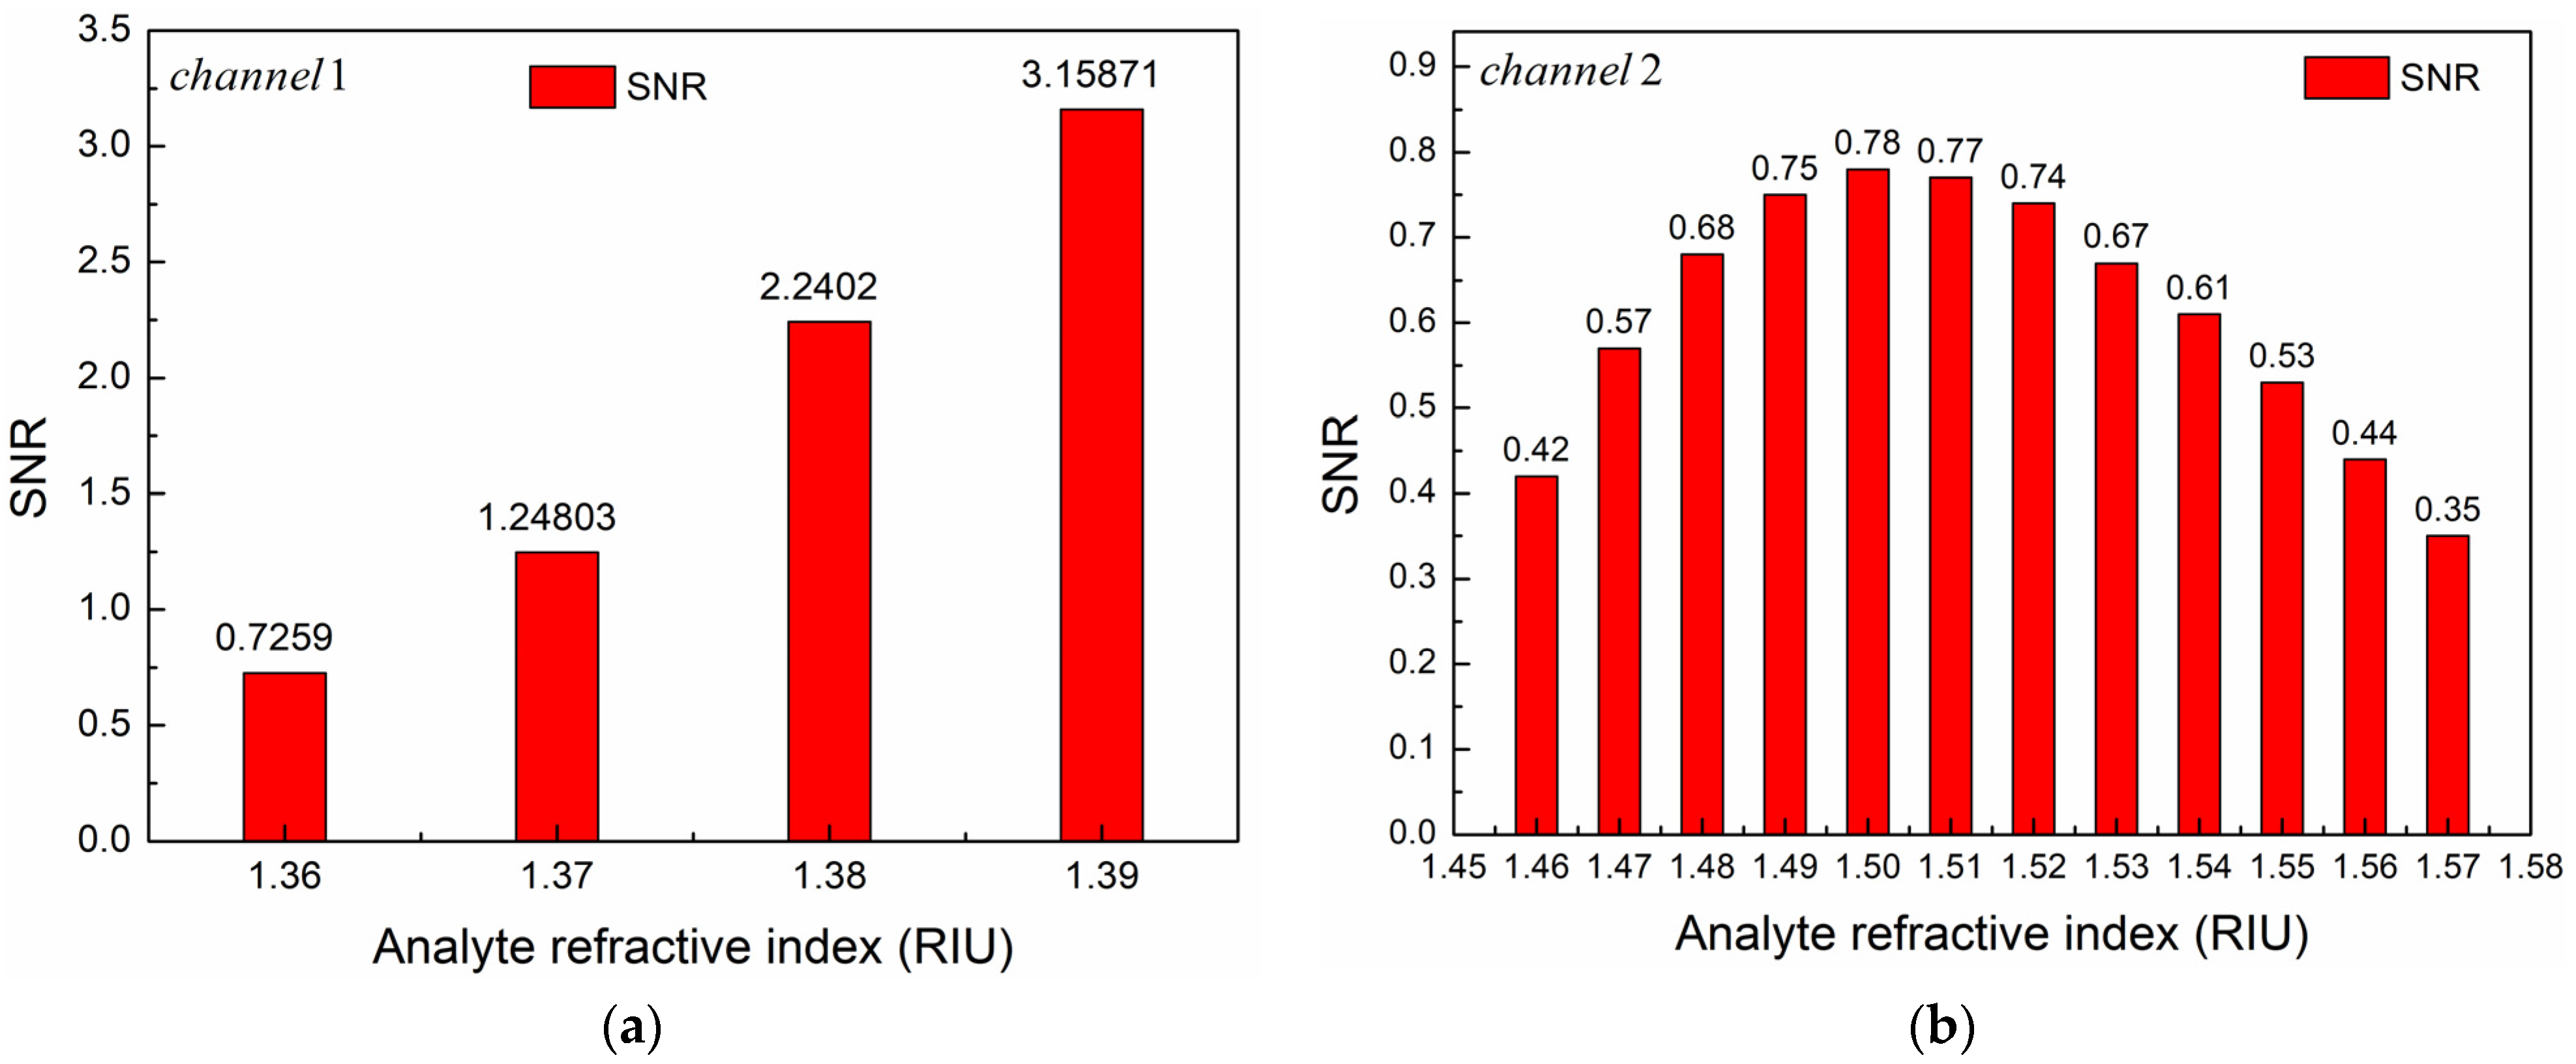
3.3. Performance Analysis

The basic principle of the PCF-SPR RI sensor is based on the interaction between the core mode and the SPP mode. When the real parts of effective RI of the core mode and the SPP mode are equal, the phase-matching condition is met and strong coupling between the two modes occurs. The energy of the core mode is transferred to the SPP mode, forming the SPR effect. The loss curve of the core mode shows a peak. This resonant absorption peak is very sensitive to changes in the RI of the analyte. Therefore, it can be used to measure the RI of analytes.
First, we calculated the sensing characteristics of Channel 1. In the simulation, it was considered that Channel 2 was not filled and could be regarded as a large pore. We calculated the relationship between the confinement loss and wavelength by changing the RI of the analyte in Channel 1 with the structural parameters of the fiber unchanged. The results show that the loss peak has good characteristics when the RI of the analyte in Channel 1 is in the range of 1.36–1.39. The simulation results are shown in Figure 14a. Because the dispersion curve of the fundamental mode is steeper than that of the SPP mode in channel 1, and as the RI of the analyte increases, the RI of the SPP mode increases. While the RI of the fundamental mode remains almost unchanged, the phase-matching point will shift towards shorter wavelengths as the RI of the analyte increases, resulting in a blue shift, as shown in Figure 14a. In addition, with the increase of the RI of the analyte, the loss peak increases significantly, indicating that the higher RI of the analyte enhances the resonance between the fundamental mode and the SPP mode.
Next, we studied the sensing characteristics of Channel 2. At this time, we assumed that the analyte in Channel 1 was air, and other structural parameters remained unchanged. We calculated the variation of the resonance peak with the RI of the analyte in Channel 2, as shown in Figure 14b. The simulation results show that the resonance peak has excellent characteristics when the RI of the analyte in Channel 2 is in the range of 1.46–1.57. Unlike Channel 1, in Channel 2, the dispersion curve of the fundamental mode is flatter than that of the SPP mode. When the RI of the analyte in Channel 2 increases, the RI of the SPP mode increases, while the RI of the fundamental mode is basically unchanged. Therefore, the intersection of the dispersion curves of the two modes will move towards the long wave direction. The resonance wavelength is red-shifted. In addition, as the RI of the analyte increases, the loss peak first decreases and then increases.
According to the above analysis, when the analyte RI in one of the two channels is fixed to 1, the other can be used as an independent detection channel and can be used alone. When Channel 1 is used independently, it can be used as a low-RI detection channel with an RI detection range of 1.36–1.39 in the wave band of 2100–3000 nm. Similarly, when Channel 2 is used independently, it can be used as a high-RI detection channel with an RI detection range of 1.46–1.57 in the wave band of 1500–2600 nm. In addition, the two sensing channels can also detect two analytes with different RIs at the same time. Since the resonance peaks of the two channels overlap within the detection range, the detection range will be reduced when detecting simultaneously compared with independent detection. For example, if the detection range of Channel 1 remains 1.36–1.39, the detection range of Channel 2 will be reduced to 1.46–1.51.
Wavelength sensitivity is defined as the rate of change in resonant wavelength relative to RI and is an important parameter for evaluating sensor performance. Wavelength sensitivity can be calculated by the following formula [11].
S λ λ = λ / n n m / R I U
where λ is the change of resonance wavelength caused by the change of analyte RI, and n is the change of analyte RI. Obviously, the slope of the fitting curve obtained by fitting the scatter diagram of resonance wavelength varying with RI is the wavelength sensitivity of the sensor. We fitted the relationship between resonance wavelength and analyte RI of the two channels, and the fitting results are shown in Figure 15. It can be seen that there is a good linear relationship between the resonant wavelength and the RI of the analyte in both channels. The linear fitting equation and the adjusted R-square (ARS) values of the two channels are as follows:
λ 1 = 28214.286 n 1 + 41368.939 ,   1.36 n 1 1.39 ,   A R S 1 = 0.99938
λ 2 = 9190.90909 n 2 11818.72727 ,   1.46 n 2 1.57 ,   A R S 2 = 0.99882
where λ 1 and λ 2 , respectively, represent the resonance wavelength of Channel 1 and Channel 2, and n 1 and n 2 are the RIs of the analytes in Channel 1 and Channel 2, respectively. Obviously, the slope of the linear fitting curve represents the average wavelength sensitivity of the sensor. According to the fitting results in Figure 15a, when n1 changes from 1.36 to 1.39, the average wavelength sensitivity in Channel 1 is 28,214.286 nm/RIU. The maximum wavelength sensitivity of Channel 1 is up to 30,000 nm/RIU, which appears near n 1 = 1.38. As shown in Figure 15b, when the RI of the analyte in Channel 2 increases from 1.46 to 1.57, the average wavelength sensitivity of Channel 2 is 9190.90909 nm/RIU. The maximum wavelength sensitivity of Channel 2 can reach 9900 nm/RIU when n 2 = 1.49.
The RI resolution of the sensor is also an important parameter to evaluate the performance of the sensor, which determines the ability of the sensor to recognize small alterations in analyte RI. The RI resolution of the sensor can be calculated by the following formula [11]:
R = n × λ min / λ R I U
where λ m i n is the wavelength resolution of the instrument used. If a spectrometer with the optimal wavelength resolution of 0.1 nm is used (such as Yokogawa AQ6376 fiber spectrometer), the RI resolution of the sensor can reach 3.54 × 10⁻⁶ RIU in Channel 1 and 10.88 × 10⁻⁶ RIU in Channel 2, respectively.
The FOM and FWHM are important parameters for measuring the performance of sensors. FWHM is the wavelength band corresponding to 1/2 of the height of the loss peak. The smaller the FWHM, the smaller the transmission loss of the sensor in the non-resonant wavelength range. FOM is defined as the ratio of wavelength sensitivity to FWHM. Generally, in order to ensure that the PCF-SPR sensor has a higher FOM, it is necessary to improve the wavelength sensitivity, and the FWHM value should be as low as possible. FOM can be calculated using the following equation [11]:
F O M = S λ F W H M
where S λ is the wavelength sensitivity of the sensor.
In this paper, the FWHM and FOM of the two sensing channels are calculated, respectively, as shown in Figure 16. It can be seen from Figure 16a that in Channel 1, FOM increases with the increase of analyte RI, while FWHM has the opposite trend. When n1 = 1.39, FOM reaches the maximum value of 315.87. In Channel 2, as the RI of the analyte increases, the FOM increases first and then decreases, reaching the maximum value of 77.87 at n2 = 1.50. FWHM has a trend opposite to FOM as shown in Figure 16b.
In addition to wavelength sensitivity, RI resolution, FWHM, and FOM, SNR is also an important indicator for evaluating the performance of the PCF-SPR sensor. The higher the SNR, the higher the accuracy of the sensor measurement. The calculation formula of the SNR is as follows [40]:
S N R = Δ λ R F W H M
where Δ λ R is the difference between resonance wavelengths corresponding to two adjacent RIs.
Figure 17 depicts the relationship between SNR and RI of the analyte in two channels. According to Figure 17a, in Channel 1, the SNR gradually increases with the increase of the analyte RI. When n 1 = 1.39, the SNR reaches the maximum value of 3.15871. For Channel 2, as the RI of the analyte increases, the SNR first increases and then decreases. At n 2 = 1.50, the SNR reaches the maximum value of 0.78, as shown in Figure 17b. Obviously, the SNR and FOM have the same trend of change.
Table 1 shows the comparison between our proposed dual-channel PCF-SPR RI sensor and the previously reported sensors in the literature [41,42,43,44,45,46]. Obviously, the sensor proposed in this paper has excellent performance in the RI detection range, operation wavelength, average wavelength sensitivity, and RI resolution, as shown in Table 1. The vast majority of previously reported sensors have the same RI measurement range for both channels, and the range is relatively narrow. The sensor proposed in this paper has two channels with different RI measurement ranges: 1.36–1.39 and 1.46–1.57. This setup allows for an independent detection of analytes with varying RI levels and simultaneous detection of two analytes with different RI. The large RI measurement range increases the application prospect of the sensor. The previously reported PCF-SPR sensor can only work in visible light and near-infrared bands. It rarely works in the mid-infrared band, and the working wavelength range is narrow. The sensor proposed in this paper can operate in the ultra-wide wavelength range of 1500–3000 nm, which means that the sensor can work simultaneously in the near-infrared and mid-infrared regions. Compared with the visible light band, the near-infrared and mid-infrared bands have unique advantages [47,48] as the working wavelengths of PCF-SPR sensors. Sensors operating in the near-infrared and mid-infrared bands can avoid light damage and phototoxicity to biological materials [49,50]. In addition, the penetration depth of evanescent waves is directly proportional to the working wavelength. Compared with visible light, the penetration depth of evanescent waves in the near-infrared and mid-infrared bands is deeper, which can improve the detection sensitivity of sensors for biological macromolecular targets [51,52]. Therefore, the sensor proposed in this paper has significant advantages and broad application prospects.

4. Conclusions

In this paper, a novel dual-channel PCF-SPR RI sensor is proposed. The structural parameters and sensing characteristics are studied by full-vector FEM. The calculation results show that the dual-channel sensor can achieve high-sensitivity synchronous detection of analytes with different RIs in the ultra-long band from near-infrared to mid-infrared. When Channel 1 is used independently, it can be used as a low-RI detection channel, with an RI detection range of 1.36–1.39 in the wave band of 2100–3000 nm. Similarly, when Channel 2 is used independently, it can be used as a high-RI detection channel, with an RI detection range of 1.46–1.57 in the wave band of 1500–2600 nm. In addition, the two sensing channels can also detect two analytes with different RI at the same time. The average wavelength sensitivity of the sensor is 28,214.286 nm/RIU in Channel 1 and 9190.9 nm/RIU in Channel 2, respectively. The maximum wavelength sensitivity is up to 30,000 nm/RIU in Channel 1 and 9900 nm/RIU in Channel 2. The RI resolutions of the two channels are 3.54 × 10⁻⁶ RIU and 10.88 × 10⁻⁶ RIU, respectively. In conclusion, the proposed sensor achieves an ultra-wide detection range for RI and high sensitivity in the ultra-long band from near-infrared to mid-infrared. The sensor has considerable sensing performance and broad application prospects, which provides a theoretical reference for the design of dual-channel RI sensors.

Author Contributions

Conceptualization, investigation, resources and validation, F.W.; methodology and software and data curation, Y.W.; writing—original draft preparation and formal analysis, Y.H. All authors have read and agreed to the published version of the manuscript.

Funding

This work was supported by Hebei Natural Science Foundation, China (Grant No. B2024203009, No. B2022203023), the Innovation Capability Improvement Project of Hebei province (No. 22567605H).

Institutional Review Board Statement

Not applicable.

Informed Consent Statement

Not applicable.

Data Availability Statement

Data are contained within the article.

Conflicts of Interest

The authors declare no conflicts of interest.

References

  1. Guo, Z.; Fan, Z.; Kong, X.; Meng, Z. Photonic crystal fiber based wide-range of refractive index sensor with phase matching between core mode and metal defect mode. Opt. Commun. 2020, 461, 125233. [Google Scholar] [CrossRef]
  2. Arismar Cerqueira, S., Jr. Recent progress and novel applications of photonic crystal fibers. Rep. Prog. Phys. 2010, 73, 024401. [Google Scholar] [CrossRef]
  3. Mohammed, N.A.; Khedr, O.E.; El-Rabaie, E.S.M.; Khalaf, A.A. Literature Review: On-Chip Photonic Crystals and Photonic Crystal Fiber for Biosensing and Some Novel Trends. IEEE Access 2022, 10, 3170912. [Google Scholar] [CrossRef]
  4. Hui, Z.; Zhang, Y.; Abdel-Hamid, S. Mid-infrared dual-rhombic air hole Ge20Sb15Se65 chalcogenide photonic crystal fiber with high birefringence and high nonlinearity. Ceram. Int. 2018, 44, 10383–10392. [Google Scholar] [CrossRef]
  5. Hui, Z.Q.; Zhang, J.G. Design of optical time-division multiplexed systems using the cascaded four-wave mixing in a highly nonlinear photonic crystal fiber for simultaneous time demultiplexing and wavelength multicasting. J. Optics 2015, 17, 075702. [Google Scholar] [CrossRef]
  6. Yang, H.; Zhao, J.; Xu, Q.; Yang, H.; Wang, H. Soliton colliding in hybrid glass photonic crystal fiber for optical transistor switching. Nonlinear Dyn. 2024, 112, 10291–10301. [Google Scholar] [CrossRef]
  7. Chiavaioli, F.; Gouveia, C.A.J.; Jorge, P.A.S.; Baldini, F. Towards a Uniform Metrological Assessment of Grating-Based Optical Fiber Sensors: From Refractometers to Biosensors. Biosensors 2017, 7, 23. [Google Scholar] [CrossRef]
  8. Dash, J.N.; Jha, R. SPR biosensor based on polymer PCF coated with conducting metal oxide. IEEE Photonic. Technol. Lett. 2014, 26, 595–598. [Google Scholar] [CrossRef]
  9. Rifat, A.A.; Mahdiraji, G.A.; Sua, Y.M.; Shee, Y.G.; Ahmed, R.; Chow, D.M.; Mahamd Adikan, F.R. Surface Plasmon Resonance Photonic Crystal Fiber Biosensor: A Practical Sensing Approach. IEEE Photonic. Technol. Lett. 2015, 27, 1628–1631. [Google Scholar] [CrossRef]
  10. Xue, J.; Zhang, Y.; Liu, W.; Zhang, Y.; Li, S.; Liu, Z.; Zhang, J.; Lai, B.; Yuan, L. Ultrahigh-sensitivity SPR fiber temperature sensor based Ge2Sb2Te5 and cyclohexane. Sensor. Actuat. A-Phys. 2022, 345, 113786. [Google Scholar] [CrossRef]
  11. Jain, S.; Choudhary, K.; Kumar, S. Novel Materials-Based Photonic Crystal Fiber Sensor for Biomedical Applications. Plasmonics 2024, 19, 1619–1632. [Google Scholar] [CrossRef]
  12. Wang, H.; Zhang, W.; Chen, C.; Tang, S.; Liu, H. A new methane sensor based on compound film-coated photonic crystal fiber and Sagnac interferometer with higher sensitivity. Results Phys. 2019, 15, 102817. [Google Scholar] [CrossRef]
  13. Abbaszadeh, A.; Rash-Ahmadi, S. A novel graphene-based circular dual-core photonic crystal fiber pressure sensor with high sensitivity. Appl. Phys. A-Mater. 2023, 129, 570. [Google Scholar] [CrossRef]
  14. Danlard, I.; Mensah, I.O.; Akowuah, E.K. Design and numerical analysis of a fractal cladding PCF-based plasmonic sensor for refractive index, temperature, and magnetic field. Optik 2022, 258, 168893. [Google Scholar] [CrossRef]
  15. Anik, M.H.K.; Islam, S.M.R.; Talukder, H.; Mahmud, S.; Isti, M.I.A.; Sadeghi-niaraki, A.; Kwak, K.-S.; Biswas, S.K. A highly sensitive quadruple D-shaped open channel photonic crystal fiber plasmonic sensor: A comparative study on materials effect. Results Phys. 2021, 23, 104050. [Google Scholar] [CrossRef]
  16. Dubey, S.K.; Kumar, A.; Kumar, A.; Pathak, A.; Srivastava, S.K. A study of highly sensitive D-shaped optical fiber surface plasmon resonance based refractive index sensor using grating structures of Ag-TiO2 and Ag-SnO2. Optik 2022, 252, 168527. [Google Scholar] [CrossRef]
  17. Liu, W.; Liu, Z.; Zhang, Y.; Li, S.; Zhang, Y.; Yang, X.; Zhang, J.; Yuan, L. Specialty optical fibers and 2D materials for sensitivity enhancement of fiber optic SPR sensors: A review. Opt. Laser Technol. 2022, 152, 108167. [Google Scholar] [CrossRef]
  18. Santos, D.F.; Guerreiro, A.; Baptista, J.M. SPR optimization using metamaterials in a D-type PCF refractive index sensor. Opt. Fiber Technol. 2017, 33, 83–88. [Google Scholar] [CrossRef]
  19. Liu, Y.; Jing, X.; Li, S.; Zhang, S.; Zhang, Z.; Guo, Y.; Wang, J.; Wang, S. High sensitivity surface plasmon resonance sensor based on D-shaped photonic crystal fiber with circular layout. Opt. Fiber Technol. 2018, 46, 311–317. [Google Scholar] [CrossRef]
  20. Wang, S.; Li, S. Surface plasmon resonance sensor based on symmetrical side-polished dual-core photonic crystal fiber. Opt. Fiber Technol. 2019, 51, 96–100. [Google Scholar] [CrossRef]
  21. Saleh Falah, A.A.; Wong, W.R.; Adikan, F.R.M. Single-mode eccentric-core D-shaped photonic crystal fiber surface plasmon resonance sensor. Opt. Laser Technol. 2022, 145, 107474. [Google Scholar] [CrossRef]
  22. Bing, P.; Wu, G.; Sui, J.; Zhang, H.; Tan, L.; Li, Z.; Yao, J. Double Samples Synchronous Detection Sensor based on Up-Core Photonic Crystal Fiber. Optik 2020, 224, 165522. [Google Scholar] [CrossRef]
  23. Fang, H.; Wei, C.; Jiang, W.; Wang, D.; Li, J. Highly efficient symmetrical dual-channel D-type photonic crystal fiber surface plasmon resonance sensor. J. Opt. Soc. Am. B 2022, 39, 1–8. [Google Scholar] [CrossRef]
  24. Mumtaz, F.; Zhang, B.; Roman, M.; Abbas, L.G.; Ashraf, M.A.; Dai, Y. Computational study: Windmill-shaped multi-channel SPR sensor for simultaneous detection of multi-analyte. Measurement 2023, 207, 112386. [Google Scholar] [CrossRef]
  25. Azman, M.F.; Mashrafi, M.; Haider, F.; Ahmed, R.; Ahmmed, R.A.; Junayed, M.; Ru, W.W.; Mahdiraji, G.A.; Adikan, F.R.M. Polarization Selective PCF-Based Plasmonic Biosensor for Multi-Analyte Detection. Plasmonics 2024, in press. [Google Scholar] [CrossRef]
  26. Chow, D.M.; Sandoghchi, S.R.; Adikan, F.R.M. Fabrication of Photonic Crystal Fibers. In Proceedings of the 3rd International Conference on Photonics, Penang, Malaysia, 1–3 October 2012. [Google Scholar] [CrossRef]
  27. El Hamzaoui, H.; Ouerdane, Y.; Bigot, L.; Bouwmans, G.; Capoen, B.; Boukenter, A.; Girard, S.; Bouazaoui, M. Sol-gel derived ionic copper-doped microstructured optical fiber: A potential selective ultraviolet radiation dosimeter. Opt. Express 2012, 20, 29751–29760. [Google Scholar] [CrossRef] [PubMed]
  28. Knight, J.C.; Birks, T.A.; Russell, P.S.; Atkin, D.M. All-silica single-mode optical fiber with photonic crystal cladding. Opt. Lett. 1996, 21, 1547–1549. [Google Scholar] [CrossRef] [PubMed]
  29. Kumar, V.R.K.; George, A.K.; Reeves, W.H.; Knight, J.C.; Russell, P.S.J.; Omenetto, F.G.; Taylor, A.J. Extruded soft glass photonic crystal fiber for ultrabroad supercontinuum generation. Opt. Express 2002, 10, 1520–1525. [Google Scholar] [CrossRef] [PubMed]
  30. Zhang, X.; Wang, R.; Cox, F.M.; Kuhlmey, B.T.; Large, M.C.J. Selective coating of holes in microstructured optical fiber and its application to in-fiber absorptive polarizers. Opt. Express 2007, 15, 16270–16278. [Google Scholar] [CrossRef]
  31. Csaki, A.; Jahn, F.; Latka, I.; Henkel, T.; Malsch, D.; Schneider, T.; Schröder, K.; Schuster, K.; Schwuchow, A.; Spittel, R.; et al. Nanoparticle layer deposition for plasmonic tuning of microstructured optical fibers. Small 2010, 6, 2584–2589. [Google Scholar] [CrossRef]
  32. Sazio, P.J.A.; Amezcua-Correa, A.; Finlayson, C.E.; Hayes, J.R.; Scheidemantel, T.J.; Baril, N.F.; Jackson, B.R.; Won, D.J.; Zhang, F.; Margine, E.R.; et al. Microstructured optical fibers as high-pressure microfluidic reactors. Science 2006, 311, 1583–1586. [Google Scholar] [CrossRef] [PubMed]
  33. Boehm, J.; François, A.; Ebendorff-Heidepriem, H.; Monro, T.M. Chemical Deposition of Silver for the Fabrication of Surface Plasmon Microstructured Optical Fibre Sensors. Plasmonics 2011, 6, 133–136. [Google Scholar] [CrossRef]
  34. Politano, G.G.; Cazzanelli, E.; Versace, C.; Vena, C.; De Santo, M.P.; Castriota, M.; Ciuchi, F.; Bartolino, R. Graphene oxide on magnetron sputtered silver thin films for SERS and metamaterial applications. Appl. Surf. Sci. 2018, 427, 927–933. [Google Scholar] [CrossRef]
  35. Malitson, H. Interspecimen comparison of the refractive index of fused silica. J. Opt. Soc. Am 1965, 55, 1205–1209. [Google Scholar] [CrossRef]
  36. Shakya, A.K.; Singh, S. Design of dual polarized tetra core PCF based plasmonic RI sensor for visible-IR spectrum. Opt. Commun. 2021, 478, 126372. [Google Scholar] [CrossRef]
  37. Vial, A.; Grimault, A.-S.; Macías, D.; Barchiesi, D.; de la Chapelle, M.L. Improved analytical fit of gold dispersion: Application to the modeling of extinction spectra with a finite-difference time-domain method. Phys. Rev. B 2005, 71, 085416. [Google Scholar] [CrossRef]
  38. Rajeswari, D.; Revathi, A.A. Highly sensitive SPR-based PCF bio sensor for plasma cell detection in human blood for the detection of early stage cancer. Optik 2022, 258, 168897. [Google Scholar] [CrossRef]
  39. Sun, C.; Wang, W.; Jia, H. A squeezed photonic crystal fiber for residual dispersion compensation with high birefringence over S+C+L+U wavelength bands. Opt. Commun. 2020, 458, 124757. [Google Scholar] [CrossRef]
  40. Liu, C.; Fu, H.; Lv, Y.; Yi, Z.; Lin, J.; Lv, J.; Yang, L.; Chu, P.K. HE1,1 mode-excited surface plasmon resonance for refractive index sensing by photonic crystal fibers with high sensitivity and long detection distance. Optik 2022, 265, 169471. [Google Scholar] [CrossRef]
  41. Jiao, S.; Ren, X.; Yang, H.; Xu, S.; Li, X. Dual-Channel and Dual-Core Plasmonic Sensor-Based Photonic Crystal Fiber for Refractive Index Sensing. Plasmonics 2022, 17, 295–304. [Google Scholar] [CrossRef]
  42. Yasli, A.; Ademgil, H.; Haxha, S.; Aggoun, A. Multi-Channel Photonic Crystal Fiber Based Surface Plasmon Resonance Sensor for Multi-Analyte Sensing. IEEE Photonics J. 2020, 12, 1. [Google Scholar] [CrossRef]
  43. Divya, J.; Selvendran, S.; Raja, A.S.; Borra, V. A Novel Plasmonic Sensor Based on Dual-Channel D-Shaped Photonic Crystal Fiber for Enhanced Sensitivity in Simultaneous Detection of Different Analytes. IEEE Trans. NanoBiosci. 2024, 23, 1. [Google Scholar] [CrossRef] [PubMed]
  44. Haider, F.; Mashrafi, M.; Aoni, R.A.; Haider, R.; Hossen, M.; Ahmed, T.; Mahdiraji, G.A.; Ahmed, R. Multi-Analyte Detection Based on Integrated Internal and External Sensing Approach. IEEE Trans. NanoBiosci. 2022, 21, 29–36. [Google Scholar] [CrossRef] [PubMed]
  45. Gomez-Cardona, N.; Reyes-Vera, E.; Torres, P. High Sensitivity Refractive Index Sensor Based on the Excitation of Long-Range Surface Plasmon Polaritons in H-Shaped Optical Fiber. Sensors 2020, 20, 2111. [Google Scholar] [CrossRef] [PubMed]
  46. Lu, M.; Peng, W.; Liu, Q.; Liu, Y.; Li, L.; Liang, Y.; Masson, J.F. Dual channel multilayer-coated surface plasmon resonance sensor for dual refractive index range measurements. Opt. Express 2017, 25, 8563–8570. [Google Scholar] [CrossRef] [PubMed]
  47. DiPippo, W.; Lee, B.J.; Park, K. Design analysis of doped-silicon surface plasmon resonance immunosensors in mid-infrared range. Opt. Express 2010, 18, 19396–19406. [Google Scholar] [CrossRef]
  48. Patskovsky, S.; Kabashin, A.V.; Meunier, M. Properties and sensing characteristics of surface-plasmon resonance in infrared light. J. Opt. Soc. Am. A 2003, 20, 1644–1650. [Google Scholar] [CrossRef] [PubMed]
  49. Golosovsky, M.; Lirtsman, V.; Yashunsky, V.; Davidov, D.; Aroeti, B. Midinfrared surface-plasmon resonance: A novel biophysical tool for studying living cells. J. Appl. Phys. 2009, 105, 102036. [Google Scholar] [CrossRef]
  50. Rodrigo, D.; Limaj, O.; Janner, D.; Etezadi, D.; García de Abajo, F.J.; Pruneri, V.; Altug, H. Mid-infrared plasmonic biosensing with graphene. Science 2015, 349, 165–168. [Google Scholar] [CrossRef]
  51. Sachet, E.; Losego, M.D.; Guske, J.; Franzen, S.; Maria, J.P. Mid-infrared surface plasmon resonance in zinc oxide semiconductor thin films. Appl. Phys. Lett. 2013, 102, 051111. [Google Scholar] [CrossRef]
  52. Homola, J. Present and future of surface plasmon resonance biosensors. Anal. Bioanal. Chem. 2003, 377, 528–539. [Google Scholar] [CrossRef] [PubMed]
Figure 1. The cross-sections of the proposed SPR-PCF dual-channel refractive index sensor.
Sensors 24 05050 g001
Figure 2. Schematic for the fiber-fabrication process. The white circle represents the air holes. The gold layer is marked in red.
Sensors 24 05050 g002
Figure 3. Schematic of the proposed PCF-SPR RI sensor setup.
Sensors 24 05050 g003
Figure 4. Flow chart of double-sample detection. The white and green circles represent air holes and cured adhesives, respectively. The gold layer is marked in red. Analyte 1 and Analyte 2 are labeled blue and yellow, respectively.
Sensors 24 05050 g004
Figure 5. The confinement loss and dispersion relationship of the fundamental mode and SPP mode in the two sensing channels at n1 = 1.38 and n2 = 1.51. Insets are electric field distributions of various wavelengths. The color of the insets represents the strength of electric field, and its unit is v/m.
Sensors 24 05050 g005
Figure 6. Resonance peak versus RI of the two sensing channels for (a) n1 = 1.38, n2 = 1.50, (b) n1 = 1.38, n2 = 1.51, and (c) n1 = 1.37, n2 = 1.51.
Sensors 24 05050 g006
Figure 7. Confinement loss spectra for different air-hole diameters of (a) Channel 1 and (b) Channel 2. The other structural parameters are n1 = 1.39, n2 = 1.49, d2 = 2400 nm, c = 1000 nm, Ʌ = 2000 nm, h = 2400 nm, t1 = 50 nm, and t2 = 60 nm.
Sensors 24 05050 g007
Figure 8. Confinement loss spectra for different hole spacings of (a) Channel 1 and (b) Channel 2. The other structural parameters are n1 = 1.39, n2 = 1.49, d1 = 1080 nm, d2 = 2400 nm, c = 1000 nm, h = 2400 nm, t1 = 50 nm, and t2 = 60 nm.
Sensors 24 05050 g008
Figure 9. Confinement loss spectra for various Channel 2 diameters of (a) Channel 1 and (b) Channel 2. The other structural parameters are n1 = 1.39, n2 = 1.49, d1 = 1080 nm, Ʌ = 2000 nm, c = 1000 nm, h = 2400 nm, t1 = 50 nm, and t2 = 60 nm.
Sensors 24 05050 g009
Figure 10. Confinement loss spectra for different polishing depths of (a) Channel 1 and (b) Channel 2. The other structural parameters are n1 = 1.39, n2 = 1.49, d1 = 1080 nm, d2 = 2400 nm, Ʌ = 2000 nm, c = 1000 nm, t1 = 50 nm, and t2 = 60 nm.
Sensors 24 05050 g010
Figure 11. Confinement loss spectra for different gold-layer thickness t1 of (a) Channel 1 and (b) Channel 2. The other structural parameters are n1 = 1.39, n2 = 1.49, d1 = 1080 nm, d2 = 2400 nm, Ʌ = 2000 nm, c = 1000 nm, h = 2400 nm, and t2 = 60 nm.
Sensors 24 05050 g011
Figure 12. Confinement loss spectra for different gold-layer thickness t2 of (a) Channel 1 and (b) Channel 2. The other structural parameters are n1 = 1.39, n2 = 1.49, d1 = 1080 nm, d2 = 2400 nm, Ʌ = 2000 nm, c = 1000 nm, h = 2400 nm, and t1 = 50 nm.
Sensors 24 05050 g012
Figure 13. Effect of fabrication deviation on (a) Channel 1 and (b) Channel 2.
Sensors 24 05050 g013
Figure 14. Confinement losses for different analytes in the RI ranges of (a) 1.36–1.39 for Channel 1 and (b) 1.46–1.57 for Channel 2.
Sensors 24 05050 g014
Figure 15. Variation of resonance wavelength with analyte RI as the RI is changed from (a) 1.36 to 1.39 in Channel 1 and (b) 1.46 to 1.57 in Channel 2.
Sensors 24 05050 g015
Figure 16. Relationship between FOM, FWHM, and RI of analytes in (a) Channel 1 and (b) Channel 2.
Sensors 24 05050 g016
Figure 17. Relationship between SNR and analyte RI in (a) Channel 1 and (b) Channel 2.
Sensors 24 05050 g017
Table 1. Performance comparison of the proposed sensor with the previously reported sensors.
ReferencesChannelRI Range (RIU)Wavelength Range (nm) S λ (nm/RIU) RI Resolution
(RIU)
FOM (RIU−1)Research Types
[41]Ch 11.34–1.36528–61442802.34 × 10−5N/ANumerical
Ch 21.34–1.36658–73839402.54 × 10−5N/A
[42]Ch 11.33–1.366400–80018924 × 10−5N/ANumerical
Ch 21.33–1.366400–80023373.2 × 10−5N/A
[43]Ch 11.31–1.411350–160060005 × 10−5125Numerical
Ch 21.31–1.411450–165060005 × 10−568.96
[44]Ch 11.33–1.40530–97012,0008.33 × 10−6200Numerical
Ch 21.33–1.39530–97010,0001.0 × 10−5145
[45]Ch 11.33–1.39600–150075401.3 × 10−5522Numerical
Ch 21.33–1.39600–150075401.3 × 10−5280
[46]Ch 11.3253–1.3726700–8502496N/AN/AExperimental
Ch 21.5255–1.5781560–7001951
This workCh 11.36–1.392100–300028,214.2863.54 × 10−6315.87Numerical
Ch 21.46–1.571500–26009190.910.88 × 10−677.87
Disclaimer/Publisher’s Note: The statements, opinions and data contained in all publications are solely those of the individual author(s) and contributor(s) and not of MDPI and/or the editor(s). MDPI and/or the editor(s) disclaim responsibility for any injury to people or property resulting from any ideas, methods, instructions or products referred to in the content.

