Sensing Classroom Temperature, Relative Humidity, Illuminance, CO2, and Noise: An Integral Solution Based on an IoT Device for Dense Deployments
Abstract
:1. Introduction
- Ventilation status and contaminant detection: Indoor ventilation status is generally related to the concentration of naturally generated contaminants. This often affects the health and productivity of the compartment’s occupants [5,6,7,8,9]. In addition to the above, the detection of non-natural contaminants, introduced accidentally or intentionally [10], is also a matter of interest because they can also affect the health of living beings.
- Energy consumption: The energy consumption of Heating, Ventilation, and Air Conditioning (HVAC) systems is usually significant compared to other energy-consuming systems in buildings. As a result, this is a topic where proposals are continually being made [11,12,13,14,15,16]. In [17], a set of circuits of complementary activities is designed and successfully used to both measure variables related to IEQ and detect inappropriate energy consumption. Particularly noteworthy is the effort made to obtain low-cost devices that are also open hardware and software. The extensive literature review presented in [18] discusses how various IoT systems have been used to reduce energy consumption in buildings while increasing occupant comfort. Although the term IEQ is commonly applied to buildings for people, there are some industrial facilities, such as greenhouses, where controlling environmental variables while optimizing energy consumption is equally important [19].
- Comfort levels: According to chapters 8 of [2] and 3 of [9], the areas of interest of variables to establish IEQ conditions are as follows: thermal comfort, illuminance, indoor air quality, and noise.Aside from the limitations imposed by the absence of health hazards, the fact is that comfort levels with respect to various parameters of environmental interest are not the same for all individuals in all scenarios. Several researchers say that different factors that have an influence are age [20], activities prior to entering a new space [21], the metabolic rate of individuals, the insulation provided by clothing [22], and the gender of people (chapter 2.1 in [23]), among others. Therefore, in multi-user rooms, it is sometimes difficult to satisfy everyone equally. This makes measures such as Predicted Mean Vote (PMV), Actual Mean Vote (AMV), and Predicted Percentage of Dissatisfied (PPD) interesting [22].Another alternative to explain the complicated thermal scenarios related to comfort sensations and to facilitate decision making is the one presented in [24], which proposes the creation of a system based on artificial intelligence.In addition, the approach taken in [25] proposes to couple a network of sensors to the user in order to measure their state of comfort. By comparing the obtained data with the environmental conditions, a thermal comfort model is obtained.
- Technological details of the IoT sensor networks: Currently, system architectures commonly used in the Internet of Things (IoT) field are emerging as interesting alternatives for rigorous monitoring of quantities that influence the quality of environmental conditions inside buildings [26]. In addition, IoT systems generally facilitate the distribution of results among registered subscribers. The technological challenges faced by IoT systems regarding indoor environments are generally not very different from those faced by other IoT systems. Scalability is one of them. In this respect, the development proposed in [27] stands out. This reference shows the deployment of 165 sensor units throughout New Zealand to provide IAQ measurements in school classrooms.Another decision of great relevance is to determine which communication alternative is the most suitable for the different devices of an IoT system. In this respect, the hardware approach proposed in [28] adds flexibility to this decision. The authors provide several wired and wireless communication alternatives for each sensor unit.According to [29], low-cost sensors such as those presented in this paper do not require a calibration certificate. The opposite is true for professional sensors, which are typically used in the construction of high-end laboratory equipment.In [30], the deployment of a sensor node network with infrared communication is shown to avoid electromagnetic interference problems. This could be of interest in hospitals and other applications where there is equipment whose operation could be affected by electromagnetic radiation.Finally, it should be noted that when sensor nodes cannot rely on an external power source, it is necessary to use batteries or some energy harvesting strategy. Although this problem is not frequent when measuring indoor variables, since usually all buildings offer electric power, sometimes the location of the sensors may be far from any power outlet. Therefore, contributions like [31] are of interest. The authors of [31] show that they consume much more energy when using the sensors than when transmitting the information obtained. This observation could be used to optimize the time interval selected to collect information from the sensors.
- Stakeholders: From our point of view, the beneficiaries of using an IoT network to measure indoor variables are as follows:
- –
- The users of the space, because they can establish more rigorous indoor environmental control strategies and allow them to detect extreme scenarios that require specific actions.
- –
- –
- Decisions makers also gain benefits because they can implement their regulations with scientific rigor [34].
- To enrich the above sensor with high scalability.
2. Materials and Methods
2.1. Capabilities That the Sensor Node Should Have
- Topic “Comfort levels”: In accordance with [2,9,35,36], it is important to measure temperature, humidity, illumination, CO2 concentration, and noise. It is worth mentioning that the measurement of air temperature and relative humidity allows one to obtain an estimation of thermal comfort according to [37,38,39,40,41,42,43].
- Topic “Ventilation status and contaminant detection”: Measure CO2 concentration because it is an indirect indicator of the degree of ventilation and undesirables air pollution levels in a room [2,35]. In addition, measurements of CO2 concentration are of interest in themselves due to the fact that high concentration levels can cause discomfort and headaches, among other adverse human health effects [44].
- Topic “Energy Consumption”: Enable corrective actions to be taken to improve energy consumption, based on information provided by the sensors.
- Topic “IoT network technology”:
- Have the capability for sensor nodes to communicate via RF until the information reaches the hub node of the RF network, as this reduces the cost of deploying the sensor network compared to wired alternatives.
- Be scalable enough to adequately monitor classrooms on a university campus.
- Topic “Stakeholder Support”: Sensor nodes should be able to support indoor environment stakeholders by providing measures of interest to them.
2.2. Selection of the Communication Alternative between Sensors
- Low cost of the wireless alternative compared to wired.
- Small length of messages to be sent and low transmission frequency, which minimizes the negative impact of lower speed in RF communications compared to wired.
2.3. Sensor Node Design and Construction
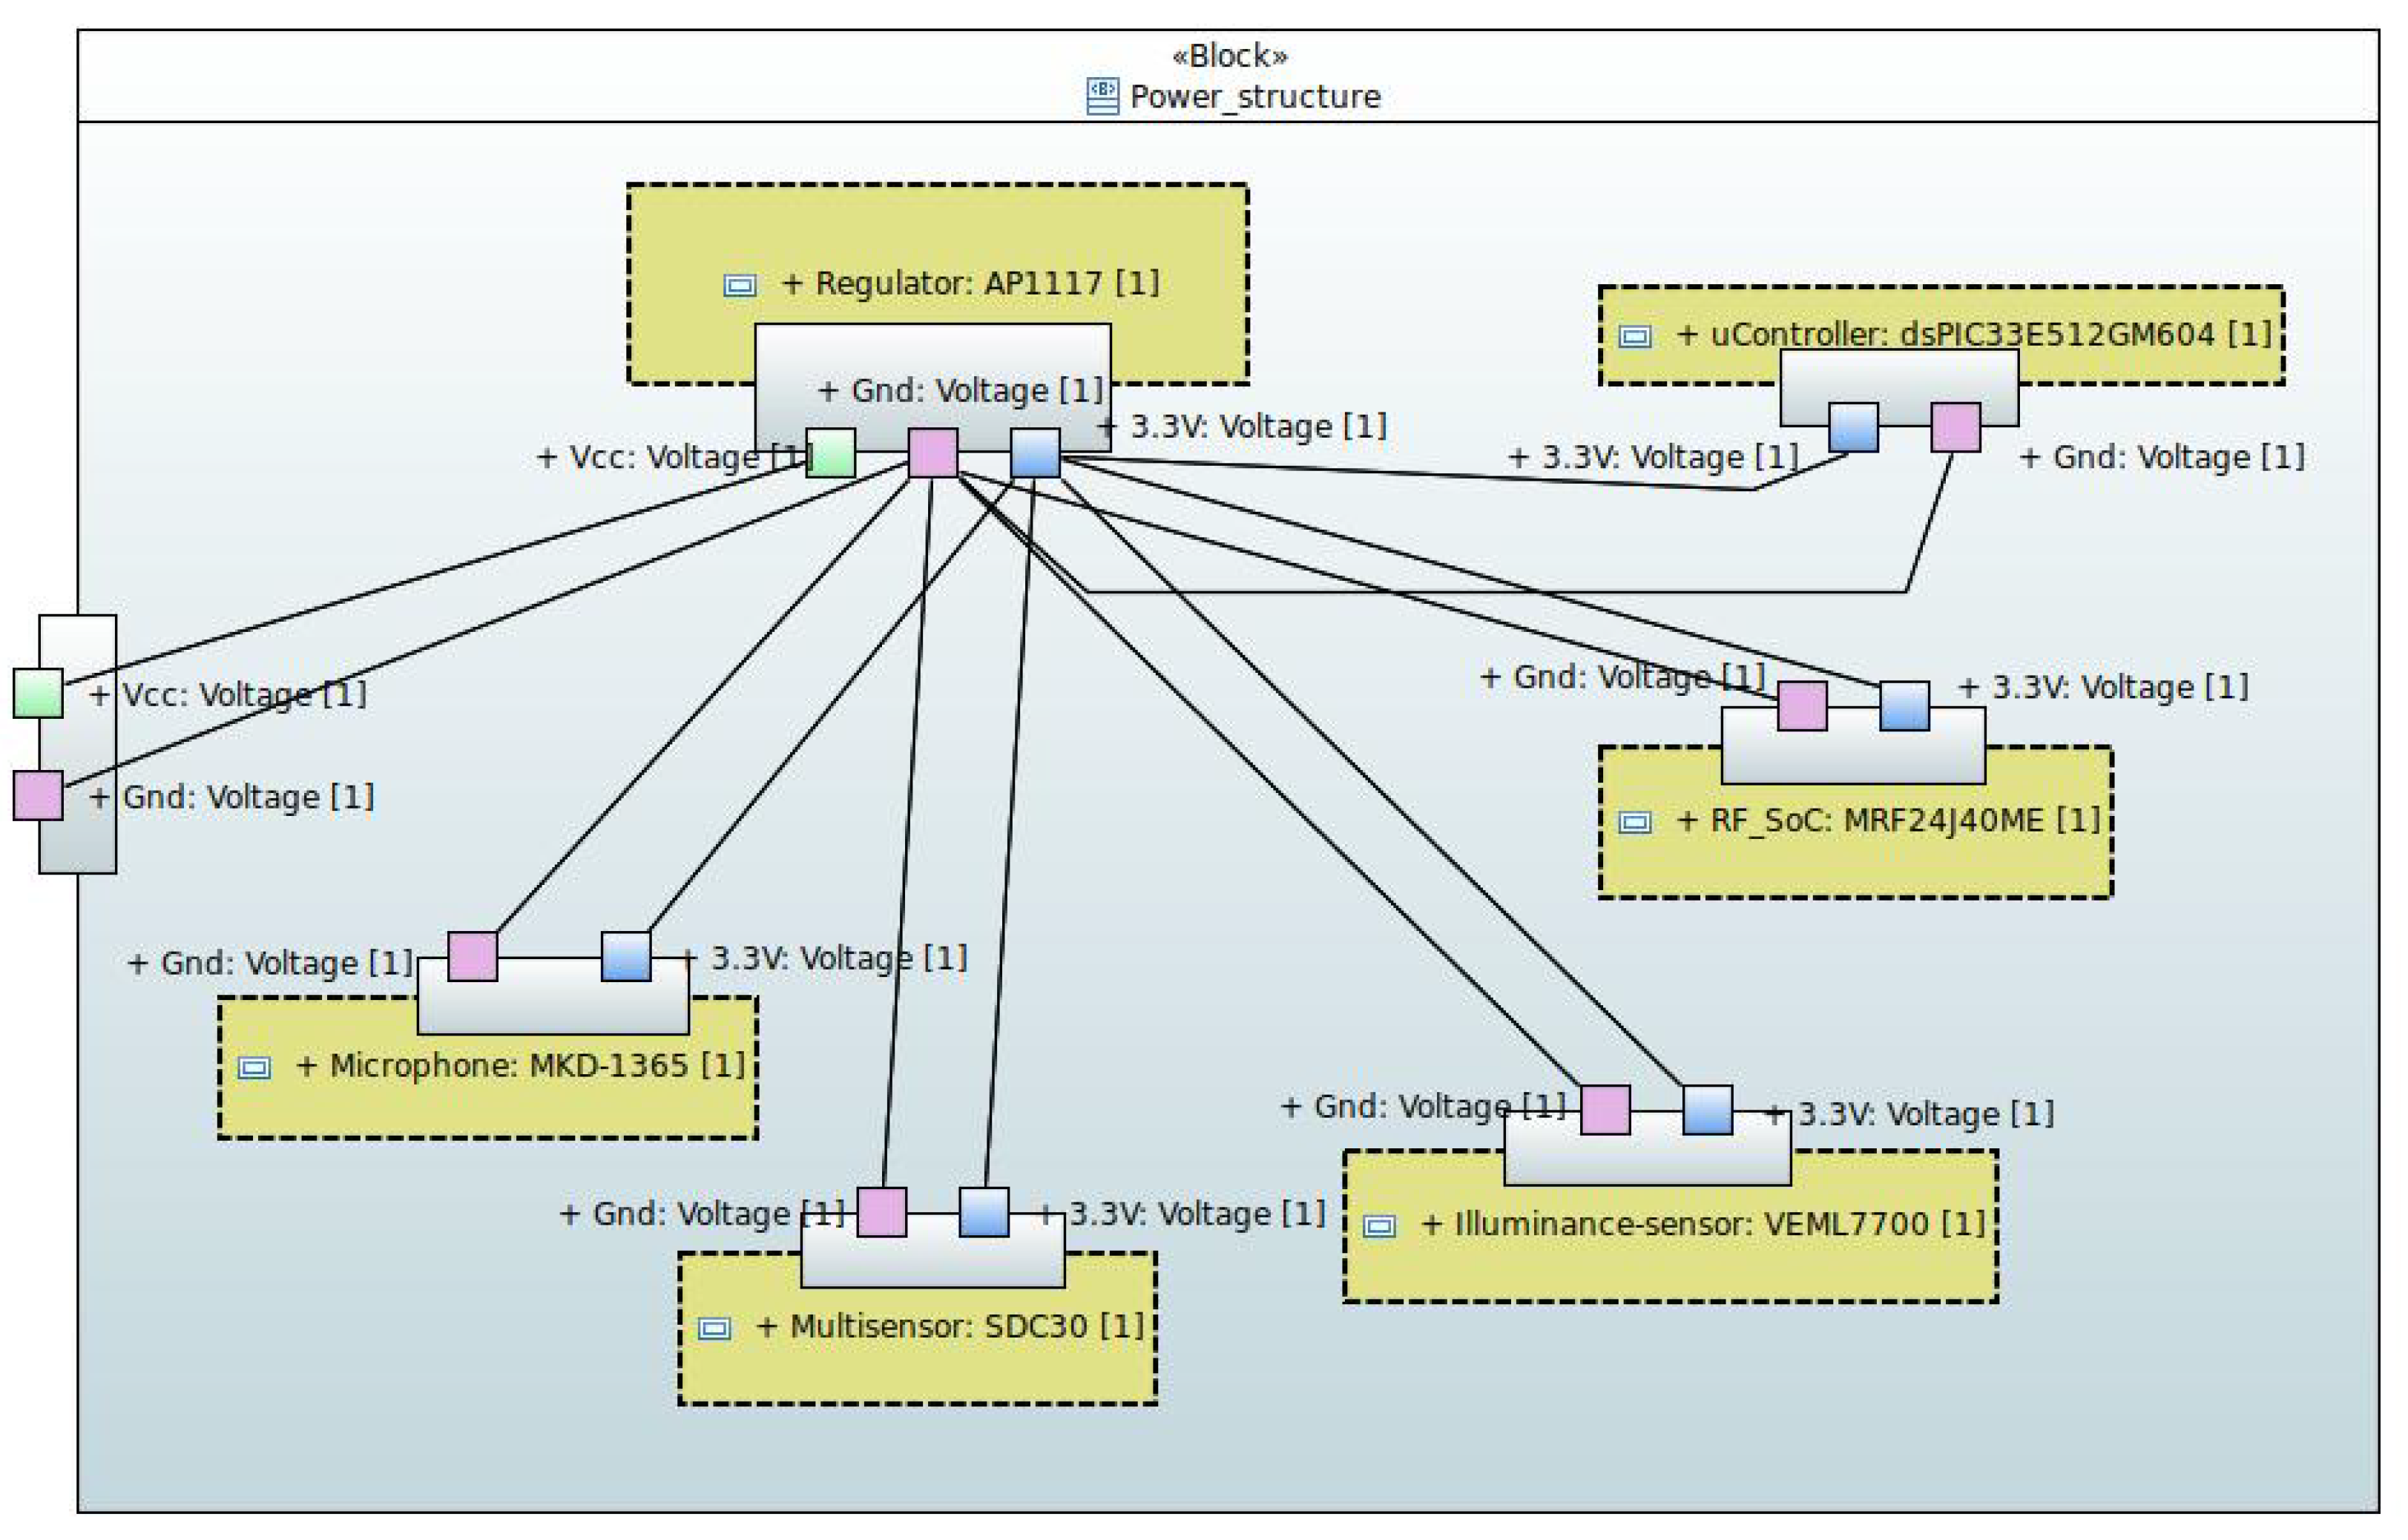
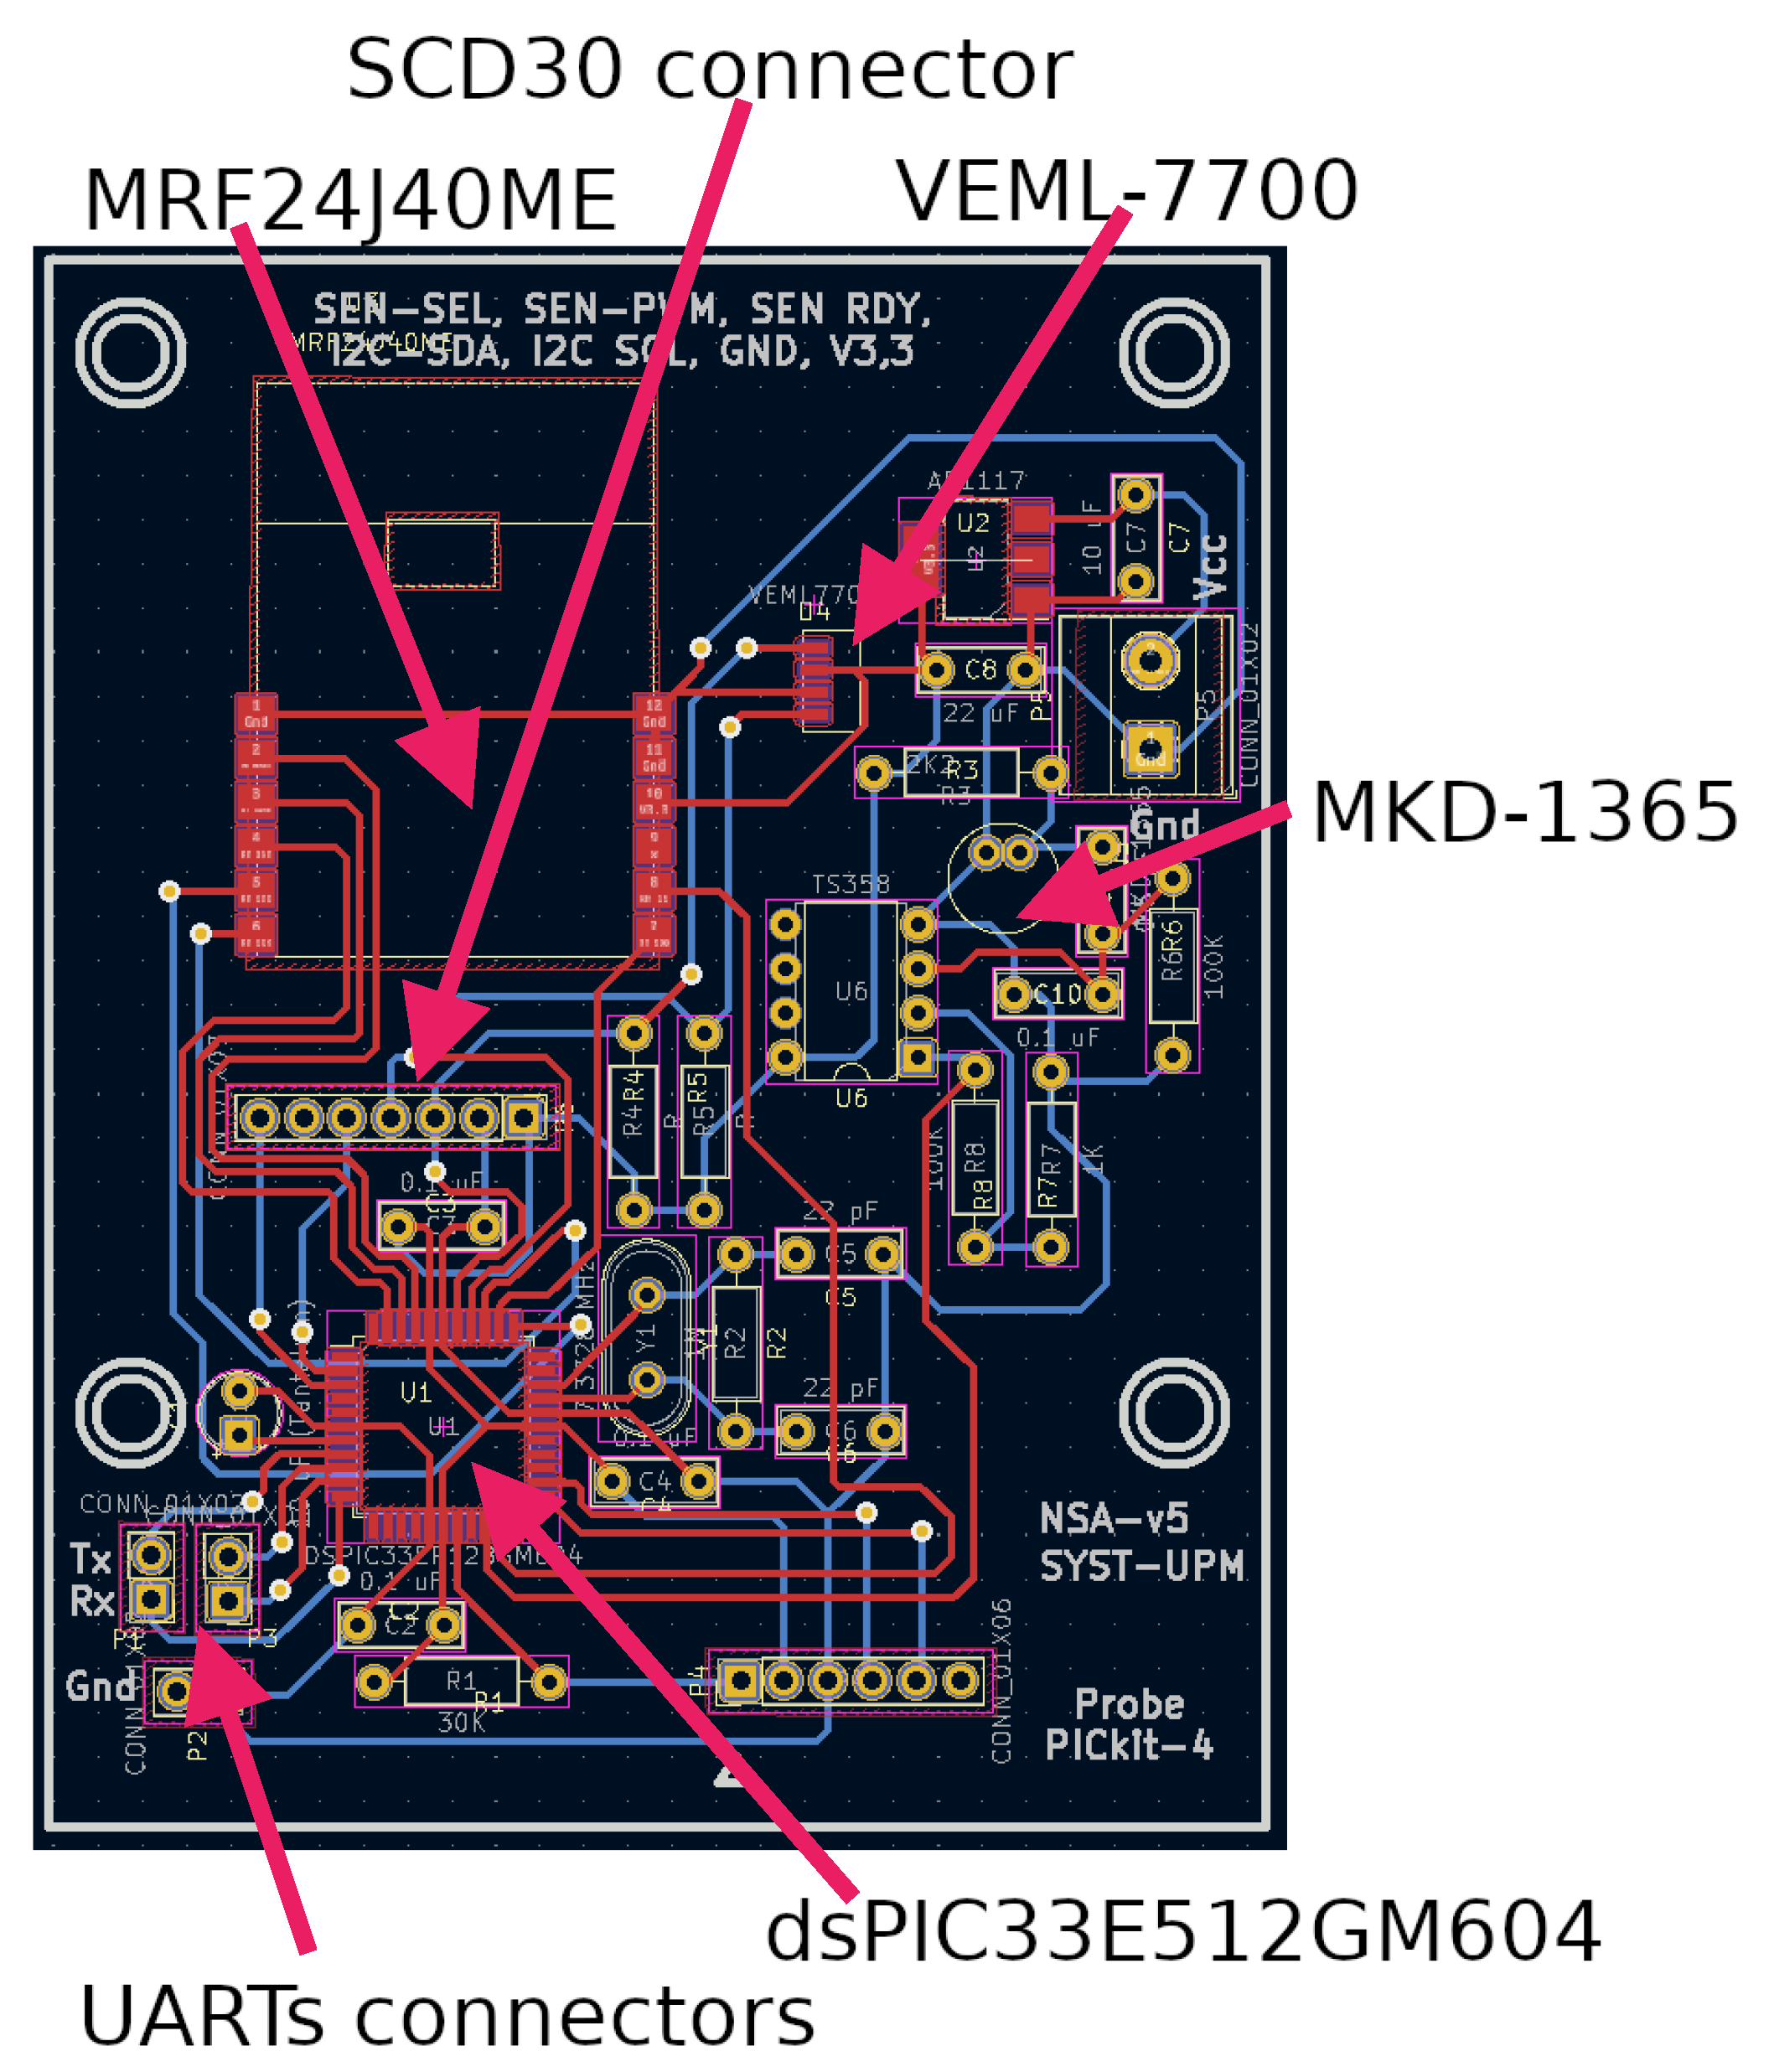
- Microcontroller: dsPIC33EP512GM604 (https://www.microchip.com/en-us/product/dsPIC33EP512GM604, accesed on 20 May 2024).
- Communications SoC: MRF24J40ME (https://ww1.microchip.com/downloads/aemDocuments/documents/OTH/ProductDocuments/DataSheets/70005173A.pdf, accesed on 20 May 2024).
- Sensors:
- –
- Luminosity: VEML7700 (https://www.vishay.com/docs/84286/veml7700.pdf, accesed on 20 May 2024).
- –
- CO2 concentration: SCD30 (https://sensirion.com/products/catalog/SCD30/, accesed on 20 May 2024).
- –
- Temperature: SHT31 (embedded inside the device SCD30, https://sensirion.com/products/catalog/SHT31-DIS-B/, accesed on 20 May 2024).
- –
- Relative humidity: SHT31 (embedded inside the device SCD30, https://sensirion.com/products/catalog/SHT31-DIS-B/, accesed on 20 May 2024).
- –
- Microphone: MKD-1365 (https://docs.rs-online.com/f768/0900766b811685df.pdf, accesed on 20 May 2024).
2.4. Test Bed
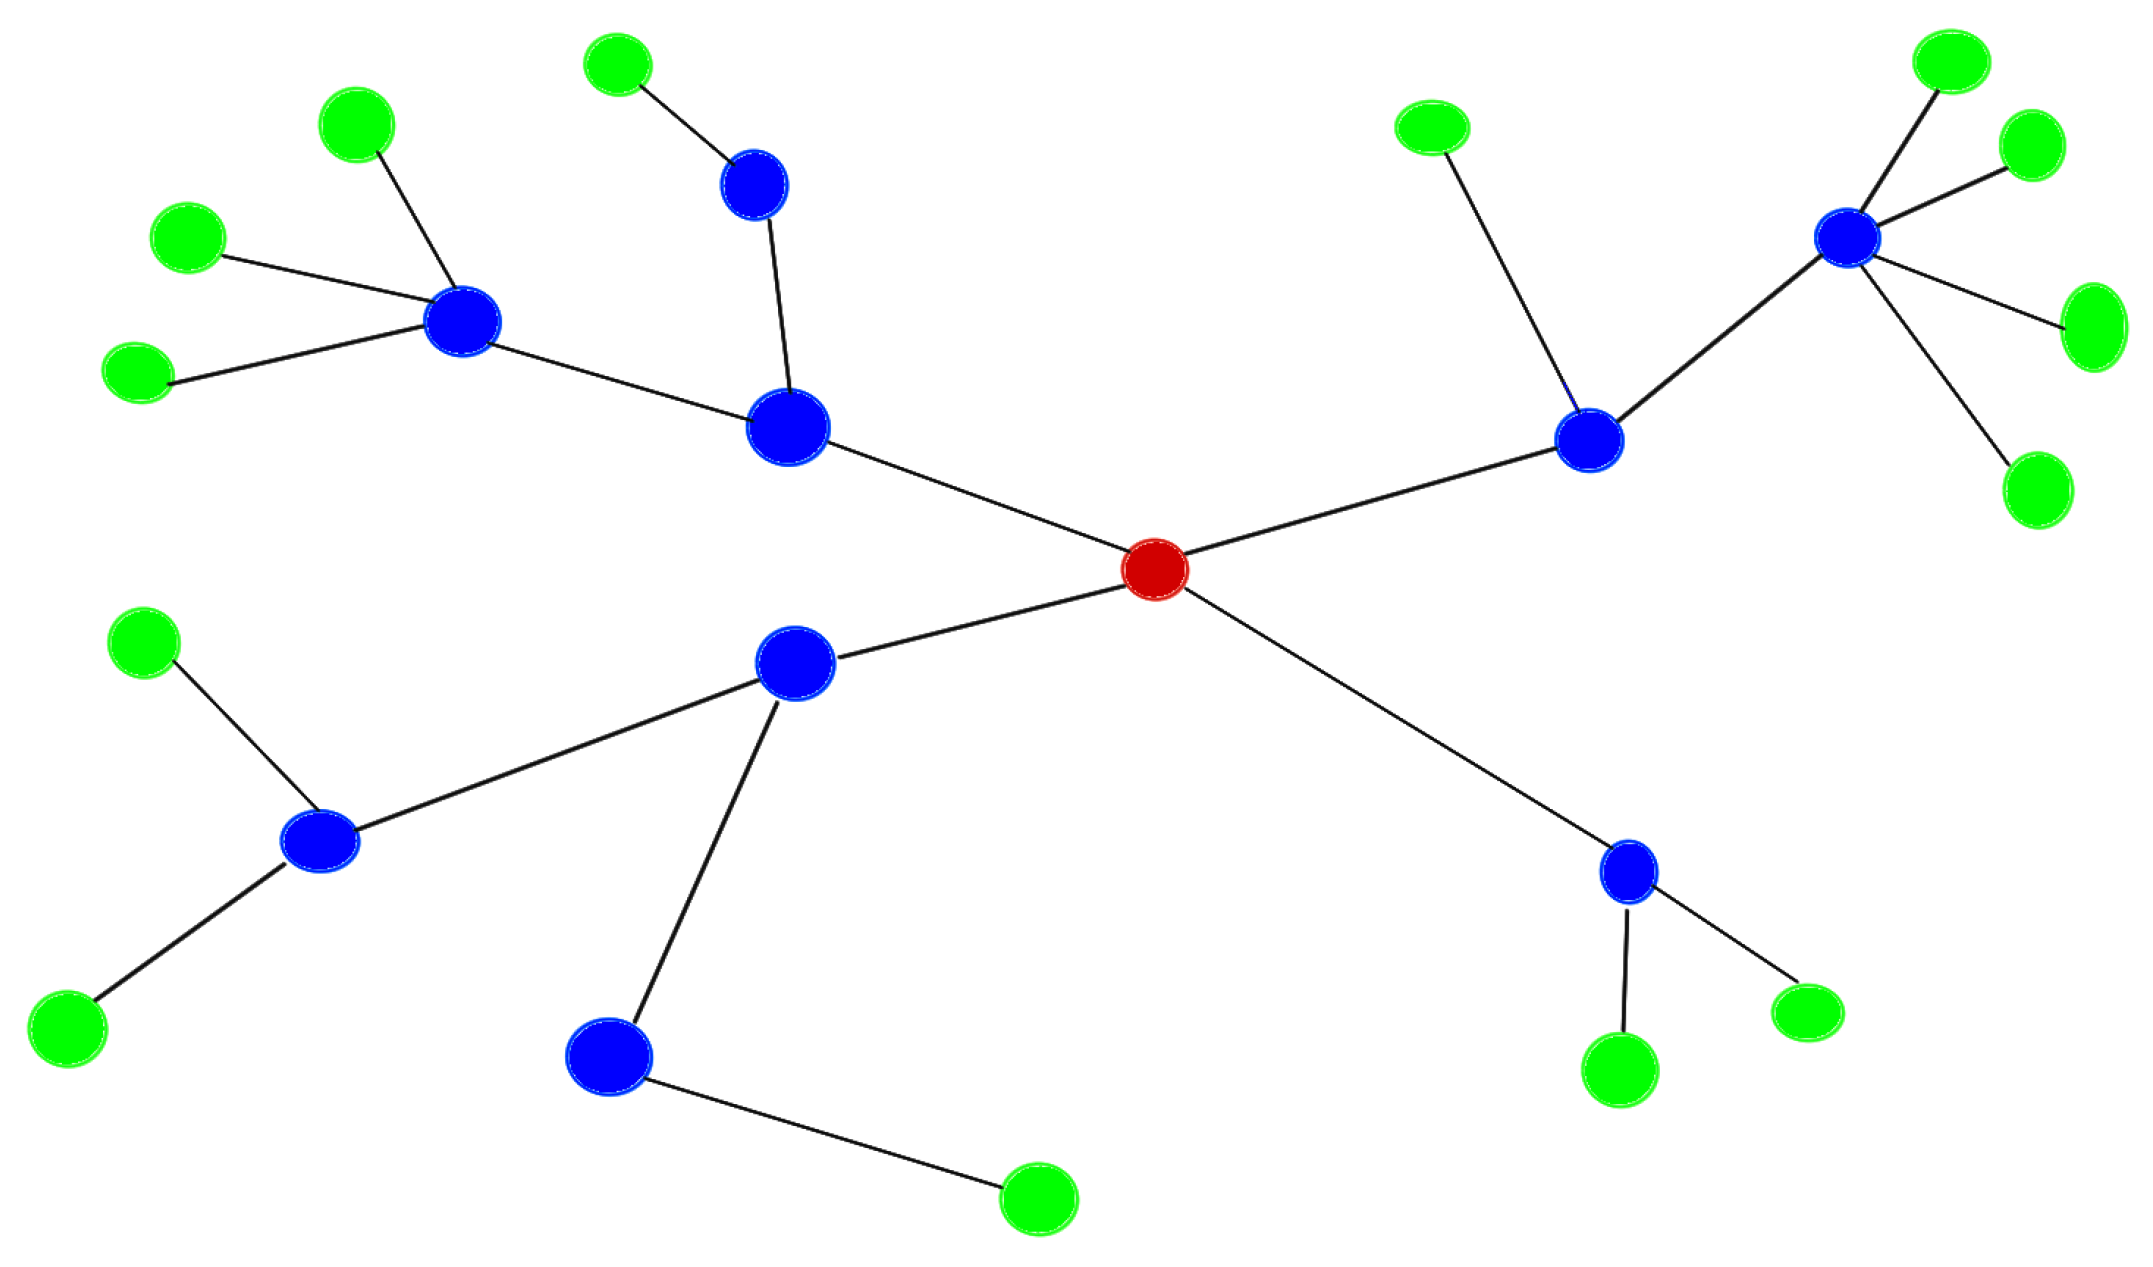
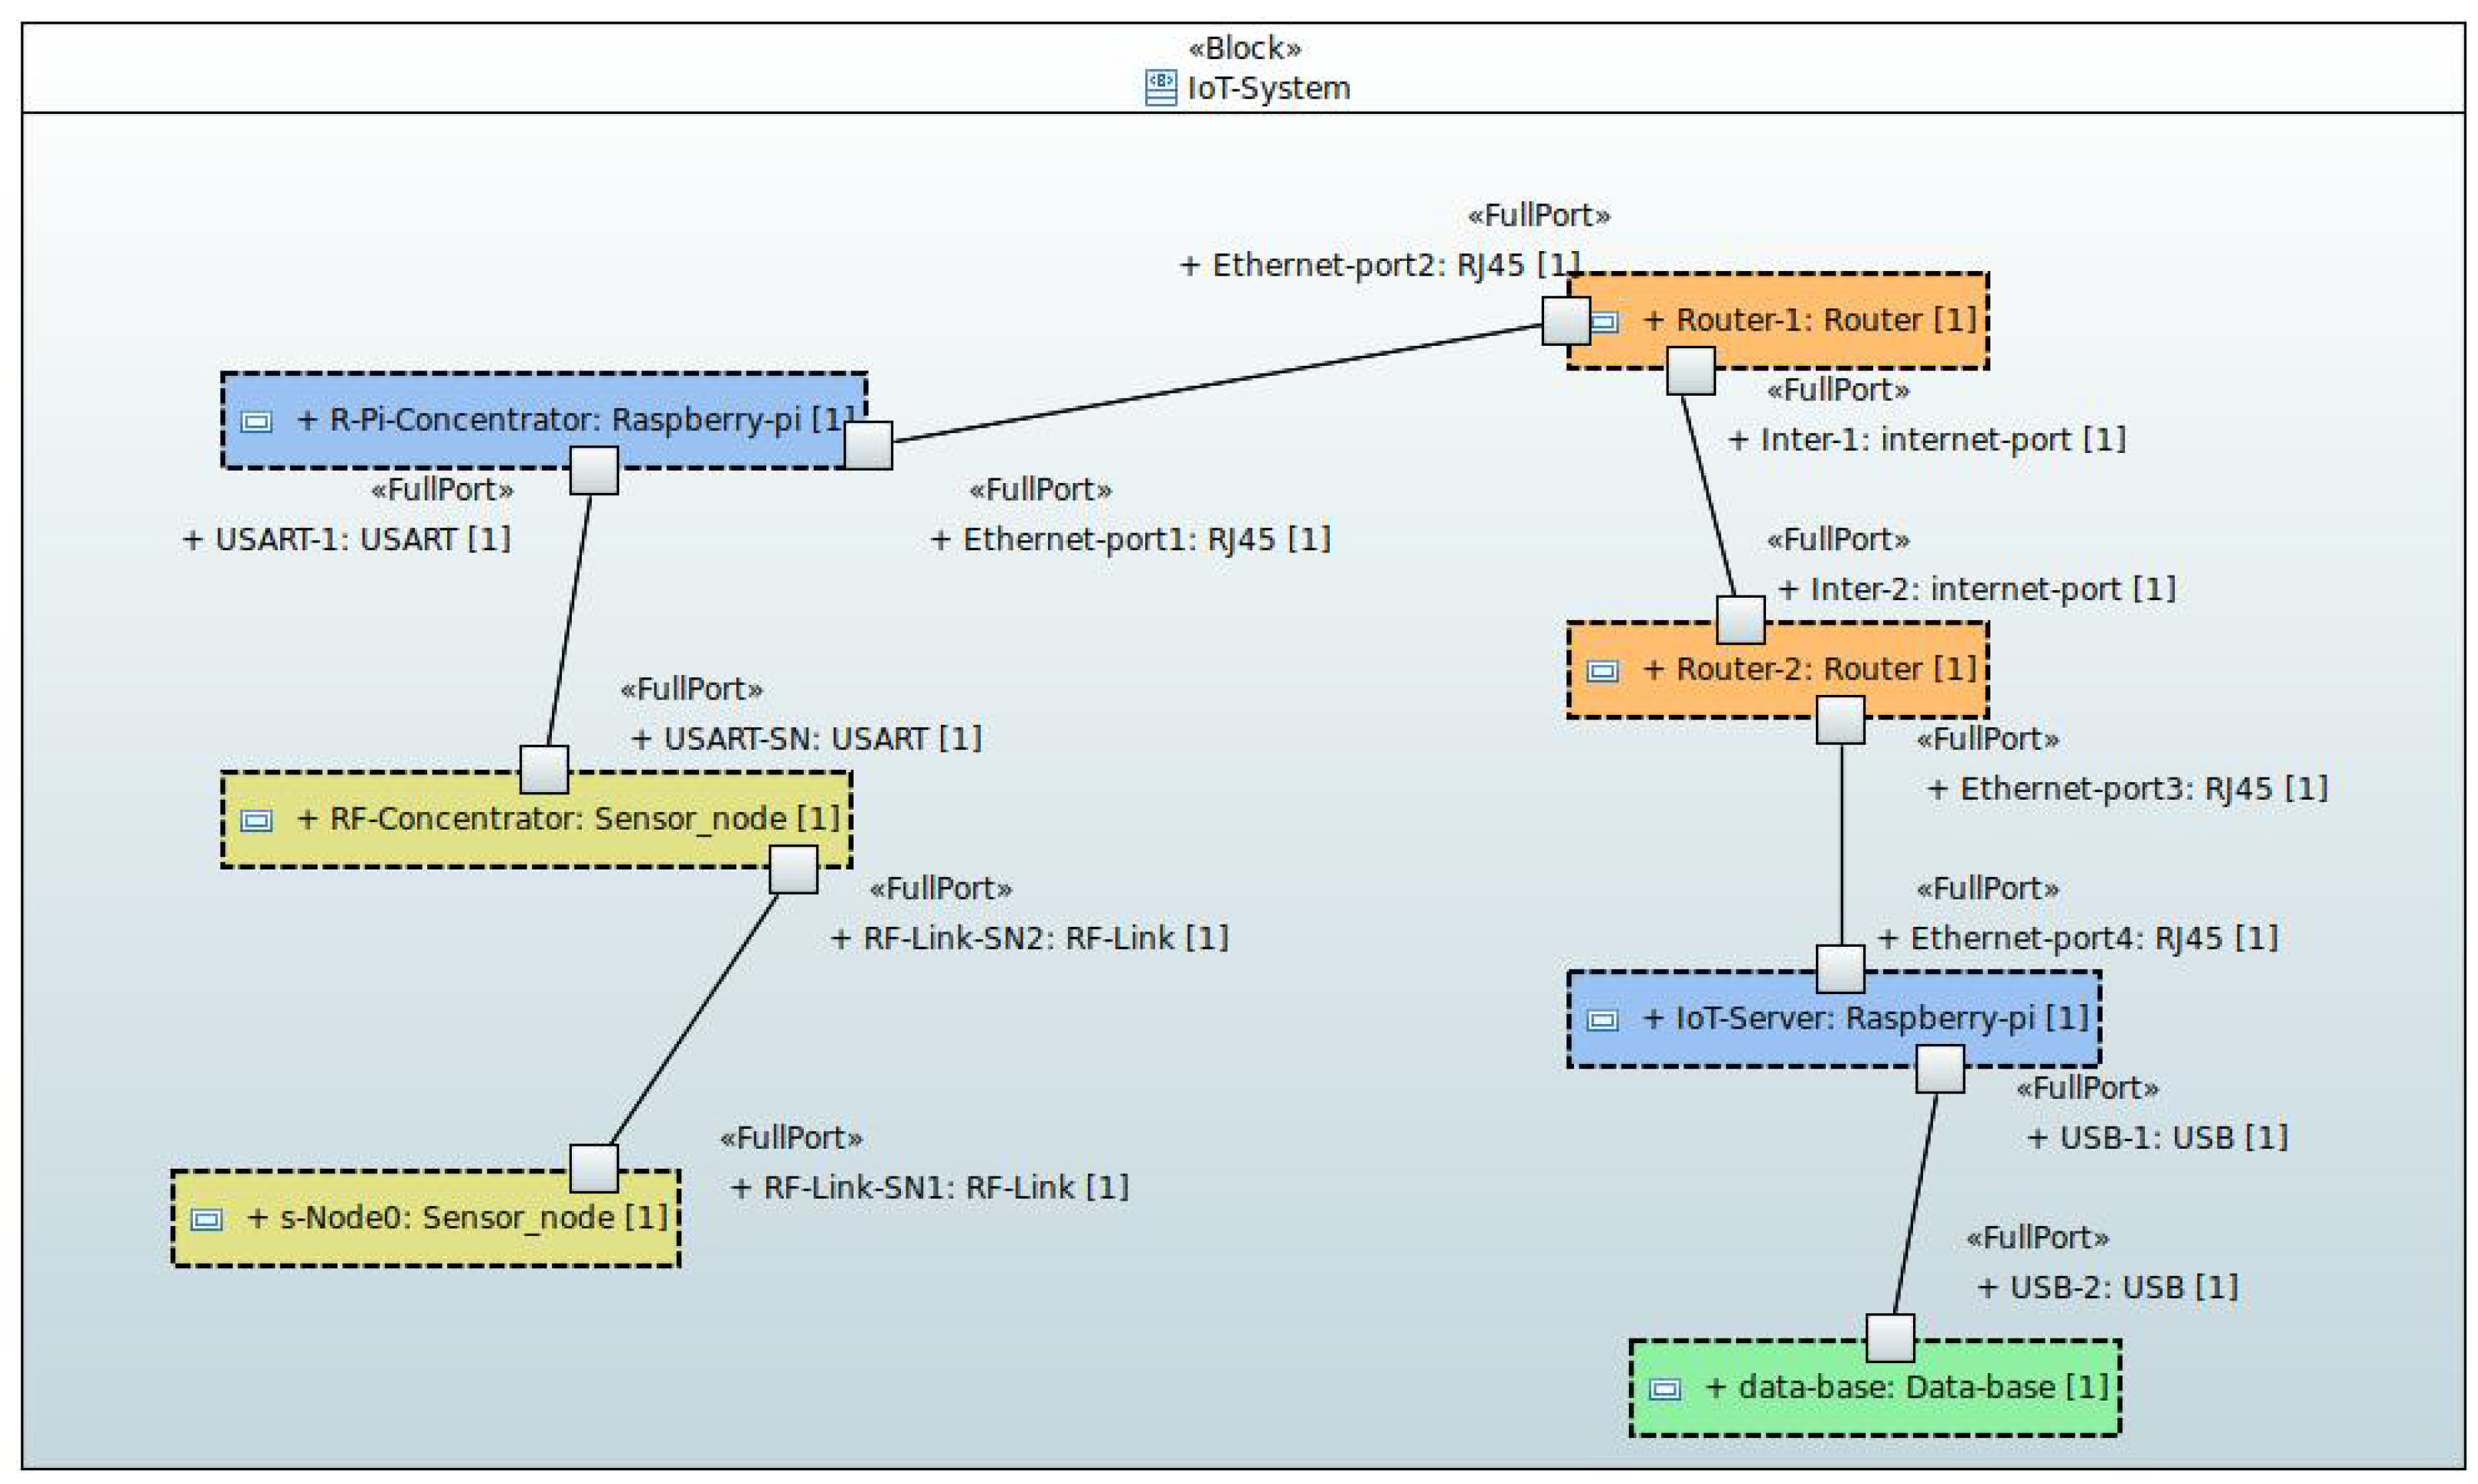
- Sensor nodes. These are devices developed to collect indoor environmental measurements and transmit them via RF to a concentrator node.
- Concentrator node. It is a sensor node in which, in addition to generating the information acquired at its location, it collects the information received from the sensors deployed in the same RF network. The collected information is sent, through a USART channel, to an element with an Internet connection (injector node).
- Injector node (Internet entry point). It is responsible for receiving information from the concentrator node and injecting it into the Internet to a database server, where the information will be permanently stored.
- Message router node (Internet router). The injector nodes of an installation connect to a router, which knows how to redirect messages to reach their destination.
- Database server node (Internet endpoint). It is the node in charge of receiving the information from the Internet and storing it permanently in a database.
| Algorithm 1 Schematic code design of PAN coordinator. |
|
| Algorithm 2 Schematic code design of a full future device. |
|
3. Results and Discussion
3.1. IoT System Testing
- Initialization of the microcontroller and its peripherals.
- Verification of sensors operation.
- Verification of RF communication between sensor nodes.
- Verification of the communication between the concentrator and the injector node.
- Verification of the communication between the injector node and the database server.
3.2. Scalability of the IoT System
3.3. Measurement Results
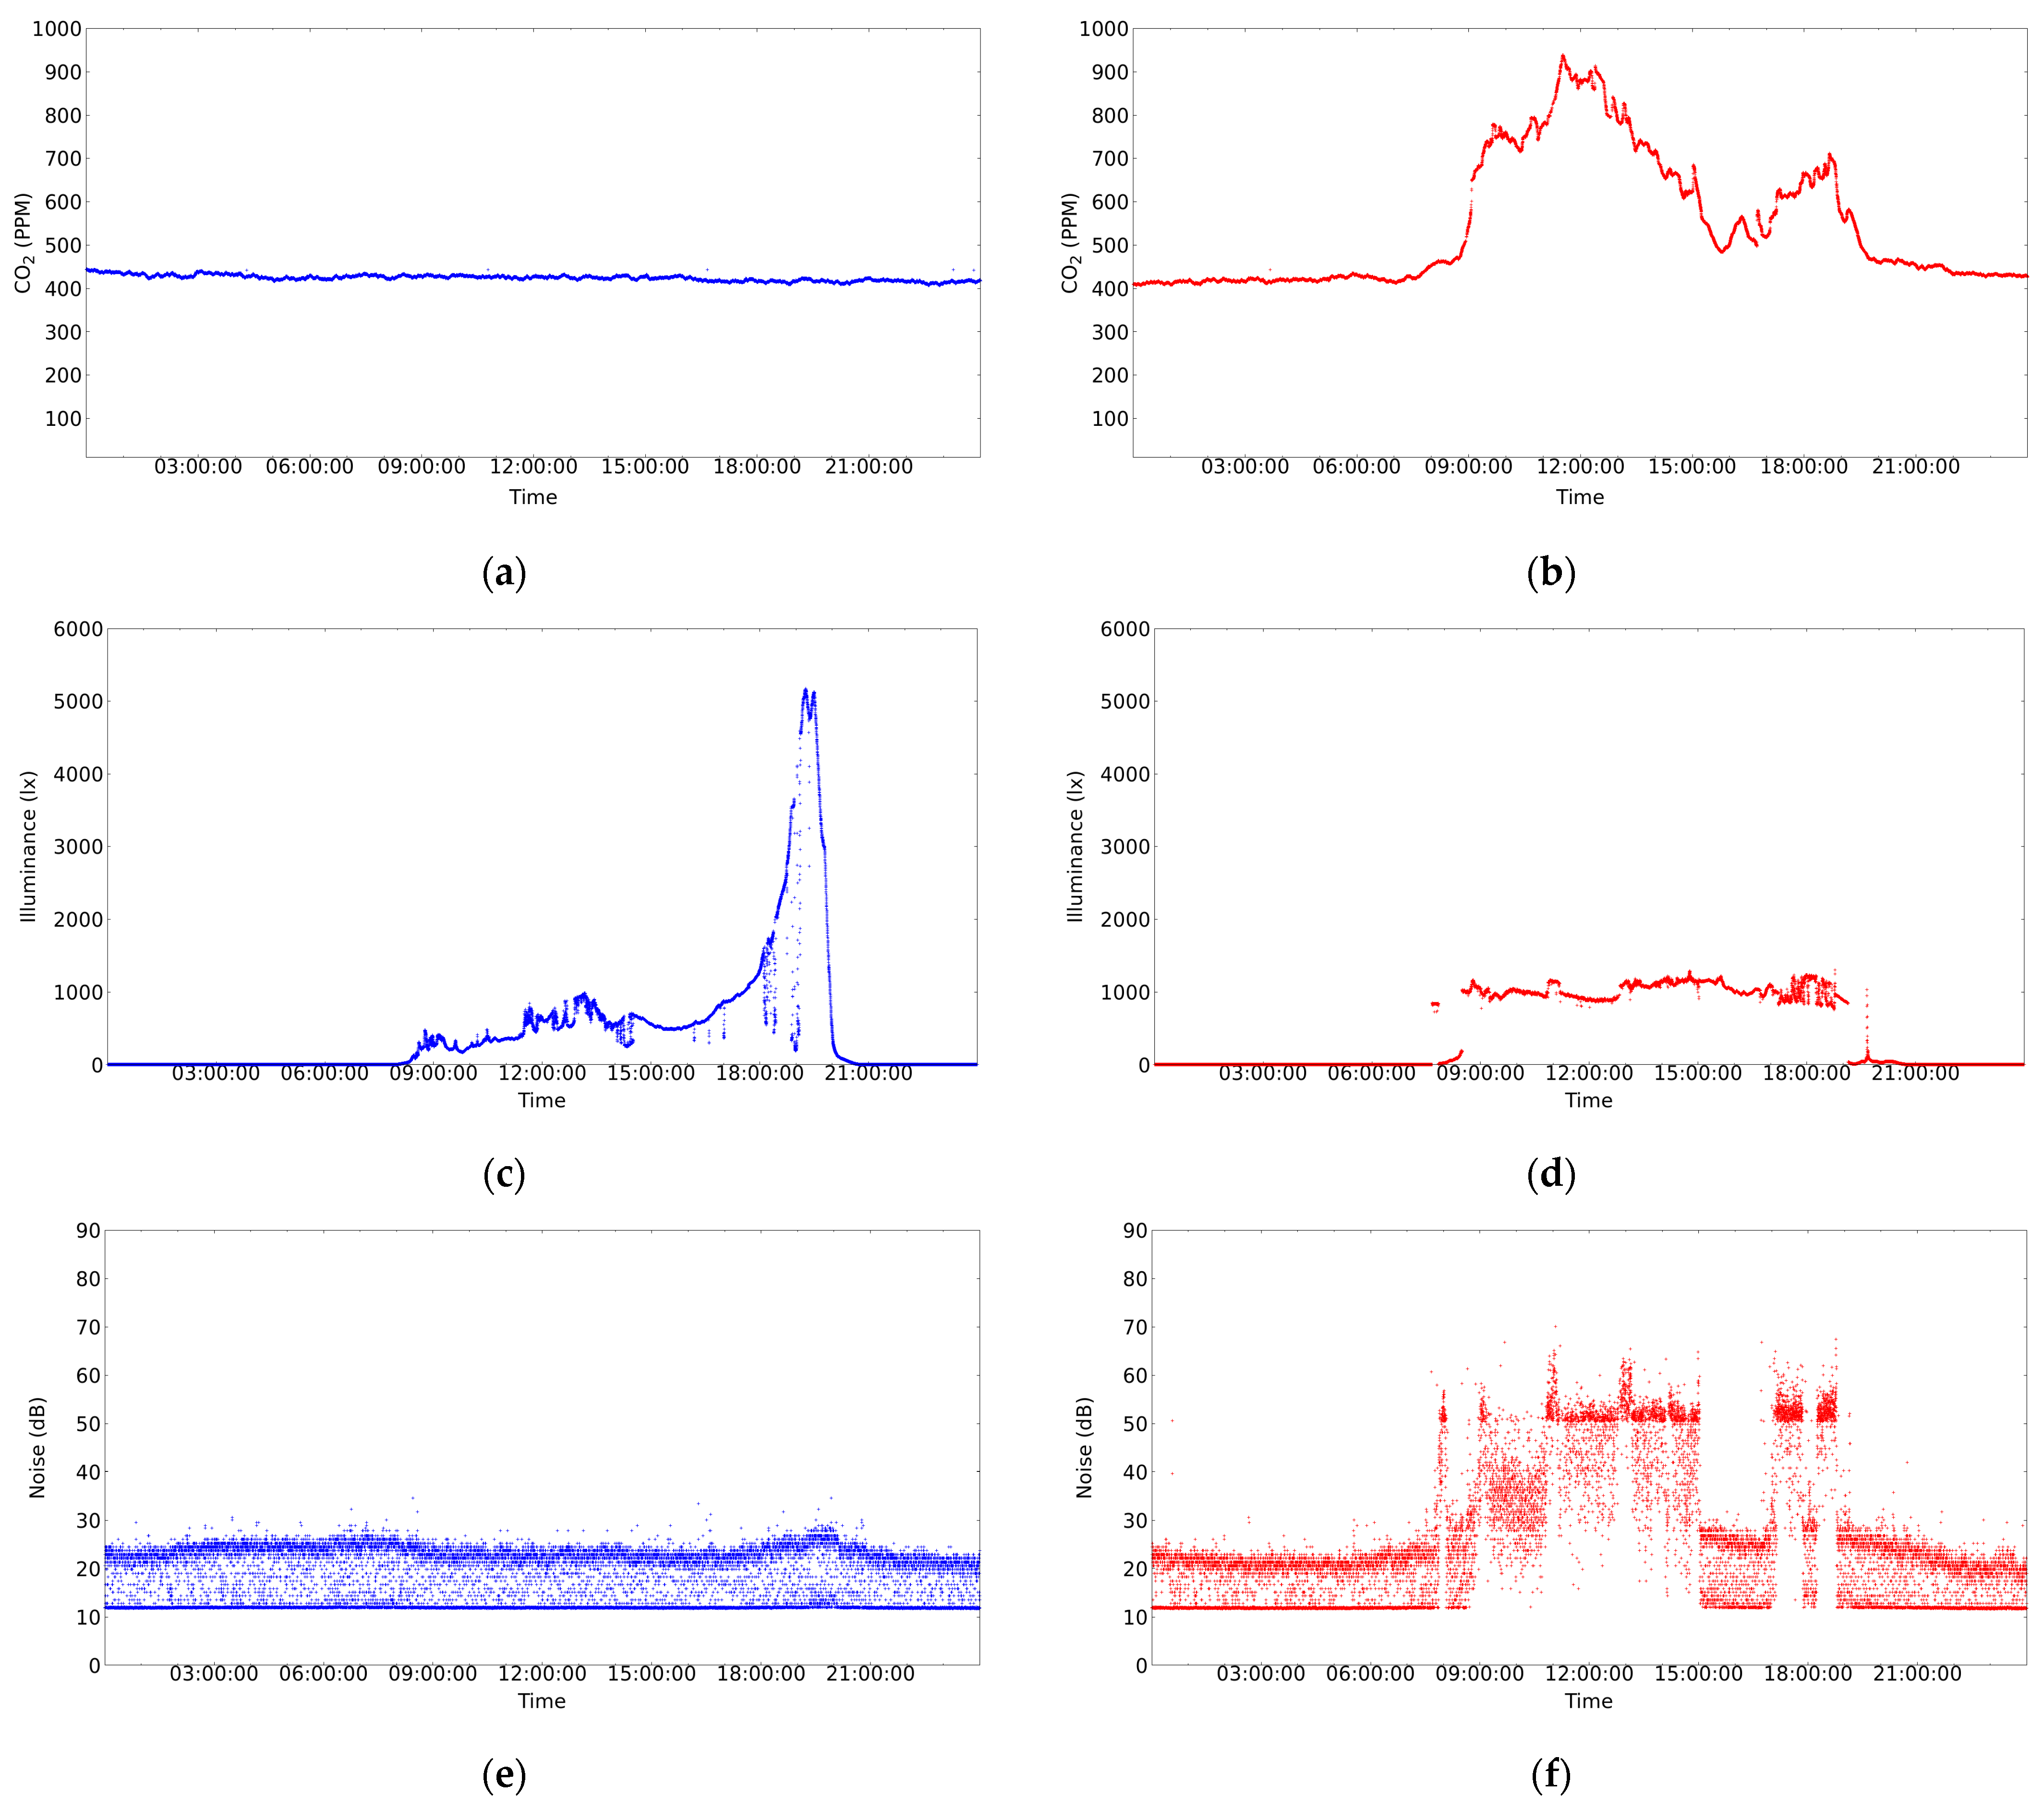
- In Figure 11b, a very significant variation of the CO2 concentration can be observed with respect to Figure 11a. This is due to the fact that in the first case the classroom is occupied and in the second case the classroom is empty. Figure 11b shows that from 00:00 to 08:00 the classroom is empty and, logically, the windows are closed. However, at 08:00, the cleaning assistants enter the classroom and perform the morning task of preparing the classroom. This activity usually takes between 10 and 20 min and is carried out by one to three people. Once the cleaning is done, the classroom is open for students to enter and by 09:00 most students are in the classroom. Note that this is reflected in a significant change in the CO2 concentration of the classroom that occurs in a short interval of time. The class then runs normally for about 110 min. After this time, there is a short break due to the change of subject in the classroom. In addition, it seems that more students attend the next part of the class because the level of CO2 concentration reached is higher than in the previous case. However, between 12:00 and 13:00, the students probably felt uncomfortable with the environmental conditions and may have opened the classroom windows. This must have caused the CO2 concentration to drop, as can be seen in Figure 11b. After that, there was no class from 15:00 to 17:00, although some students may have stayed in the classroom to work. Then, from 17:00 to 19:00, students returned to the classroom. At this point, it is worth mentioning that it is likely that the students came to class gradually because many of them work and it is difficult for them to arrive in time for the start of classes in the afternoon.Finally, at 19:00, there was no class that day, and it was observed that the students left the classroom and the CO2 concentration dropped rapidly. This rapid decrease in CO2 concentration may be due to a janitor entering the classroom and opening the windows. As shown in Figure 11b, after 19:00, the CO2 concentration decreases until it reaches the support level in the Earth’s atmosphere (just over 423 PPM). This level is maintained until 00:00, at which time the next day’s data begins to be recorded.
- Since CO2 is an indicator of the degree of ventilation and pollution level of an indoor space (see Section 2.1), the correlation between this indicator and the number of students in the classroom should be significant. In this paper, from the data shown in Figure 11b, it is experimentally demonstrated that the above correlation is 0.7709802 with p-value = 5.517182 × 10 −58.
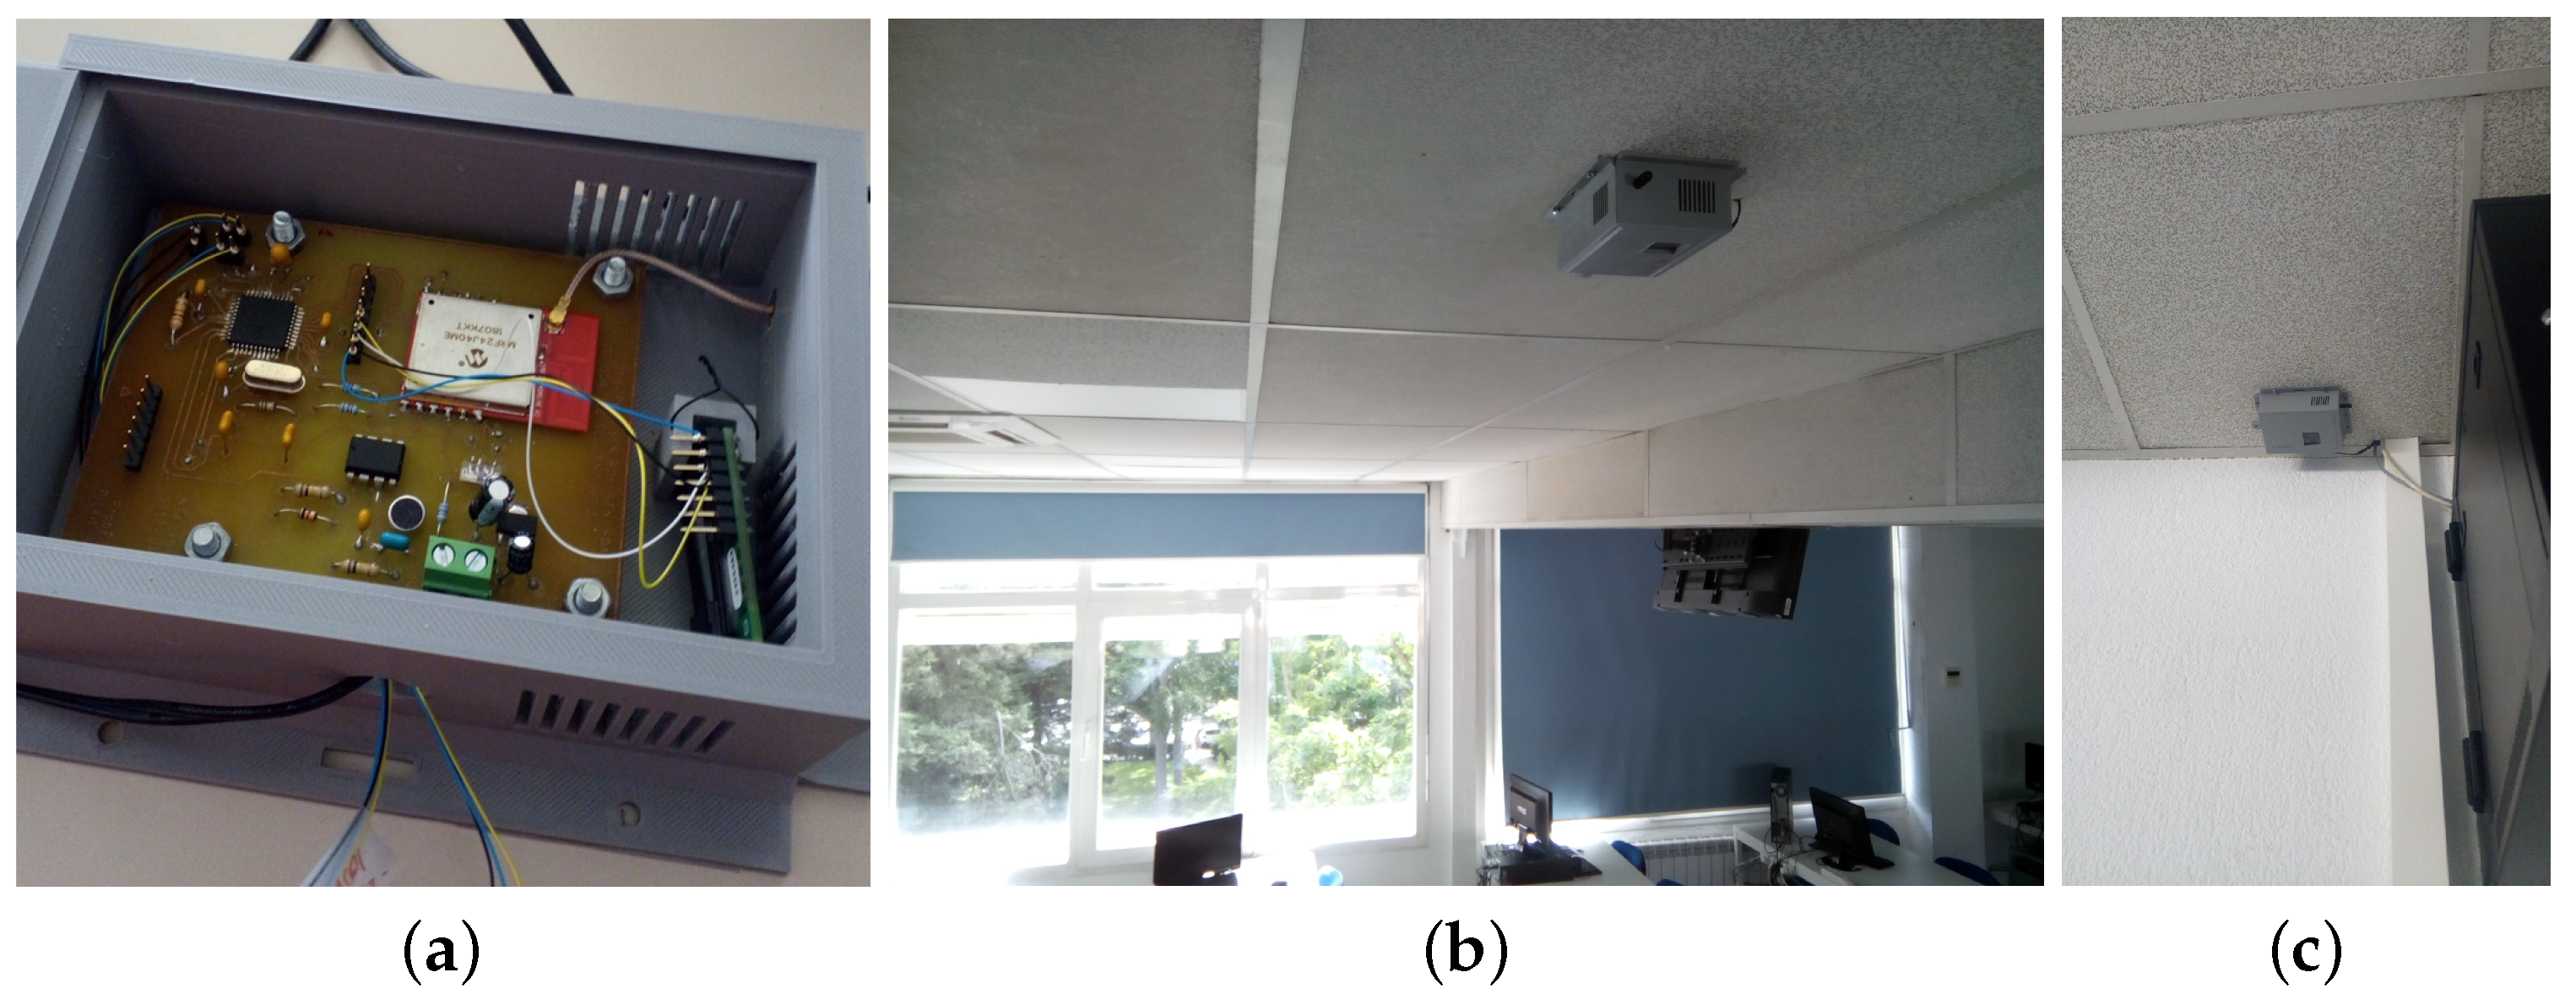
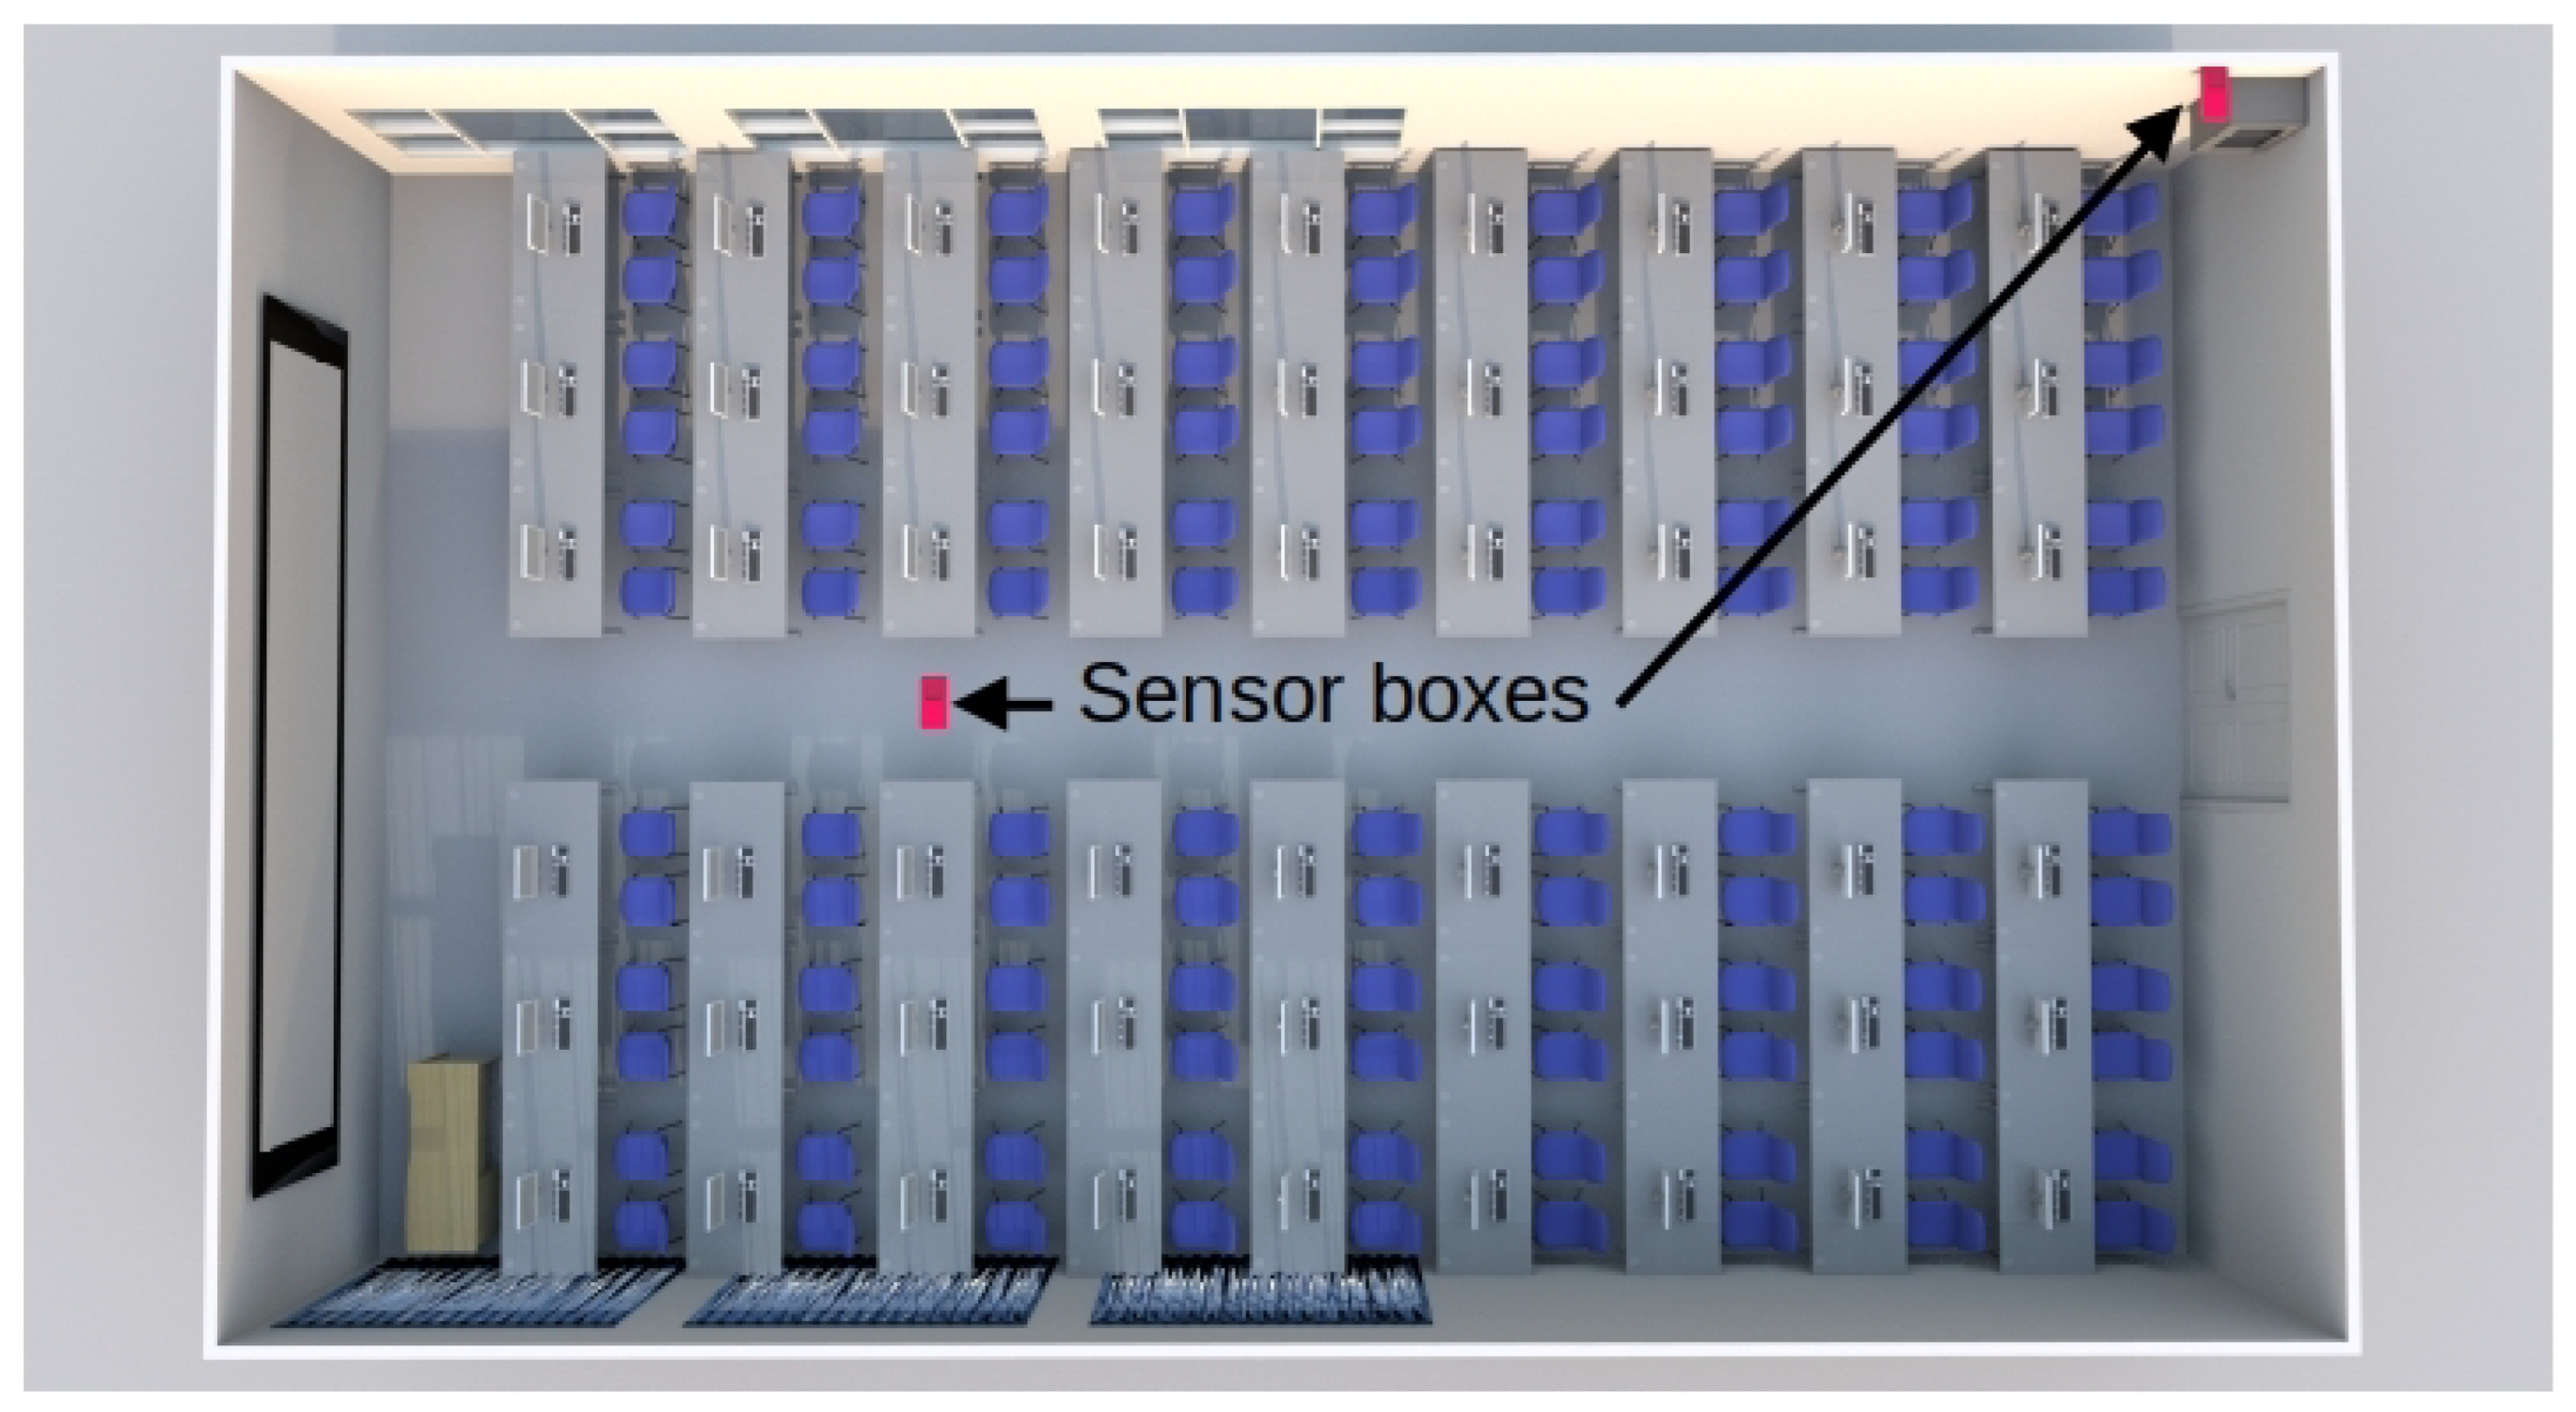
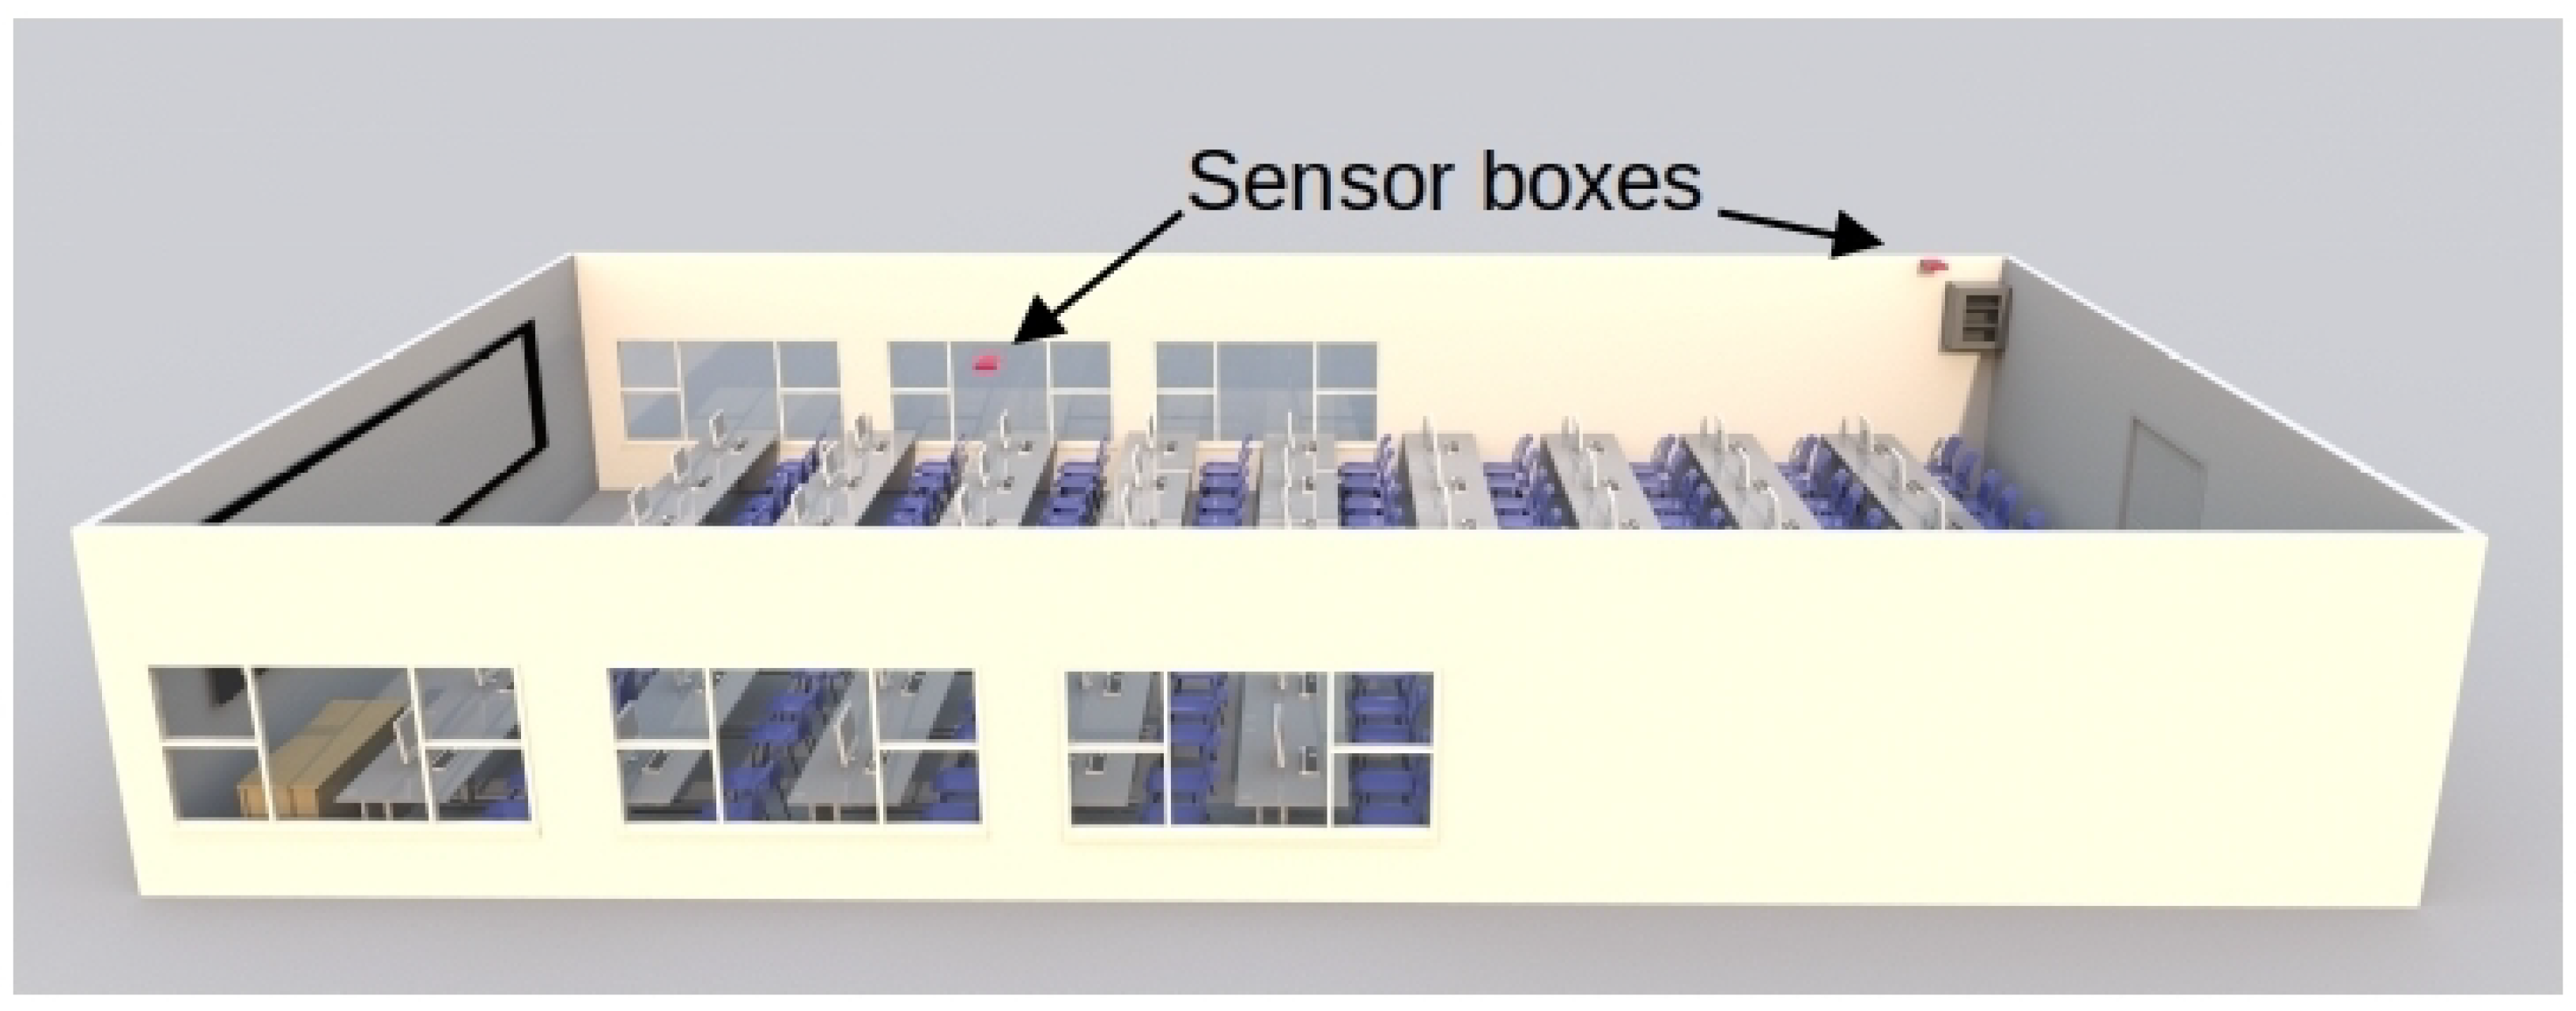
- Figure 11c shows a change in luminosity from 8:00, which increases almost exponentially from 17:00 and drops sharply at 20:00. This is due to the fact that the classroom has windows on its side walls (see Figure 7b), and these have an east–west orientation. In Figure 11c, there are no brightness peaks in the morning, because there are large trees located on the east side of the classroom that filter the light until the sun rises above the lintel of the windows. However, in the afternoon there is an interval of just under two hours in which the sun can enter unobstructed on the west side before setting. On the other hand, Figure 11d shows an almost uniform behavior, because artificial lighting is used practically all day and the sunshades on the west side of the classroom are closed. In summary, Figure 11c shows a luminosity peak around 20:00 on a day when there is no activity in the center. No one is in the classrooms, the sunshades are open, and the sun shines directly into the classroom without any filter and then quickly disappears behind the horizon. On the other hand, on a school day, the students lower the sunshades and turn on the artificial light for the whole day (see Figure 11d).
- Finally, in relation to noise, a relatively uniform behavior can be observed during any given day of the weekend (see Figure 11e). However, it should be clarified that absolute silence is not perceived in the classroom. This is due to the sporadic activity of small wild animals in the garden on the east side of the classroom (such as woodpeckers, blackbirds, and magpies, among others). To this must be added the constantly operating equipment located in the classroom (see communications cabinet to which the classroom computers are connected in Figure 7c).Figure 11f shows the measurement of the sound level in the classroom during a school day. It can be observed that from 0:00 to about 8:00 the recorded noise level is similar to that of a day without classes (e.g., see Figure 11e). At 8:00 a significant peak is detected that lasts for about ten minutes. This corresponds to the activity of the cleaning staff in the classroom. Between 8:00 and 9:00, the noise gradually increases, which could be due to students gradually entering the classroom. At 9:00 there is a peak above 50 dB, which marks the beginning of the first class of the morning, and between 9:00 and 11:00 the noise in the classroom is higher than during the night, with a maximum level around values slightly above 50 dB.Shortly before 11:00, the classroom noise rises for just over 10 min and exceeds 65 dB. This event appears to coincide with a class change and is consistent with a significant number of students remaining in the classroom talking. This is followed by the next class from 11:00 to 13:00. During this time, there seems to be more collaboration in the classroom as there is a higher density of sound samples with values slightly above 50 dB. Again, at the end of the class at 13:00 there is a peak similar to the previous class change, above 60 dB. There is another class from 13:00 to 15:00, and at the end of this class the noise level returns to the base level with a maximum noise value around 25 dB to 30 dB.In the afternoon, there is a class from 17:00 to 19:00, and in the middle of the class there is a break of about 20 min around 18:00. During this break, it seems that most of the students leave the classroom because the noise level drops to the baseline profile, with a ceiling between 25 dB and 30 dB. The class then resumes and ends at 19:00, at which time an abrupt drop in noise is detected. In addition, between 19:00 and 21:30, the noise level gradually decreases as the university center empties of students and workers. Finally, after 21:30, the behavior is similar to that of a day without classes (e.g., see Figure 11e).
3.4. Discussion on the Contribution of This Work Based on the Type of Sensors Used in Other Devices Designed to Measure Indoor Enviromental Variables
4. Conclusions
Author Contributions
Funding
Institutional Review Board Statement
Informed Consent Statement
Data Availability Statement
Acknowledgments
Conflicts of Interest
References
- Wei, G.; Yu, X.; Fang, L.; Wang, Q.; Tanaka, T.; Amano, K.; Yang, X. A review and comparison of the indoor air quality requirements in selected building standards and certifications. Build. Environ. 2022, 226, 109709. [Google Scholar] [CrossRef]
- ASHRAE. Green Guide. Design, Construction, and Operationi of Sustainable Buildings; Techreport; ASHRAE: Atlanta, Georgia, 2018. [Google Scholar]
- Dorizas, P.V.; Groote, M.D.; Volt, J. The Inner Value of a Building. Linking Indoor Environmental Quality and Energy Performance in Building Regulation; Techreport; BPIE: Brussels, Belgium, 2018. [Google Scholar]
- Sansaniwal, S.K.; Kumar, S.; Jain, N.; Mathur, J.; Mathur, S. Towards implementing an indoor environmental quality standard in buildings: A pilot study. Build. Serv. Eng. Res. Technol. 2021, 42, 449–483. [Google Scholar] [CrossRef]
- Rastogi, K.; Lohani, D.; Acharya, D. Context-Aware Monitoring and Control of Ventilation Rate in Indoor Environments Using Internet of Things. IEEE Internet Things J. 2021, 8, 9257–9267. [Google Scholar] [CrossRef]
- Hviid, C.A.; Pedersen, C.; Dabelsteen, K.H. A field study of the individual and combined effect of ventilation rate and lighting conditions on pupils’ performance. Build. Environ. 2020, 171, 106608. [Google Scholar] [CrossRef]
- Kallio, J.; Vildjiounaite, E.; Koivusaari, J.; Räsänen, P.; Similä, H.; Kyllönen, V.; Muuraiskangas, S.; Ronkainen, J.; Rehu, J.; Vehmas, K. Assessment of perceived indoor environmental quality, stress and productivity based on environmental sensor data and personality categorization. Build. Environ. 2020, 175, 106787. [Google Scholar] [CrossRef]
- Wargocki, P.; Wyon, D.P. Ten questions concerning thermal and indoor air quality effects on the performance of office work and schoolwork. Build. Environ. 2017, 112, 359–366. [Google Scholar] [CrossRef]
- Kockat, J.; Dorizas, P.V.; Volt, J.; Staniaszek, D. Quantifying the Benefits of Energy Renovation Investments in Schools, Offices and Hospitals; Techreport; BPIE: Brussels, Belgium, 2018. [Google Scholar]
- Kyriacou, A.; Michaelides, M.P.; Reppa, V.; Timotheou, S.; Panayiotou, C.G.; Polycarpou, M.M. Distributed Contaminant Detection and Isolation for Intelligent Buildings. IEEE Trans. Control. Syst. Technol. 2018, 26, 1925–1941. [Google Scholar] [CrossRef]
- Yang, Y.; Srinivasan, S.; Hu, G.; Spanos, C.J. Distributed Control of Multizone HVAC Systems Considering Indoor Air Quality. IEEE Trans. Control. Syst. Technol. 2021, 29, 2586–2597. [Google Scholar] [CrossRef]
- Yu, L.; Xie, D.; Huang, C.; Jiang, T.; Zou, Y. Energy Optimization of HVAC Systems in Commercial Buildings Considering Indoor Air Quality Management. IEEE Trans. Smart Grid 2019, 10, 5103–5113. [Google Scholar] [CrossRef]
- Yu, L.; Sun, Y.; Xu, Z.; Shen, C.; Yue, D.; Jiang, T.; Guan, X. Multi-Agent Deep Reinforcement Learning for HVAC Control in Commercial Buildings. IEEE Trans. Smart Grid 2021, 12, 407–419. [Google Scholar] [CrossRef]
- Hafez, F.S.; Sa’di, B.; Gamal, S.; Taufiq-Yap, Y.; Alrifaey, M.; Seyedmahmoudian, M.; Stojcevski, A.; Horan, B.; Mekhilef, S. Energy Efficiency in Sustainable Buildings: A Systematic Review with Taxonomy, Challenges, Motivations, Methodological Aspects, Recommendations, and Pathways for Future Research. Energy Strategy Rev. 2023, 45, 101013. [Google Scholar] [CrossRef]
- Yu, L.; Xie, D.; Jiang, T.; Zou, Y.; Wang, K. Distributed Real-Time HVAC Control for Cost-Efficient Commercial Buildings under Smart Grid Environment. IEEE Internet Things J. 2018, 5, 44–55. [Google Scholar] [CrossRef]
- Zhu, H.; Lian, X.; Liu, Y.; Zhang, Y.; Li, Z. Consideration of occupant preferences and habits during the establishment of occupant-centric buildings: A critical review. Energy Build. 2023, 280, 112720. [Google Scholar] [CrossRef]
- Ali, A.S.; Coté, C.; Heidarinejad, M.; Stephens, B. Elemental: An Open-Source Wireless Hardware and Software Platform for Building Energy and Indoor Environmental Monitoring and Control. Sensors 2019, 19, 4017. [Google Scholar] [CrossRef]
- Yaïci, W.; Krishnamurthy, K.; Entchev, E.; Longo, M. Recent Advances in Internet of Things (IoT) Infrastructures for Building Energy Systems: A Review. Sensors 2021, 21, 2152. [Google Scholar] [CrossRef] [PubMed]
- Rizwan, A.; Khan, A.N.; Ahmad, R.; Kim, D.H. Optimal Environment Control Mechanism Based on OCF Connectivity for Efficient Energy Consumption in Greenhouse. IEEE Internet Things J. 2023, 10, 5035–5049. [Google Scholar] [CrossRef]
- Aparicio-Ruiz, P.; Barbadilla-Martín, E.; Guadix, J.; Muñuzuri, J. A field study on adaptive thermal comfort in Spanish primary classrooms during summer season. Build. Environ. 2021, 203, 108089. [Google Scholar] [CrossRef]
- Mishra, A.; Derks, M.; Kooi, L.; Loomans, M.; Kort, H. Analysing thermal comfort perception of students through the class hour, during heating season, in a university classroom. Build. Environ. 2017, 125, 464–474. [Google Scholar] [CrossRef]
- Ganesh, G.A.; Sinha, S.L.; Verma, T.N.; Dewangan, S.K. Investigation of indoor environment quality and factors affecting human comfort: A critical review. Build. Environ. 2021, 204, 108146. [Google Scholar] [CrossRef]
- Kuncoro, C.B.D.; Permana, A.F.; Asyikin, M.B.Z.; Adristi, C. Smart Wireless Climate Sensor Node for Indoor Comfort Quality Monitoring Application. Energies 2022, 15, 2939. [Google Scholar] [CrossRef]
- Sahoh, B.; Kaewrat, C.; Yeranee, K.; Kittiphattanabawon, N.; Kliangkhlao, M. Causal AI-Powered Event Interpretation: A Cause-and-Effect Discovery for Indoor Thermal Comfort Measurements. IEEE Internet Things J. 2022, 9, 23188–23200. [Google Scholar] [CrossRef]
- Hu, W.; Wen, Y.; Guan, K.; Jin, G.; Tseng, K.J. iTCM: Toward Learning-Based Thermal Comfort Modeling via Pervasive Sensing for Smart Buildings. IEEE Internet Things J. 2018, 5, 4164–4177. [Google Scholar] [CrossRef]
- Broday, E.; Gameiro da Silva, M. The role of internet of things (IoT) in the assessment and communication of indoor environmental quality (IEQ) in buildings: A review. Smart Sustain. Built Environ. 2022, 12, 584–606. [Google Scholar] [CrossRef]
- Wei, Y.; Jang-Jaccard, J.; Sabrina, F.; Alavizadeh, H. Large-Scale Outlier Detection for Low-Cost PM10 Sensors. IEEE Access 2020, 8, 229033–229042. [Google Scholar] [CrossRef]
- Zhao, L.; Wu, W.; Li, S. Design and Implementation of an IoT-Based Indoor Air Quality Detector With Multiple Communication Interfaces. IEEE Internet Things J. 2019, 6, 9621–9632. [Google Scholar] [CrossRef]
- Salamone, F.; Belussi, L.; Danza, L.; Ghellere, M.; Meroni, I. Design and Development of nEMoS, an All-in-One, Low-Cost, Web-Connected and 3D-Printed Device for Environmental Analysis. Sensors 2015, 15, 13012–13027. [Google Scholar] [CrossRef] [PubMed]
- Quan Pham, N.; Rachim, V.P.; Chung, W.Y. EMI-Free Bidirectional Real-Time Indoor Environment Monitoring System. IEEE Access 2019, 7, 5714–5722. [Google Scholar] [CrossRef]
- Folea, S.C.; Mois, G.D. Lessons Learned From the Development of Wireless Environmental Sensors. IEEE Trans. Instrum. Meas. 2020, 69, 3470–3480. [Google Scholar] [CrossRef]
- Whittem, V.; Roetzel, A.; Sadick, A.M.; Nakai Kidd, A. How comprehensive is post-occupancy feedback on school buildings for architects? A conceptual review based upon Integral Sustainable Design principles. Build. Environ. 2022, 218, 109109. [Google Scholar] [CrossRef]
- Peters, T. Data Buildings: Sensor Feedback in Sustainable Design Workflows. Archit. Des. 2018, 88, 92–101. [Google Scholar] [CrossRef]
- Berger, C.; Mahdavi, A.; Azar, E.; Bandurski, K.; Bourikas, L.; Harputlugil, T.; Hellwig, R.; Rupp, R.; Schweiker, M. Reflections on the Evidentiary Basis of Indoor Air Quality Standards. Energies 2022, 15, 7727. [Google Scholar] [CrossRef]
- Simmonds, P. ASHRAE Design Guide for Tall, Supertall, and Megatall Building Systems; Techreport; ASHRAE and CTBUH: Atlanta, GA, USA, 2020. [Google Scholar]
- Kunkel, S.; Kontonasiou, E.; Arcipowska, A.; Mariottini, F.; Atanasiu, B. Indoor Air Quality Thermal Comfort and Daylight. Analysis of Residential Building Regulations in Eight EU Member States; Buildings Performance Institute Europe (BPIE): Brussels, Belgium, 2015. [Google Scholar]
- Sheng, M.; Reiner, M.; Sun, K.; Hong, T. Assessing thermal resilience of an assisted living facility during heat waves and cold snaps with power outages. Build. Environ. 2023, 230, 110001. [Google Scholar] [CrossRef]
- Sun, K.; Specian, M.; Hong, T. Nexus of thermal resilience and energy efficiency in buildings: A case study of a nursing home. Build. Environ. 2020, 177, 106842. [Google Scholar] [CrossRef]
- Giwa, S.O.; Oladosu, J.O.; Sulaiman, M.A.; Taziwa, R.T.; Sharifpur, M. Influence of stove locations and ventilation conditions on kitchen air quality and thermal comfort during oil-cooking activities. Atmos. Pollut. Res. 2023, 14, 101882. [Google Scholar] [CrossRef]
- Opitz-Stapleton, S.; Sabbag, L.; Hawley, K.; Tran, P.; Hoang, L.; Nguyen, P.H. Heat index trends and climate change implications for occupational heat exposure in Da Nang, Vietnam. Clim. Serv. 2016, 2–3, 41–51. [Google Scholar] [CrossRef]
- Teare, J.; Mathee, A.; Naicker, N.; Swanepoel, C.; Kapwata, T.; Balakrishna, Y.; du Preez, D.; Millar, D.; Wright, C. Dwelling Characteristics Influence Indoor Temperature and May Pose Health Threats in LMICs. Ann. Glob. Health 2020, 86, 91. [Google Scholar] [CrossRef]
- Fabbri, K. Thermal Comfort Perception: A Questionnaire Approach Focusing on Children, 2nd ed.; Springer Nature Switzerland AG: Cham, Switzerland, 2024. [Google Scholar] [CrossRef]
- Steadman, R.G. The Assessment of Sultriness. Part I: A Temperature-Humidity Index Based on Human Physiology and Clothing Science. J. Appl. Meteorol. Climatol. 1979, 18, 861–873. [Google Scholar] [CrossRef]
- Australian Building Codes Board. Indoor Air Quality Verification Methods: Handbook; The Australian Building Codes Board: Canberra, Australia, 2023. [Google Scholar]
- IEEE Std. 802.15.4-2020; IEEE Standard for Low-Rate Wireless Networks. IEEE: New York, NY, USA, 2020.
- Stone, W.C. NIST Constructioni Automation Program Report No. 3. Electromagnetic Signal Attenuation in Construction Materials; Techreport NISTIR 6055; NIST (National Institute of Standards and Technology): Gaithersburg, MD, USA, 1997. [Google Scholar]
- Vizi, G.N.; Vandenbosch, G.A. Building materials and electromagnetic radiation: The role of material and shape. J. Build. Eng. 2016, 5, 96–103. [Google Scholar] [CrossRef]
- Young, W.F.; Holloway, C.L.; Koepke, G.; Camell, D.; Becquet, Y.; Remley, K.A. Radio-Wave Propagation Into Large Building Structures—Part 1: CW Signal Attenuation and Variability. IEEE Trans. Antennas Propag. 2010, 58, 1279–1289. [Google Scholar] [CrossRef]
- Tiele, A.; Esfahani, S.; Covington, J. Design and Development of a Low-Cost, Portable Monitoring Device for Indoor Environment Quality. J. Sens. 2018, 2018, 5353816. [Google Scholar] [CrossRef]


| Device | Accuracy | Measurement Range | Other Specifications |
|---|---|---|---|
| VEML7700 | N/A | 0–167,000 lx | Ambient Light |
| (Vishay Intertechnology | Resolution: 0.005 lx | ||
| Malvern, PA, USA) | I2C Bus Voltage | ||
| Range: 1.7 V to 3.6 V | |||
| SCD30 CO2 | ±(30 ppm + 3%) | 0–40,000 ppm | Repeatability: |
| (Sensirion AG | 10 ppm | ||
| Stäfa, Switzerland) | Temperature | ||
| stability: 2.5 ppm/°C | |||
| SHT31 Temperature | ±0.5 °C | −40–120 °C | Repeatability: |
| (Sensirion AG | 0.1 °C | ||
| Stäfa, Switzerland) | |||
| SHT31 Humidity | ±2% RH | 0% RH–100% RH | Repeatability: |
| (Sensirion AG | 0.1% RH | ||
| Stäfa, Switzerland) | |||
| MKD1365 | N/A | N/A | Sensitivity: |
| (Kingstate Electronics Corp. | −40 ± 3 dB | ||
| Taipei Hsien, Taiwan) | Signal to noise | ||
| ration: 58 dBA | |||
| Output impedance: | |||
| 2.2 KΩ | |||
| Frequency: | |||
| 20–20,000 Hz | |||
| Directivity: | |||
| Omnidirectional |
| Time | Monday | Tuesday | Wednesday | Thursday | Friday | Saturday | Sunday |
|---|---|---|---|---|---|---|---|
| 9:00–11:00 | 102 (DB 1) | 102 (DB 1) | 103 (AL 2) | 92 (CA 3) | |||
| 11:00–13:00 | 103 (AL 2) | 96 (OOP 4) | 92 (CA 3) | 96 (OOP 4) | |||
| 13:00–15:00 | 107 (AI 5) | 102 (DB 1) | |||||
| 15:00–17:00 | 102 (AL 2) | 101 (DB 1) | |||||
| 17:00–19:00 | 95 (OOP 4) | 101 (DB 1) | 95 (OOP 4) | 91 (CA 3) | |||
| 19:00–21:00 | 101 (DB 1) | 91 (CA 3) | 107 (AI 5) | 102 (AL 2) |
| Reference | Temperature | Relative Humidity | Illuminance Concentration | CO2 Level | Sound | Others |
|---|---|---|---|---|---|---|
| Ali et al. [17] | × | × | × | × | × | |
| Aparicio-Ruiz et al. [20] | × | × | × | × | ||
| Mishra et al. [21] | × | × | × | × | ||
| Kuncoro et al. [23] | × | × | ||||
| Sahoh et al. [24] | × | × | × | |||
| Wei et al. [27] | × | × | × | × | ||
| Zhao et al. [28] | × | × | × | |||
| Salomone et al. [29] | × | × | × | × | × | |
| Phan et al. [30] | × | × | × | × | ||
| Folea and Mois [31] | × | × | × | × | × | |
| Tiele et al. [49] | × | × | × | × | × |
Disclaimer/Publisher’s Note: The statements, opinions and data contained in all publications are solely those of the individual author(s) and contributor(s) and not of MDPI and/or the editor(s). MDPI and/or the editor(s) disclaim responsibility for any injury to people or property resulting from any ideas, methods, instructions or products referred to in the content. |
© 2024 by the authors. Licensee MDPI, Basel, Switzerland. This article is an open access article distributed under the terms and conditions of the Creative Commons Attribution (CC BY) license (https://creativecommons.org/licenses/by/4.0/).
Share and Cite
Hernandez, W.; Cañas, N. Sensing Classroom Temperature, Relative Humidity, Illuminance, CO2, and Noise: An Integral Solution Based on an IoT Device for Dense Deployments. Sensors 2024, 24, 5129. https://doi.org/10.3390/s24165129
Hernandez W, Cañas N. Sensing Classroom Temperature, Relative Humidity, Illuminance, CO2, and Noise: An Integral Solution Based on an IoT Device for Dense Deployments. Sensors. 2024; 24(16):5129. https://doi.org/10.3390/s24165129
Chicago/Turabian StyleHernandez, Wilmar, and Norberto Cañas. 2024. "Sensing Classroom Temperature, Relative Humidity, Illuminance, CO2, and Noise: An Integral Solution Based on an IoT Device for Dense Deployments" Sensors 24, no. 16: 5129. https://doi.org/10.3390/s24165129
APA StyleHernandez, W., & Cañas, N. (2024). Sensing Classroom Temperature, Relative Humidity, Illuminance, CO2, and Noise: An Integral Solution Based on an IoT Device for Dense Deployments. Sensors, 24(16), 5129. https://doi.org/10.3390/s24165129


