
Snapshot Multi-Wavelength Birefringence Imaging
Abstract
:1. Introduction
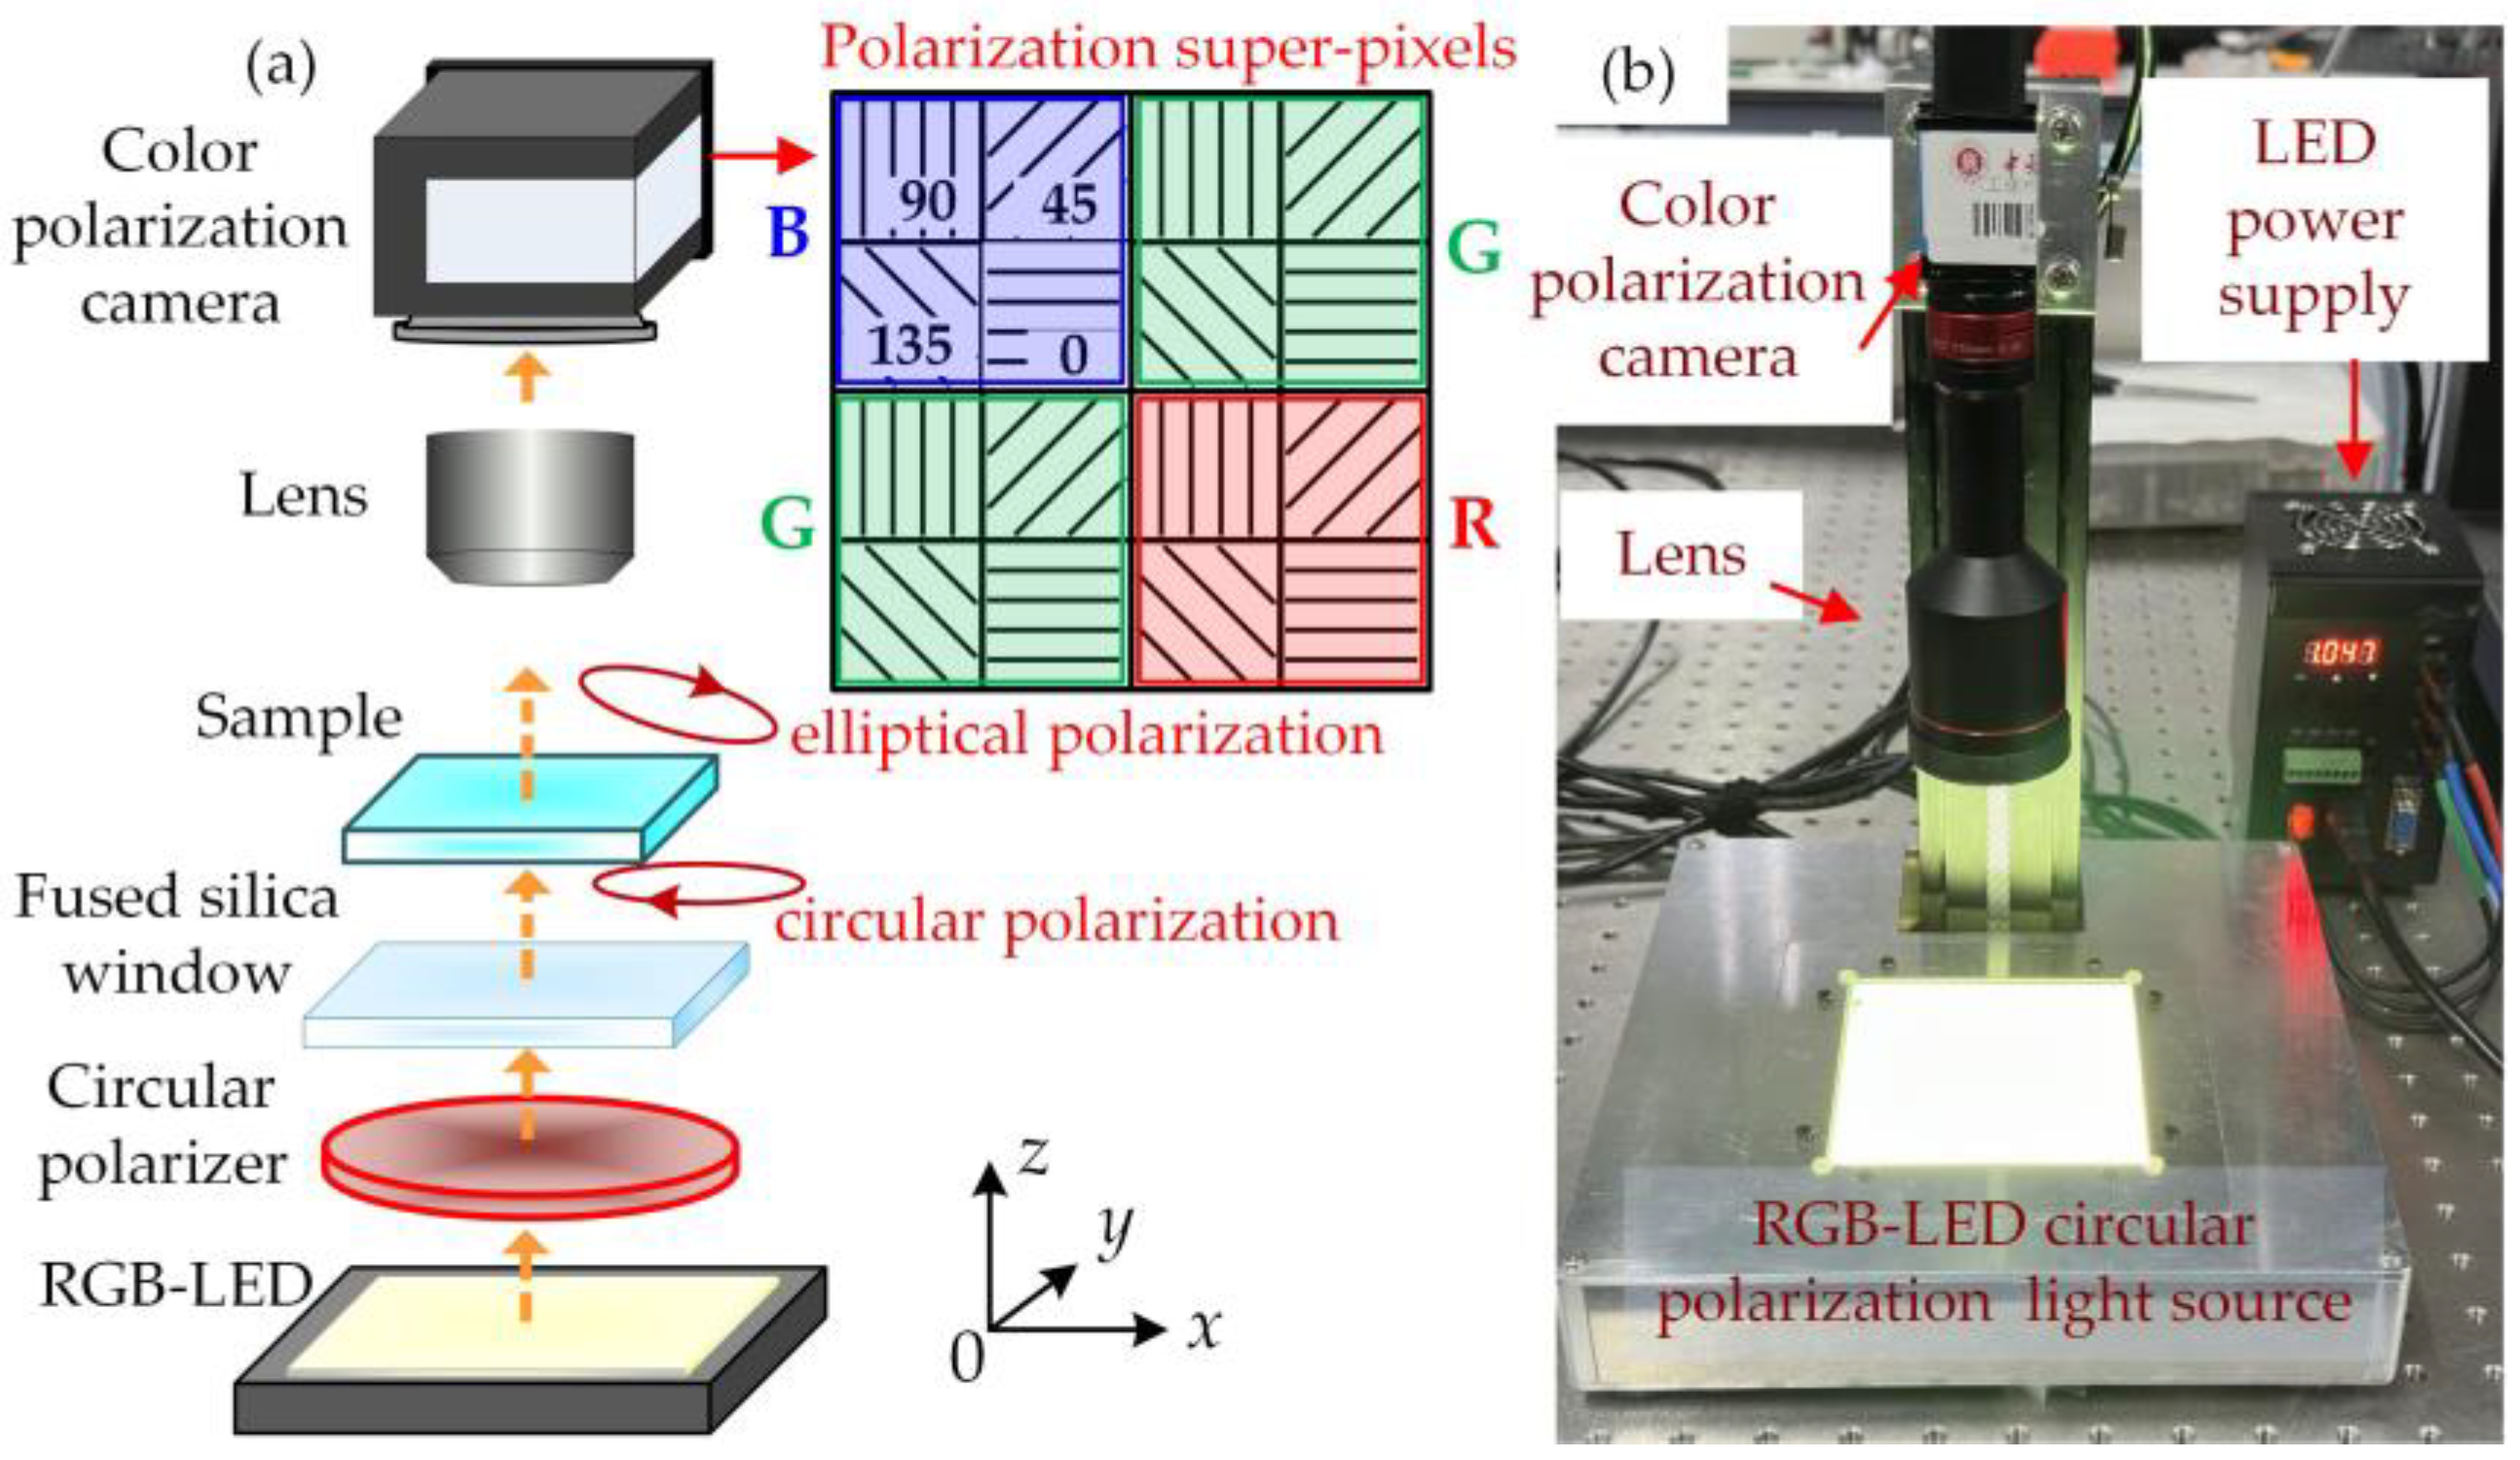
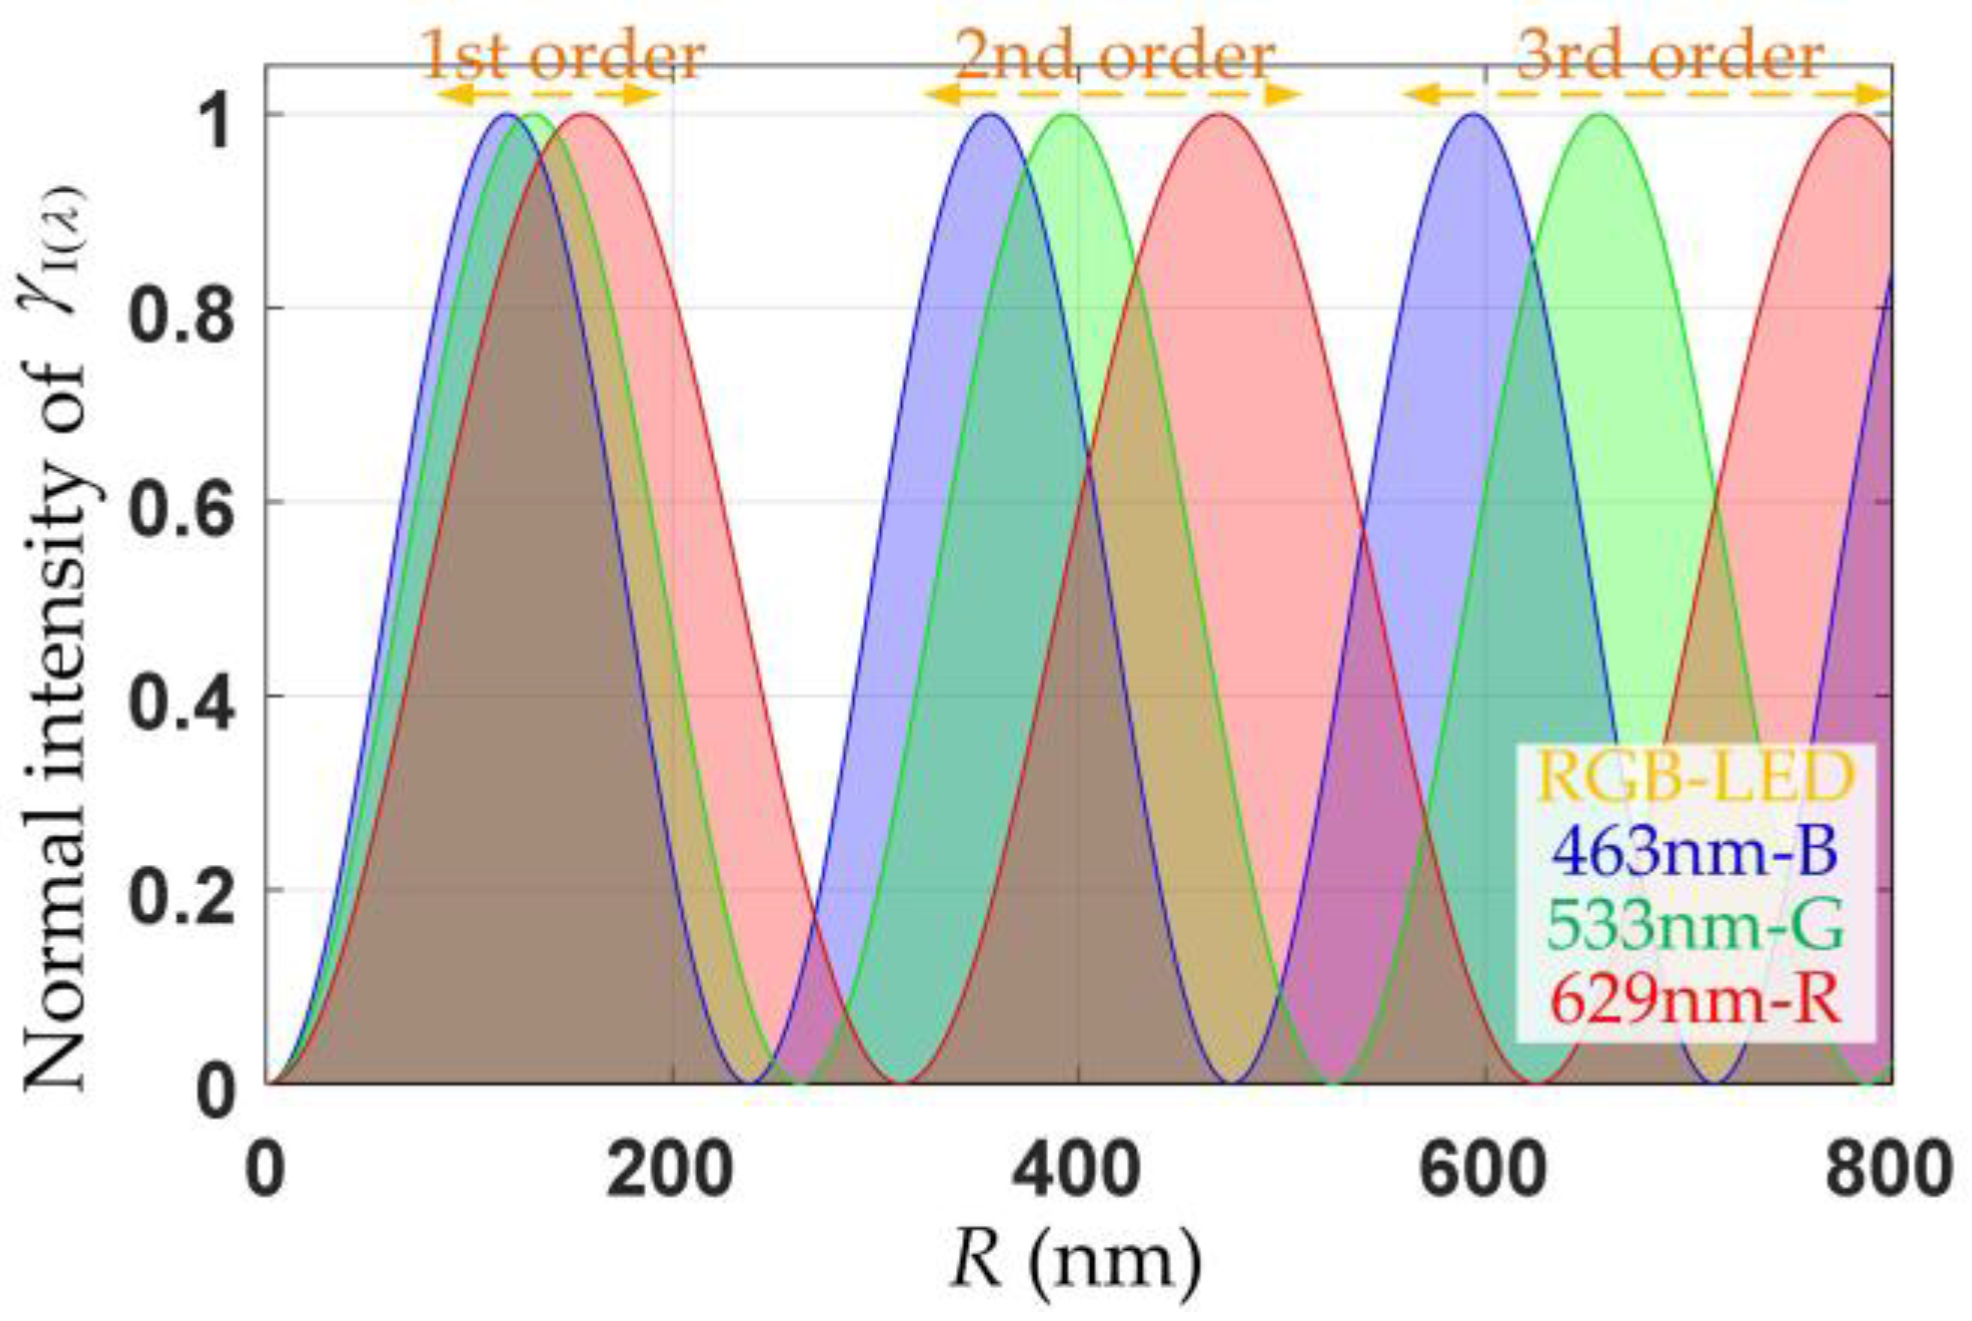
2. Methods
3. Experiments
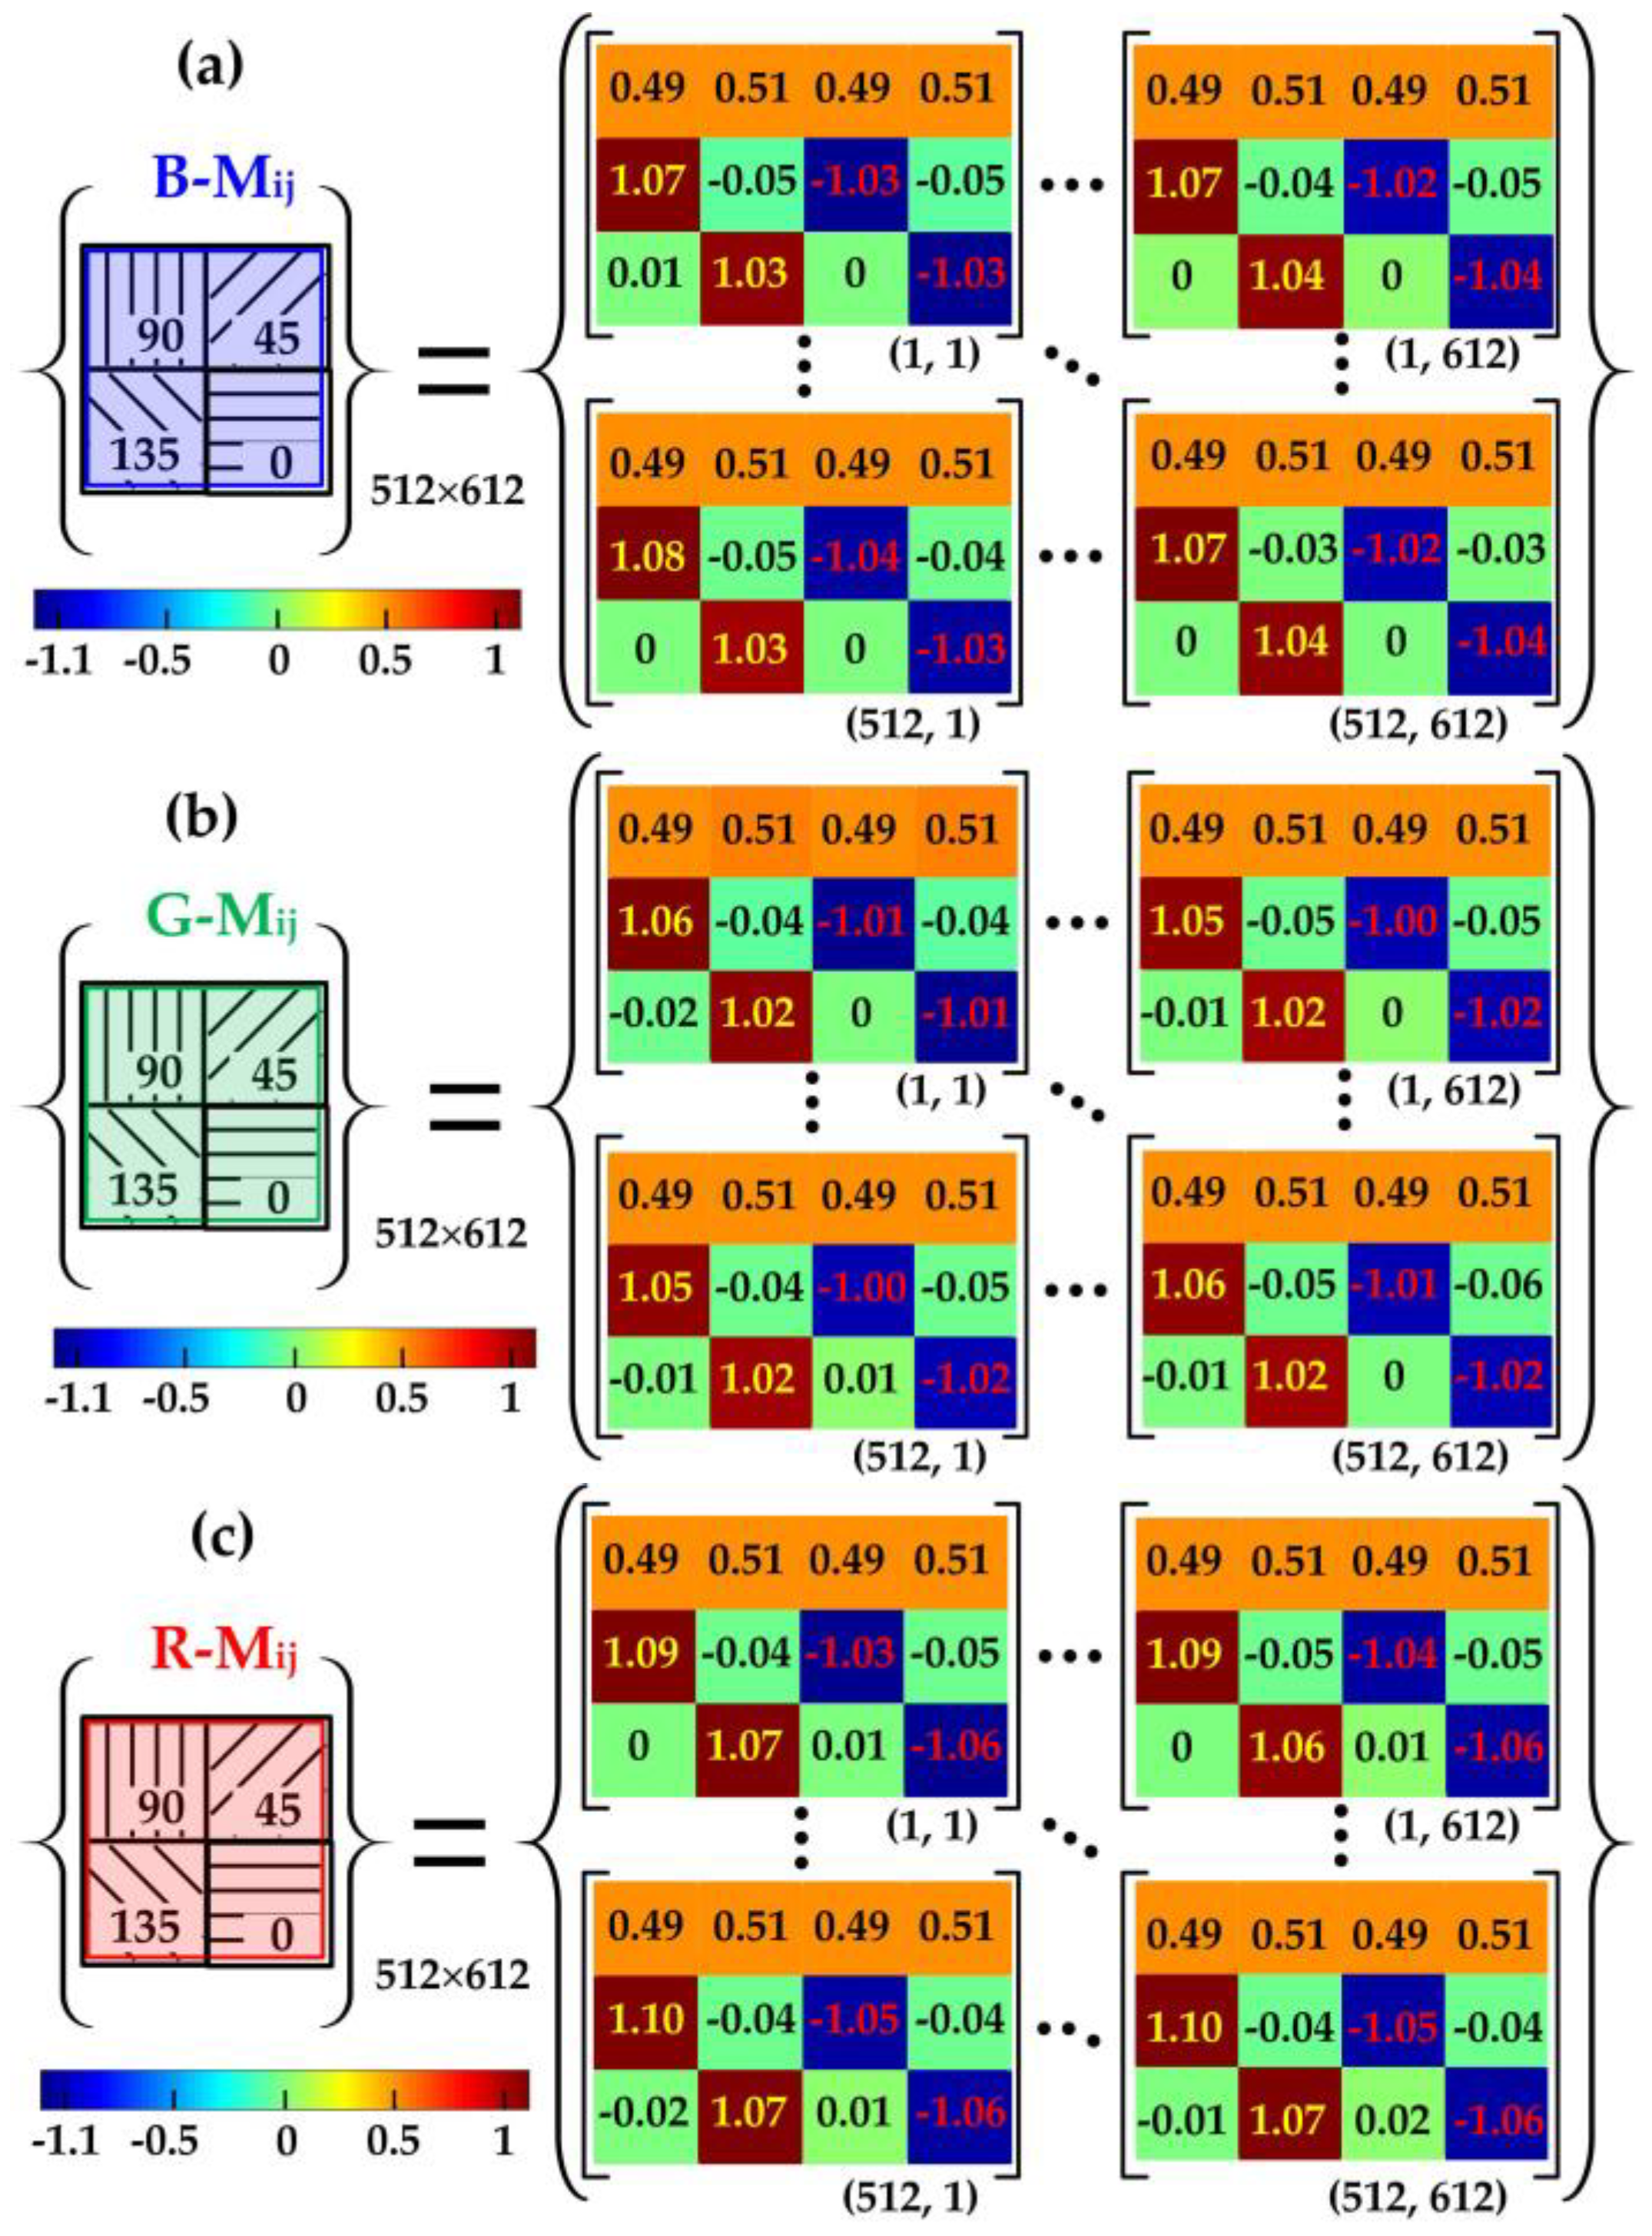
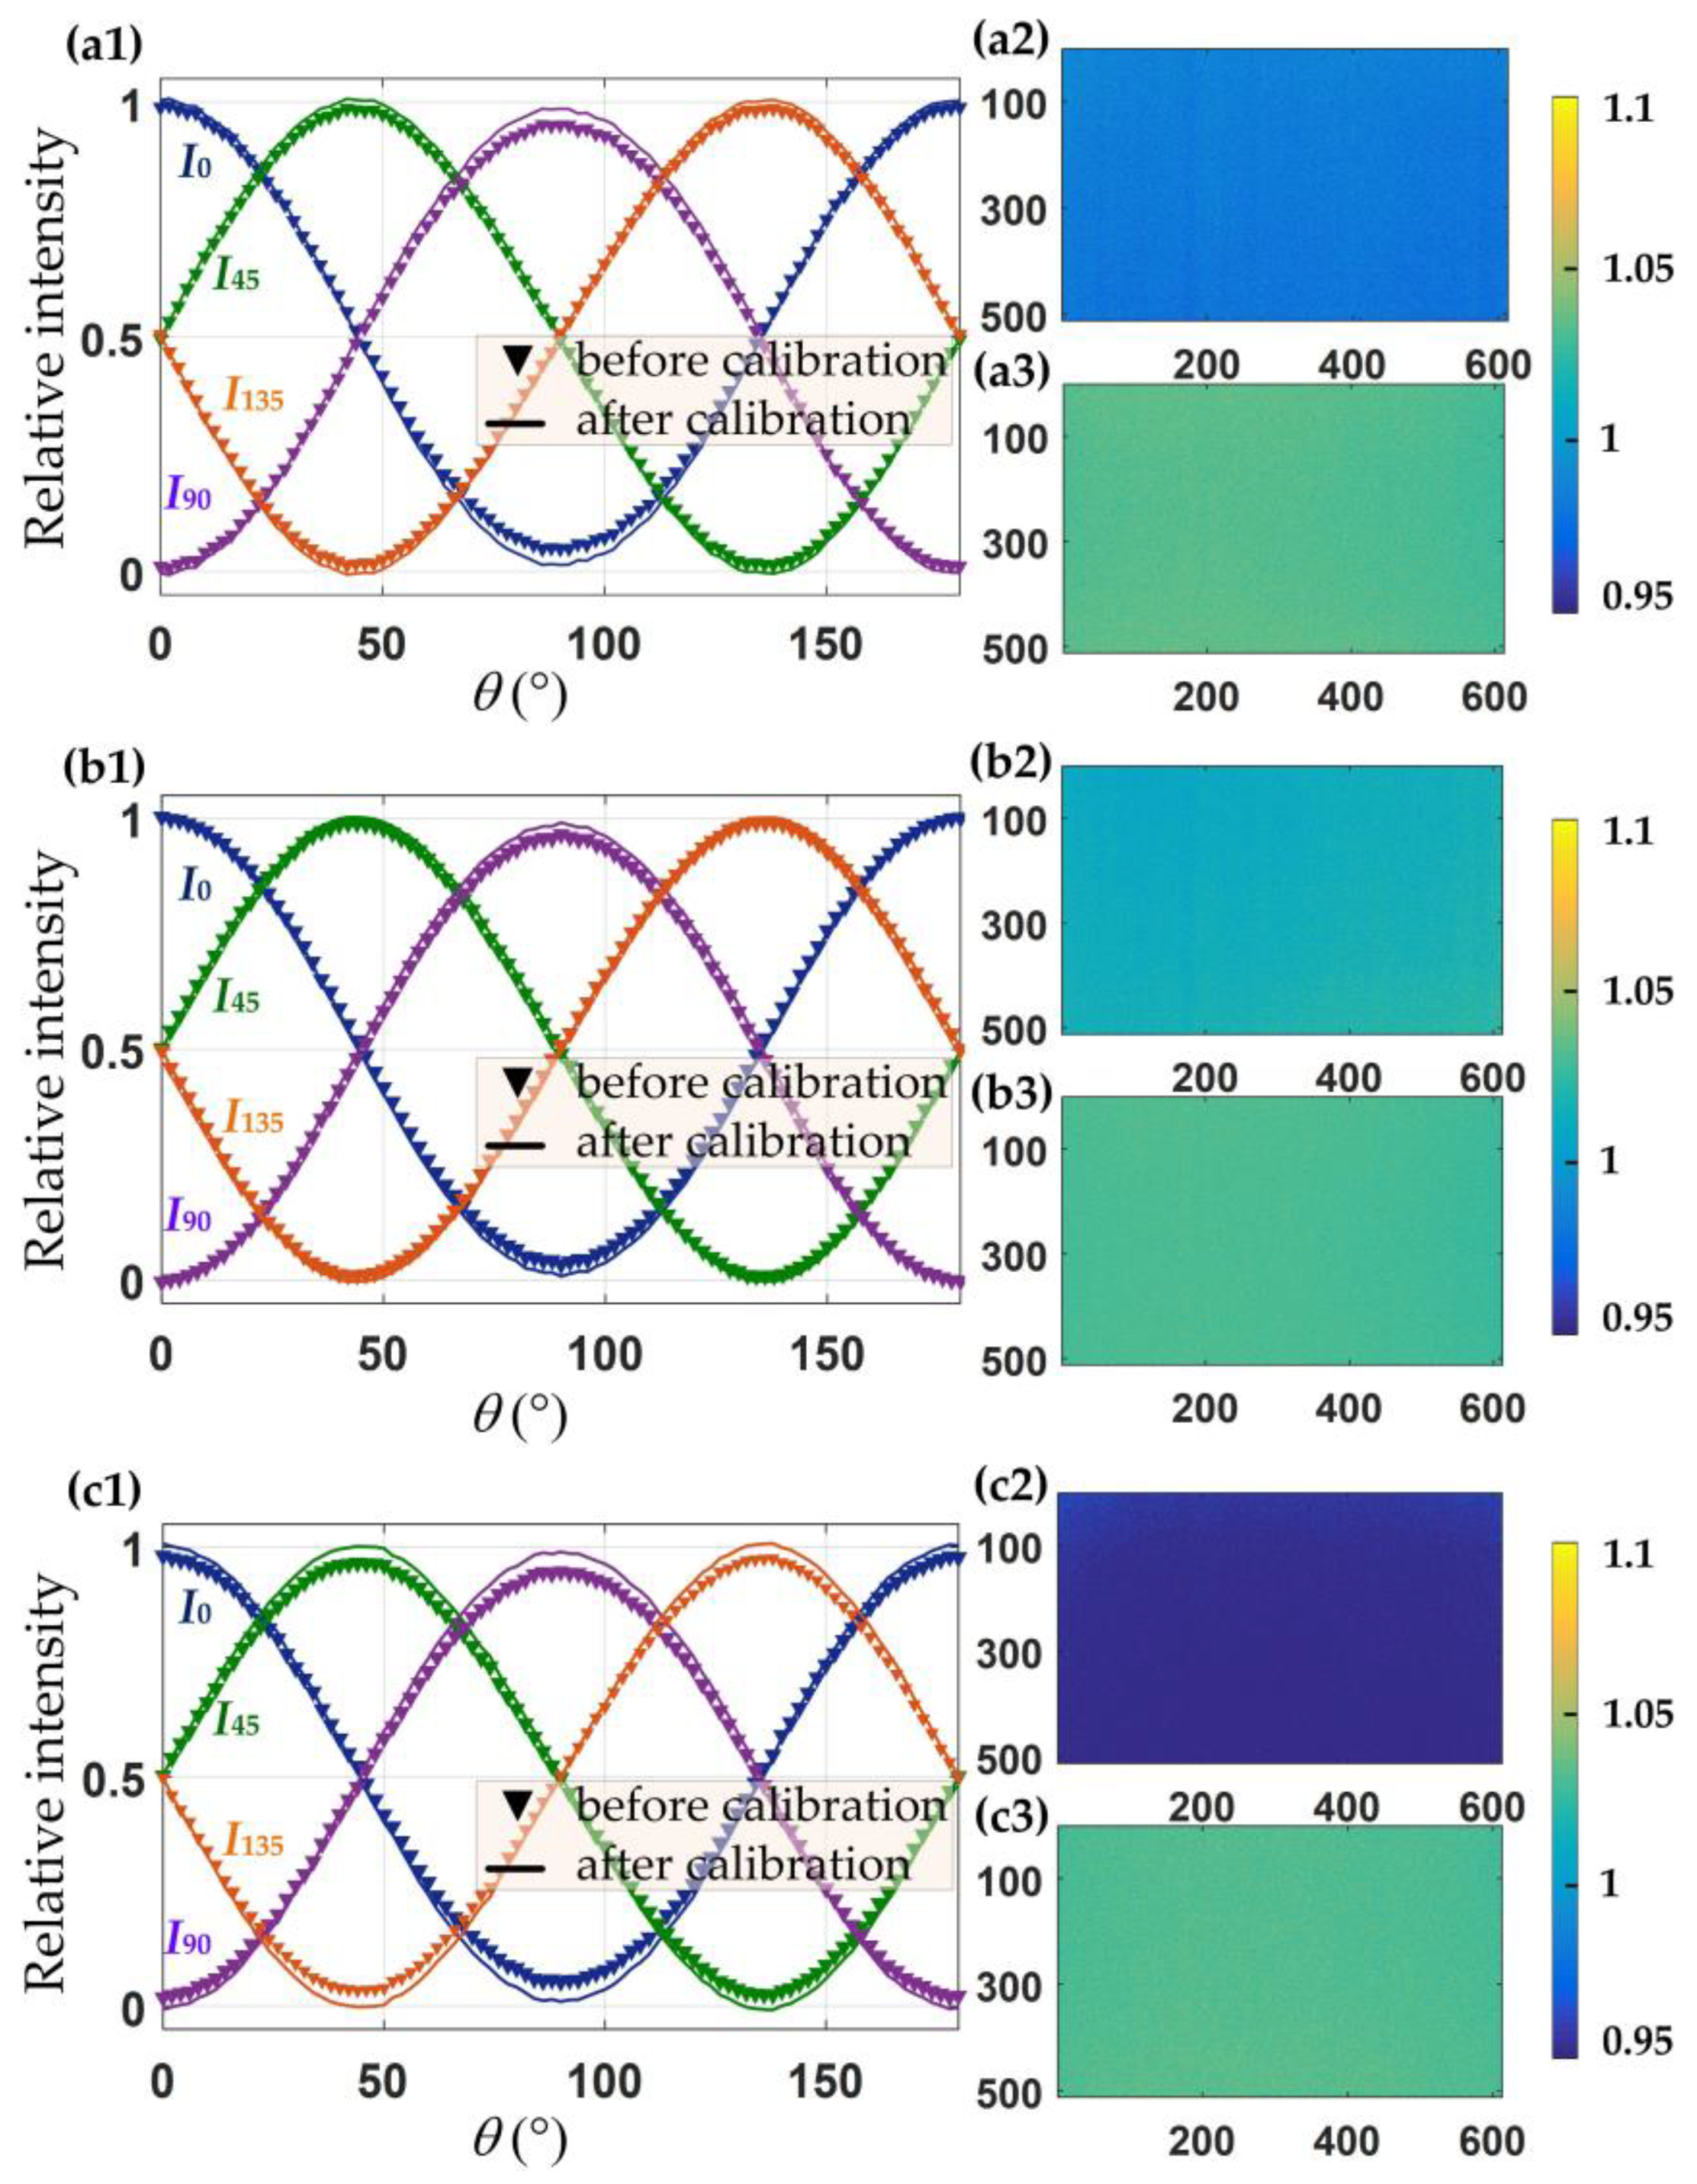
3.1. Camera Polarization Response Calibration
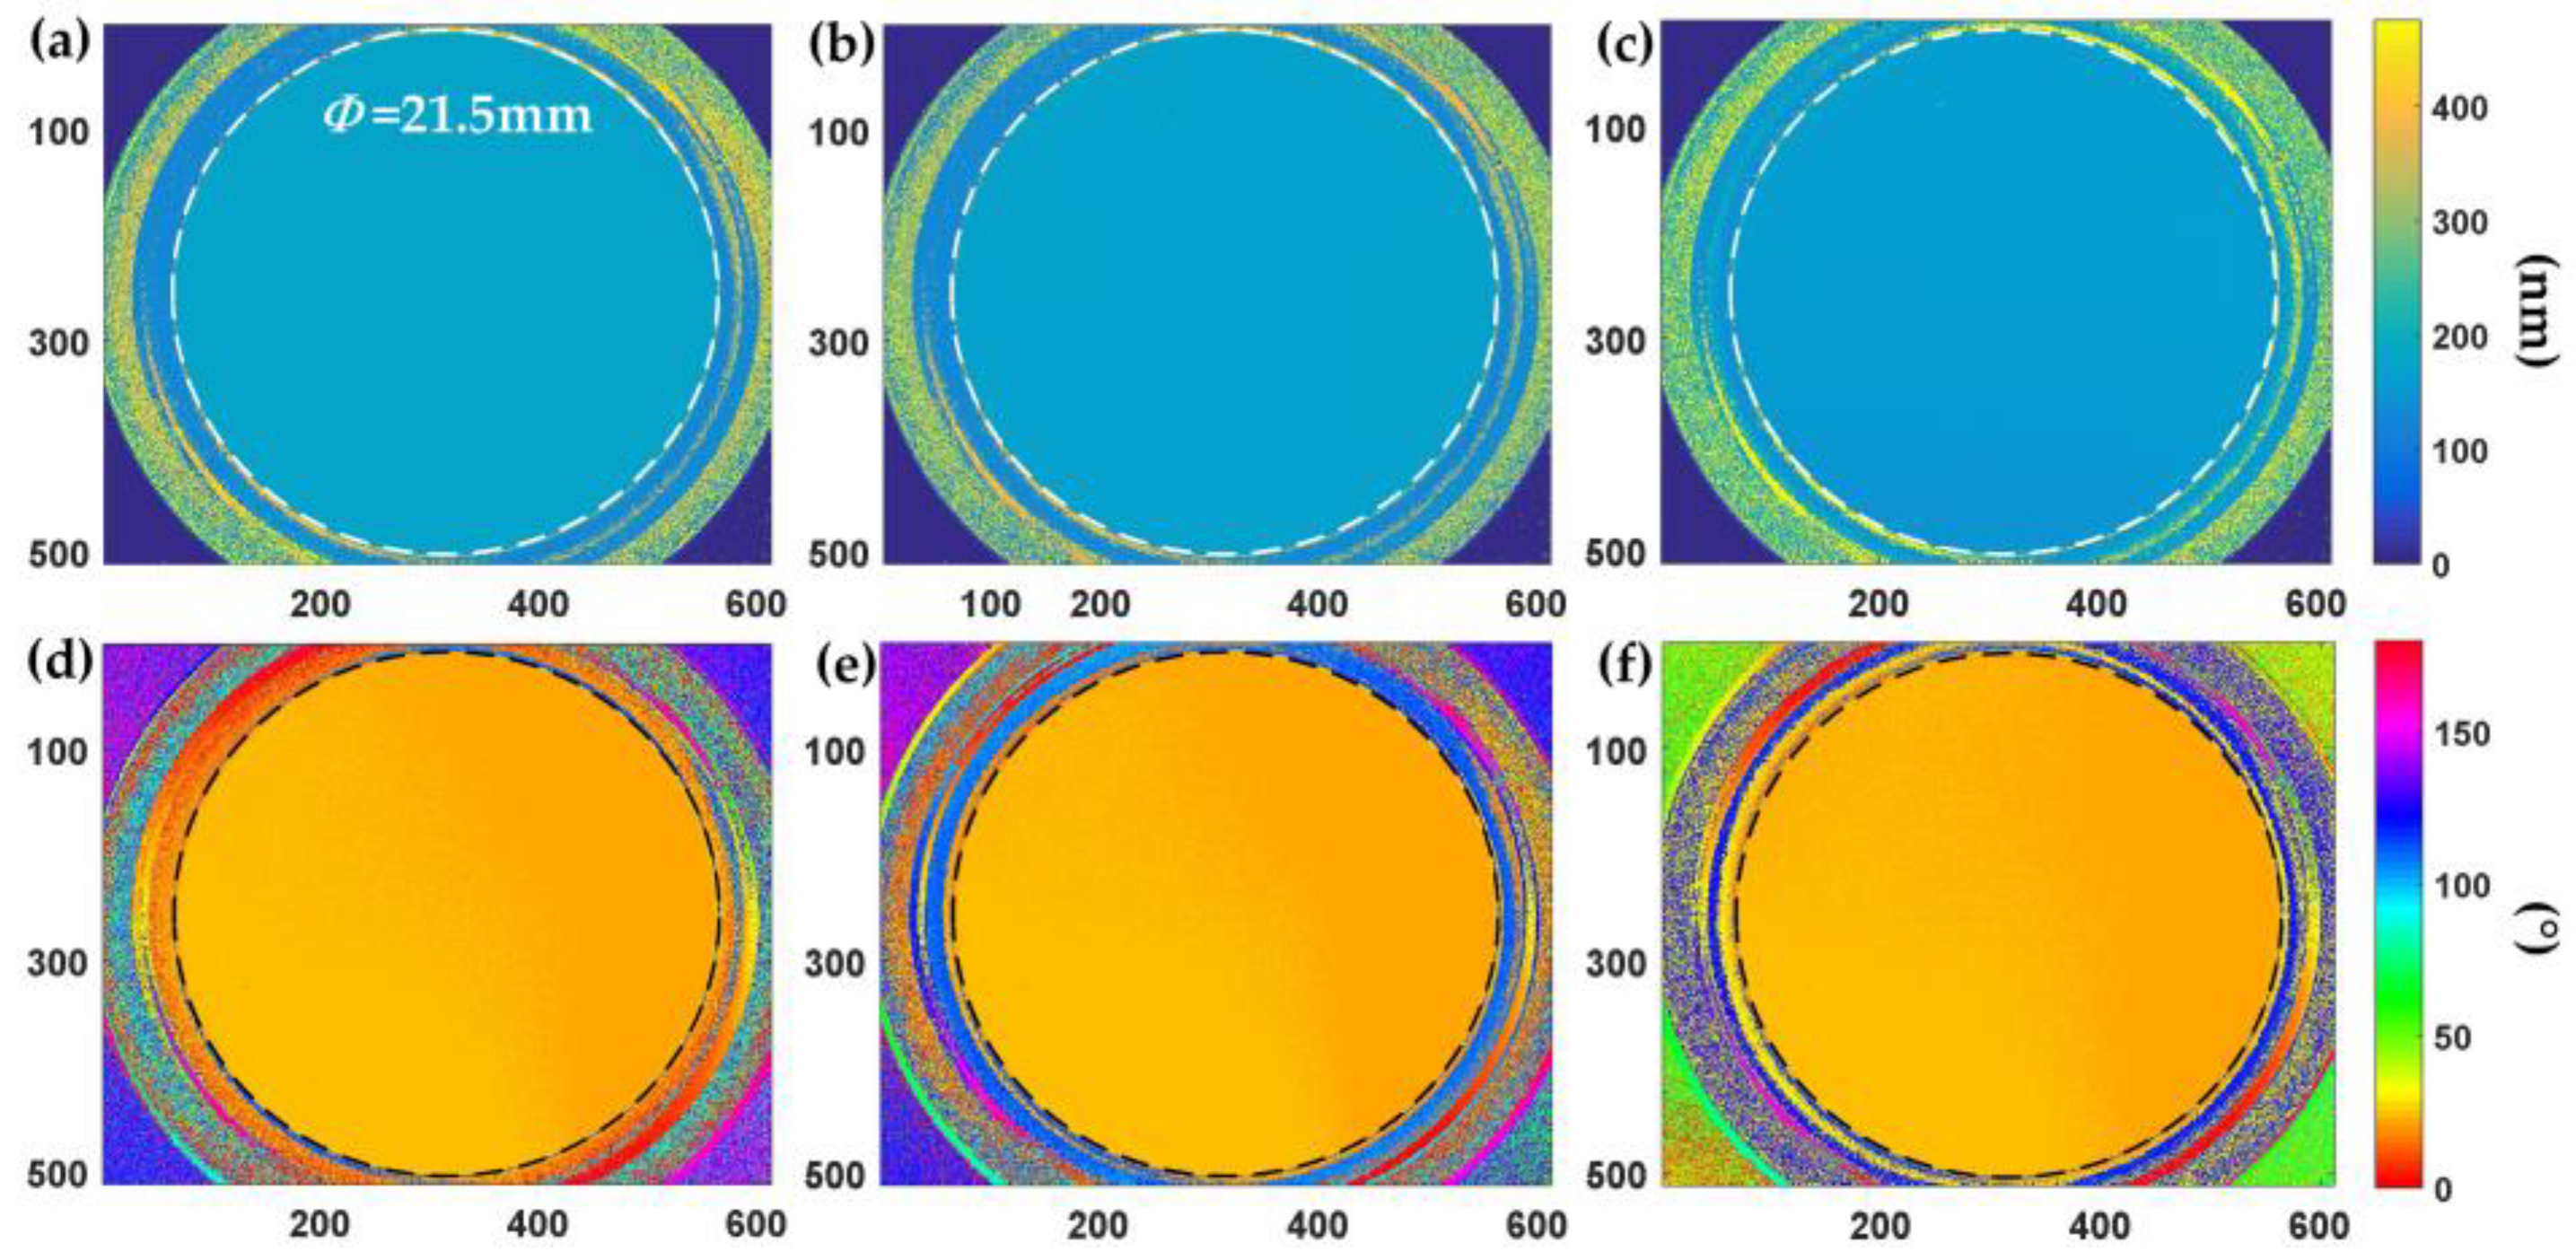
3.2. Birefringence Measurements Conducted on a Quarter-Wave Plate and a PMMA Arch-Shaped Workpiece
4. Discussion
5. Conclusions
Author Contributions
Funding
Institutional Review Board Statement
Informed Consent Statement
Data Availability Statement
Conflicts of Interest
References
- Mu, S.Q.; Shi, Y.T.; Song, Y.T. Multislice computational model for birefringent scattering. Optica 2023, 10, 81–89. [Google Scholar] [CrossRef]
- Lazar, I.; Szot, K.; Roleder, K. Influence of Defects-Induced Stresses on Birefringence in SrTiO3 Single Crystals. Crystals 2023, 13, 985. [Google Scholar] [CrossRef]
- Inoue, T. Strain-Induced Birefringence of Amorphous Polymers and Molecular Design of Optical Polymers. ACS Appl. Polym. Mater. 2021, 3, 2264–2273. [Google Scholar] [CrossRef]
- Sun, J.Y.; Long, Y.B.; Song, J.J. Thermal Birefringence-Based beam shaping in high energy lasers. Opt. Laser Technol. 2024, 175, 110819. [Google Scholar] [CrossRef]
- Roth, T.; Rikken, G. Observation of magnetoelectric linear Birefringence. Phys. Rev. Lett. 2002, 88, 063001. [Google Scholar] [CrossRef] [PubMed]
- Yan, L.; Wang, Q.; Yin, B.; Xiao, S.; Li, H.; Wang, M.; Liu, X.; Wu, S. Research on Simultaneous Measurement of Magnetic Field and Temperature Based on Petaloid Photonic Crystal Fiber Sensor. Sensors 2023, 23, 7940. [Google Scholar] [CrossRef] [PubMed]
- Yang, H.; Jussila, H.; Autere, A. Optical Waveplates Based on Birefringence of Anisotropic Two-Dimensional Layered Materials. ACS Photonics 2017, 4, 3023–3033. [Google Scholar] [CrossRef]
- Yao, C.Y.; Ma, X.Y.; Ma, R.Y.; Zhao, D. Data-driven optical method for full-field stress measurements. Opt. Lett. 2023, 48, 3091–3094. [Google Scholar] [CrossRef] [PubMed]
- Liu, X.; Jiang, L.; Ke, M. Posterior scleral birefringence measured by triple-input polarization-sensitive imaging as a biomarker of myopia progression. Nat. Biomed. Eng. 2023, 7, 986–1000. [Google Scholar] [CrossRef]
- Liu, X.; Beaudette, K.; Wang, X.; Liu, L.; Villiger, M. Tissue-like phantoms for quantitative birefringence imaging. Opt. Express 2017, 8, 4454–4465. [Google Scholar] [CrossRef]
- Han, J.; Zhang, P.; Bi, Z. Birefringence-like spin transport via linearly polarized antiferromagnetic magnons. Nat. Nanotechnol. 2020, 15, 563–568. [Google Scholar] [CrossRef] [PubMed]
- Shi, H.; Guo, J.; Yang, Z.F.; Liu, J.H. Birefringence and Dichroism in Quasi-1D Transition Metal Trichalcogenides: Direct Experimental Investigation. Small 2021, 17, 1613–6810. [Google Scholar]
- Meng, C.; Thrane, P.C.; Ding, F.V. Full-range birefringence control with piezoelectric MEMS-based metasurfaces. Nat Commun. 2022, 13, 2071. [Google Scholar] [CrossRef] [PubMed]
- Shi, Z.J.; Zhu, A.Y.; Li, Z.Y. Continuous angle-tunable birefringence with freeform metasurfaces for arbitrary polarization conversion. Sci. Adv. 2020, 6, 3367. [Google Scholar] [CrossRef] [PubMed]
- Cheng, B.X.; Zhang, J.; Zhu, J.Q. Measurement of a birefringent sample based on ptychographical iterative engine using planar polariscope. J. Phys. D Appl. Phys. 2019, 53, 05LT01. [Google Scholar]
- Montarou, C.C.; Gaylord, T.K. Two-wave-plate compensator method for single-point retardation measurements. Appl. Opt. 2004, 43, 6580–6595. [Google Scholar] [CrossRef] [PubMed]
- Scafidi, M.; Pitarresi, G.; Toscano, A. Review of photoelastic image analysis applied to structural birefringent materials: Glass and polymers. Opt. Eng. 2015, 5, 4081206. [Google Scholar]
- Ryu, M.; Han, M.; Grineviciute, L.; Hu, J.W.; Moein, T. RGB-Color Image Analysis for Determination of Birefringence of Micro-Films and Columnar Coatings. Laser Photonics Rev. 2022, 17, 1863–8880. [Google Scholar] [CrossRef]
- Honda, R.; Ryu, M.; Li, J.L.; Mizeikis, V. Simple multi-wavelength imaging of birefringence:case study of silk. Sci. Rep. 2018, 8, 2045–2322. [Google Scholar] [CrossRef]
- Chen, Q.H.; Liu, B.C.; He, Y.X. Phase retardation measurement of an arbitrary wave plate based on magneto-optical modulating and residue detecting of the base frequency component of the signal. Opt. Lett. 2018, 43, 4514–4517. [Google Scholar] [CrossRef]
- Li, K.; Wang, S.; Wang, Z. Measurement of Waveplate Parameters over Entire Clear Aperture Based on Differential Frequency Modulation with Dual Photoelastic Modulators. Appl. Sci. 2023, 13, 4496. [Google Scholar] [CrossRef]
- Lane, C.; Rode, D.; Rösgen, T. Two-dimensional birefringence measurement technique using a polarization camera. Appl. Opt. 2021, 60, 8435–8444. [Google Scholar] [CrossRef] [PubMed]
- Lane, C.; Rode, D.; Rösgen, T. Optical characterization method for birefringent fluids using a polarization camera. Opt. Laser Eng. 2021, 146, 106724. [Google Scholar] [CrossRef]
- Zhang, S.; Chen, C.; Jiang, H.; Gu, H. Dynamic characteristics of nematic liquid crystal variable retarders investigated by a high-speed polarimetry. J. Opt. 2019, 21, 065605. [Google Scholar] [CrossRef]
- Hlubina, P.; Ciprian, D. dispersion in a quartz crystal retrieved from a channeled spectrum resolved by a fiber-optic spectrometer. Opt. Commun. 2011, 284, 2683–2686. [Google Scholar] [CrossRef]
- Chen, Z.Y.; Wang, X.; Liang, R.G. Calibration method of microgrid polarimeters with image interpolation. Appl. Opt. 2015, 54, 995–1001. [Google Scholar] [CrossRef]
- Available online: https://www.lbtek.com/product/660.html (accessed on 7 August 2024).


| Wavelength Channel | Birefringence Retardance | Fast-Axis Azimuthal Angle | |||
|---|---|---|---|---|---|
| Mean Value (nm) | Standard Deviation Value (nm) | Manufacturer’s Calibration Values (nm) | Mean Value (°) | Standard Deviation Value (°) | |
| 463 nm-B | 188.57 | 0.67 | 188.9 | 22.55 | 0.06 |
| 533 nm-G | 168.72 | 0.58 | 170.0 | 22.53 | 0.06 |
| 629 nm-R | 159.06 | 0.45 | 157.3 | 22.54 | 0.08 |
| Wavelength Channel | Before Applying Force | After Applying Force | ||
|---|---|---|---|---|
| Retardance (nm) | Fast-Axis Azimuthal Angle (°) | Retardance (nm) | Fast-Axis Azimuthal Angle (°) | |
| 463 nm-B | 34.86 | 93.02 | 247.51 | 177.87 |
| 533 nm-G | 32.19 | 93.02 | 242.06 | 177.91 |
| 629 nm-R | 31.90 | 92.87 | 237.55 | 177.42 |
| Method | Standard Deviation of Retardance | Standard Deviation of Fast-Axis Azimuthal Angle | Wavelength Channel | Birefringence Distribution Measurement | Ref. |
|---|---|---|---|---|---|
| Senarmont compensation | ±5 nm | 0.1° | 1 | multiple scanning | [16] |
| LCVR | ±9.6 nm | - | 3 | multiple imaging | [19] |
| photoelastic modulation | 0.03 nm | 0.02° | 1 | multiple scanning | [21] |
| polarization CMOS | 0.005 rad (0.42 nm @ 526 nm) | 0.1° | 1 | single imaging | [22] |
| RGB-LED + circular polarizer + color polarized camera | 0.67 nm | 0.08° | 3 | single imaging | This work |
Disclaimer/Publisher’s Note: The statements, opinions and data contained in all publications are solely those of the individual author(s) and contributor(s) and not of MDPI and/or the editor(s). MDPI and/or the editor(s) disclaim responsibility for any injury to people or property resulting from any ideas, methods, instructions or products referred to in the content. |
© 2024 by the authors. Licensee MDPI, Basel, Switzerland. This article is an open access article distributed under the terms and conditions of the Creative Commons Attribution (CC BY) license (https://creativecommons.org/licenses/by/4.0/).
Share and Cite
Wang, S.; Han, X.; Li, K. Snapshot Multi-Wavelength Birefringence Imaging. Sensors 2024, 24, 5174. https://doi.org/10.3390/s24165174
Wang S, Han X, Li K. Snapshot Multi-Wavelength Birefringence Imaging. Sensors. 2024; 24(16):5174. https://doi.org/10.3390/s24165174
Chicago/Turabian StyleWang, Shuang, Xie Han, and Kewu Li. 2024. "Snapshot Multi-Wavelength Birefringence Imaging" Sensors 24, no. 16: 5174. https://doi.org/10.3390/s24165174