
Development and Validation of a Real-Time Service Model for Noise Removal and Arrhythmia Classification Using Electrocardiogram Signals

 , ,
, ,
Abstract
1. Introduction
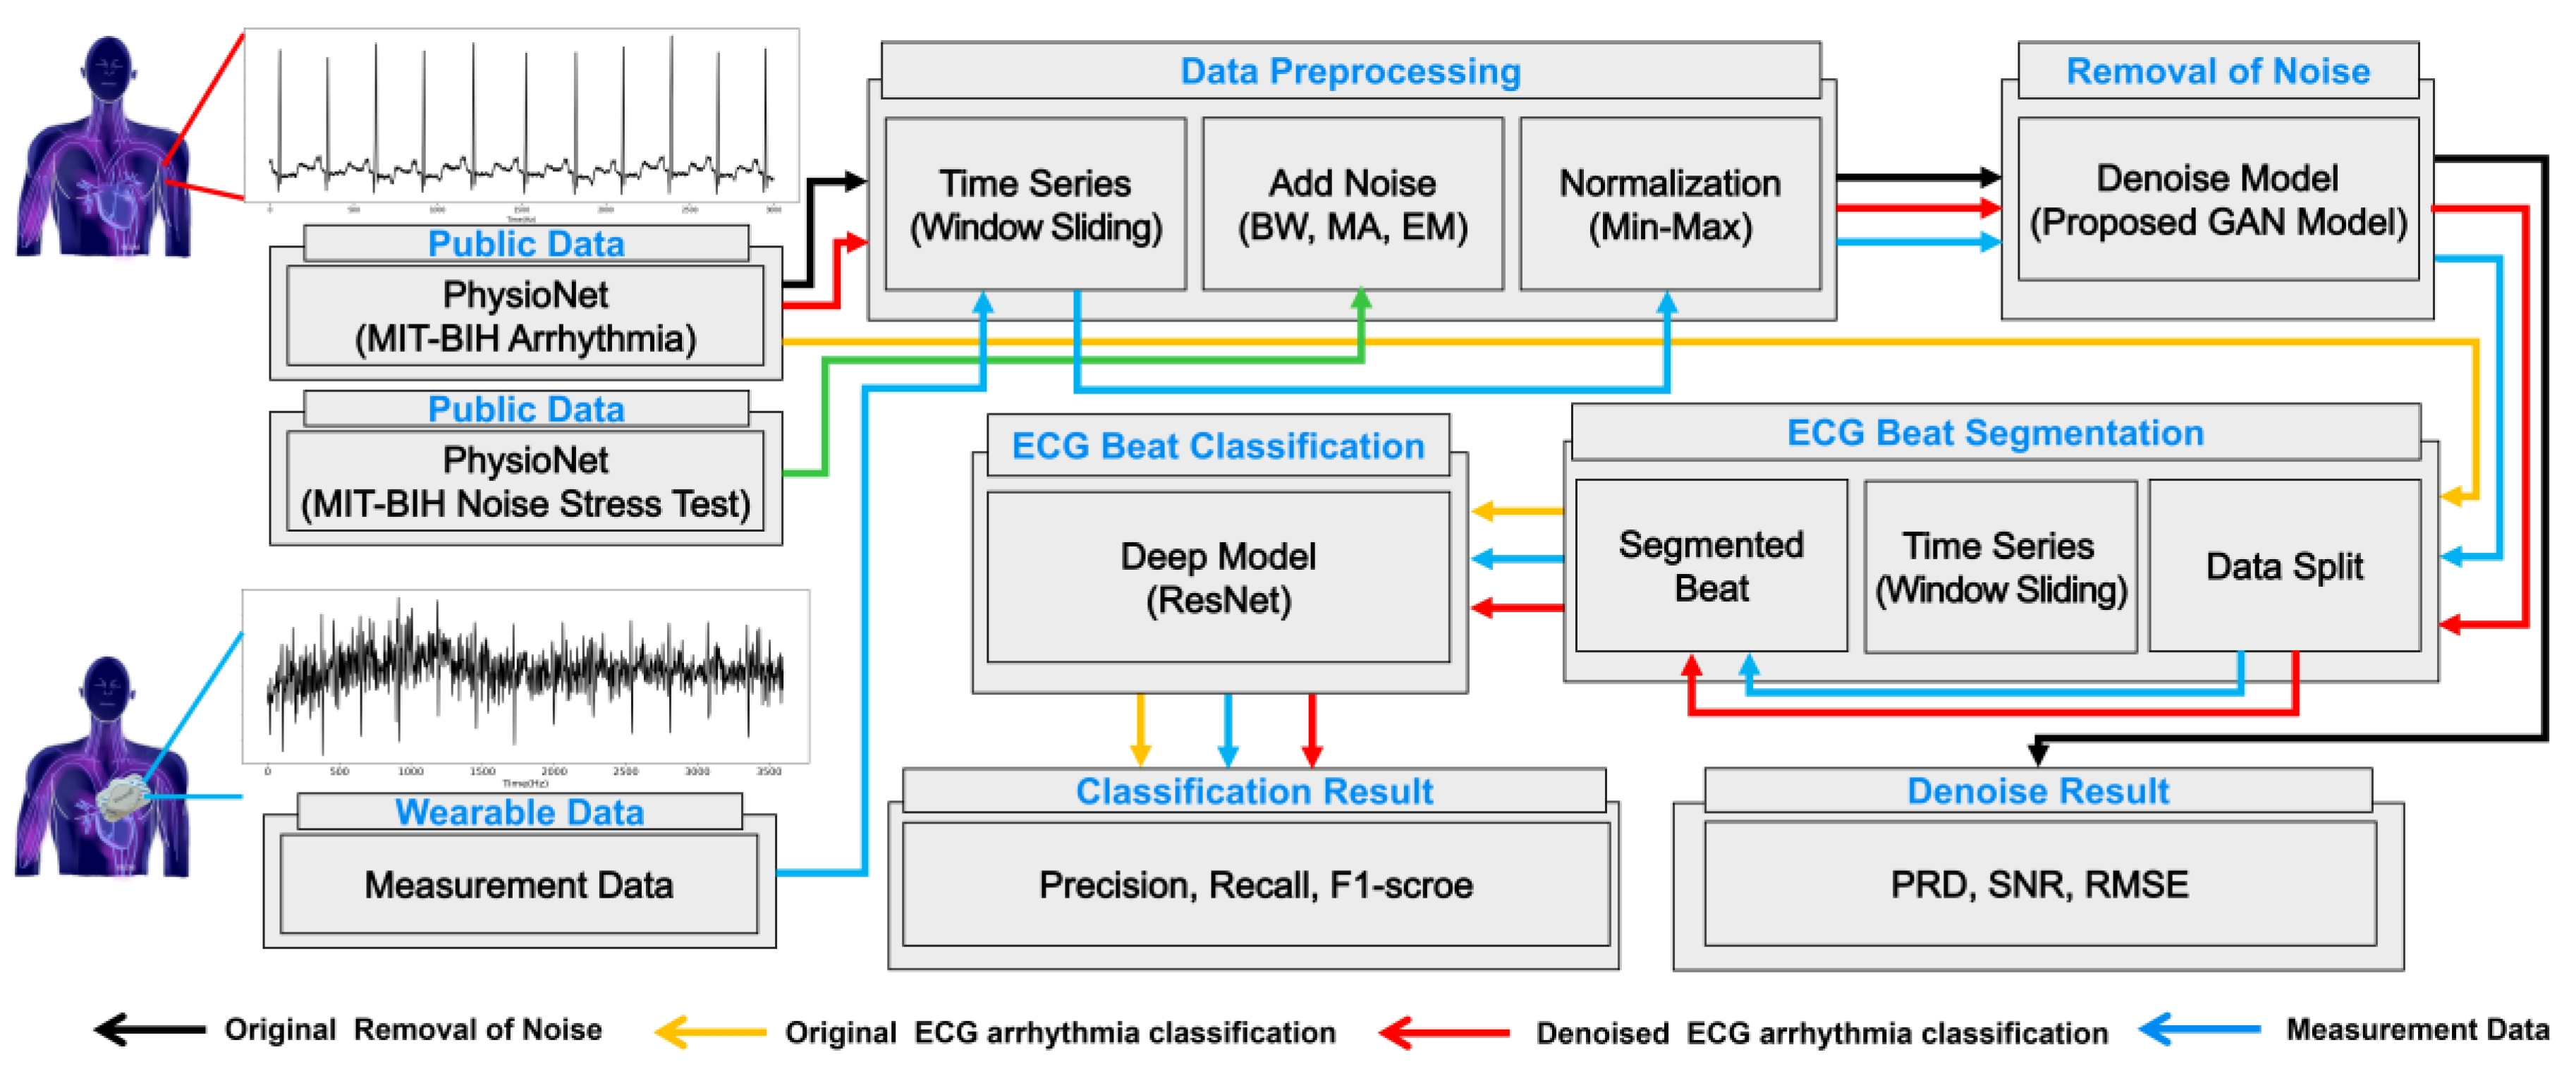
2. Methodology
2.1. Data Acquisition
2.1.1. Public Data
2.1.2. Measurement Data Collected in a Practical Environment
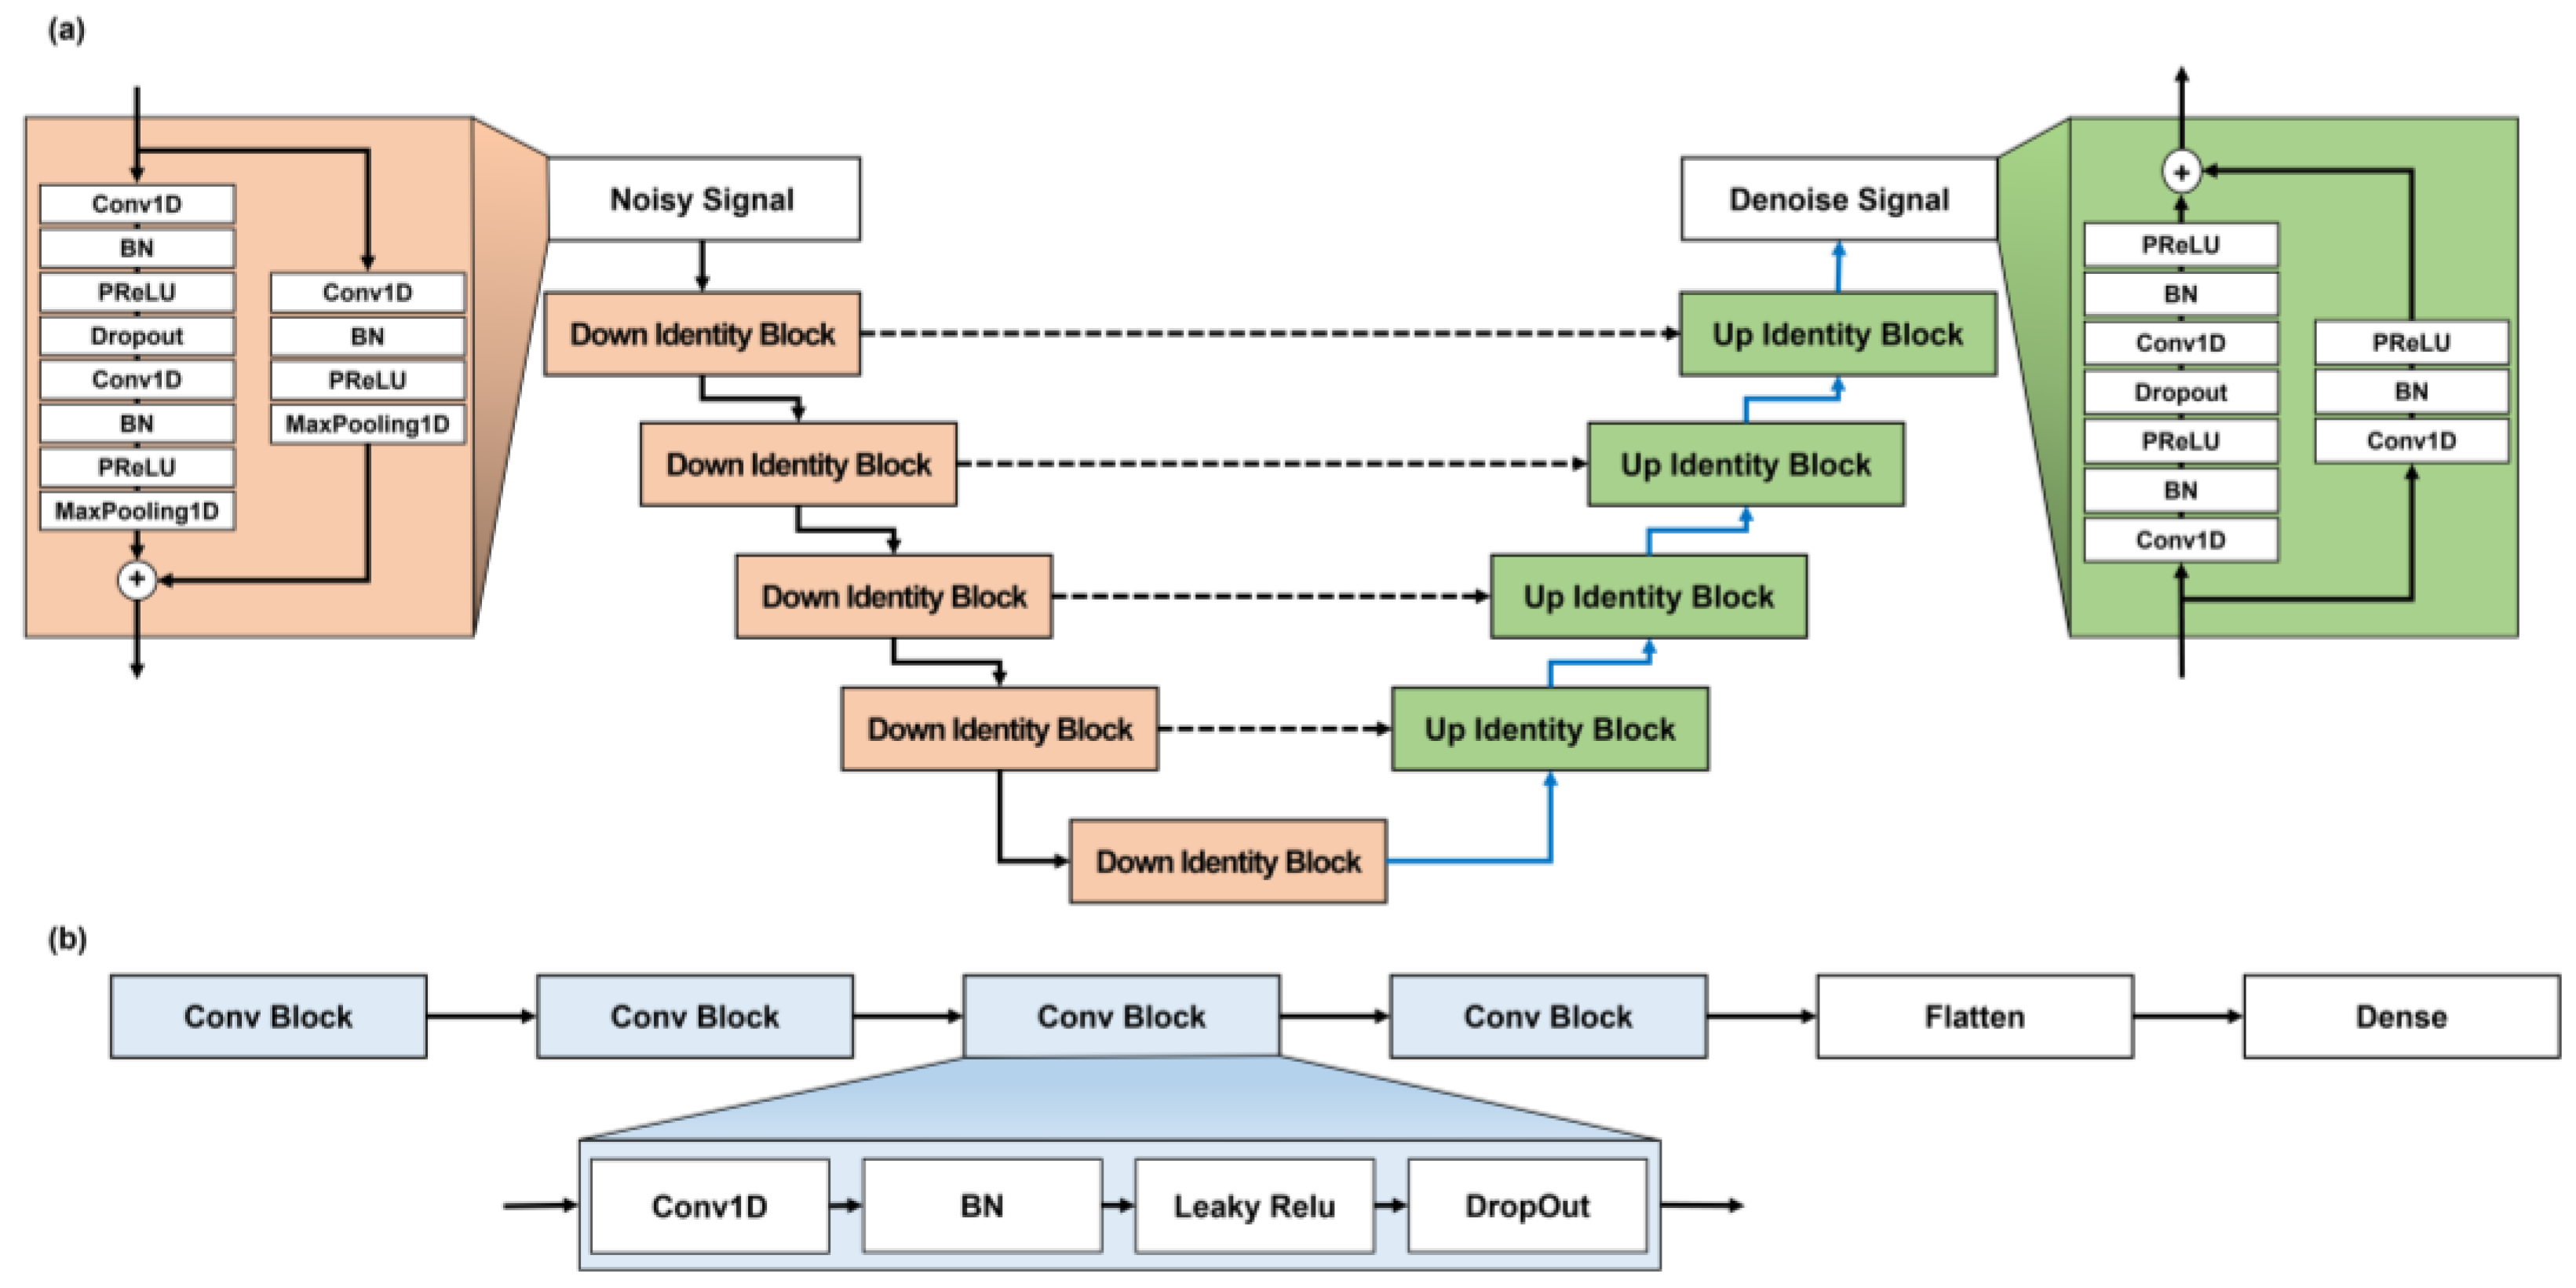
2.2. Noise Removal from ECG Signals
2.3. Arrhythmia Classification Using ECG Signals
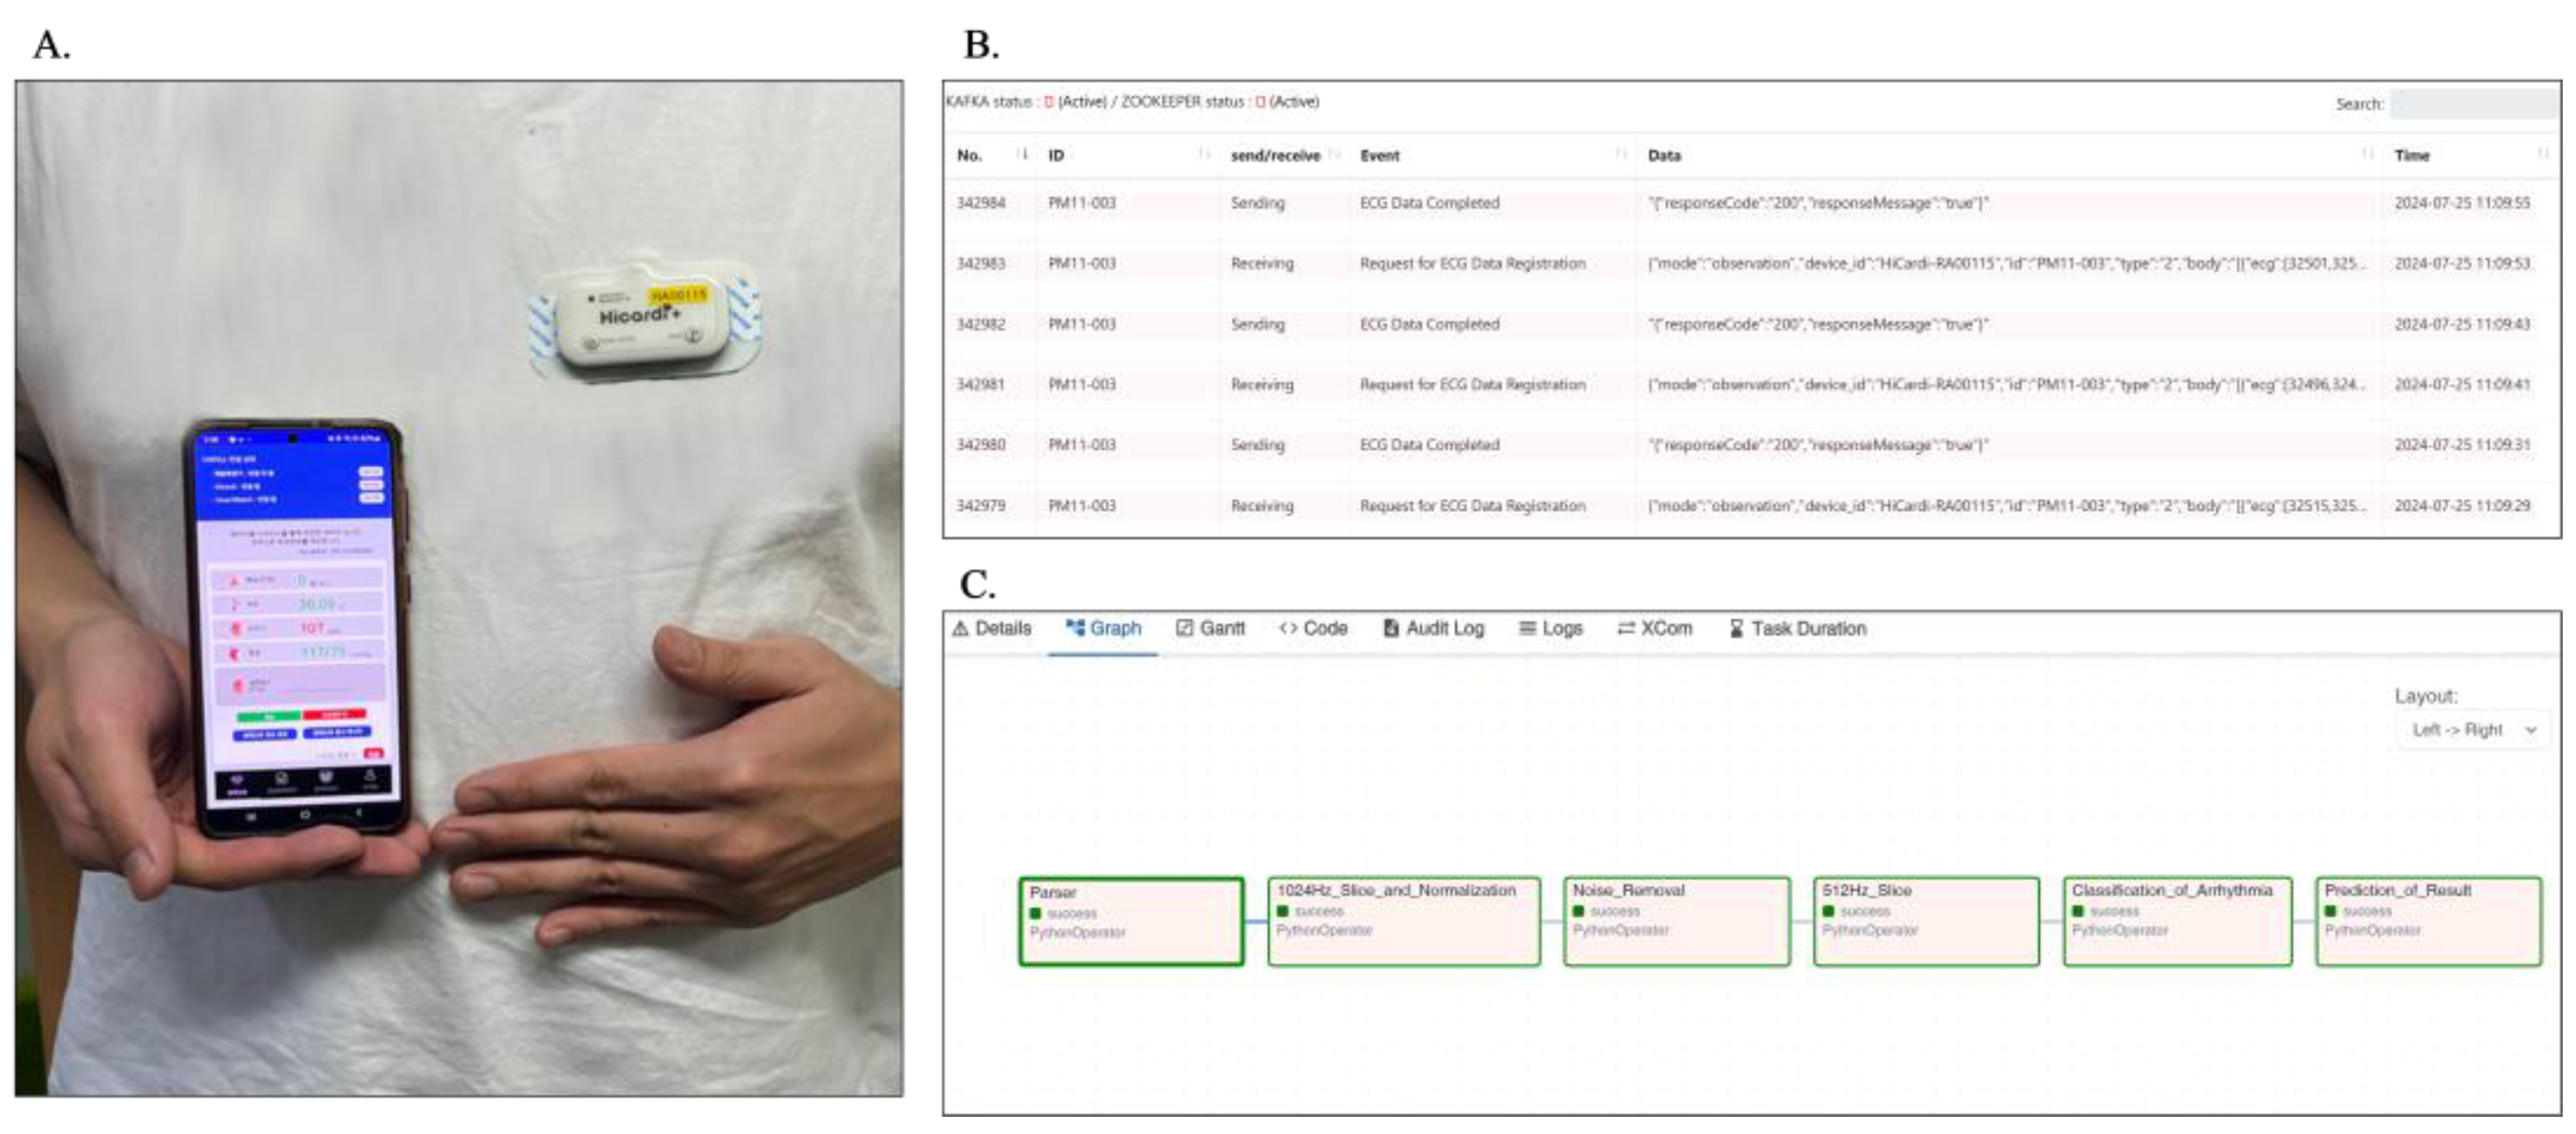
2.4. Service Utilization of Developed Model
3. Experimental Configuration
3.1. Experimental Preparation
3.1.1. Experimental Environment
3.1.2. Data Preprocessing
3.2. Evaluation Metrics
4. Results
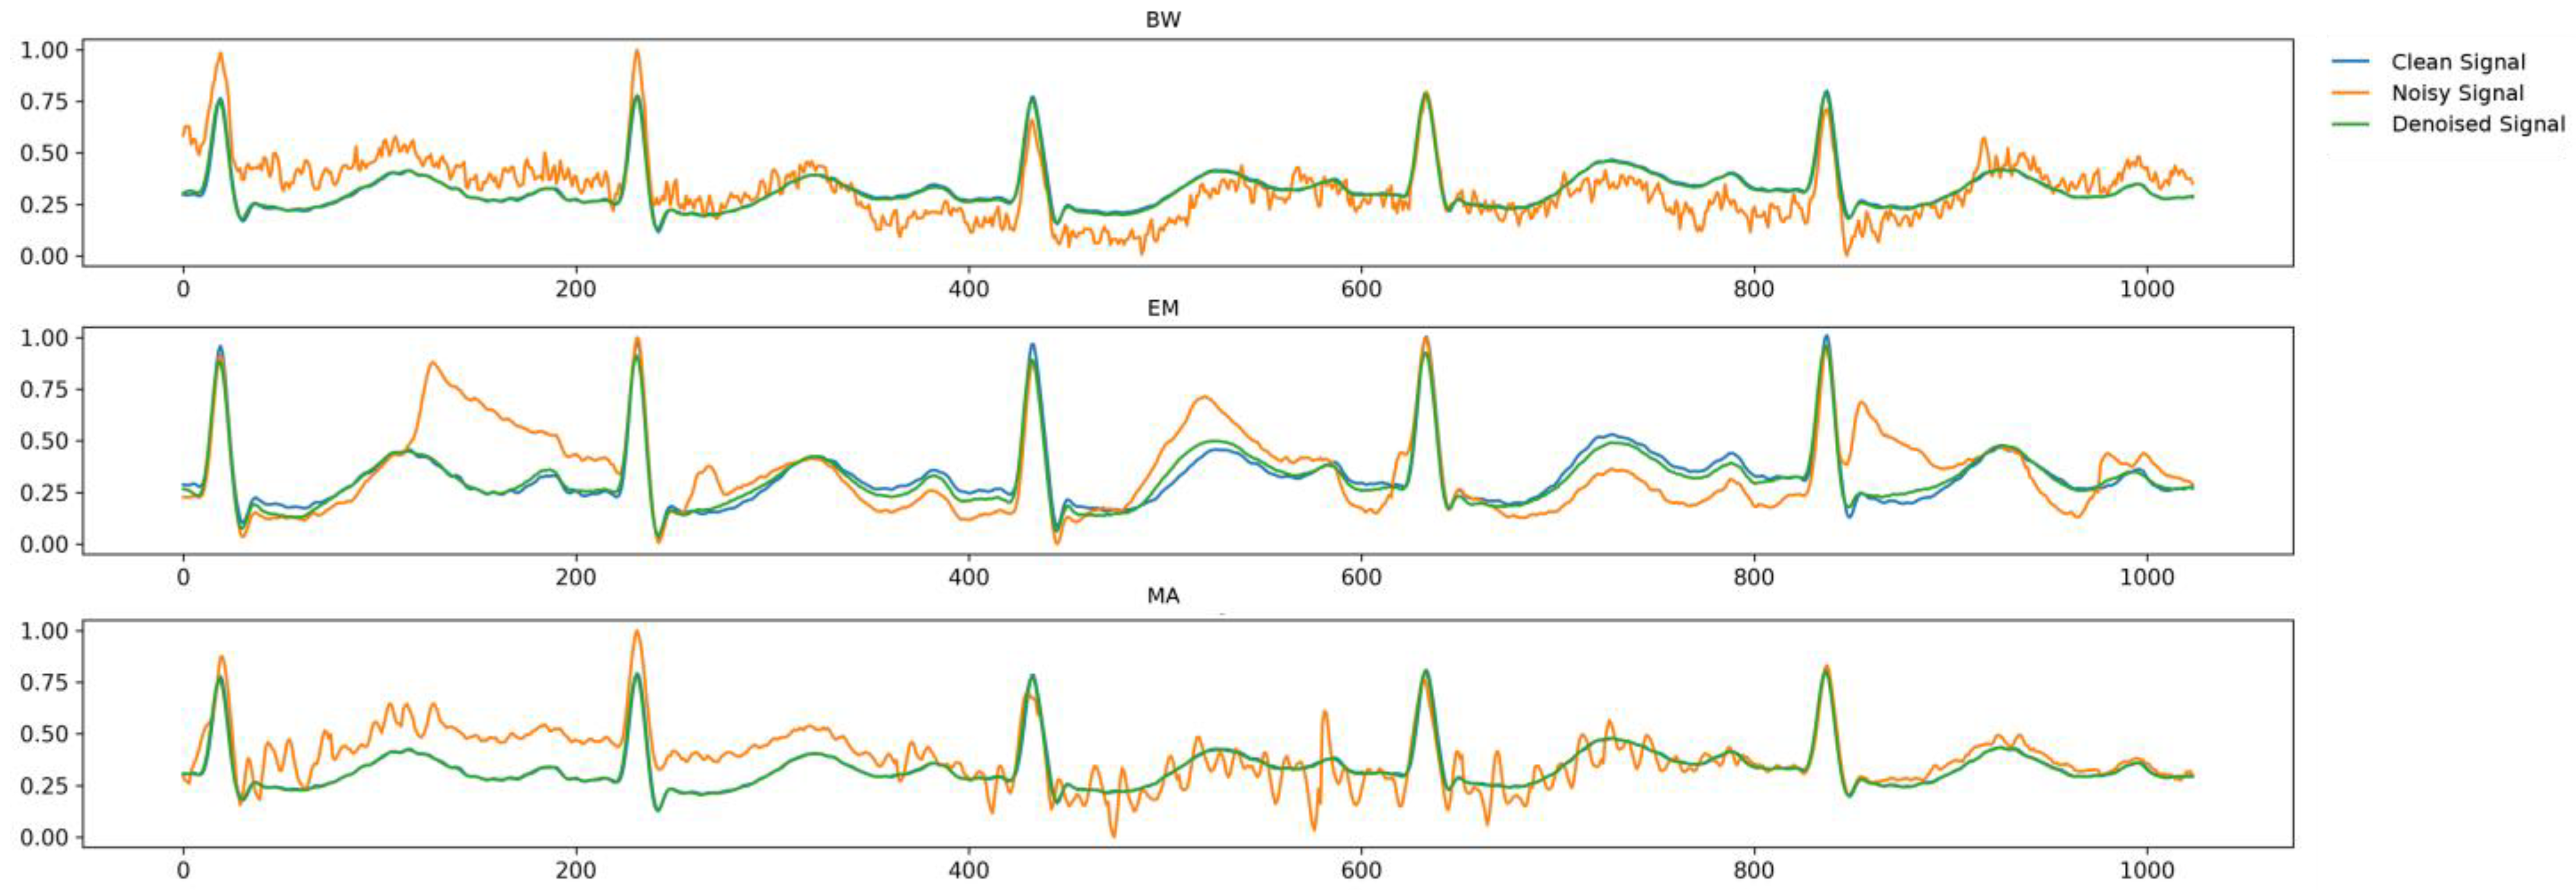
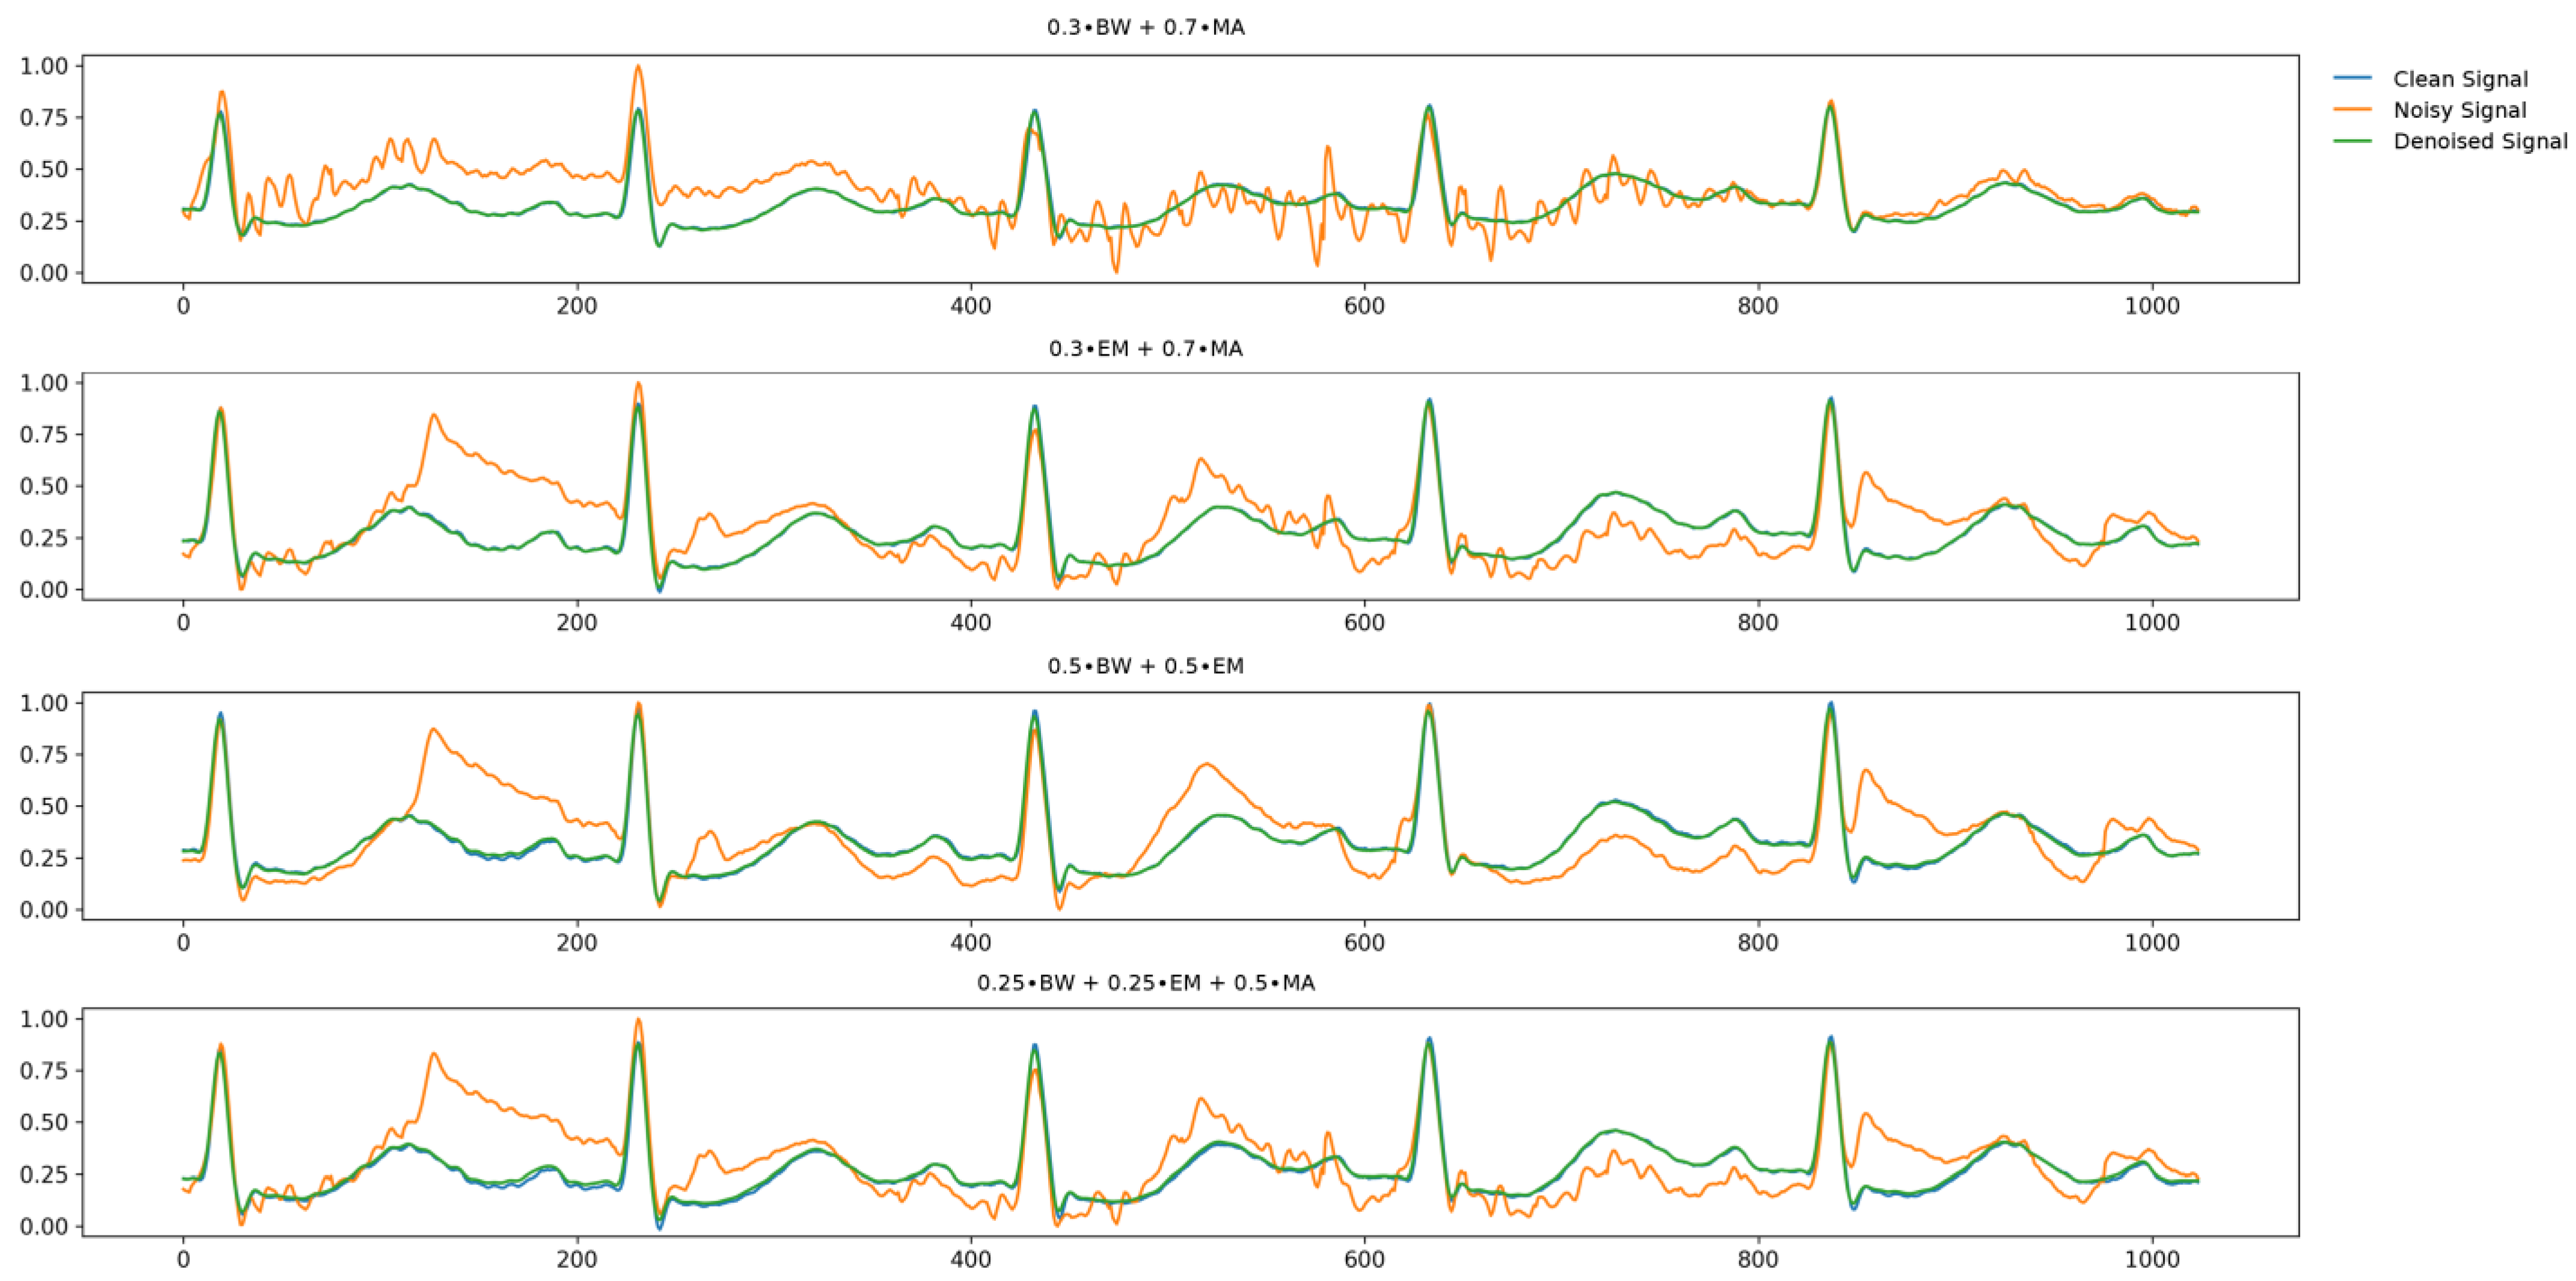
4.1. Denoising of Public ECG Data
4.2. Arrhythmia Classification Using Public ECG Data
4.3. Denoising and Classification of Measured ECG Data
5. Discussion
6. Conclusions
Supplementary Materials
Author Contributions
Funding
Institutional Review Board Statement
Informed Consent Statement
Data Availability Statement
Conflicts of Interest
References
- World Health Organization. Cardiovascular Diseases (CVDs). Available online: https://www.who.int/news-room/fact-sheets/detail/cardiovascular-diseases-(cvds) (accessed on 2 May 2024).
- Xie, L.; Li, Z.; Zhou, Y.; He, Y.; Zhu, J. Computational diagnostic techniques for electrocardiogram signal analysis. Sensors 2020, 20, 6318. [Google Scholar] [CrossRef] [PubMed]
- Shen, Q.; Li, J.; Cui, C.; Wang, X.; Gao, H.; Liu, C.; Chen, M. A wearable real-time telemonitoring electrocardiogram device compared with traditional Holter monitoring. J. Biomed. Res. 2021, 35, 238. [Google Scholar] [CrossRef] [PubMed]
- Friesen, G.M.; Jannett, T.C.; Jadallah, M.A.; Yates, S.L.; Quint, S.R.; Nagle, H.T. A comparison of the noise sensitivity of nine QRS detection algorithms. IEEE Trans. Biomed. Eng. 1990, 37, 85–98. [Google Scholar] [CrossRef] [PubMed]
- Chang, K.-M. Arrhythmia ECG noise reduction by ensemble empirical mode decomposition. Sensors 2010, 10, 6063–6080. [Google Scholar] [CrossRef] [PubMed]
- Akansu, A.N.; Haddad, R.A. Multiresolution Signal Decomposition: Transforms, Subbands, and Wavelets, 2nd ed.; Academic Press: Cambridge, MA, USA, 2001. [Google Scholar]
- Zhu, J.; Li, X. Electrocardiograph signal denoising based on sparse decomposition. Healthc. Technol. Lett. 2017, 4, 134–137. [Google Scholar] [CrossRef] [PubMed]
- Chatterjee, S.; Thakur, R.S.; Yadav, R.N.; Gupta, L.; Raghuvanshi, D.K. Review of noise removal techniques in ECG signals. IET Signal Process. 2020, 14, 569–590. [Google Scholar] [CrossRef]
- Chiang, H.-T.; Hsieh, Y.-Y.; Fu, S.-W.; Hung, K.-H.; Tsao, Y.; Chien, S.-Y. Noise reduction in ECG signals using fully convolutional denoising autoencoders. IEEE Access 2019, 7, 60806–60813. [Google Scholar] [CrossRef]
- Antczak, K. A generative adversarial approach to ECG synthesis and denoising. arXiv 2020, arXiv:2009.02700. [Google Scholar] [CrossRef]
- Xu, X.; Liu, H. ECG heartbeat classification using convolutional neural networks. IEEE Access 2020, 8, 8614–8619. [Google Scholar] [CrossRef]
- Kuila, S.; Dhanda, N.; Joardar, S. Feature extraction and classification of mit-bih arrhythmia database. In Proceedings of the 2nd International Conference on Communication, Devices and Computing: ICCDC, Haldia, India, 14–15 March 2019; pp. 417–427. [Google Scholar]
- Shoughi, A.; Dowlatshahi, M.B. A practical system based on CNN-BLSTM network for accurate classification of ECG heartbeats of MIT-BIH imbalanced dataset. In Proceedings of the 26th International Computer Conference, Computer Society of Iran (CSICC), Tehran, Iran, 3–4 March 2021; pp. 1–6. [Google Scholar]
- Vargas, R.N.; Veiga, A.C.P. Electrocardiogram signal denoising by a new noise variation estimate. Res. Biomed. Eng. 2020, 36, 13–20. [Google Scholar] [CrossRef]
- Yıldırım, Ö.; Pławiak, P.; Tan, R.-S.; Acharya, U.R. Arrhythmia detection using deep convolutional neural network with long duration ECG signals. Comput. Biol. Med. 2018, 102, 411–420. [Google Scholar] [CrossRef] [PubMed]
- Moody, G.B.; Mark, R.G. The impact of the MIT-BIH arrhythmia database. IEEE Eng. Med. Biol. Mag. 2001, 20, 45–50. [Google Scholar] [CrossRef] [PubMed]
- Moody, G.B.; Muldrow, W.; Mark, R.G. A noise stress test for arrhythmia detectors. Comput. Cardiol. 1984, 11, 381–384. [Google Scholar]
- Ronneberger, O.; Fischer, P.; Brox, T. U-net: Convolutional networks for biomedical image segmentation. In Proceedings of the Medical Image Computing and Computer-Assisted Intervention—MICCAI 2015. Lecture Notes in Computer Science, Munich, Germany, 5–9 October 2015; Springer: Berlin/Heidelberg, Germany, 2015; pp. 234–241. [Google Scholar]
- He, K.; Zhang, X.; Ren, S.; Sun, J. Deep residual learning for image recognition. In Proceedings of the IEEE Conference on Computer Vision and Pattern Recognition (CVPR), Las Vegas, NV, USA, 27–30 June 2016; pp. 770–778. [Google Scholar]
- Thanh-Tung, H.; Tran, T. Catastrophic forgetting and mode collapse in GANs. In Proceedings of the 2020 International Joint Conference on Neural Networks (IJCNN), Glasgow, UK, 19–24 July 2020; pp. 1–10. [Google Scholar]
- Arjovsky, M.; Chintala, S.; Bottou, L. Wasserstein generative adversarial networks. In Proceedings of the 34th International Conference on Machine Learning, Sydney, Australia, 6–11 August 2017; pp. 214–223. [Google Scholar]
- Mao, X.; Li, Q.; Xie, H.; Lau, R.Y.; Wang, Z.; Paul Smolley, S. Least squares generative adversarial networks. In Proceedings of the IEEE International Conference on Computer Vision (ICCV), Venice, Italy, 22–29 October 2017; pp. 2794–2802. [Google Scholar]
- Wang, J.; Li, R.; Li, R.; Li, K.; Zeng, H.; Xie, G.; Liu, L. Adversarial de-noising of electrocardiogram. Neurocomputing 2019, 349, 212–224. [Google Scholar] [CrossRef]
- Mohebbanaaz; Kumar, L.R.; Sai, Y.P. A new transfer learning approach to detect cardiac arrhythmia from ECG signals. Signal Image Video Process. 2022, 16, 1945–1953. [Google Scholar] [CrossRef]
- Xu, B.; Liu, R.; Shu, M.; Shang, X.; Wang, Y. An ECG denoising method based on the generative adversarial residual network. Comput. Math. Methods Med. 2021, 2021, 5527904. [Google Scholar] [CrossRef]
- Hou, Y.; Liu, R.; Shu, M.; Chen, C. An ECG denoising method based on adversarial denoising convolutional neural network. Biomed. Signal Process. Control 2023, 84, 104964. [Google Scholar] [CrossRef]
- Jing, E.; Zhang, H.; Li, Z.; Liu, Y.; Ji, Z.; Ganchev, I. ECG heartbeat classification based on an improved ResNet-18 model. Comput. Math. Methods Med. 2021, 2021, 6649970. [Google Scholar] [CrossRef] [PubMed]
- Brito, C.; Machado, A.; Sousa, A.L. Electrocardiogram beat-classification based on a ResNet network. In Proceedings of the 17th World Congress on Medical and Health Informatics, Lyon, France, 25–30 August 2019; pp. 55–59. [Google Scholar]
- Ribeiro, H.D.M.; Arnold, A.; Howard, J.P.; Shun-Shin, M.J.; Zhang, Y.; Francis, D.P.; Lim, P.B.; Whinnett, Z.; Zolgharni, M. ECG-based real-time arrhythmia monitoring using quantized deep neural networks: A feasibility study. Comput. Biol. Med. 2022, 143, 105249. [Google Scholar] [CrossRef]
- Lin, Y.-J.; Chuang, C.-W.; Yen, C.-Y.; Huang, S.-H.; Huang, P.-W.; Chen, J.-Y.; Lee, S.-Y. Artificial intelligence of things wearable system for cardiac disease detection. In Proceedings of the 2019 IEEE International Conference on Artificial Intelligence Circuits and Systems (AICAS), Hsinchu, Taiwan, 18–20 March 2019; pp. 67–70. [Google Scholar]
- Li, H.; An, Z.; Zuo, S.; Zhu, W.; Zhang, Z.; Zhang, S.; Zhang, C.; Song, W.; Mao, Q.; Mu, Y. Artificial intelligence-enabled ECG Algorithm based on improved residual network for wearable ECG. Sensors 2021, 21, 6043. [Google Scholar] [CrossRef] [PubMed]


| Variables | MIT-BIH (N = 47) | Measurement Data (N = 35) |
|---|---|---|
| Age (years) | 67 (23–89) | 68 (64–72) |
| Sex, N (%) | ||
| Male | 25 (53.2) | 28 (80.0) |
| Female | 22 (46.8) | 7 (20.0) |
| Average measurement time | 30 min | 3 days, 16 h, 5 min |
| Type of ECG Beat | Original Label | Proposed Label |
|---|---|---|
| N | 74,790 (71.8) | 235,851 (82.9) |
| B | 15,334(14.7) | 26,203 (9.2) |
| V | 7124 (6.9) | 14,466 (5.1) |
| A | 2546 (2.4) | 6264 (2.2) |
| F | 803 (0.8) | 1870 (0.7) |
| Total count | 104,217 (100.0) | 284,654 (100.0) |
| 0 dB | 5 dB | ||||||
|---|---|---|---|---|---|---|---|
| PRD (%) | SNR | RMSE | PRD (%) | SNR | RMSE | ||
| BW | Comparative model (U-Net generator) | 14.45 | 16.82 | 0.066 | 12.59 | 18.00 | 0.058 |
| Proposed model (U-Net + LSGAN loss) | 10.96 | 19.21 | 0.059 | 7.71 | 22.26 | 0.041 | |
| Proposed model (U-Residual generator + LSGAN loss) | 2.51 | 32.02 | 0.008 | 1.92 | 34.34 | 0.006 | |
| EM | Comparative model (U-Net generator) | 16.48 | 15.67 | 0.076 | 13.68 | 17.28 | 0.063 |
| Proposed model (U-Net generator + LSGAN loss) | 9.744 | 20.23 | 0.052 | 6.68 | 23.50 | 0.036 | |
| Proposed model (U-Residual generator + LSGAN loss) | 2.47 | 32.14 | 0.008 | 1.83 | 34.74 | 0.006 | |
| MA | Comparative model (U-Net generator) | 14.76 | 16.62 | 0.068 | 11.61 | 18.71 | 0.053 |
| Proposed model (U-Net generator + LSGAN loss) | 10.65 | 19.46 | 0.057 | 7.79 | 22.17 | 0.042 | |
| Proposed model (U-Residual generator + LSGAN loss) | 2.60 | 31.70 | 0.008 | 1.89 | 34.46 | 0.006 | |
| 0 dB | |||
|---|---|---|---|
| PRD (%) | SNR | RMSE | |
| 0.3∙BW + 0.7∙MA | 2.68 | 31.51 | 0.013 |
| 0.3∙EM + 0.7∙MA | 2.70 | 31.38 | 0.012 |
| 0.5∙BW + 0.5∙EM | 1.65 | 35.65 | 0.007 |
| 0.25∙BW + 0.25∙EM + 0.5∙MA | 2.66 | 31.53 | 0.012 |
| Type of ECG Beat | Data | Precision (%) | Recall (%) | F1-Score (%) |
|---|---|---|---|---|
| N | Noisy data | 75.60 | 99.35 | 85.86 |
| Original data | 99.87 | 99.98 | 99.92 | |
| Denoised data | 99.61 | 99.49 | 99.55 | |
| B | Noisy data | 82.19 | 12.20 | 21.23 |
| Original data | 99.99 | 100 | 99.97 | |
| Denoised data | 99.94 | 99.86 | 99.90 | |
| V | Noisy data | 40.00 | 3.28 | 6.07 |
| Original data | 99.63 | 98.36 | 98.99 | |
| Denoised data | 96.03 | 99.01 | 96.45 | |
| A | Noisy data | 32.20 | 7.42 | 12.06 |
| Original data | 99.61 | 98.83 | 99.22 | |
| Denoised data | 96.50 | 96.79 | 96.65 | |
| F | Noisy data | 0.00 | 0.00 | 0.00 |
| Original data | 98.25 | 96.55 | 97.39 | |
| Denoised data | 90.54 | 81.90 | 86.00 | |
| Average | Noisy data | 46.00 | 24.45 | 25.04 |
| Original data | 99.47 | 98.74 | 99.10 | |
| Denoised data | 96.52 | 95.41 | 95.71 |
| Type of ECG Beat | Measurement Data | Data | Precision (%) | Recall (%) | F1-Score (%) |
|---|---|---|---|---|---|
| N | 6,186,167 (97.82) | Original data | 97.55 | 88.73 | 92.93 |
| Denoised data | 97.55 | 91.84 | 94.61 | ||
| B | 23,309 (0.36) | Original data | 66.39 | 85.24 | 74.65 |
| Denoised data | 91.24 | 88.24 | 89.71 | ||
| V | 33,741 (0.53) | Original data | 54.14 | 82.42 | 65.35 |
| Denoised data | 93.15 | 92.21 | 92.68 | ||
| A | 80,723 (1.27) | Original data | 53.47 | 82.56 | 64.90 |
| Denoised data | 89.24 | 89.56 | 89.39 | ||
| Average | 855,811 (100.00) | Noisy data | 67.89 | 84.74 | 74.46 |
| Denoised data | 92.80 | 90.46 | 91.60 |
Disclaimer/Publisher’s Note: The statements, opinions and data contained in all publications are solely those of the individual author(s) and contributor(s) and not of MDPI and/or the editor(s). MDPI and/or the editor(s) disclaim responsibility for any injury to people or property resulting from any ideas, methods, instructions or products referred to in the content. |
© 2024 by the authors. Licensee MDPI, Basel, Switzerland. This article is an open access article distributed under the terms and conditions of the Creative Commons Attribution (CC BY) license (https://creativecommons.org/licenses/by/4.0/).
Share and Cite
Park, Y.; Park, Y.H.; Jeong, H.; Kim, K.; Jung, J.Y.; Kim, J.-B.; Kang, D.R. Development and Validation of a Real-Time Service Model for Noise Removal and Arrhythmia Classification Using Electrocardiogram Signals. Sensors 2024, 24, 5222. https://doi.org/10.3390/s24165222
Park Y, Park YH, Jeong H, Kim K, Jung JY, Kim J-B, Kang DR. Development and Validation of a Real-Time Service Model for Noise Removal and Arrhythmia Classification Using Electrocardiogram Signals. Sensors. 2024; 24(16):5222. https://doi.org/10.3390/s24165222
Chicago/Turabian StylePark, Yeonjae, You Hyun Park, Hoyeon Jeong, Kise Kim, Ji Ye Jung, Jin-Bae Kim, and Dae Ryong Kang. 2024. "Development and Validation of a Real-Time Service Model for Noise Removal and Arrhythmia Classification Using Electrocardiogram Signals" Sensors 24, no. 16: 5222. https://doi.org/10.3390/s24165222
APA StylePark, Y., Park, Y. H., Jeong, H., Kim, K., Jung, J. Y., Kim, J.-B., & Kang, D. R. (2024). Development and Validation of a Real-Time Service Model for Noise Removal and Arrhythmia Classification Using Electrocardiogram Signals. Sensors, 24(16), 5222. https://doi.org/10.3390/s24165222