
The Framework of Quantifying Biomarkers of OCT and OCTA Images in Retinal Diseases


Abstract
1. Introduction
- (1)
- We propose a framework for the quantitative analysis of biomarkers associated with retinal diseases. To our knowledge, this is the first study to explore this quantitative analysis framework of retinal biomarkers from five feature types of aspects.
- (2)
- We quantify the significance of biomarkers by machine learning models. This approach systematically analyzes and ranks the importance of biomarkers based on OCT and OCTA images.
- (3)
- We demonstrate that the LBP feature of OCT and OCTA images is among the most crucial biomarkers, potentially serving as latent indicators for the clinical diagnosis of retinal diseases.
2. Methods
2.1. Data Description
2.2. Extraction of Feature Parameters Related to Retinal Diseases
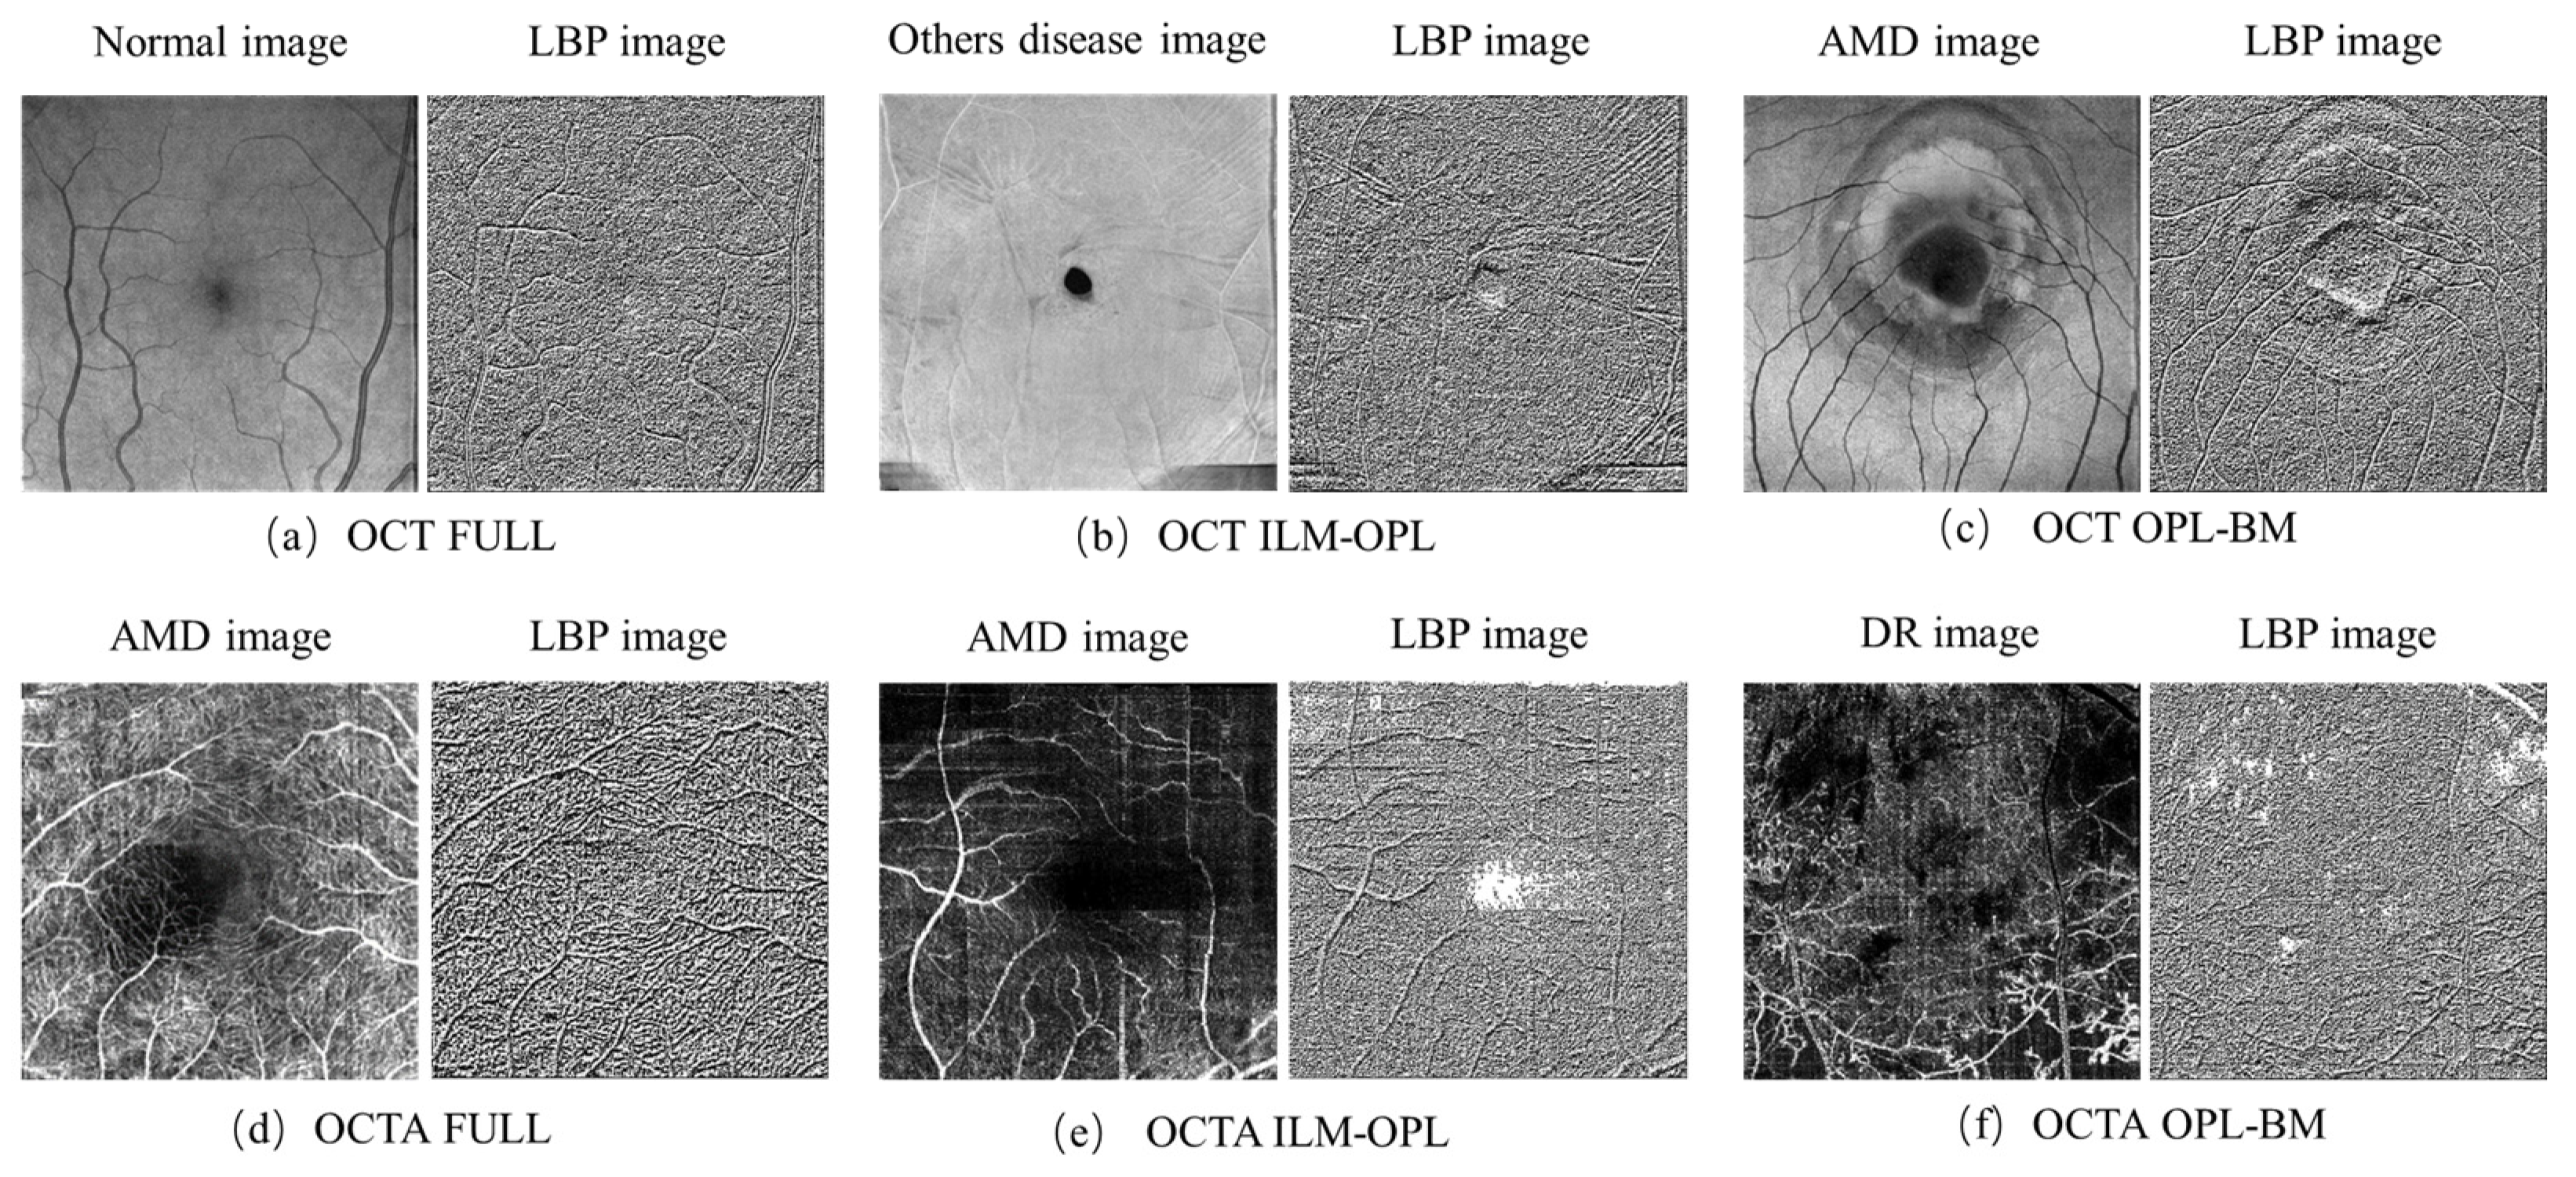
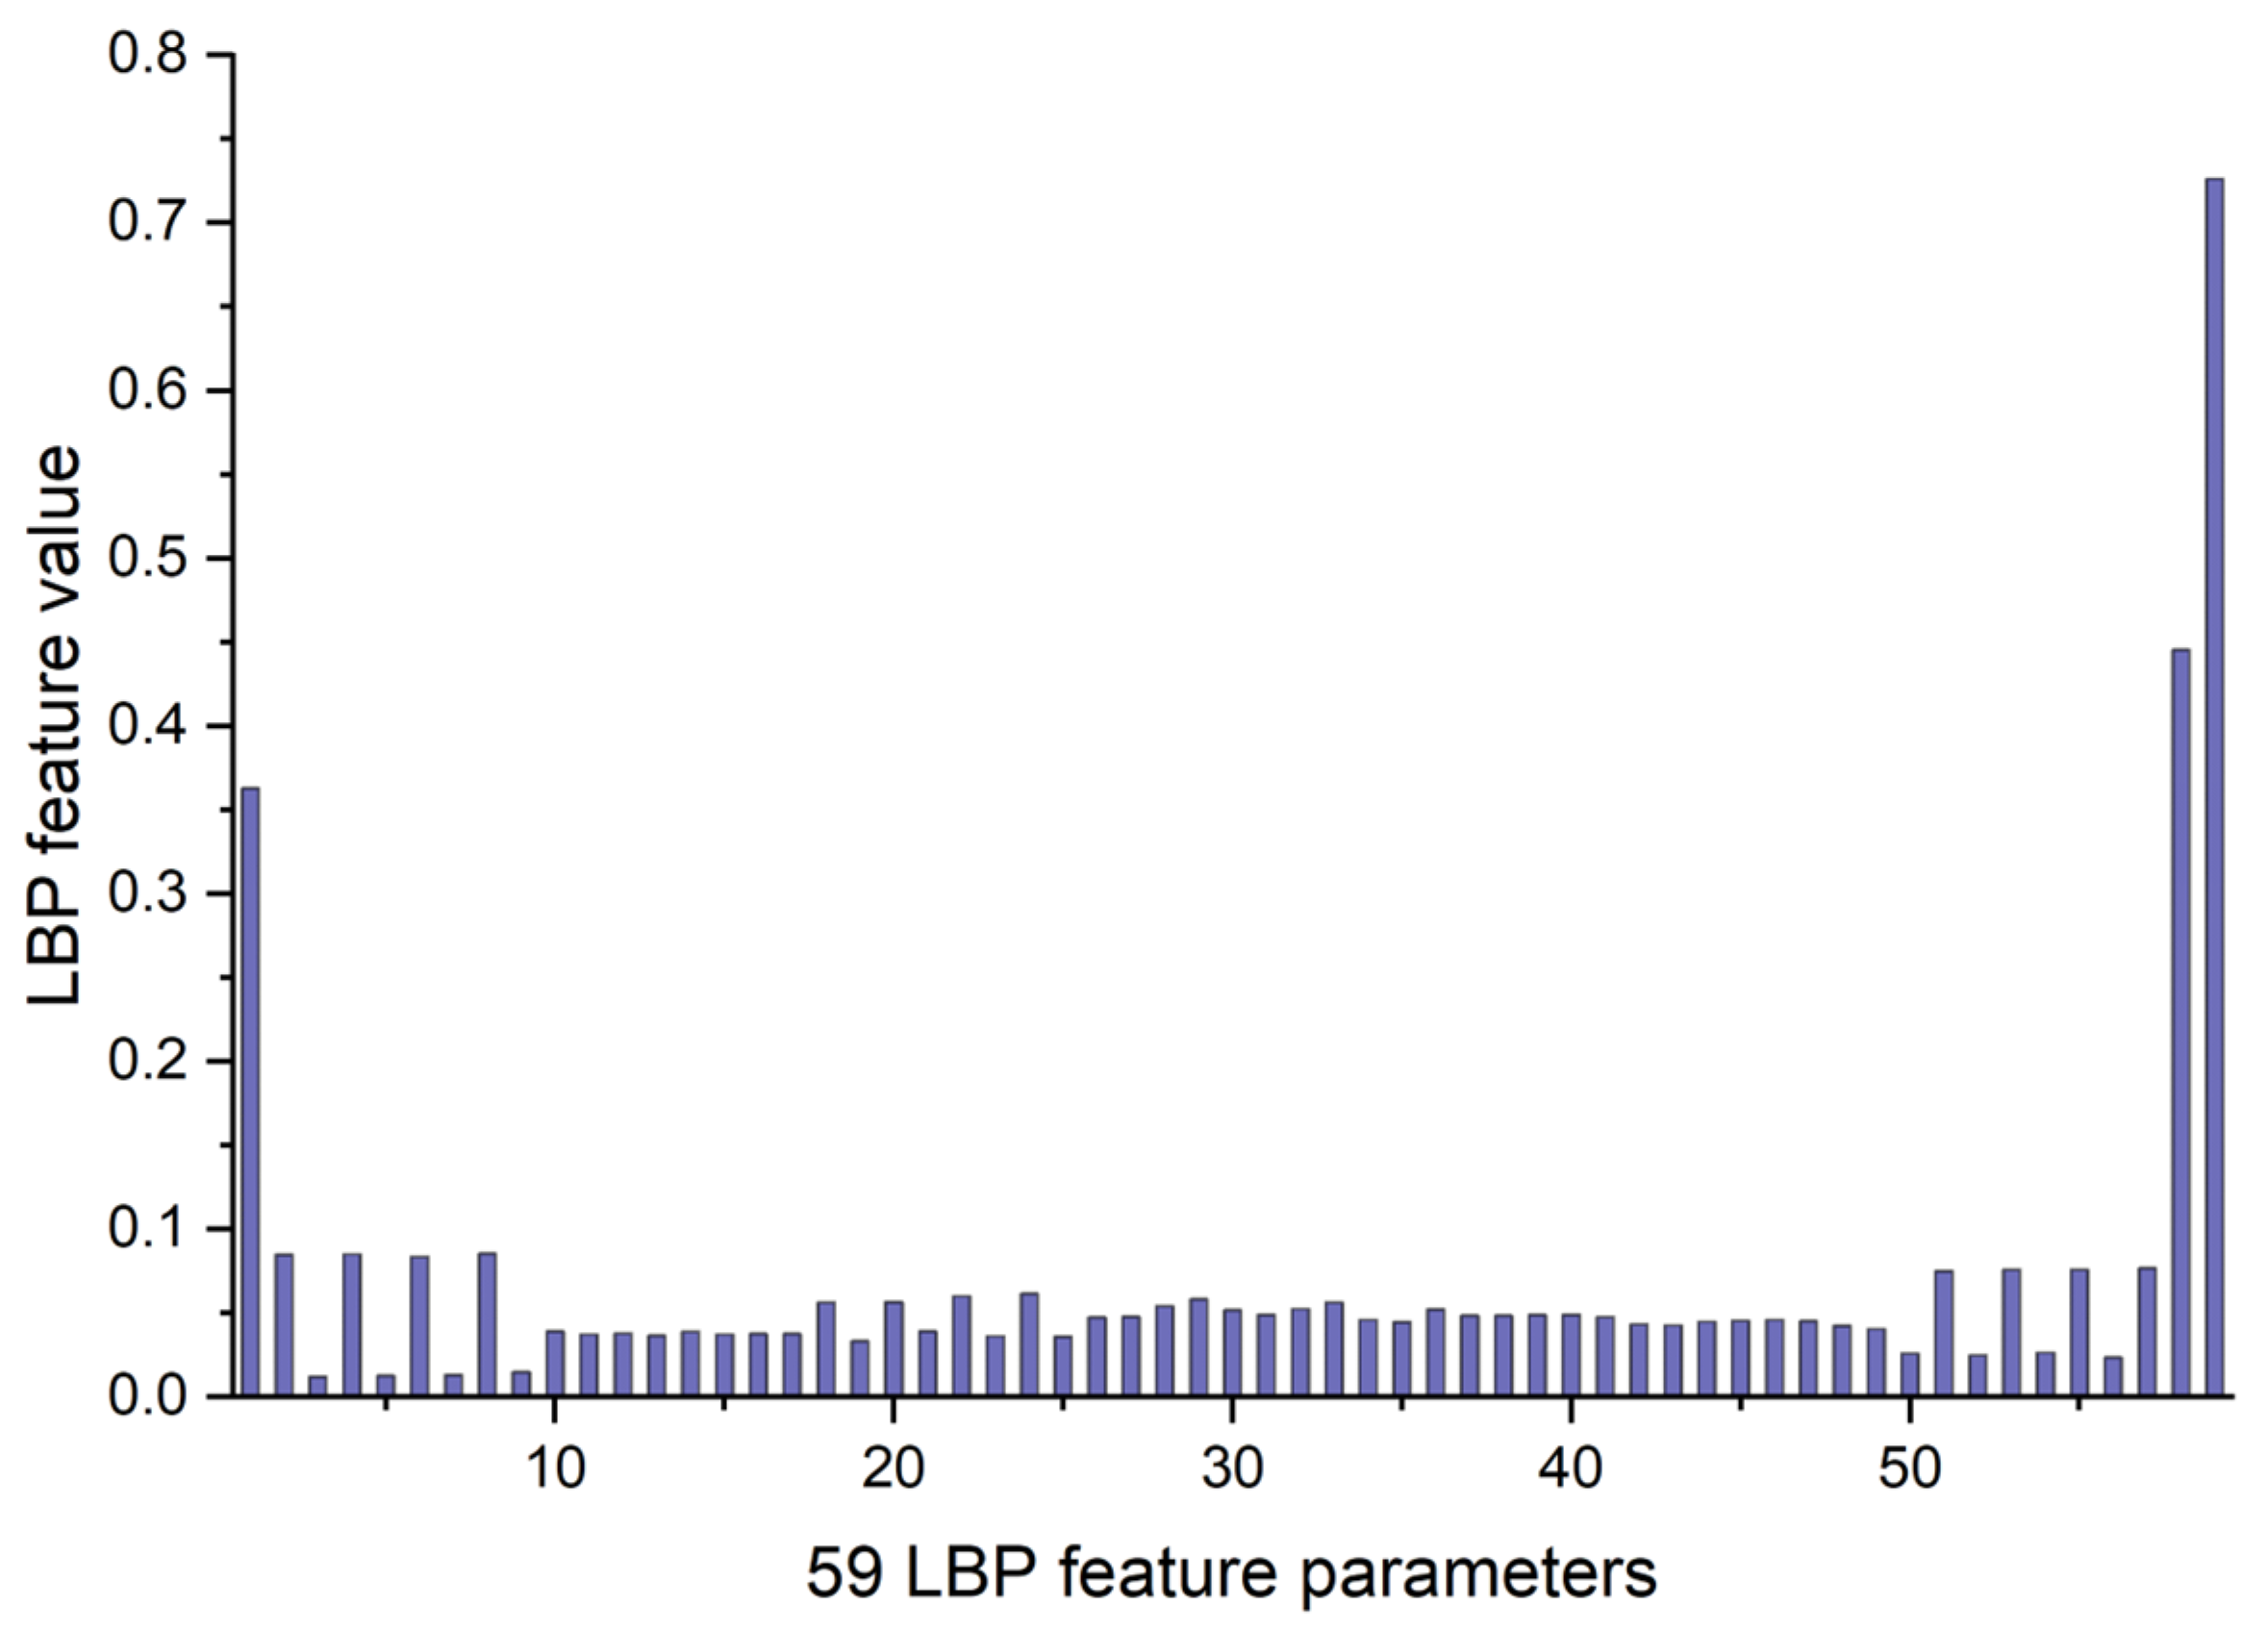
2.2.1. LBP Feature Parameters of OCT and OCTA Images
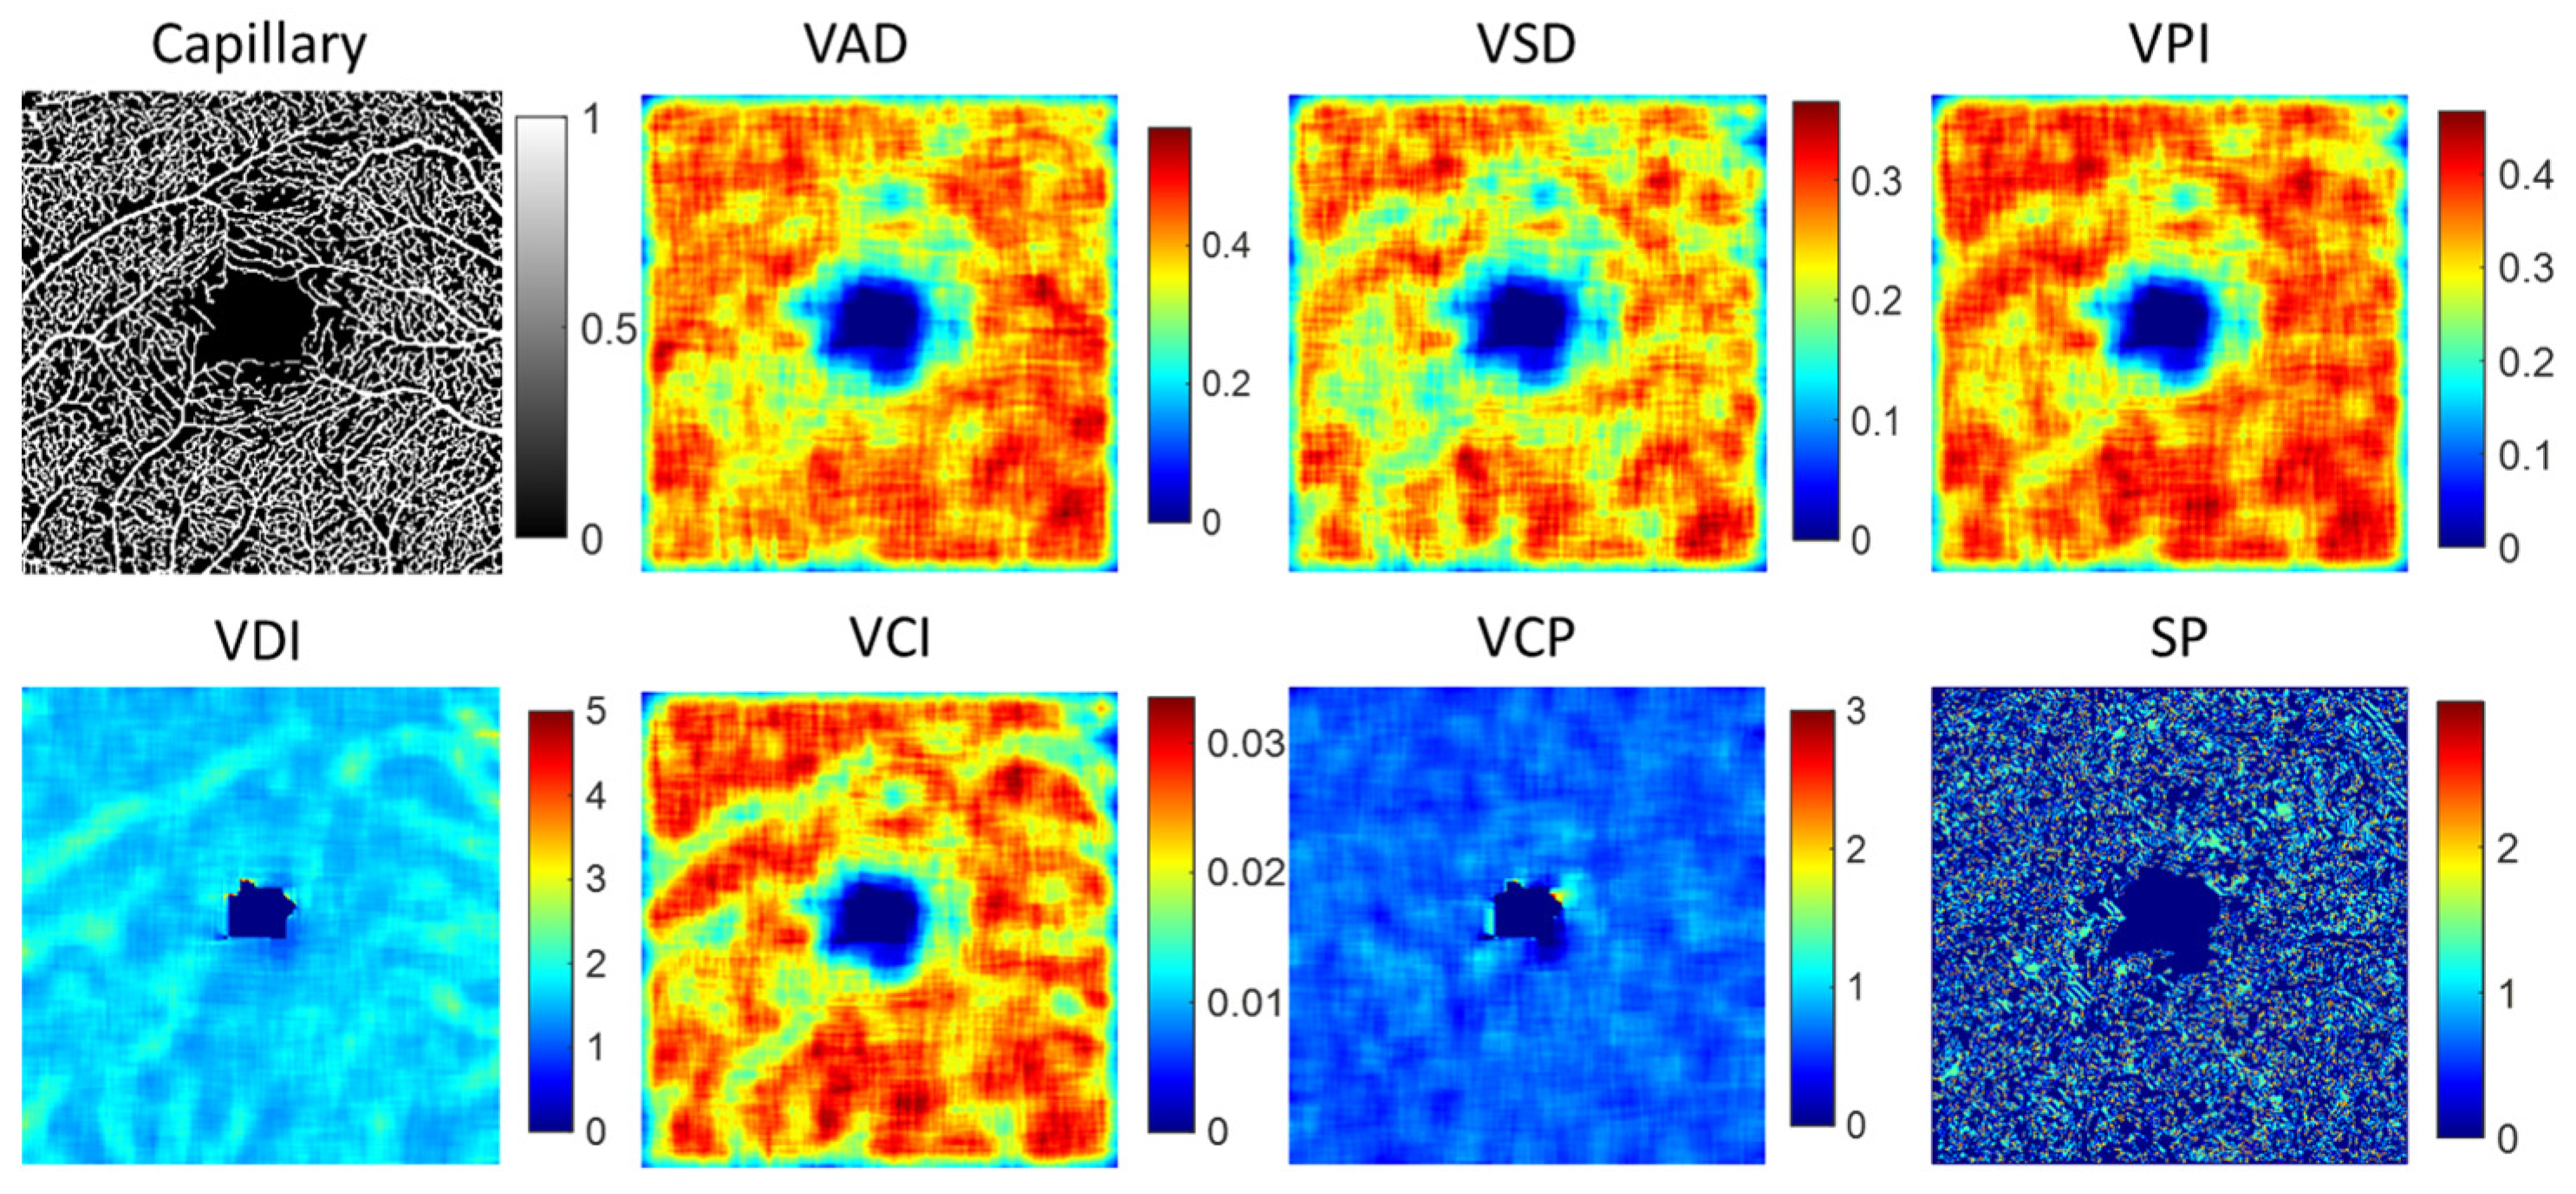
2.2.2. Vessel Feature of Capillary and Large Vessel
2.2.3. FAZ Feature
2.3. Statistical Analyses of Feature Parameters
2.4. Classification of Machine Learning Models
2.5. Performance Evaluation of Retinal Disease Classification
3. Results
3.1. LBP Feature Parameters of OCT and OCTA Images
3.2. Feature Parameters of Capillary and Large Vessel
3.3. FAZ Feature Parameters
3.4. Classification Performance of Different Features for Retinal Diseases
3.5. Quantifying the Importance of Biomarkers in Retinal Diseases
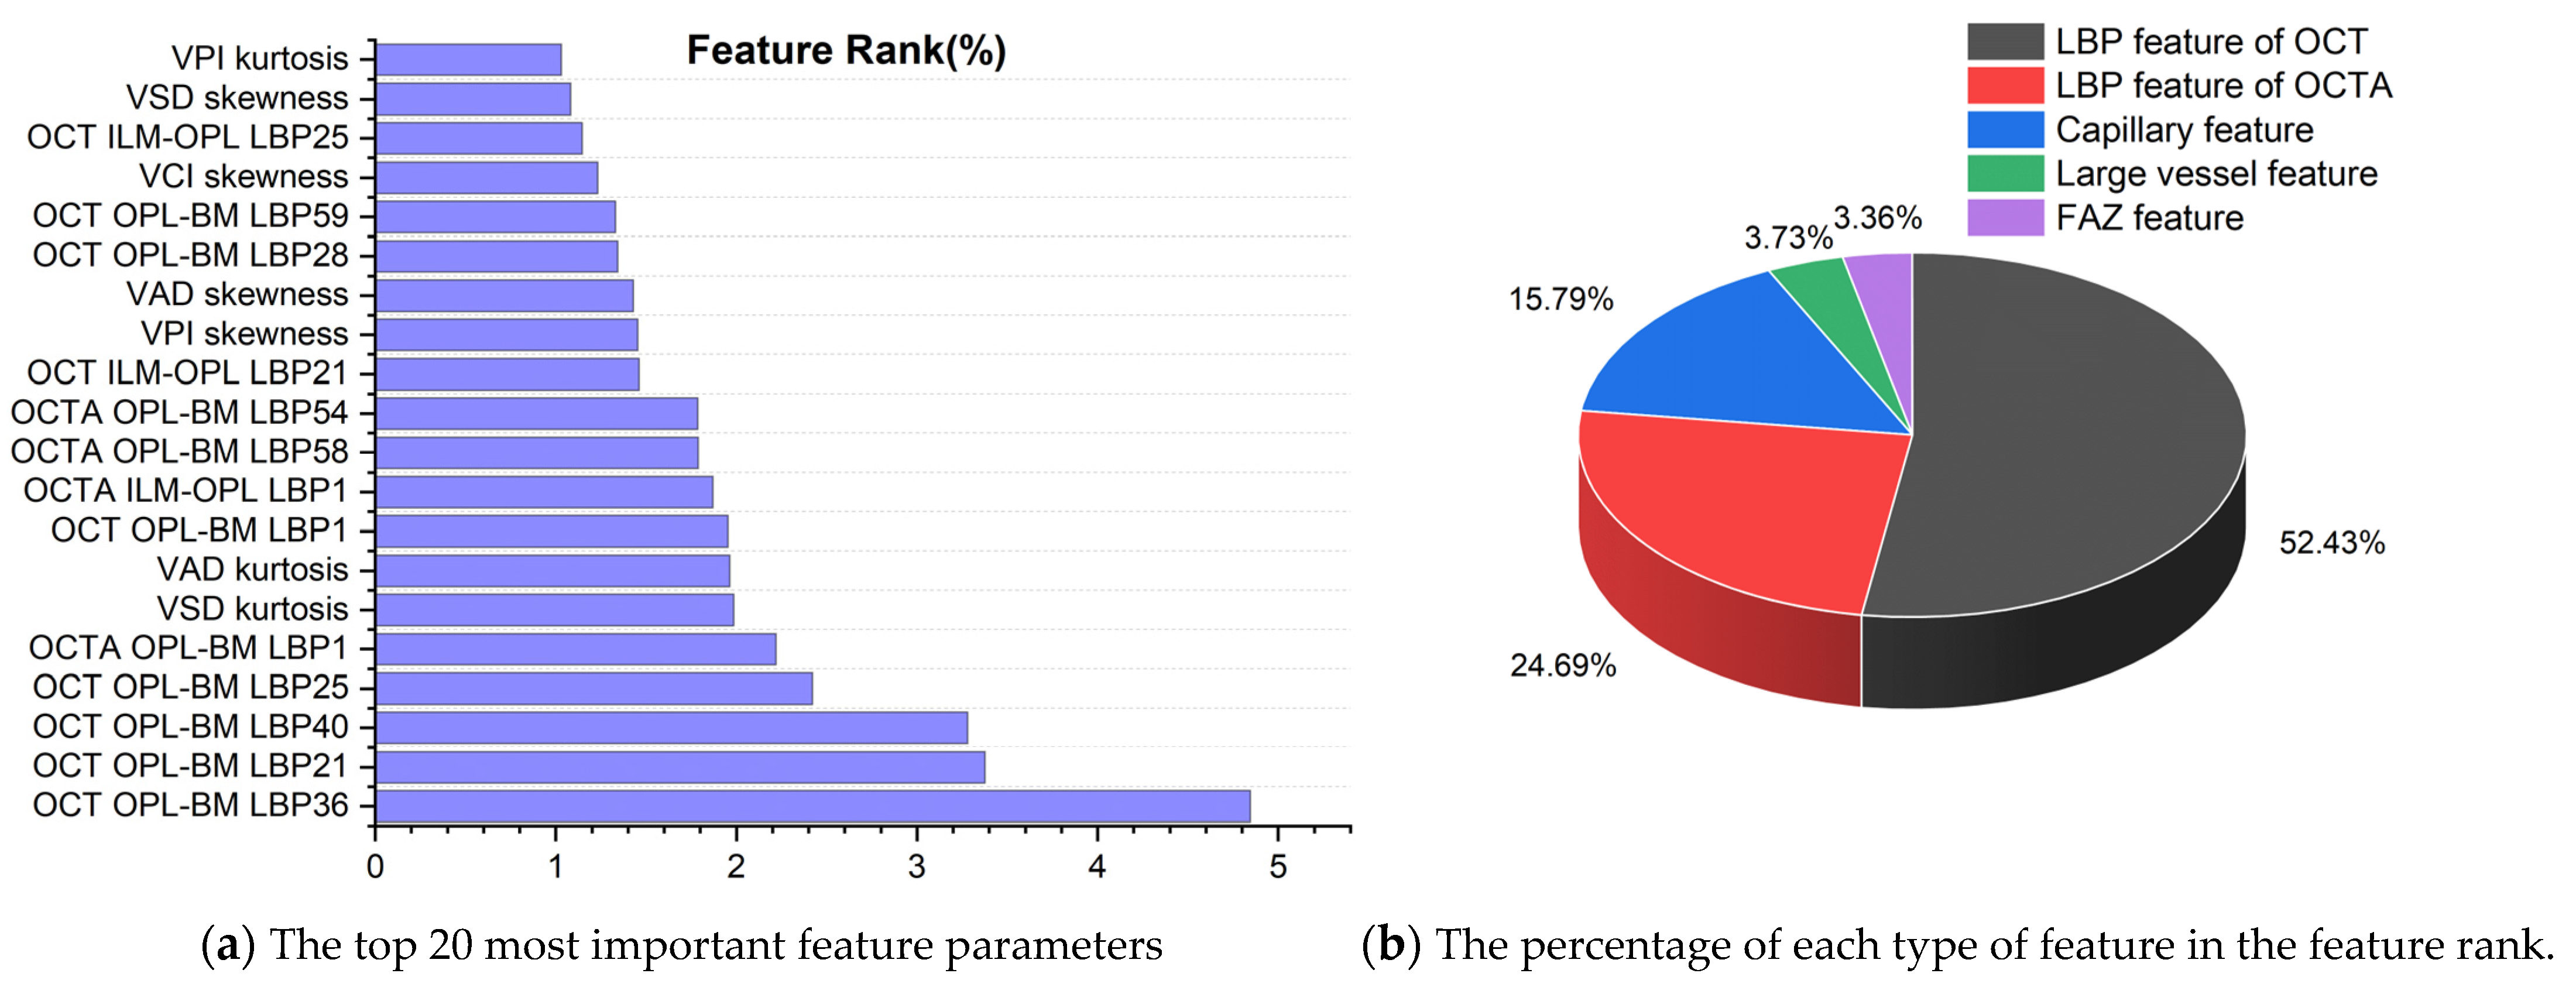
3.5.1. Biomarker Ranking of Predicting Retinal Diseases
3.5.2. Classification Contribution of 5 Types of Features
3.5.3. Analysis of the Most Important Features among 5 Types of Features
4. Discussion
5. Conclusions
Supplementary Materials
Author Contributions
Funding
Institutional Review Board Statement
Informed Consent Statement
Data Availability Statement
Conflicts of Interest
References
- Huang, K.; Ma, X.; Zhang, Z.; Zhang, Y.; Yuan, S.; Fu, H.; Chen, Q. Diverse Data Generation for Retinal Layer Segmentation with Potential Structure Modelling. IEEE Trans. Med. Imaging early access. 2024. [Google Scholar] [CrossRef]
- Kashani, A.H.; Chen, C.L.; Gahm, J.K.; Zheng, F.; Richter, G.M.; Rosenfeld, P.J.; Wang, R.K. Optical Coherence Tomography Angiography: A Comprehensive Review of Current Methods and Clinical Applications. Prog. Retin. Eye Res. 2017, 60, 66–100. [Google Scholar] [CrossRef]
- Mastropasqua, R.; Antonio, L.D.; Staso, S.D.; Agnifili, L.; Gregorio, A.D.; Ciancaglini, M.; Mastropasqua, L. Optical Coherence Tomography Angiography in Retinal Vascular Diseases and Choroidal Neovascularization. J. Ophthalmol. 2015, 2015, 343515. [Google Scholar] [CrossRef]
- Uji, A.; Balasubramanian, S.; Lei, J.; Baghdasaryan, E.; Al-Sheikh, M.; Sadda, S.R. Impact of Multiple En Face Image Averaging on Quantitative Assessment from Optical Coherence Tomography Angiography Images. Ophthalmology 2017, 124, 944–952. [Google Scholar] [CrossRef]
- Hogg, R.E.; Wright, D.M.; Dolz-Marco, R.; Gray, C.; Waheed, N.; Teussink, M.M.; Naskas, T.; Perais, J.; Das, R.; Quinn, N.; et al. Quantitative Parameters from OCT Angiography in Patients with Diabetic Retinopathy and in Those with Only Peripheral Retinopathy Compared with Control Participants. Ophthalmol. Sci. 2021, 1, 100030. [Google Scholar] [CrossRef]
- Hanson, R.L.; Airody, A.; Sivaprasad, S.; Gale, R.P. Optical Coherence Tomography Imaging Biomarkers Associated with Neovascular Age-Related Macular Degeneration: A Systematic Review. Eye 2023, 37, 2438–2453. [Google Scholar] [CrossRef]
- Kalra, G.; Zarranz-Ventura, J.; Chahal, R.; Bernal-Morales, C.; Lupidi, M.; Chhablani, J. Optical Coherence Tomography (OCT) Angiolytics: A Review of OCT Angiography Quantitative Biomarkers. Surv. Ophthalmol. 2022, 67, 1118–1134. [Google Scholar] [CrossRef]
- Chu, Z.; Lin, J.; Gao, C.; Xin, C.; Zhang, Q.; Chen, C.L.; Roisman, L.; Gregori, G.; Rosenfeld, P.J.; Wang, R.K. Quantitative Assessment of the Retinal Microvasculature Using Optical Coherence Tomography Angiography. J. Biomed. Opt. 2016, 21, 066008. [Google Scholar] [CrossRef]
- Zhao, Q.; Yang, W.L.; Wang, X.N.; Wang, R.K.; You, Q.S.; Chu, D.Z.; Xin, C.; Zhang, M.Y.; Li, D.J.; Wang, Z.Y.; et al. Repeatability and Reproducibility of Quantitative Assessment of the Retinal Microvasculature Using Optical Coherence Tomography Angiography Based on Optical Microangiography. Biomed. Environ. Sci. 2018, 31, 407–412. [Google Scholar]
- Yan, Y.; Zhou, X.; Chu, Z.; Stell, L.; Shariati, M.A.; Wang, R.K.; Liao, Y.J. Vision Loss in Optic Disc Drusen Correlates with Increased Macular Vessel Diameter and Flux and Reduced Peripapillary Vascular Density. Am. J. Ophthalmol. 2020, 218, 214–224. [Google Scholar] [CrossRef]
- Xu, B.; Chen, J.; Zhang, S.; Shen, S.; Lan, X.; Chen, Z.; Yan, Z.; Xu, B. Association between the Severity of Diabetic Retinopathy and Optical Coherence Tomography Angiography Metrics. Front. Endocrinol. 2021, 12, 777552. [Google Scholar] [CrossRef]
- Le, D.; Dadzie, A.; Son, T.; Lim, J.I.; Yao, X. Comparative Analysis of OCT and OCT Angiography Characteristics in Early Diabetic Retinopathy. Retina 2023, 43, 992–998. [Google Scholar] [CrossRef]
- Xie, Z.; Zeinstra, N.; Kirby, M.A.; Le, N.M.; Murry, C.E.; Zheng, Y.; Wang, R.K. Quantifying Microvascular Structure in Healthy and Infarcted Rat Hearts Using Optical Coherence Tomography Angiography. IEEE Trans. Med. Imaging 2024, 43, 2878–2887. [Google Scholar] [CrossRef]
- Agarwal, A.; Aggarwal, K.; Akella, M.; Agrawal, R.; Khandelwal, N.; Bansal, R.; Singh, R.; Gupta, V.; OCTA Study Group. Fractal Dimension and Optical Coherence Tomography Angiography Features of the Central Macula after Repair of Rhegmatogenous Retinal Detachments. Retina 2019, 39, 2167–2177. [Google Scholar] [CrossRef]
- Yu, S.; Lakshminarayanan, V. Fractal Dimension and Retinal Pathology: A Meta-Analysis. Appl. Sci. 2021, 11, 2376. [Google Scholar] [CrossRef]
- Engelmann, J.; Kearney, S.; McTrusty, A.; McKinlay, G.; Bernabeu, M.O.; Strang, N. Retinal Fractal Dimension Is a Potential Biomarker for Systemic Health—Evidence From a Mixed-Age, Primary-Care Population. Transl. Vis. Sci. Technol. 2024, 13, 19. [Google Scholar] [CrossRef]
- Ong, S.S.; Peavey, J.J.; Hiatt, K.D.; Whitlow, C.T.; Sappington, R.M.; Thompson, A.C.; Lockhart, S.N.; Chen, H.; Craft, S.; Rapp, S.R.; et al. Association of Fractal Dimension and Other Retinal Vascular Network Parameters with Cognitive Performance and Neuroimaging Biomarkers: The Multi-Ethnic Study of Atherosclerosis (MESA). Alzheimer’s Dement. 2024, 20, 941–953. [Google Scholar] [CrossRef] [PubMed]
- Kwon, J.; Choi, J.; Shin, J.W.; Lee, J.; Kook, M.S. An Optical Coherence Tomography Angiography Study of the Relationship between Foveal Avascular Zone Size and Retinal Vessel Density. Investig. Ophthalmol. Vis. Sci. 2018, 59, 4143–4153. [Google Scholar] [CrossRef]
- Ragkousis, A.; Kozobolis, V.; Kabanarou, S.; Bontzos, G.; Mangouritsas, G.; Heliopoulos, I.; Chatziralli, I. Vessel Density around Foveal Avascular Zone as a Potential Imaging Biomarker for Detecting Preclinical Diabetic Retinopathy: An Optical Coherence Tomography Angiography Study. Semin. Ophthalmol. 2020, 35, 316–323. [Google Scholar]
- Vujosevic, S.; Cunha-Vaz, J.; Figueira, J.; Löwenstein, A.; Midena, E.; Parravano, M.; Peto, T. Standardization of Optical Coherence Tomography Angiography Imaging Biomarkers in Diabetic Retinal Disease. Ophthalmic Res. 2021, 64, 871–887. [Google Scholar]
- Li, Y.K.; Fung, N.S.K.; Chan, J.C.; Choy, B.N.; Chow, L.L.; Shih, K.C.; Wong, I.Y. OCTA Biomarkers in Adults Aged 50 and Above: A Prospective and Cross-Sectional Community-Based Study. BMC Ophthalmol. 2023, 23, 71. [Google Scholar] [CrossRef]
- Hufendiek, K.; Lindziute, M.; Kaufeld, J.; Volkmann, I.; Brockmann, D.; Hosari, S.; Hufendiek, K. Investigation of OCTA Biomarkers in Fabry Disease: A Long Term Follow-up of Macular Vessel Area Density and Foveal Avascular Zone Metrics. Ophthalmol. Ther. 2023, 12, 2713–2727. [Google Scholar] [CrossRef]
- Kim, K.; Kim, E.S.; Yu, S.Y. Optical Coherence Tomography Angiography Analysis of Foveal Microvascular Changes and Inner Retinal Layer Thinning in Patients with Diabetes. Br. J. Ophthalmol. 2018, 102, 1226–1231. [Google Scholar] [CrossRef]
- Shiihara, H.; Terasaki, H.; Sonoda, S.; Kakiuchi, N.; Shinohara, Y.; Tomita, M.; Sakamoto, T. Objective Evaluation of Size and Shape of Superficial Foveal Avascular Zone in Normal Subjects by Optical Coherence Tomography Angiography. Sci. Rep. 2018, 8, 10143. [Google Scholar] [CrossRef]
- Ersoz, M.G.; Hocaoglu, M.; Arf, S.; Karacorlu, M. Macular Telangiectasia Type 2: Acircularity Index and Quantitative Assessment of Foveal Avascular Zone Using Optical Coherence Tomography Angiography. Retina 2020, 40, 1132–1139. [Google Scholar] [CrossRef]
- Piao, H.; Guo, Y.; Zhang, H.; Sung, M.S.; Park, S.W. Acircularity and Circularity Indexes of the Foveal Avascular Zone in High Myopia. Sci. Rep. 2021, 11, 16808. [Google Scholar] [CrossRef]
- Werner, J.U.; Dreyhaupt, J.; Enders, C. Evaluation of Automated Measurement of Macular Ischemic Changes in Retinal Vein Occlusion with Optical Coherence Tomography Angiography. Ophthalmic Surg. Lasers Imaging Retin. 2023, 54, 462–469. [Google Scholar] [CrossRef]
- Mao, J.; Lin, J.; Zhu, L.; Liu, C.; Yu, X.; Zhang, C.; Chen, Y.; Zhang, Y.; Shen, L. Quantitative Assessment of Retinal Capillary Vessel Density and Foveal Avascular Zone Area in Central Serous Chorioretinopathy Using OCTA. Ophthalmologica 2020, 243, 370–378. [Google Scholar] [CrossRef]
- DaCosta, J.; Bhatia, D.; Talks, J. The Use of Optical Coherence Tomography Angiography and Optical Coherence Tomography to Predict Visual Acuity in Diabetic Retinopathy. Eye 2020, 34, 942–947. [Google Scholar] [CrossRef]
- Lemaître, G.; Rastgoo, M.; Massich, J.; Cheung, C.Y.; Wong, T.Y.; Lamoureux, E.; Milea, D.; Mériaudeau, F.; Sidibé, D. Classification of SD-OCT Volumes Using Local Binary Patterns: Experimental Validation for DME Detection. J. Ophthalmol. 2016, 2016, 3298606. [Google Scholar] [CrossRef] [PubMed]
- Alfahaid, A.; Morris, T.; Cootes, T.; Keane, P.A.; Khalid, H.; Pontikos, N.; Sergouniotis, P.; Balaskas, K. A Hybrid Machine Learning Approach Using LBP Descriptor and PCA for Age-Related Macular Degeneration Classification in OCTA Images. In Annual Conference on Medical Image Understanding and Analysis; Springer International Publishing: Cham, Switzerland, 2016; pp. 231–241. [Google Scholar]
- Li, M.; Chen, Y.; Ji, Z.; Xie, K.; Yuan, S.; Chen, Q.; Li, S. Image Projection Network: 3D to 2D Image Segmentation in OCTA Images. IEEE Trans. Med. Imaging 2020, 39, 3343–3354. [Google Scholar] [CrossRef] [PubMed]
- Uji, A.; Murakami, T.; Nishijima, K.; Akagi, T.; Horii, T.; Arakawa, N.; Yoshimura, N. Association between hyperreflective foci in the outer retina, status of photoreceptor layer, and visual acuity in diabetic macular edema. Am. J. Ophthalmol. 2012, 153, 710–717. [Google Scholar] [CrossRef] [PubMed]
- Kaplan, K.; Kaya, Y.; Kuncan, M.; Ertunç, H.M. Brain Tumor Classification Using Modified Local Binary Patterns (LBP) Feature Extraction Methods. Med. Hypotheses 2020, 139, 109696. [Google Scholar] [CrossRef] [PubMed]
- Alam, M.; Zhang, Y.; Lim, J.I.; Chan, R.V.; Yang, M.; Yao, X. Quantitative Optical Coherence Tomography Angiography Features for Objective Classification and Staging of Diabetic Retinopathy. Retina 2020, 40, 322–332. [Google Scholar] [CrossRef] [PubMed]
- Wang, J.; Rao, C.; Goh, M.; Xiao, X. Risk assessment of coronary heart disease based on cloud-random forest. Artif. Intell. Rev. 2023, 56, 203–232. [Google Scholar] [CrossRef]
- Chen, T.; Guestrin, C. Xgboost: A Scalable Tree Boosting System. In Proceedings of the 22nd ACM SIGKDD International Conference on Knowledge Discovery and Data Mining, San Francisco, CA, USA, 13–17 August 2016; pp. 785–794. [Google Scholar]
- Hancock, J.T.; Khoshgoftaar, T.M. CatBoost for Big Data: An Interdisciplinary Review. J. Big Data 2020, 7, 94. [Google Scholar] [CrossRef] [PubMed]
- Ke, G.; Meng, Q.; Finley, T.; Wang, T.; Chen, W.; Ma, W.; Ye, Q.; Liu, T.Y. Lightgbm: A Highly Efficient Gradient Boosting Decision Tree. In Proceedings of the Advances in Neural Information Processing Systems, Long Beach, CA, USA, 4–9 December 2017; Volume 30. [Google Scholar]
- Cortes, C.; Vapnik, V. Support-Vector Networks. Mach. Learn. 1995, 20, 273–297. [Google Scholar] [CrossRef]
- Désir, C.; Petitjean, C.; Heutte, L.; Salaun, M.; Thiberville, L. Classification of Endomicroscopic Images of the Lung Based on Random Subwindows and Extra-Trees. IEEE Trans. Biomed. Eng. 2012, 59, 2677–2683. [Google Scholar] [CrossRef] [PubMed]
- Raj, R.; Mathew, J.; Kannath, S.K.; Rajan, J. StrokeViT with AutoML for Brain Stroke Classification. Eng. Appl. Artif. Intell. 2023, 119, 105772. [Google Scholar] [CrossRef]
- Abiodun, O.I.; Jantan, A.; Omolara, A.E.; Dada, K.V.; Mohamed, N.A.; Arshad, H. State-of-the-Art in Artificial Neural Network Applications: A Survey. Heliyon 2018, 4, e00938. [Google Scholar] [CrossRef]
- Giannotti, A.; Lo Vecchio, S.; Musco, S.; Pollina, L.; Vallone, F.; Strauss, I.; Paggi, V.; Bernini, F.; Gabisonia, K.; Carlucci, L.; et al. Decoding Bladder State from Pudendal Intraneural Signals in Pigs. APL Bioeng. 2023, 7, 046101. [Google Scholar] [CrossRef]
- Yasser, I.; Khalifa, F.; Abdeltawab, H.; Ghazal, M.; Sandhu, H.S.; El-Baz, A. Automated Diagnosis of Optical Coherence Tomography Angiography (OCTA) Based on Machine Learning Techniques. Sensors 2022, 22, 2342. [Google Scholar] [CrossRef]
- Cunha-Vaz, J.; Ribeiro, L.; Lobo, C. Phenotypes and Biomarkers of Diabetic Retinopathy. Prog. Retin. Eye Res. 2014, 41, 90–111. [Google Scholar] [CrossRef]
- Curtis, T.M.; Gardiner, T.A.; Stitt, A.W. Microvascular Lesions of Diabetic Retinopathy: Clues towards Understanding Pathogenesis? Eye 2009, 23, 1496–1508. [Google Scholar] [CrossRef]
- O’Leary, F.; Campbell, M. The Blood–Retina Barrier in Health and Disease. FEBS J. 2023, 290, 878–891. [Google Scholar] [CrossRef]
- Morgan, J.I.; Chui, T.Y.; Grieve, K. Twenty-Five Years of Clinical Applications Using Adaptive Optics Ophthalmoscopy. Biomed. Opt. Express 2023, 14, 387–428. [Google Scholar] [CrossRef]
- Lin, A.; Fang, D.; Li, C.; Cheung, C.Y.; Chen, H. Improved Automated Foveal Avascular Zone Measurement in Cirrus Optical Coherence Tomography Angiography Using the Level Sets Macro. Transl. Vis. Sci. Technol. 2020, 9, 20. [Google Scholar] [CrossRef]
- Akıdan, M.; Erol, M.K.; Gedik, B.; Doğan, M.E.; Başol, I.; Süren, E. Changes in Outcomes of Macular Optical Coherence Tomography Angiography Following Surgery for Optic Disc Pit Maculopathy. Diagnostics 2024, 14, 874. [Google Scholar] [CrossRef]
- Ahmadzadeh Amiri, A.; Sheikh Rezaee, M.R.; Ahmadzadeh Amiri, A.; Soleymanian, T.; Jafari, R.; Ahmadzadeh Amiri, A. Macular Optical Coherence Tomography Angiography in Nephropathic Patients with Diabetic Retinopathy in Iran: A Prospective Case–Control Study. Ophthalmol. Ther. 2020, 9, 139–148. [Google Scholar] [CrossRef]


| Vessel Features | Definition | Description |
|---|---|---|
| Fractal dimension (FD) | Measured the complexity or irregularity of vessel structure. | |
| Vessel area density (VAD) | The ratio of the vessel area to local window | Quantified the proportion of the area occupied by blood vessels, providing a measure of vascular density. |
| Vessel skeleton density (VSD) | The ratio of the total length of the vessel skeleton to local window | Quantified the density of the vessel network, providing insights into the vascular branching and connectivity. |
| Vessel perimeter index (VPI) | The ratio of vessel perimeter to local window | Quantified the length of the vessel boundary, providing insights into the morphology and branching patterns. |
| Vessel diameter index (VDI) | VAD/VSD | Quantified the relationship between the density of blood vessels and the density of the vessel skeleton. |
| Vessel complexity index (VCI) | Quantifies the complexity of blood vessels by assessing the relationship between vessel perimeter, vessel area density, and the circularity of vessels. | |
| Vessel complexity (VCP) | The ratio of the number of branch points to the vessel length | Measured of the complexity of the vascular network. |
| Shape (SP) | Quantified the degree of bending or deviation from a straight path along their length. |
| FAZ Features | Definition | Description |
|---|---|---|
| FAZ area | The sum of pixels in the FAZ region | The avascular region at the center of the fovea in the retina. |
| FAZ perimeter | Distance around the boundary of the FAZ region | Measurements of FAZ size |
| FAZ CI | Measured the circularity of the FAZ, with values nearing 1 indicating a circular shape and deviations from 1 indicating irregularities. | |
| Diameter | The diameter of a circle with the same area as the FAZ region | |
| FAZ centroid coordinatesx and y | The centroid of the FAZ region | The centroid parameter of the FAZ region represents the geometric center of the foveal avascular zone |
| Eccentricity | Eccentricity of ellipses with the same second-order moment as the FAZ region | Measured the degree of deviation from a perfect circle in the shape of the foveal avascular zone. |
| FAZ compactness | The ratio of the number of pixels in the FAZ region to the total number of pixels in the bounding box | Quantified the compactness of the foveal avascular zone. A value closer to 1 indicates a more compact FAZ region with a concentrated pixel distribution, while a smaller value suggests a more dispersed area. |
| FAZ flatness | The approximate ellipse’s minor axis divided by the major axis in the FAZ region | Described shape of FAZ, allowing evaluation of whether the FAZ region exhibits an elliptical shape. |
| FAZ anisotropy index | This ratio measures the deviation of the foveal avascular zone’s perimeter from that of an ideal circle, indicating the irregularity of the FAZ region’s shape | |
| FAZ Convexity | Area/convex area | The proportion of pixels within the FAZ region of the convex hull. |
| FAZ angle | The inclination angle of FAZ approximate ellipse | Described the directional characteristic of the FAZ region |
| OCT LBP Parameters | Control | Retinal Disease | p Value | OCTA LBP Parameters | Control | Retinal Disease | p Value |
|---|---|---|---|---|---|---|---|
| OPL-BM LBP36 | 0.046 | 0.058 | 2.95 × 10−52 | OPL-BM LBP1 | 0.368 | 0.345 | 1.25 × 10−42 |
| OPL-BM LBP21 | 0.037 | 0.045 | 2.48 × 10−48 | OPL-BM LBP58 | 0.464 | 0.503 | 2.97 × 10−41 |
| OPL-BM LBP40 | 0.045 | 0.055 | 1.95 × 10−47 | OPL-BM LBP50 | 0.022 | 0.025 | 1.14 × 10−39 |
| OPL-BM LBP25 | 0.036 | 0.043 | 2.27 × 10−41 | OPL-BM LBP54 | 0.022 | 0.025 | 2.37 × 10−39 |
| ILM-OPL LBP21 | 0.034 | 0.041 | 1.96 × 10−39 | OPL-BM LBP52 | 0.021 | 0.025 | 3.74 × 10−39 |
| OPL-BM LBP29 | 0.055 | 0.068 | 1.08 × 10−36 | OPL-BM LBP56 | 0.022 | 0.025 | 4.32 × 10−37 |
| ILM-OPL LBP25 | 0.032 | 0.038 | 5.51 × 10⁻³⁵ | ILM-OPL LBP1 | 0.369 | 0.346 | 1.87 × 10⁻³⁵ |
| ILM-OPL LBP29 | 0.048 | 0.058 | 1.29 × 10⁻³² | OPL-BM LBP55 | 0.080 | 0.074 | 1.26 × 10⁻³³ |
| OPL-BM LBP28 | 0.055 | 0.067 | 3.26 × 10⁻³² | ILM-OPL LBP58 | 0.463 | 0.501 | 4.53 × 10⁻³³ |
| OPL-BM LBP33 | 0.054 | 0.065 | 8.59 × 10⁻³² | OPL-BM LBP7 | 0.017 | 0.015 | 1.93 × 10⁻³¹ |
| Capillary Feature | Control | Retinal Disease | p Value | Large Vessel Feature | Control | Retinal Disease | p Value |
|---|---|---|---|---|---|---|---|
| VSD skewness | −1.157 | −0.514 | 3.74 × 10−36 | VCI std | 0.0010 | 0.0012 | 9.11 × 10⁻²² |
| VAD skewness | −1.575 | −0.804 | 4.37 × 10−36 | VSD std | 0.0099 | 0.0117 | 1.34 × 10⁻²⁰ |
| VCI skewness | −1.114 | −0.504 | 4.98 × 10⁻³⁵ | VPI std | 0.0180 | 0.0208 | 7.07 × 10⁻²⁰ |
| VPI skewness | −1.541 | −0.813 | 6.04 × 10⁻³⁵ | VCI max | 0.0054 | 0.0063 | 3.25 × 10⁻¹⁷ |
| VAD kurtosis | 6.325 | 4.027 | 6.46 × 10⁻³² | VSD max | 0.0543 | 0.0625 | 5.99 × 10⁻¹⁷ |
| VPI kurtosis | 6.082 | 3.829 | 2.12 × 10⁻³¹ | VPI max | 0.0972 | 0.1100 | 6.49 × 10⁻¹⁶ |
| VSD kurtosis | 4.898 | 3.311 | 5.72 × 10⁻³¹ | VCI mean | 0.0025 | 0.0029 | 3.33 × 10⁻¹⁵ |
| VCI kurtosis | 4.481 | 3.077 | 4.16 × 10⁻²⁷ | VPI median | 0.0446 | 0.0526 | 3.92 × 10⁻¹⁵ |
| VSD median | 0.256 | 0.210 | 2.81 × 10⁻²⁶ | VCI median | 0.0025 | 0.0030 | 4.26 × 10⁻¹⁵ |
| VPI median | 0.360 | 0.303 | 5.85 × 10⁻²⁶ | VSD median | 0.0248 | 0.0294 | 4.45 × 10⁻¹⁵ |
| FAZ Feature | Control | Retinal Disease | p Value |
|---|---|---|---|
| FAZ CI | 0.607 | 0.514 | 4.63 × 10⁻¹⁴ |
| FAZ anisotropy index | 1.306 | 1.446 | 1.42 × 10⁻¹² |
| FAZ area | 0.027 | 0.018 | 7.52 × 10⁻¹⁰ |
| FAZ flatness | 0.874 | 0.817 | 9.41 × 10⁻¹⁰ |
| Eccentricity | 0.465 | 0.547 | 9.41 × 10⁻¹⁰ |
| FAZ Convexity | 0.870 | 0.845 | 2.26 × 10−07 |
| FAZ compactness | 0.633 | 0.607 | 2.6 × 10−06 |
| Diameter | 57.096 | 52.078 | 6.56 × 10−05 |
| FAZ perimeter | 0.721 | 0.646 | 9.98 × 10−05 |
| FAZ centroid coordinates y | 0.498 | 0.507 | 0.004773 |
| Classification Model | Different Features | 2-Class (Control and Retinal Disease) | 4-Class (Control, AMD, DR and Others) | ||||||
|---|---|---|---|---|---|---|---|---|---|
| Accuracy | Precision | Sensitivity | F1-Score | Accuracy | Precision | Sensitivity | F1-Score | ||
| Random Forest | All features | 0.912 | 0.964 | 0.855 | 0.906 | 0.752 | 0.769 | 0.752 | 0.716 |
| Capillary | 0.800 | 0.768 | 0.855 | 0.809 | 0.592 | 0.601 | 0.592 | 0.590 | |
| Large vessel | 0.776 | 0.718 | 0.903 | 0.800 | 0.568 | 0.578 | 0.568 | 0.546 | |
| FAZ | 0.744 | 0.703 | 0.839 | 0.765 | 0.584 | 0.597 | 0.584 | 0.572 | |
| LBP feature of OCT | 0.824 | 0.900 | 0.726 | 0.804 | 0.688 | 0.672 | 0.688 | 0.668 | |
| LBP feature of OCTA | 0.792 | 0.773 | 0.823 | 0.797 | 0.608 | 0.623 | 0.608 | 0.591 | |
| XGBoost | All features | 0.904 | 0.981 | 0.823 | 0.895 | 0.728 | 0.729 | 0.728 | 0.712 |
| Capillary | 0.744 | 0.727 | 0.774 | 0.750 | 0.600 | 0.593 | 0.600 | 0.595 | |
| Large vessel | 0.720 | 0.685 | 0.806 | 0.741 | 0.496 | 0.498 | 0.496 | 0.495 | |
| FAZ | 0.704 | 0.676 | 0.774 | 0.722 | 0.560 | 0.527 | 0.560 | 0.536 | |
| LBP feature of OCT | 0.840 | 0.904 | 0.758 | 0.825 | 0.656 | 0.634 | 0.656 | 0.640 | |
| LBP feature of OCTA | 0.752 | 0.718 | 0.823 | 0.767 | 0.608 | 0.562 | 0.608 | 0.581 | |
| Catboost | All features | 0.896 | 0.980 | 0.806 | 0.885 | 0.720 | 0.714 | 0.720 | 0.706 |
| Capillary | 0.760 | 0.735 | 0.806 | 0.769 | 0.592 | 0.591 | 0.592 | 0.588 | |
| Large vessel | 0.760 | 0.711 | 0.871 | 0.783 | 0.520 | 0.537 | 0.520 | 0.510 | |
| FAZ | 0.728 | 0.712 | 0.758 | 0.734 | 0.536 | 0.512 | 0.536 | 0.520 | |
| LBP feature of OCT | 0.848 | 0.978 | 0.710 | 0.822 | 0.680 | 0.669 | 0.680 | 0.672 | |
| LBP feature of OCTA | 0.816 | 0.800 | 0.839 | 0.819 | 0.672 | 0.651 | 0.672 | 0.654 | |
| LightGBM | All features | 0.896 | 0.980 | 0.806 | 0.885 | 0.728 | 0.725 | 0.728 | 0.708 |
| Capillary | 0.792 | 0.773 | 0.823 | 0.797 | 0.568 | 0.551 | 0.568 | 0.555 | |
| Large vessel | 0.704 | 0.676 | 0.774 | 0.722 | 0.480 | 0.459 | 0.480 | 0.468 | |
| FAZ | 0.720 | 0.701 | 0.758 | 0.729 | 0.592 | 0.623 | 0.592 | 0.580 | |
| LBP feature of OCT | 0.824 | 0.917 | 0.710 | 0.800 | 0.688 | 0.666 | 0.688 | 0.673 | |
| LBP feature of OCTA | 0.800 | 0.768 | 0.855 | 0.809 | 0.608 | 0.604 | 0.608 | 0.594 | |
| SVM | All features | 0.848 | 0.906 | 0.774 | 0.835 | 0.648 | 0.650 | 0.648 | 0.648 |
| Capillary | 0.768 | 0.739 | 0.823 | 0.779 | 0.624 | 0.662 | 0.624 | 0.635 | |
| Large vessel | 0.736 | 0.699 | 0.823 | 0.756 | 0.352 | 0.475 | 0.352 | 0.387 | |
| FAZ | 0.752 | 0.816 | 0.645 | 0.721 | 0.552 | 0.612 | 0.552 | 0.574 | |
| LBP feature of OCT | 0.848 | 0.922 | 0.758 | 0.832 | 0.600 | 0.616 | 0.600 | 0.607 | |
| LBP feature of OCTA | 0.848 | 0.864 | 0.823 | 0.843 | 0.608 | 0.636 | 0.608 | 0.617 | |
| ExtraTrees | All features | 0.896 | 0.945 | 0.839 | 0.889 | 0.704 | 0.741 | 0.704 | 0.661 |
| Capillary | 0.752 | 0.738 | 0.774 | 0.756 | 0.632 | 0.607 | 0.632 | 0.607 | |
| Large vessel | 0.752 | 0.701 | 0.871 | 0.777 | 0.536 | 0.539 | 0.536 | 0.501 | |
| FAZ | 0.752 | 0.731 | 0.790 | 0.760 | 0.536 | 0.491 | 0.536 | 0.507 | |
| LBP feature of OCT | 0.840 | 0.904 | 0.758 | 0.825 | 0.696 | 0.690 | 0.696 | 0.671 | |
| LBP feature of OCTA | 0.792 | 0.757 | 0.855 | 0.803 | 0.600 | 0.572 | 0.600 | 0.569 | |
| Embed Net | All features | 0.864 | 0.941 | 0.774 | 0.850 | 0.728 | 0.751 | 0.728 | 0.717 |
| Capillary | 0.744 | 0.714 | 0.806 | 0.758 | 0.592 | 0.589 | 0.592 | 0.590 | |
| Large vessel | 0.760 | 0.705 | 0.887 | 0.786 | 0.464 | 0.465 | 0.464 | 0.464 | |
| FAZ | 0.696 | 0.688 | 0.710 | 0.698 | 0.472 | 0.472 | 0.472 | 0.472 | |
| LBP feature of OCT | 0.832 | 0.902 | 0.742 | 0.814 | 0.672 | 0.666 | 0.672 | 0.663 | |
| LBP feature of OCTA | 0.784 | 0.787 | 0.774 | 0.780 | 0.624 | 0.602 | 0.624 | 0.609 | |
| Neural Net | All features | 0.856 | 1.000 | 0.710 | 0.830 | 0.744 | 0.755 | 0.744 | 0.725 |
| Capillary | 0.768 | 0.780 | 0.742 | 0.760 | 0.568 | 0.564 | 0.568 | 0.563 | |
| Large vessel | 0.688 | 0.689 | 0.677 | 0.683 | 0.448 | 0.440 | 0.448 | 0.444 | |
| FAZ | 0.728 | 0.684 | 0.839 | 0.754 | 0.544 | 0.564 | 0.544 | 0.552 | |
| LBP feature of OCT | 0.816 | 0.898 | 0.710 | 0.793 | 0.704 | 0.696 | 0.704 | 0.684 | |
| LBP feature of OCTA | 0.792 | 0.800 | 0.774 | 0.787 | 0.616 | 0.600 | 0.616 | 0.605 | |
| LBP Parameters of OCT | Feature Importance (%) | LBP Parameters of OCTA | Feature Importance (%) | Capillary Feature | Feature Importance (%) |
| OPL-BM LBP36 | 4.847 | OPL-BM LBP1 | 2.220 | VSD kurtosis | 1.986 |
| OPL-BM LBP21 | 3.377 | ILM-OPL-LBP1 | 1.870 | VAD kurtosis | 1.964 |
| OPL-BM LBP40 | 3.282 | OPL-BM LBP58 | 1.789 | VPI skewness | 1.455 |
| OPL-BM LBP25 | 2.421 | OPL-BM LBP54 | 1.786 | VAD skewness | 1.429 |
| OPL-BM LBP1 | 1.954 | OPL-BM LBP52 | 0.955 | VCI skewness | 1.232 |
| ILM-OPL LBP21 | 1.461 | ILM-OPL LBP58 | 0.853 | VSD skewness | 1.083 |
| OPL-BM LBP28 | 1.343 | OPL-BM LBP50 | 0.761 | VPI kurtosis | 1.032 |
| OPL-BM LBP59 | 1.330 | OPL-BM LBP56 | 0.748 | VCI median | 0.643 |
| ILM-OPL LBP25 | 1.146 | OPL-BM LBP7 | 0.615 | VSD mean | 0.565 |
| OPL-BM LBP33 | 0.954 | OPL-BM LBP35 | 0.585 | VPI mean | 0.560 |
| Large Vessel Parameters | Feature Importance (%) | FAZ Parameters | Feature Importance (%) | ||
| VSD mean | 0.426 | Eccentricity | 0.564 | ||
| VCI std | 0.357 | FAZ compactness | 0.517 | ||
| VCI max | 0.299 | FAZ flatness | 0.479 | ||
| VAD mean | 0.236 | FAZ anisotropy index | 0.430 | ||
| VPI std | 0.222 | FAZ perimeter | 0.398 | ||
| VPI median | 0.213 | FAZ CI | 0.372 | ||
| VCP kurtosis | 0.202 | FAZ centroid coordinates y | 0.214 | ||
| VSD skewness | 0.201 | FAZ area | 0.195 | ||
| VCI kurtosis | 0.200 | Diameter | 0.186 | ||
| VCI mean | 0.199 |
Disclaimer/Publisher’s Note: The statements, opinions and data contained in all publications are solely those of the individual author(s) and contributor(s) and not of MDPI and/or the editor(s). MDPI and/or the editor(s) disclaim responsibility for any injury to people or property resulting from any ideas, methods, instructions or products referred to in the content. |
© 2024 by the authors. Licensee MDPI, Basel, Switzerland. This article is an open access article distributed under the terms and conditions of the Creative Commons Attribution (CC BY) license (https://creativecommons.org/licenses/by/4.0/).
Share and Cite
Liu, X.; Zhu, H.; Zhang, H.; Xia, S. The Framework of Quantifying Biomarkers of OCT and OCTA Images in Retinal Diseases. Sensors 2024, 24, 5227. https://doi.org/10.3390/s24165227
Liu X, Zhu H, Zhang H, Xia S. The Framework of Quantifying Biomarkers of OCT and OCTA Images in Retinal Diseases. Sensors. 2024; 24(16):5227. https://doi.org/10.3390/s24165227
Chicago/Turabian StyleLiu, Xiaoli, Haogang Zhu, Hanji Zhang, and Shaoyan Xia. 2024. "The Framework of Quantifying Biomarkers of OCT and OCTA Images in Retinal Diseases" Sensors 24, no. 16: 5227. https://doi.org/10.3390/s24165227
APA StyleLiu, X., Zhu, H., Zhang, H., & Xia, S. (2024). The Framework of Quantifying Biomarkers of OCT and OCTA Images in Retinal Diseases. Sensors, 24(16), 5227. https://doi.org/10.3390/s24165227