Monitoring and Ensuring Worker Health in Controlled Environments Using Economical Particle Sensors

 ,
,  ,
,  , ,
, ,
Abstract
1. Introduction
2. Materials and Methods
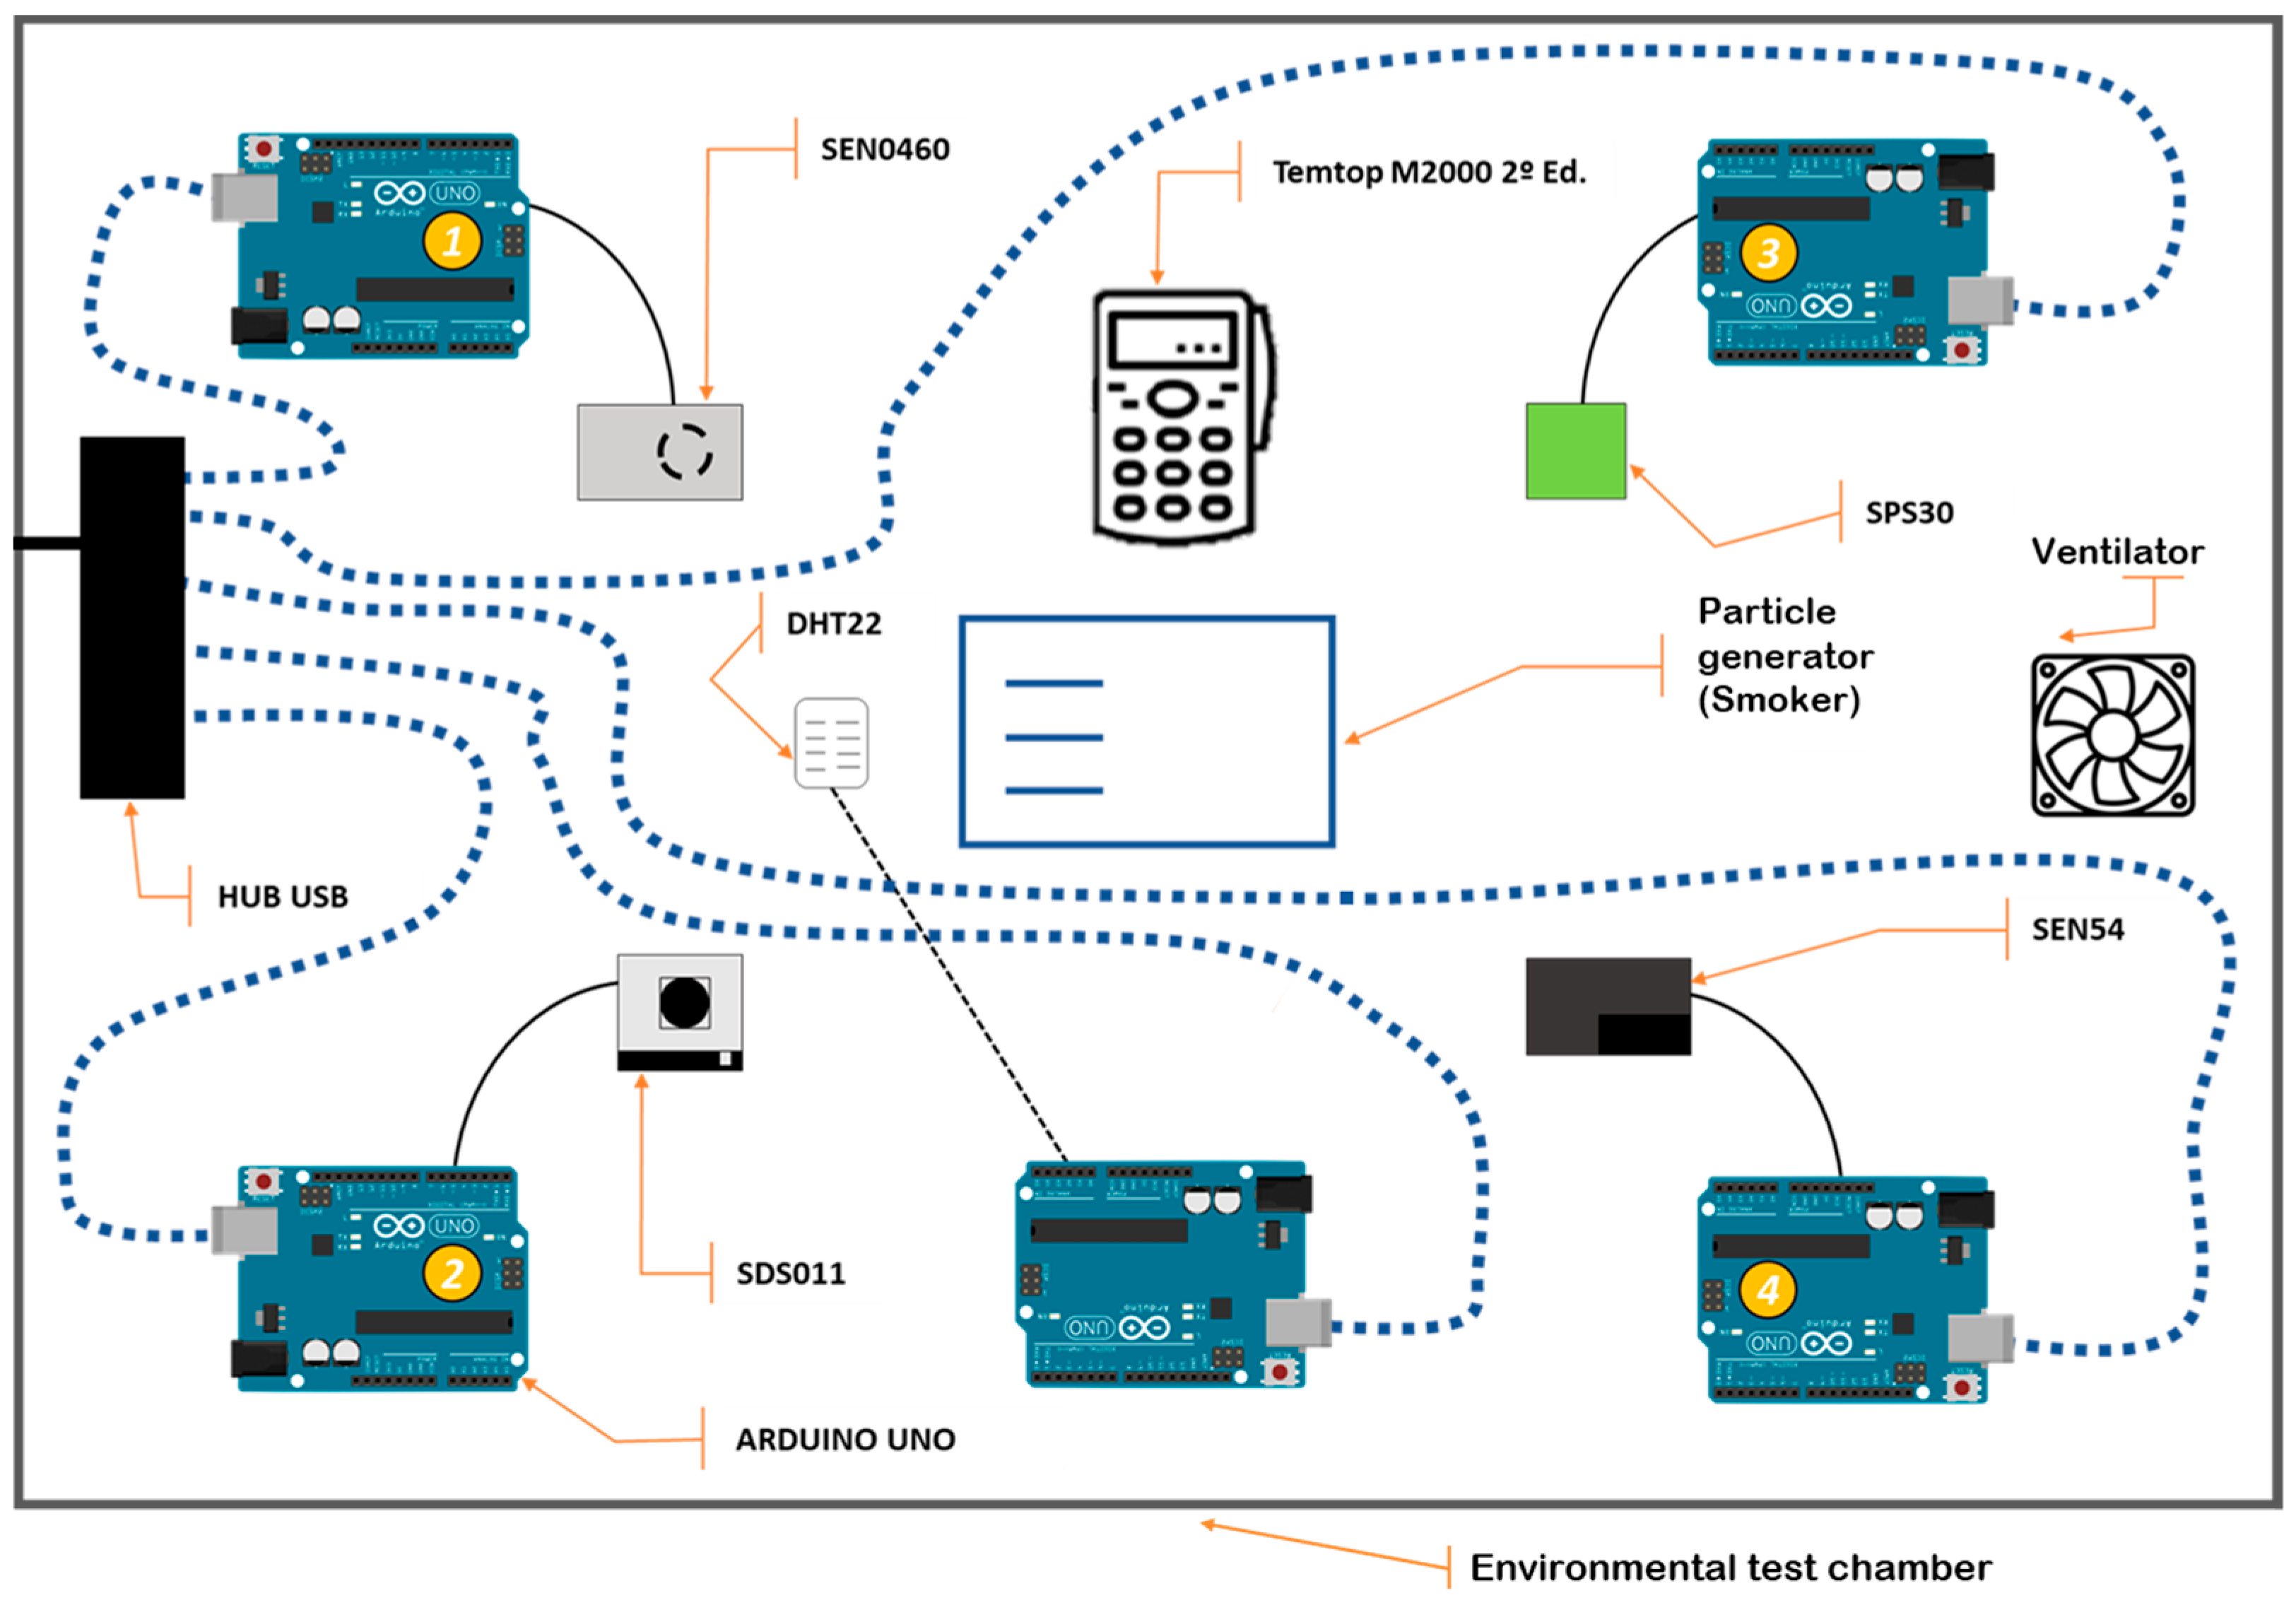
2.1. Materials
2.2. Methods
2.2.1. Validation by Statistical Techniques
2.2.2. Monitoring by Thermographic Imaging
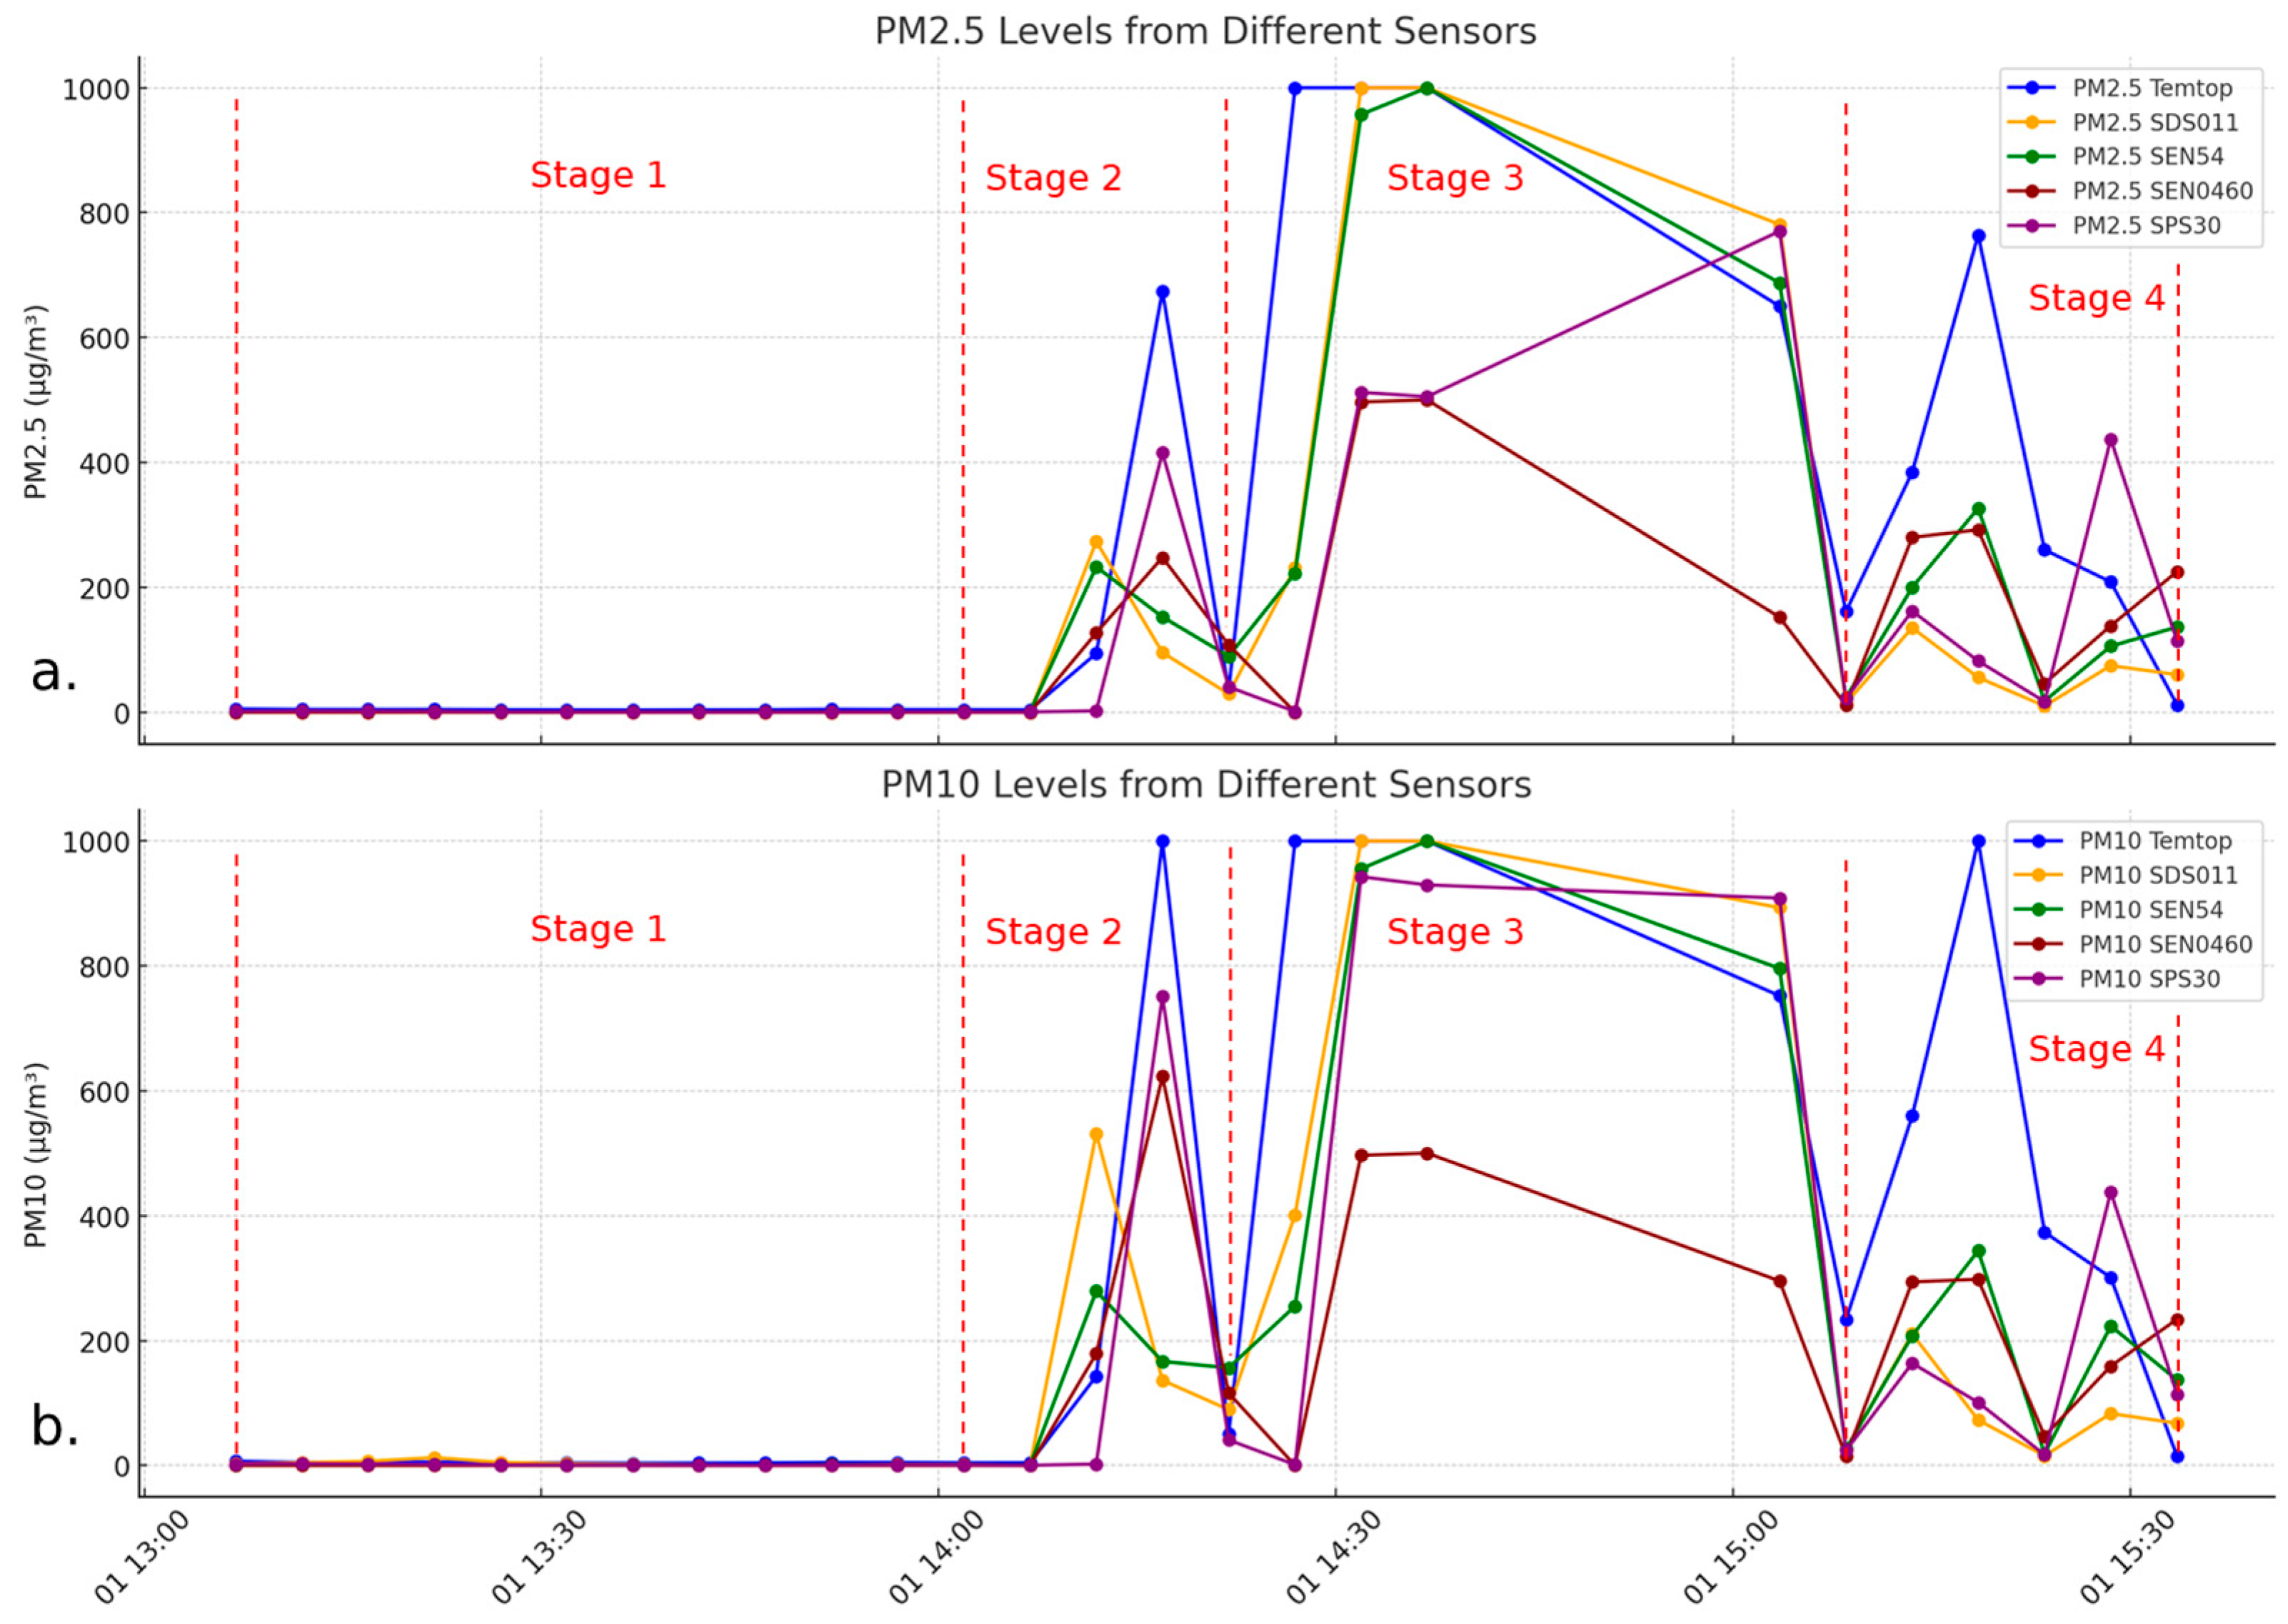
3. Results
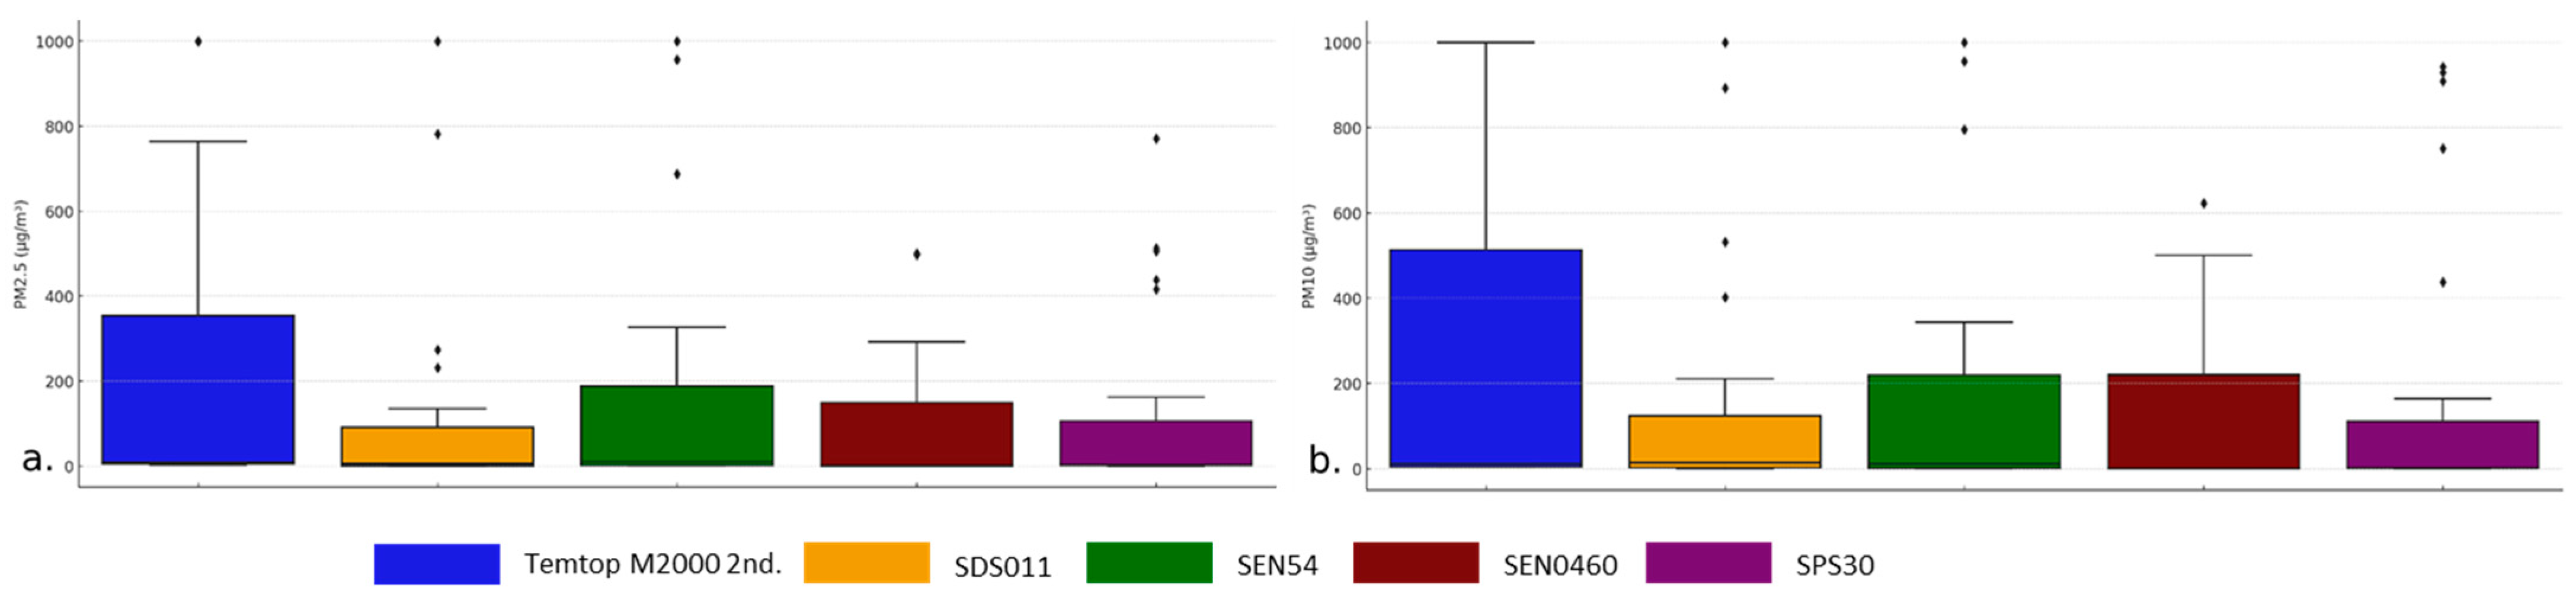
3.1. Box Plot Data
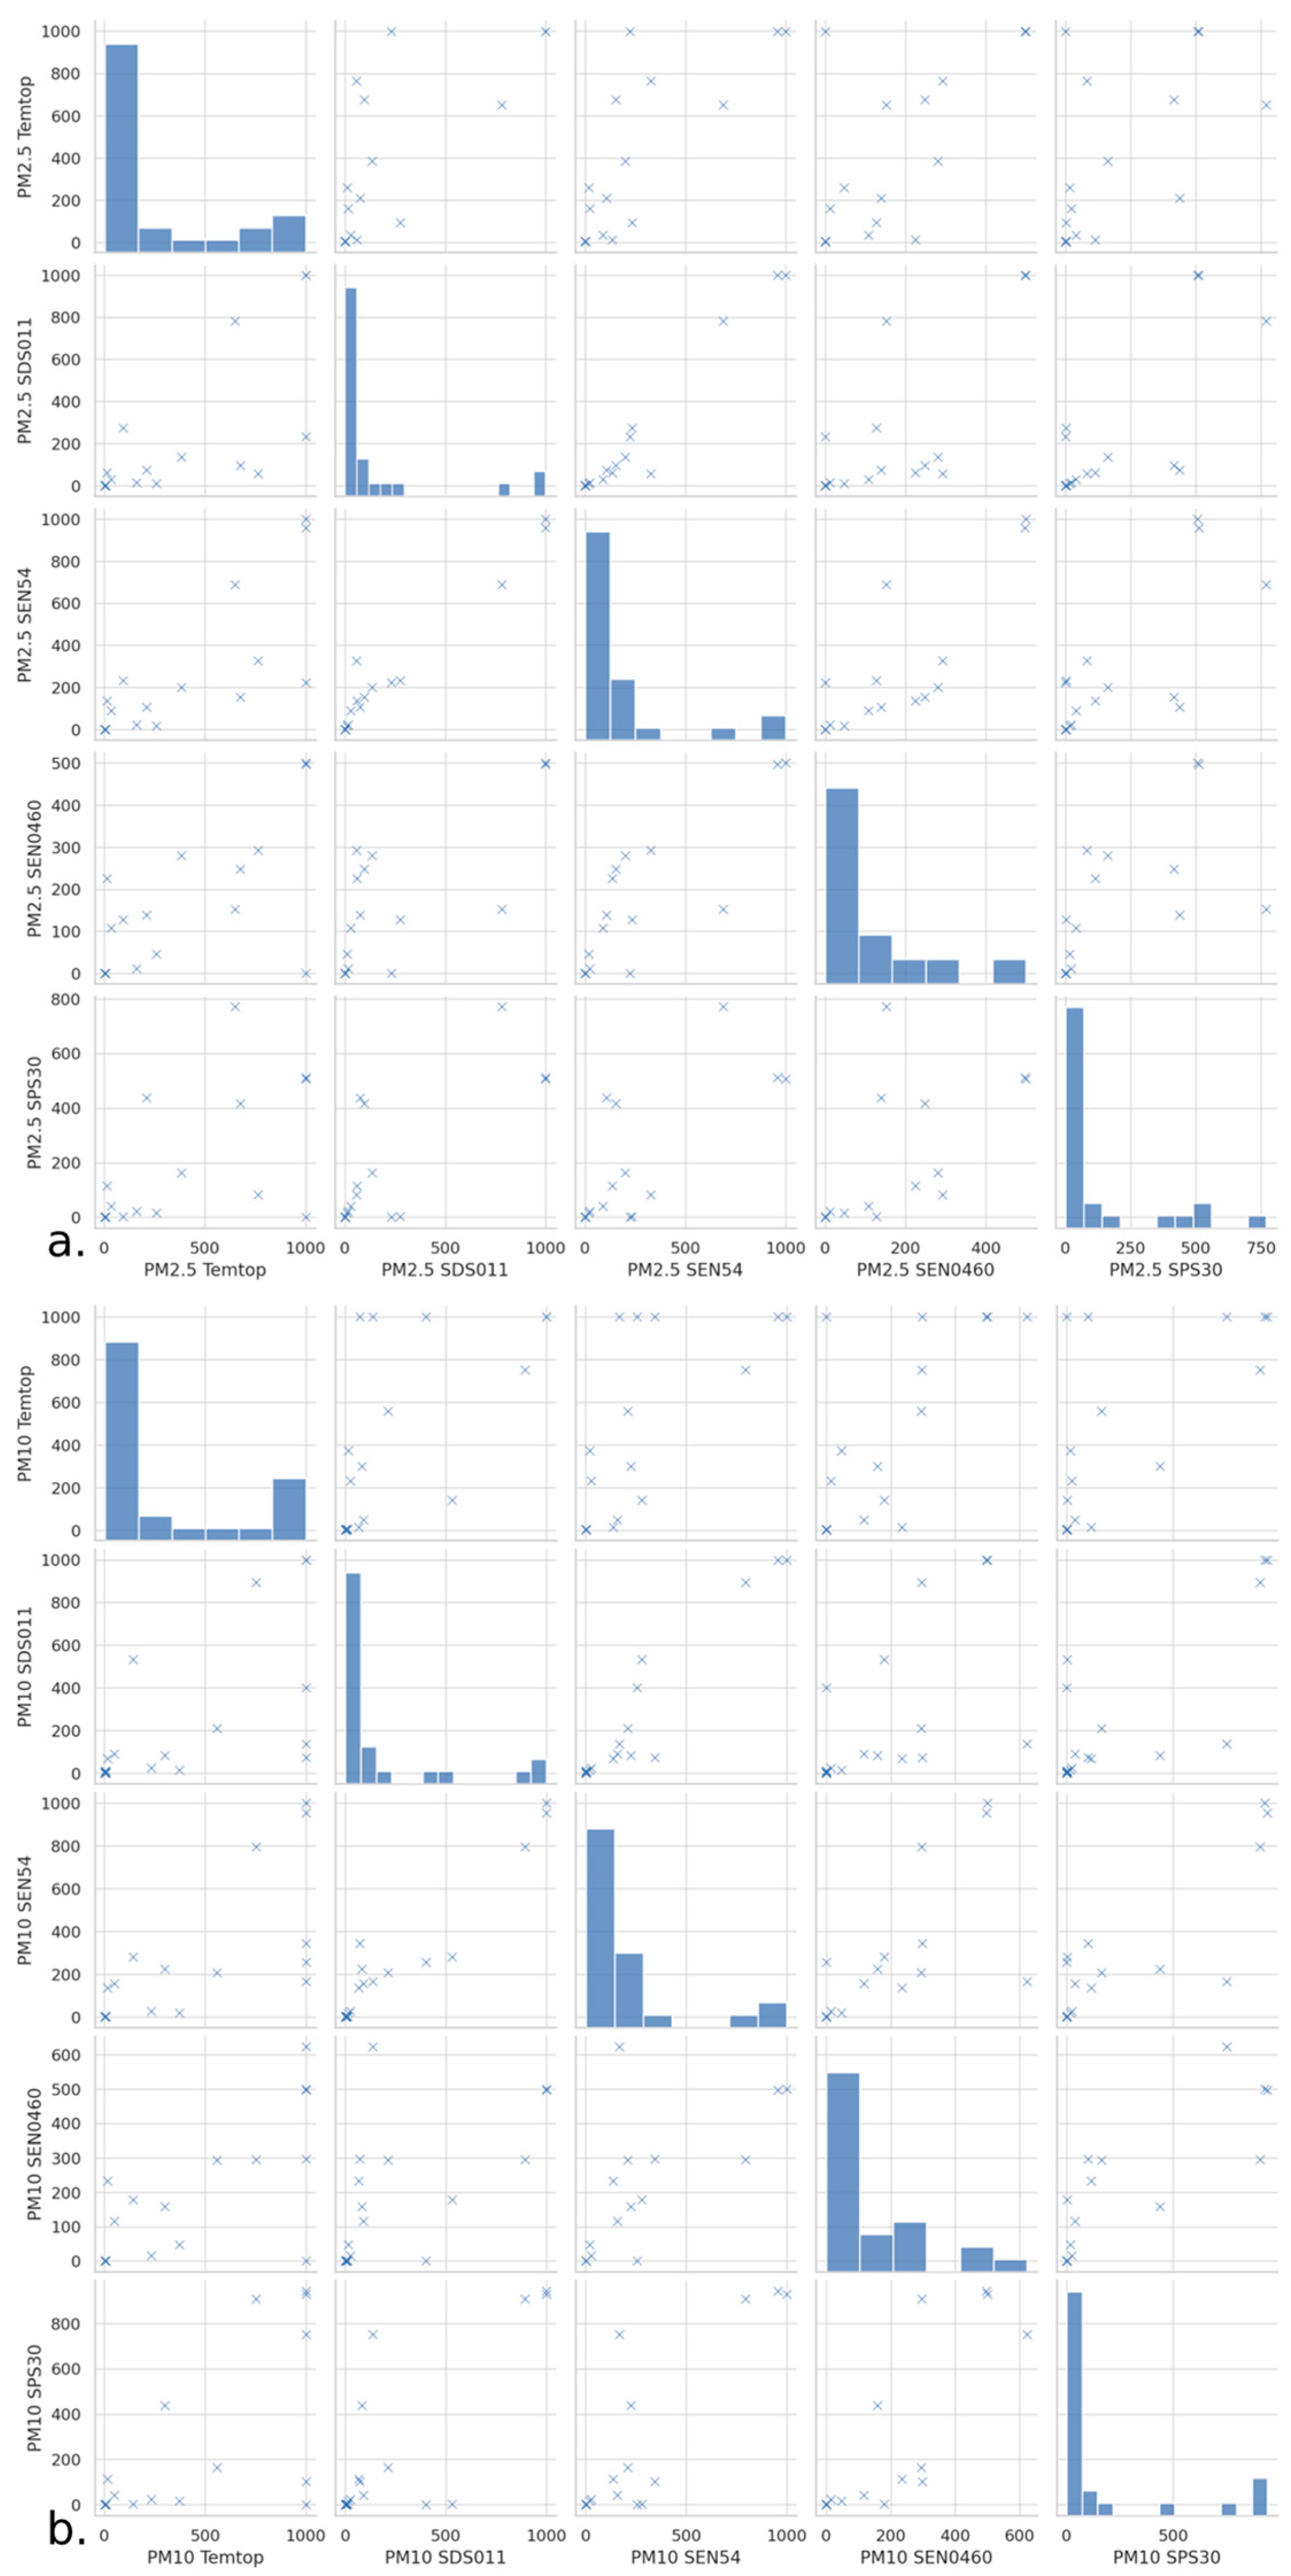
3.2. Matrix Plots of the Data
3.3. Linear Regression Analysis and Coefficient of Determination (R2) of the Data
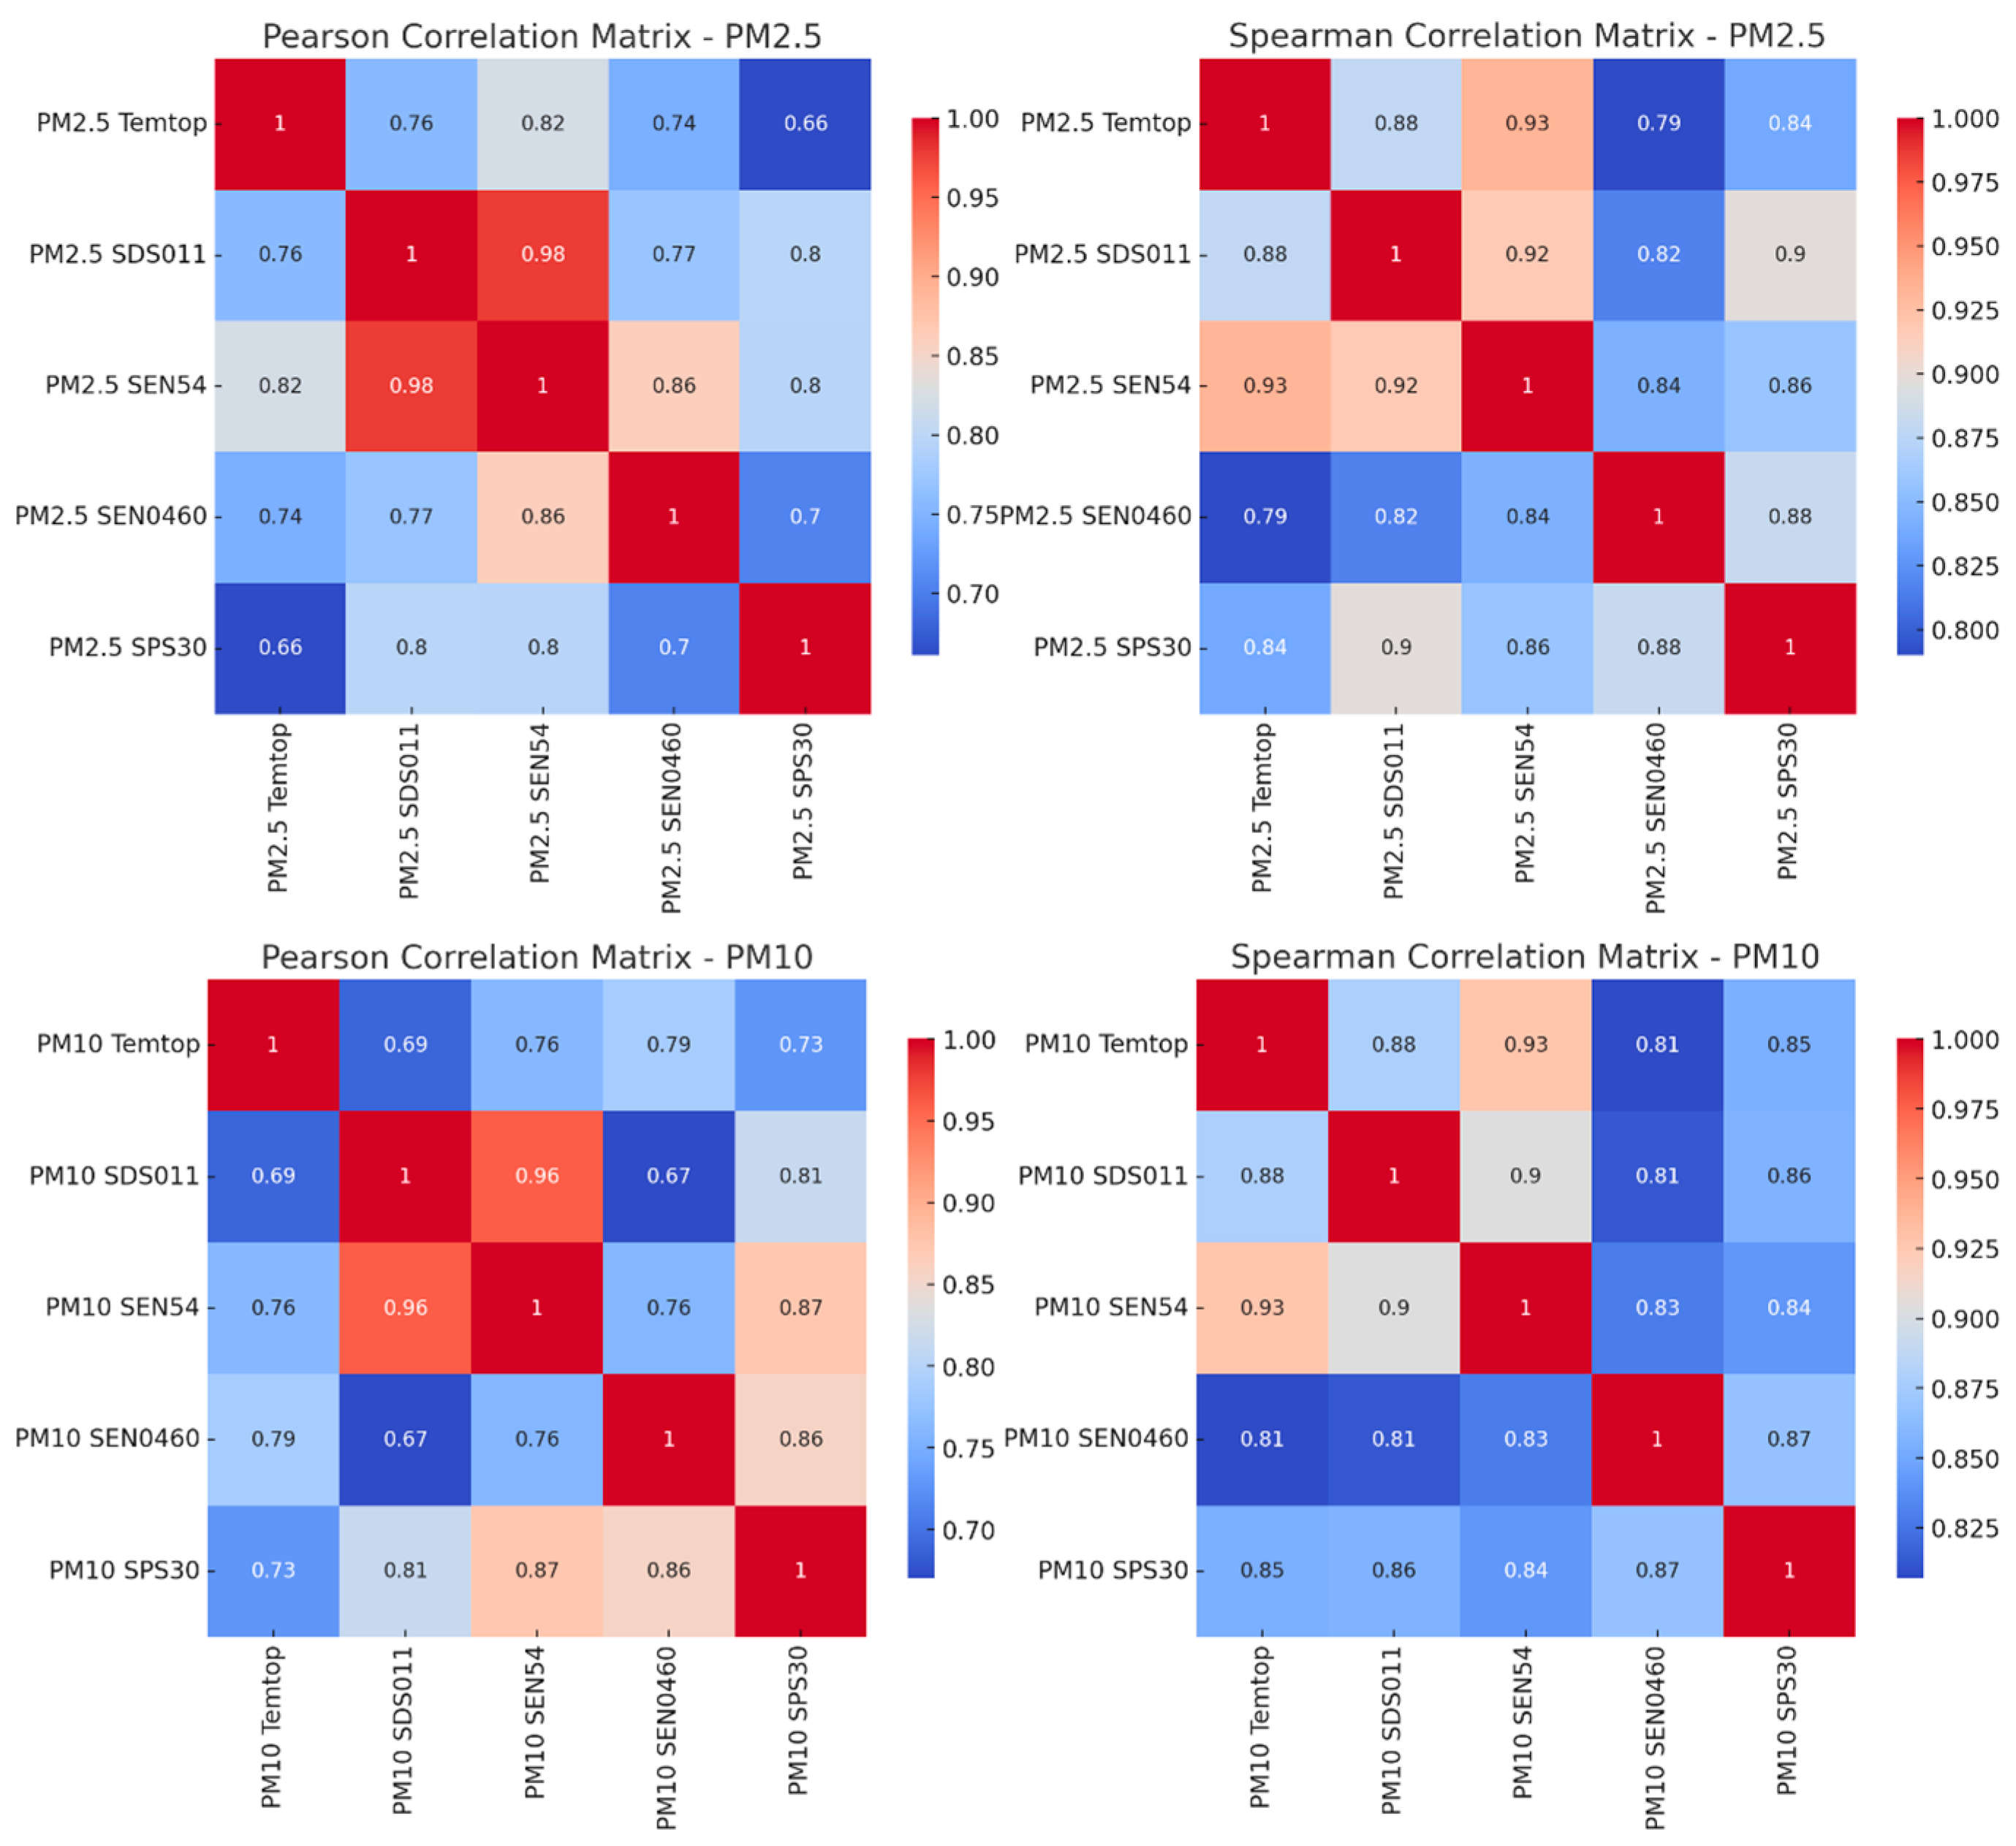
3.4. Correlation of the Data According to the Pearson and Spearman Matrix
3.5. Mean Absolute Error (MAE) and Root Mean Squared Error (RMSE) of the Data
3.6. Lin’s Concordance Coefficient, Lin’s Concordance Correlation Coefficient (CCLin or CCC) of the Data
3.7. Student’s t-Distribution of the Data
4. Discussion
5. Conclusions
Author Contributions
Funding
Institutional Review Board Statement
Informed Consent Statement
Data Availability Statement
Acknowledgments
Conflicts of Interest
References
- Directrices Mundiales de la OMS Sobre la Calidad del Aire: Partículas en Suspensión (PM2.5 y PM10), Ozono, Dióxido de Nitrógeno, Dióxido de Azufre y Monóxido de Carbono. Resumen [WHO Global Air Quality Guidelines: Particulate Matter (PM2.5 and PM10), Ozone, Nitrogen Dioxide, Sulfur Dioxide and Carbon Monoxide. Executive Summary]; Organización Mundial de la Salud: Geneva, Switzerland, 2021; Available online: https://www.miteco.gob.es/content/dam/miteco/es/calidad-y-evaluacion-ambiental/temas/atmosfera-y-calidad-del-aire/guiaoms2021-spa_tcm30-530942.pdf (accessed on 3 July 2024).
- Lacey, F.; Kumar, R.; Pfister, G.; Lamarque, J.-F.; O’Lenick, C.; Brasseur, G. Air quality: WHO guidelines could deepen inequities. Nature 2021, 598, 566. [Google Scholar] [CrossRef] [PubMed]
- Li, X.; Jin, L.; Kan, H. Air pollution: A global problem needs local fixes. Nature 2019, 570, 437–439. [Google Scholar] [CrossRef] [PubMed]
- Healthier air, healthier planet. Nat. Geosci. 2023, 16, 929. [CrossRef]
- Vicente, A.B.; Juan, P.; Meseguer, S.; Serra, L.; Trilles, S. Air Quality Trend of PM10. Statistical Models for Assessing the Air Quality Impact of Environmental Policies. Sustainability 2019, 11, 5857. [Google Scholar] [CrossRef]
- Ramanathan, V. Climate Change, Air Pollution, and Health: Common Sources, Similar Impacts, and Common Solutions. In Health of People, Health of Planet and Our Responsibility; Al-Delaimy, W., Ramanathan, V., Sánchez Sorondo, M., Eds.; Springer: Cham, Switzerland, 2020. [Google Scholar] [CrossRef]
- Sofia, D.; Gioiella, F.; Lotrecchiano, N.; Giuliano, A. Mitigation strategies for reducing air pollution. Environ. Sci. Pollut. Res. 2020, 27, 19226–19235. [Google Scholar] [CrossRef] [PubMed]
- Beketie, K.T.; Angessa, A.T.; Zeleke, T.T.; Ayal, D.Y. Impact of cement factory emission on air quality and human health around Mugher and the surrounding villages, Central Ethiopia. Air Qual. Atmos. Health 2022, 15, 347–361. [Google Scholar] [CrossRef]
- Mishra, U.C.; Sarsaiya, S.; Gupta, A. A systematic review on the impact of cement industries on the natural environment. Environ. Sci. Pollut. Res. 2022, 29, 18440–18451. [Google Scholar] [CrossRef] [PubMed]
- Secretaría de Medio Ambiente y Recursos Naturales; Instituto Nacional de Ecología. Guía metodológica Para la Estimación de Emisiones de PM2.5. INE-SEMARNAT. 2021. Available online: https://biblioteca.semarnat.gob.mx/janium/Documentos/Ciga/libros2009/225459.pdf (accessed on 3 July 2024).
- Alemayehu, Y.A.; Asfaw, S.L.; Terfie, T.A. Exposure to urban particulate matter and its association with human health risks. Environ. Sci. Pollut. Res. 2020, 27, 27491–27506. [Google Scholar] [CrossRef] [PubMed]
- Kumar, P.; Kumar, P. A critical evaluation of air quality index models (1960–2021). Environ. Monit. Assess. 2022, 194, 324. [Google Scholar] [CrossRef]
- Vahlsing, C.; Smith, K.R. Global review of national ambient air quality standards for PM10 and SO2 (24 h). Air Qual. Atmos. Health 2012, 5, 393–399. [Google Scholar] [CrossRef] [PubMed]
- Dockery, D.W.; Pope, C.A., 3rd; Xu, X.; Spengler, J.D.; Ware, J.H.; Fay, M.E.; Ferris, B.G., Jr.; Speizer, F.E. An association between air pollution and mortality in six U.S. cities. N. Engl. J. Med. 1993, 329, 1753–1759. [Google Scholar] [CrossRef] [PubMed]
- Pope, C.A., 3rd; Burnett, R.T.; Thun, M.J.; Calle, E.E.; Krewski, D.; Ito, K.; Thurston, G.D. Lung cancer, cardiopulmonary mortality, and long-term exposure to fine particulate air pollution. Jama 2002, 287, 1132–1141. [Google Scholar] [CrossRef] [PubMed]
- Krewski, D.; Jerrett, M.; Burnett, R.T.; Ma, R.; Hughes, E.; Shi, Y.; Turner, M.C.; Pope, C.A., 3rd; Thurston, G.; Calle, E.E.; et al. Extended Follow-Up and Spatial Analysis of the American Cancer Society Study Linking Particulate Air Pollution and Mortality; Research Report 140; Health Effects Institute: Boston, MA, USA, 2009; pp. 5–114; Discussion 115–136. Available online: https://pubmed.ncbi.nlm.nih.gov/19627030/ (accessed on 3 July 2024). [PubMed]
- Gampel Cohena, A.; Romero Rupertob, F.; González Sendraa, F.J.; Sánchez García-Altaresb, M.J.; Parra Gordoc, M.L. Diagnóstico por imagen. Silicosis. Med. Gen. Fam. 2016, 5, 169–171. [Google Scholar] [CrossRef]
- Maji, K.J.; Arora, M.; Dikshit, A.K. Burden of disease attributed to ambient PM2.5 and PM10 exposure in 190 cities in China. Environ. Sci. Pollut. Res. 2017, 24, 11559–11572. [Google Scholar] [CrossRef] [PubMed]
- Environmental Protection Agency. EPA Collaboration to Validate Satellite Air Quality Measurements. Available online: https://www.epa.gov/air-research/epa-collaboration-validate-satellite-air-quality-measurements (accessed on 4 August 2024).
- Torres, P.; Ferreira, J.; Monteiro, A.; Costa, S.; Pereira, M.C.; Madureira, J.; Mendes, A.; Teixeira, J.P. Air pollution: A public health approach for Portugal. Sci. Total Environ. 2018, 643, 1041–1053. [Google Scholar] [CrossRef] [PubMed]
- Veefkind, P.; van Oss, R.F.; Eskes, H.; Borowiak, A.; Dentner, F.; Wilson, J. Scientific Review on Remote Sensing of Air Pollution; EUR 22542 EN; EUR—Scientific and Technical Research Series; Office for Official Publications of the European Communities: Luxembourg, 2007. [Google Scholar]
- Mushtaq, Z.; Bangotra, P.; Gautam, A.S.; Sharma, M.; Suman Gautam, S.; Singh, K.; Kumar, Y.; Jain, P. Satellite or ground-based measurements for air pollutants (PM2.5, PM10, SO2, NO2, O3) data and their health hazards: Which is most accurate and why? Environ. Monit. Assess. 2024, 196, 342. [Google Scholar] [CrossRef] [PubMed]
- Karagulian, F. New Challenges in Air Quality Measurements. In Air Quality Networks. Environmental Informatics and Modeling; De Vito, S., Karatzas, K., Bartonova, A., Fattoruso, G., Eds.; Springer: Cham, Switzerland, 2023. [Google Scholar] [CrossRef]
- Pipal, A.S.; Taneja, A. Measurements of Indoor Air Quality. In Handbook of Metrology and Applications; Aswal, D.K., Yadav, S., Takatsuji, T., Rachakonda, P., Kumar, H., Eds.; Springer: Singapore, 2023. [Google Scholar] [CrossRef]
- Hernández-Gordillo, A.; Ruiz-Correa, S.; Robledo-Valero, V.; Hernández-Rosales, C.; Arriaga, S. Recent advancements in low-cost portable sensors for urban and indoor air quality monitoring. Air Qual. Atmos. Health 2021, 14, 1931–1951. [Google Scholar] [CrossRef]
- Pitarma, R.; Marques, G.; Caetano, F. Monitoring Indoor Air Quality to Improve Occupational Health. In New Advances in Information Systems and Technologies; Advances in Intelligent Systems and Computing; Rocha, Á., Correia, A., Adeli, H., Reis, L., Mendonça Teixeira, M., Eds.; Springer: Cham, Switzerland, 2016; Volume 445. [Google Scholar] [CrossRef]
- Tariq, H.; Touati, F.; Crescini, D.; Ben Mnaouer, A. State of the Art Low-Cost Air Quality Sensors, Assemblies, Calibration and Evaluation for Respiration Associated Diseases: A Systematic Review. Atmosphere 2024, 15, 471. [Google Scholar] [CrossRef]
- Gurudath, S.; Srinivasa, K.G. Air Quality Measurement Using Low-Cost Sensors—A Review. In Proceedings of the 3rd International Conference on Computing Informatics and Networks, Delhi, India, 29–30 July 2020; Lecture Notes in Networks and Systems. Abraham, A., Castillo, O., Virmani, D., Eds.; Springer: Singapore, 2021; Volume 167. [Google Scholar] [CrossRef]
- Buelvas, J.; Múnera, D.; Tobón, V.D.P.; Aguirre, J.; Gaviria, N. Data Quality in IoT-Based Air Quality Monitoring Systems: A Systematic Mapping Study. Water Air Soil. Pollut. 2023, 234, 248. [Google Scholar] [CrossRef]
- Trilles, S.; Calia, A.; Belmonte, Ó.; Torres-Sospedra, J.; Montoliu, R.; Huerta, J. Deployment of an open sensorized platform in a smart city context. Future Gener. Comput. Syst. 2017, 76, 221–233. [Google Scholar] [CrossRef]
- LOEMCO—Laboratorio Oficial de Ensayos de Materiales de Construcción. Available online: https://loemco.es/index.php/actividades-y-servicios (accessed on 3 July 2024).
- Tellus UPM. Available online: https://blogs.upm.es/tellus/quienes-somos/ (accessed on 3 July 2024).
- Presa Madrigal, L.; Rodríguez Rama, J.A.; Martín Sánchez, D.A.; Costafreda Mustelier, J.L.; Sanjuán, M.Á.; Parra y Alfaro, J.L. Cost-Effective Temperature Sensor for Monitoring the Setting Time of Concrete. Appl. Sci. 2024, 14, 4344. [Google Scholar] [CrossRef]
- Rama, J.A.R.; Lázaro, A.M.; Martín Sánchez, D.A.; Lorenzo, J.M.; Barrio-Parra, F.; Fernández Gutiérrez del Álamo, L.J. 3D Printing as an Enabler of Innovation in Universities. Tellus UPM Ecosystem Case. In Smart Cities. ICSC-Cities 2023; Communications in Computer and Information Science; Nesmachnow, S., Hernández Callejo, L., Eds.; Springer: Cham, Switzerland, 2024; Volume 1938. [Google Scholar] [CrossRef]
- Muñoz, C.; Huircan, J.; Jaramillo, F.; Boso, Á. Calibration of Sensor Network for Outdoor Measurement of PM2.5 on High Wood-Heating Smoke in Temuco City. Processes 2023, 11, 2338. [Google Scholar] [CrossRef]
- AbdulWahhab, R.S.; Jetly, K.; Shakir, S. Indoor Air-Quality Monitoring Systems: A Comprehensive Review of Different IAQM Systems. In Pervasive Healthcare. EAI/Springer Innovations in Communication and Computing; Husain, M.S., Adnan, M.H.B.M., Khan, M.Z., Shukla, S., Khan, F.U., Eds.; Springer: Cham, Switzerland, 2022. [Google Scholar] [CrossRef]
- Bej, D.; Chattaraj, N.; Mahapatra, R.; Mondal, M.K.; Ghosh, C. Fabrication of a Gas Sensor Based on ZnO Thin Film from the Perspective of Sensing Vehicle Tailpipe-Emitted Pollution. J. Electron. Mater. 2023, 52, 3983–3990. [Google Scholar] [CrossRef]
- South Coast Air Quality Management District. Elitech—Temtop M2000. AQ-SPEC. Available online: https://www.aqmd.gov/aq-spec/sensordetail/elitech---temtop-m2000 (accessed on 3 July 2024).
- DFRobot. Sen0460 Air Quality Sensor Datasheet. Available online: https://wiki.dfrobot.com/Gravity_PM2.5_Air_Quality_Sensor_SKU_SEN0460 (accessed on 3 July 2024).
- Sensirion. SEN54 Environmental Sensor Node for HVAC and Air Quality Applications (Version 2—D1—March 2022). 2022. Available online: https://sensirion.com/media/documents/6791EFA0/62A1F68F/Sensirion_Datasheet_Environmental_Node_SEN5x.pdf (accessed on 3 July 2024).
- Sensirion. SPS30 Particulate Matter Sensor Datasheet. 2022. Available online: https://sensirion.com/media/documents/8600FF88/64A3B8D6/Sensirion_PM_Sensors_Datasheet_SPS30.pdf (accessed on 3 July 2024).
- Nova Fitness Co., Ltd. SDS011 Laser PM2.5 Sensor Specification (Version 1.3). 2015. Available online: https://cdn-reichelt.de/documents/datenblatt/X200/SDS011-DATASHEET.pdf (accessed on 3 July 2024).
- Mamić, L.; Gašparović, M.; Kaplan, G. Developing PM2.5 and PM10 prediction models on a national and regional scale using open-source remote sensing data. Environ. Monit. Assess. 2023, 195, 644. [Google Scholar] [CrossRef] [PubMed]
- Sahu, R.; Dixit, K.K.; Mishra, S.; Kumar, P.; Shukla, A.K.; Sutaria, R.; Tiwari, S.; Tripathi, S.N. Validation of Low-Cost Sensors in Measuring Real-Time PM10 Concentrations at Two Sites in Delhi National Capital Region. Sensors 2020, 20, 1347. [Google Scholar] [CrossRef] [PubMed]
- Cavaliere, A.; Carotenuto, F.; Di Gennaro, F.; Gioli, B.; Gualtieri, G.; Martelli, F.; Matese, A.; Toscano, P.; Vagnoli, C.; Zaldei, A. Development of Low-Cost Air Quality Stations for Next Generation Monitoring Networks: Calibration and Validation of PM2.5 and PM10 Sensors. Sensors 2018, 18, 2843. [Google Scholar] [CrossRef] [PubMed]
- Vogt, M.; Schneider, P.; Castell, N.; Hamer, P. Assessment of Low-Cost Particulate Matter Sensor Systems against Optical and Gravimetric Methods in a Field Co-Location in Norway. Atmosphere 2021, 12, 961. [Google Scholar] [CrossRef]
- Kirešová, S.; Guzan, M.; Sobota, B. Using Low-Cost Sensors for Measuring and Monitoring Particulate Matter with a Focus on Fine and Ultrafine Particles. Atmosphere 2023, 14, 324. [Google Scholar] [CrossRef]
- Liu, H.-Y.; Schneider, P.; Haugen, R.; Vogt, M. Performance Assessment of a Low-Cost PM2.5 Sensor for a near Four-Month Period in Oslo, Norway. Atmosphere 2019, 10, 41. [Google Scholar] [CrossRef]
- Coffey, E.R.; Pfotenhauer, D.; Mukherjee, A.; Agao, D.; Moro, A.; Dalaba, M.; Begay, T.; Banacos, N.; Oduro, A.; Dickinson, K.L.; et al. Kitchen Area Air Quality Measurements in Northern Ghana: Evaluating the Performance of a Low-Cost Particulate Sensor within a Household Energy Study. Atmosphere 2019, 10, 400. [Google Scholar] [CrossRef]
- Reisen, F.; Cooper, J.; Powell, J.C.; Roulston, C.; Wheeler, A.J. Performance and Deployment of Low-Cost Particle Sensor Units to Monitor Biomass Burning Events and Their Application in an Educational Initiative. Sensors 2021, 21, 7206. [Google Scholar] [CrossRef]
- Souani, A.; Vigneron, V.; Maaref, H.; Hucher, A. Calibration of Low-Cost Air Sensors in the Presence of Pollutant Interferences: An Outdoor Evaluation. In Proceedings of the 9th International Conference on Water Resource and Environment. WRE 2023. Lecture Notes in Civil Engineering, Matsue, Japan, 21–24 November 2023; Weng, C.H., Ed.; Springer: Singapore, 2024; Volume 468. [Google Scholar] [CrossRef]
- Romero, Y.; Velásquez, R.M.A.; Noel, J. Development of a multiple regression model to calibrate a low-cost sensor considering reference measurements and meteorological parameters. Environ. Monit. Assess. 2020, 192, 498. [Google Scholar] [CrossRef] [PubMed]
- Tagle, M.; Rojas, F.; Reyes, F.; Vásquez, Y.; Hallgren, F.; Lindén, J.; Kolev, D.; Watne, Å.K.; Oyola, P. Field performance of a low-cost sensor in the monitoring of particulate matter in Santiago, Chile. Environ. Monit. Assess. 2020, 192, 171. [Google Scholar] [CrossRef] [PubMed]
- Niu, Y.; Li, X.; Qi, B.; Du, R. Variation in the concentrations of atmospheric PM2.5 and its main chemical components in an eastern China city (Hangzhou) since the release of the Air Pollution Prevention and Control Action Plan in 2013. Air Qual. Atmos. Health 2022, 15, 321–337. [Google Scholar] [CrossRef]
- Gitahi, J.; Hahn, M. Evaluation of Crowd-Sourced PM2.5 Measurements from Low-Cost Sensors for Air Quality Mapping in Stuttgart City. In iCity. Transformative Research for the Livable, Intelligent, and Sustainable City; Coors, V., Pietruschka, D., Zeitler, B., Eds.; Springer: Cham, Switzerland, 2022. [Google Scholar] [CrossRef]
- Trejo, R.E.G.; Rossainz, B.B.; Torres, J.A.G.; Zavala, A.H. A Study on the Behavior of Different Low-Cost Particle Counter Sensors for PM10 and PM2.5 Suspended Air Particles. In Telematics and Computing. WITCOM 2022; Communications in Computer and Information Science; Mata-Rivera, M.F., Zagal-Flores, R., Barria-Huidobro, C., Eds.; Springer: Cham, Switzerland, 2022; Volume 1659. [Google Scholar] [CrossRef]
- Verdoy, P.J.; Trilles Oliver, S.; Vicente Fortea, A.B.; Meseguer Costa, S.; Serra Saurina, L. Estudio de la Fiabilidad de un Sensor IoT de PM de Bajo Coste en Ambientes Interiores y Exteriores. En Congreso Nacional de Medio Ambiente (CONAMA 2020). Universidad Jaume I & Universidad de Girona. 2020. Available online: https://repositori.uji.es/xmlui/handle/10234/196771 (accessed on 3 July 2024).


| Sensor | MAE 1 | RMSE 2 | p-Value | F-Value | CCLin o CCC 3 |
|---|---|---|---|---|---|
| PM2.5 SDS011 | 124.941 | 251.471 | 0.293 | 1.128 | 0.712 |
| PM2.5 SEN54 | 109.450 | 217.635 | 0.366 | 0.833 | 0.774 |
| PM2.5 SEN0460 | 165.815 | 296.888 | 0.14 | 2.251 | 0.471 |
| PM2.5 SPS30 | 158.372 | 292.608 | 0.071 | 3.405 | 0.534 |
| PM10 SDS011 | 160.818 | 308.791 | 0.269 | 1.25 | 0.64 |
| PM10 SEN54 | 143.353 | 279.182 | 0.257 | 1.316 | 0.689 |
| PM10 SEN0460 | 187.392 | 318.932 | 0.253 | 1.335 | 0.526 |
| PM10 SPS30 | 147.114 | 295.901 | 0.067 | 3.516 | 0.675 |
Disclaimer/Publisher’s Note: The statements, opinions and data contained in all publications are solely those of the individual author(s) and contributor(s) and not of MDPI and/or the editor(s). MDPI and/or the editor(s) disclaim responsibility for any injury to people or property resulting from any ideas, methods, instructions or products referred to in the content. |
© 2024 by the authors. Licensee MDPI, Basel, Switzerland. This article is an open access article distributed under the terms and conditions of the Creative Commons Attribution (CC BY) license (https://creativecommons.org/licenses/by/4.0/).
Share and Cite
Rodríguez Rama, J.A.; Presa Madrigal, L.; Costafreda Mustelier, J.L.; García Laso, A.; Maroto Lorenzo, J.; Martín Sánchez, D.A. Monitoring and Ensuring Worker Health in Controlled Environments Using Economical Particle Sensors. Sensors 2024, 24, 5267. https://doi.org/10.3390/s24165267
Rodríguez Rama JA, Presa Madrigal L, Costafreda Mustelier JL, García Laso A, Maroto Lorenzo J, Martín Sánchez DA. Monitoring and Ensuring Worker Health in Controlled Environments Using Economical Particle Sensors. Sensors. 2024; 24(16):5267. https://doi.org/10.3390/s24165267
Chicago/Turabian StyleRodríguez Rama, Juan Antonio, Leticia Presa Madrigal, Jorge L. Costafreda Mustelier, Ana García Laso, Javier Maroto Lorenzo, and Domingo A. Martín Sánchez. 2024. "Monitoring and Ensuring Worker Health in Controlled Environments Using Economical Particle Sensors" Sensors 24, no. 16: 5267. https://doi.org/10.3390/s24165267
APA StyleRodríguez Rama, J. A., Presa Madrigal, L., Costafreda Mustelier, J. L., García Laso, A., Maroto Lorenzo, J., & Martín Sánchez, D. A. (2024). Monitoring and Ensuring Worker Health in Controlled Environments Using Economical Particle Sensors. Sensors, 24(16), 5267. https://doi.org/10.3390/s24165267