
The Evolving Stethoscope: Insights Derived from Studying Phonocardiography in Trainees
 ,
,
Abstract
:1. Introduction
2. Materials and Methods
3. Results
3.1. Demographic Information
3.2. Question Difficulty and Discrimination
3.3. PCG and PCS
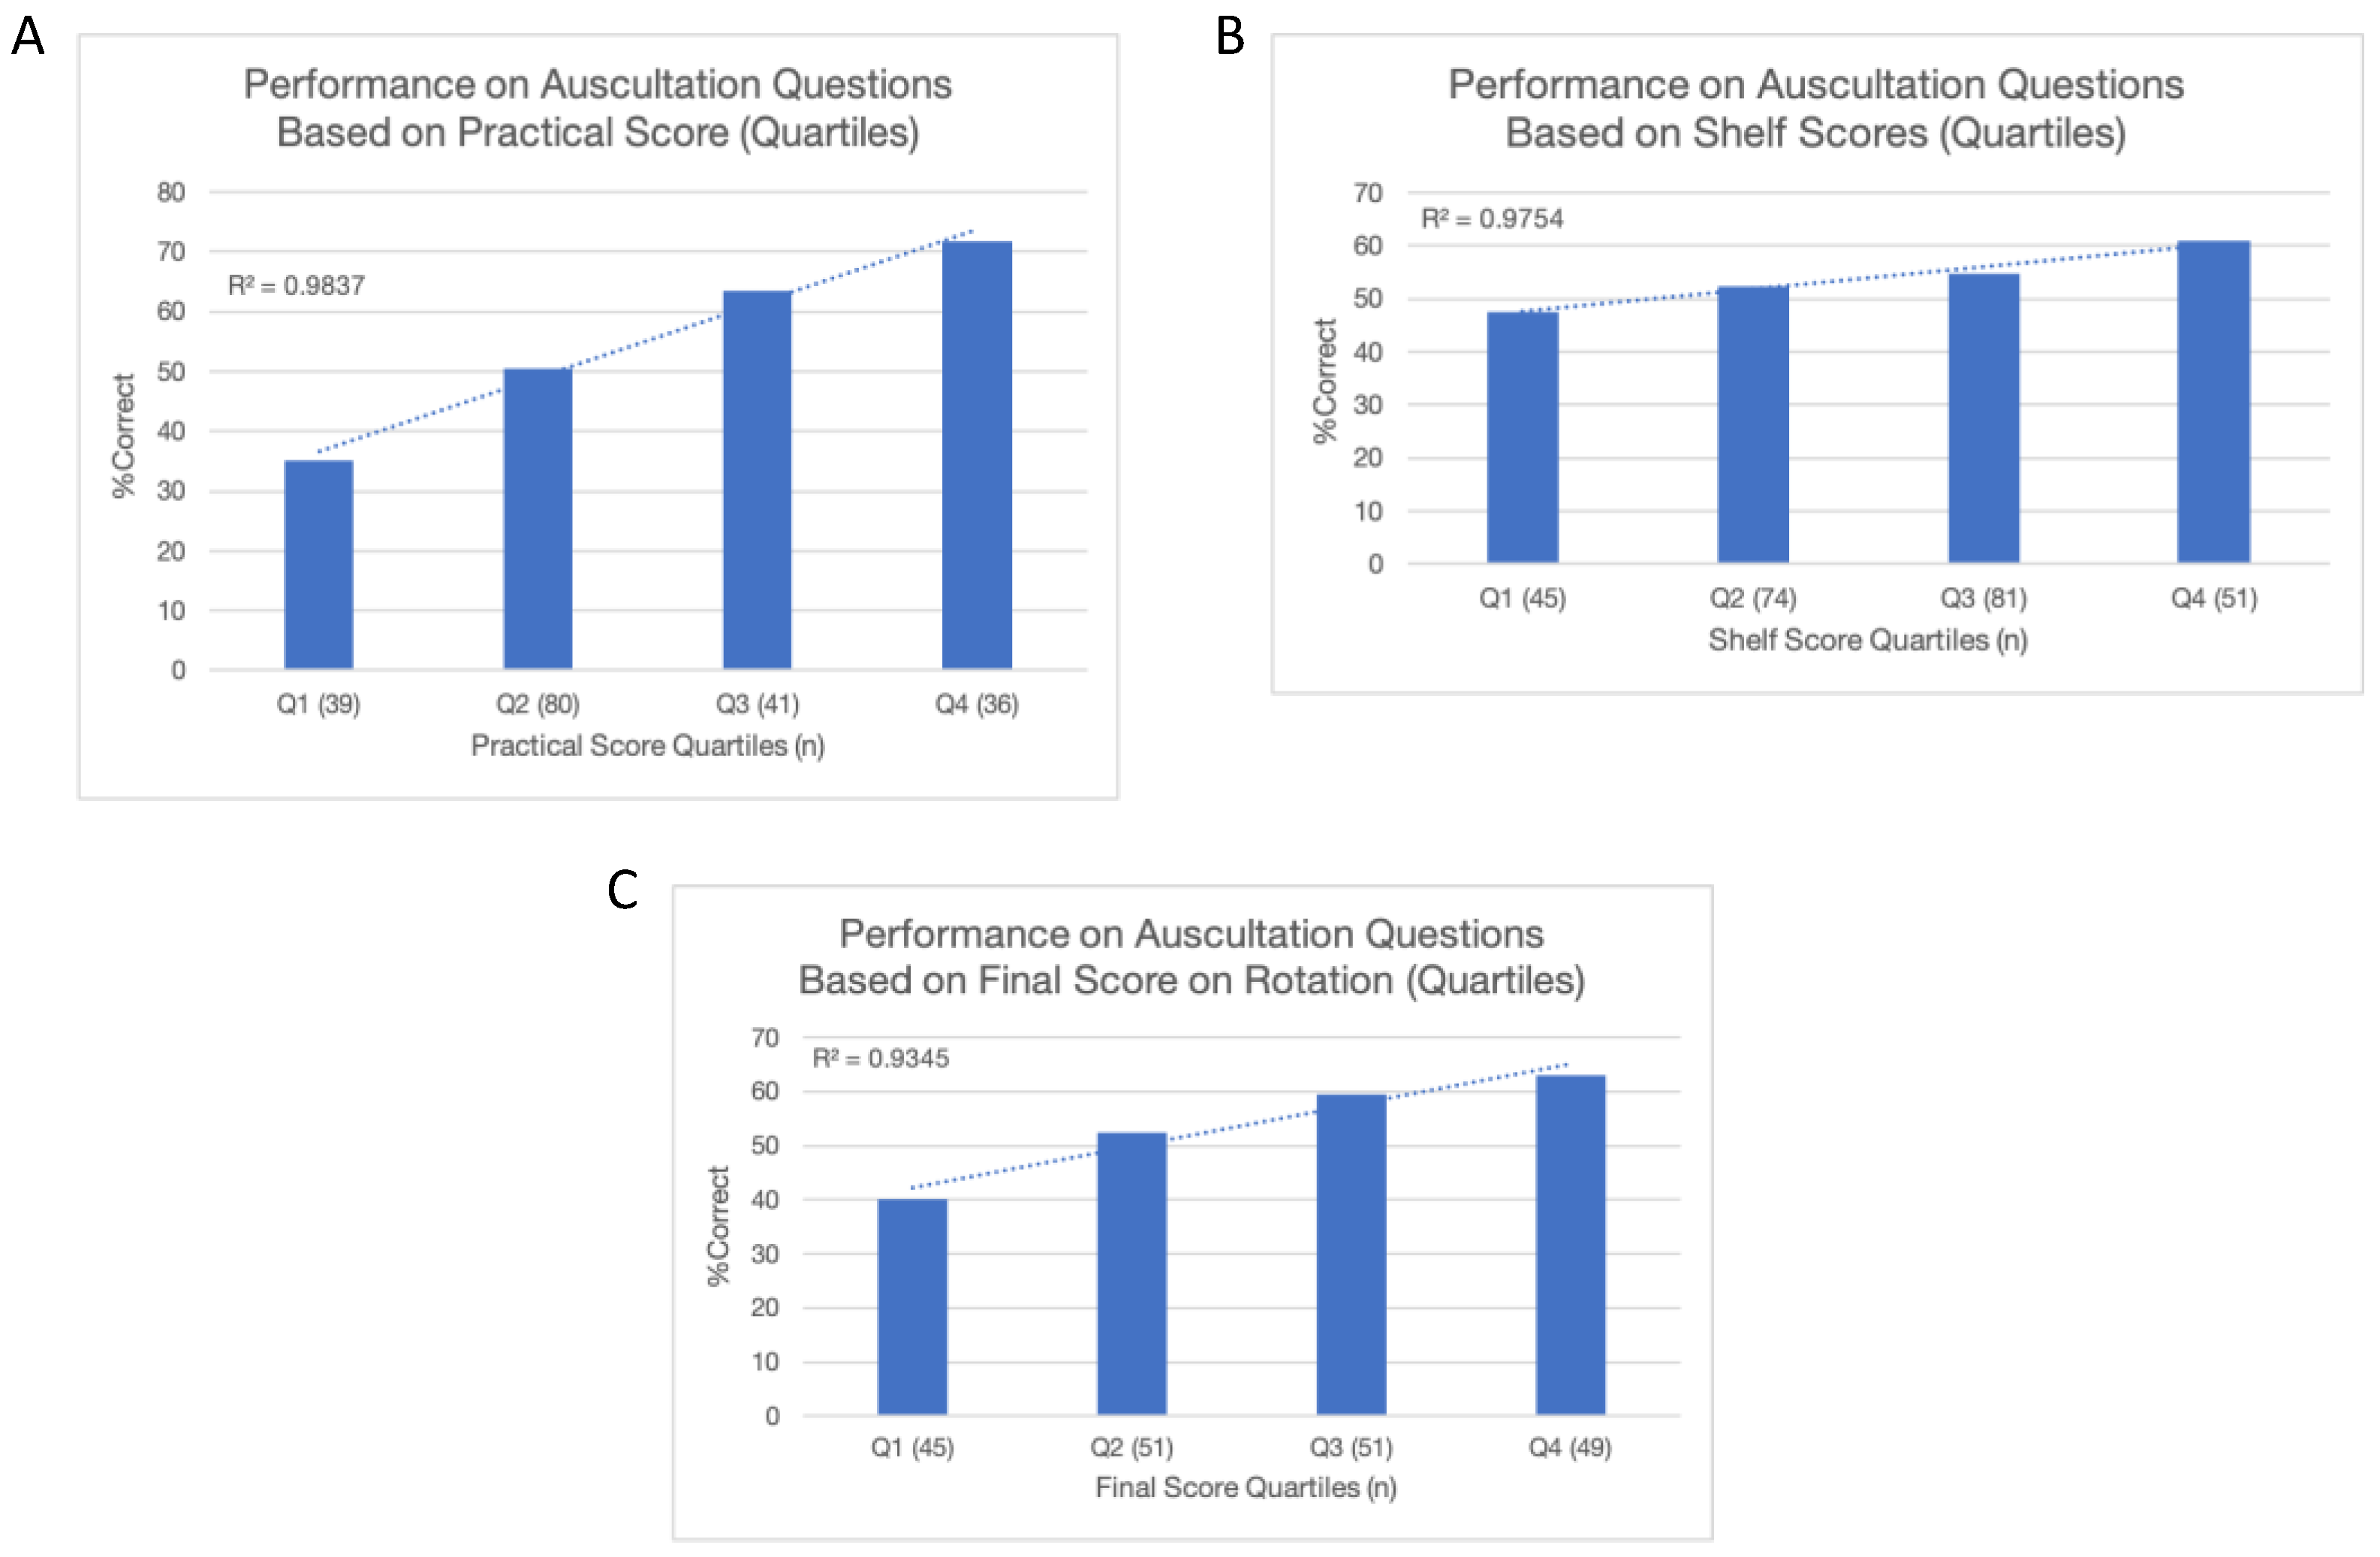
3.4. Correlates
4. Discussion
4.1. Study Considerations: Strengths, Limitations, and Improvements
4.2. Implications in Practice and Medical Education
5. Conclusions
Supplementary Materials
Author Contributions
Funding
Institutional Review Board Statement
Informed Consent Statement
Data Availability Statement
Acknowledgments
Conflicts of Interest
Appendix A. Discrimination and Difficulty Index on Cardiac Auscultation Questions
| Murmur | Without PCG | With PCG | ||
| Discrimination Index | Difficulty Index | Discrimination Index | Difficulty Index | |
| Split S2 | 0.22 | 0.62 | 0.42 | 0.63 |
| MS | 0.02 | 0.03 | 0.09 | 0.19 |
| VSD | 0.23 | 0.45 | 0.15 | 0.15 |
| CFR | 0.28 | 0.42 | 0.26 | 0.76 |
| AS | 0.09 | 0.94 | 0.06 | 0.95 |
| S3 | 0.18 | 0.58 | 0.03 | 0.07 |
| TR | 0.14 | 0.67 | 0.11 | 0.23 |
| AR | 0.37 | 0.52 | 0.35 | 0.51 |
| S4 | 0.35 | 0.67 | 0.22 | 0.85 |
| MR | 0.17 | 0.60 | 0.29 | 0.51 |
| Abbreviations: AR: aortic regurgitation; AS: aortic stenosis; CFR: cardiac friction rub; MR: mitral regurgitation; MS: mitral stenosis; TR: tricuspid regurgitation; VSD: ventricular septal defect. | ||||
References
- Roldan, C.A.; Shively, B.K.; Crawford, M.H. Value of the Cardiovascular Physical Examination for Detecting Valvular Heart Disease in Asymptomatic Subjects. Am. J. Card. 1996, 77, 1327–1331. [Google Scholar] [CrossRef] [PubMed]
- Lembo, N.J.; Dell’Italia, L.J.; Crawford, M.H.; O’Rourke, R.A. Bedside Diagnosis of Systolic Murmurs. N. Engl. J. Med. 1988, 318, 1572–1578. [Google Scholar] [CrossRef]
- Mangione, S. Cardiac Auscultatory Skills of Physicians-in-Training: A Comparison of Three English-Speaking Countries. Am. J. Med. 2001, 110, 210–216. [Google Scholar] [CrossRef]
- Mangione, S. Cardiac Auscultatory Skills of Internal Medicine and Family Practice Trainees: A Comparison of Diagnostic Proficiency. J. Am. Med. Assoc. 1997, 278, 717. [Google Scholar] [CrossRef]
- St. Clair, E.W. Assessing Housestaff Diagnostic Skills Using a Cardiology Patient Simulator. Ann. Intern. Med. 1992, 117, 751. [Google Scholar] [CrossRef]
- Binka, E.K.; Lewin, L.O.; Gaskin, P.R. Small Steps in Impacting Clinical Auscultation of Medical Students. Glob. Pediatr. Health 2016, 3, 2333794X1666901. [Google Scholar] [CrossRef] [PubMed]
- Mangione, S. Resident Education Under The Microscope: The Teaching of Cardiac Auscultation during Internal Medicine and Family Medicine Training—A Nationwide Comparison. Acad. Med. 1998, 73, S10–S12. [Google Scholar] [CrossRef]
- Crumlish, C.M.; Yialamas, M.A.; McMahon, G.T. Quantification of Bedside Teaching by an Academic Hospitalist Group. J. Hosp. Med. 2009, 4, 304–307. [Google Scholar] [CrossRef]
- Nassar, M.E. The Stethoscopeless Cardiologist. J. R. Soc. Med. 1988, 81, 501–502. [Google Scholar] [CrossRef]
- Favrat, B.; Pécoud, A.; Jaussi, A. Teaching Cardiac Auscultation to Trainees in Internal Medicine and Family Practice: Does It Work? BMC Med. Educ. 2004, 4, 5. [Google Scholar] [CrossRef]
- Torre, D.M.; Pfeifer, K.J.; Lamb, G.C.; Walters, M.P.; Sebastian, J.L.; Simpson, D.E. An Assessment of the Impact of Multimedia, Technology-Based Learning Tools on the Cardiac Auscultation Skills of Third-Year Medical Students. Med. Educ. Online 2004, 9, 4364. [Google Scholar] [CrossRef]
- Barrett, M.J.; Lacey, C.S.; Sekara, A.E.; Linden, E.A.; Gracely, E.J. Mastering Cardiac Murmurs. Chest 2004, 126, 470–475. [Google Scholar] [CrossRef] [PubMed]
- Tavel, M.E. Cardiac Auscultation: A Glorious Past—But Does It Have a Future? Circulation 1996, 93, 1250–1253. [Google Scholar] [CrossRef]
- March, S.K.W. Proctor Harvey: A Master Clinician-Teacher’s Influence on the History of Cardiovascular Medicine. Tex. Heart Inst. J. 2002, 29, 182–192. [Google Scholar]
- Harvey, W.P. Dynamic Cardiac Auscultation And Phonocardiography: A Graphic Guide. Chest 1980, 77, 27. [Google Scholar] [CrossRef]
- Ronan, J.A.; Perloff, J.K.; Harvey, W.P. Systolic Clicks and the Late Systolic Murmur. Am. Heart J. 1965, 70, 319–325. [Google Scholar] [CrossRef] [PubMed]
- McGee, S. Evidence-Based Physical Diagnosis, 4th ed.; Elsevier: Amsterdam, The Netherlands, 2017. [Google Scholar]
- Lok, C.E.; Morgan, C.D.; Ranganathan, N. The Accuracy and Interobserver Agreement in Detecting the ‘Gallop Sounds’ by Cardiac Auscultation. Chest 1998, 114, 1283–1288. [Google Scholar] [CrossRef]
- Ozawa, Y.; Smith, D.; Craige, E. Origin of the Third Heart Sound. II. Studies in Human Subjects. Circulation 1983, 67, 399–404. [Google Scholar] [CrossRef]
- Tavel, M.E.; Brown, D.D.; Shander, D. Enhanced Auscultation with a New Graphic Display System. Arch. Intern. Med. 1994, 154, 893–898. [Google Scholar] [CrossRef]
- Chorba, J.S.; Shapiro, A.M.; Le, L.; Maidens, J.; Prince, J.; Pham, S.; Kanzawa, M.M.; Barbosa, D.N.; Currie, C.; Brooks, C.; et al. Deep Learning Algorithm for Automated Cardiac Murmur Detection via a Digital Stethoscope Platform. JAHA 2021, 10, e019905. [Google Scholar] [CrossRef]
- Jani, V.; Danford, D.A.; Thompson, W.R.; Schuster, A.; Manlhiot, C.; Kutty, S. The Discerning Ear: Cardiac Auscultation in the Era of Artificial Intelligence and Telemedicine. Eur. Heart J. Digit. Health 2021, 2, 456–466. [Google Scholar] [CrossRef]
- Ninova, P.P.; Dascalov, I.K.; Dimitrova, M.I. Automated Phonocardiographic Screening for Heart Disease in Children. Cardiology 1978, 63, 5–13. [Google Scholar] [CrossRef]
- Hayek, C.S.; Thompson, W.R.; Tuchinda, C.; Wojcik, R.A.; Lombardo, J.S. Wavelet Processing of Systolic Murmurs to Assist with Clinical Diagnosis of Heart Disease. Biomed. Instrum. Technol. 2003, 37, 263–270. [Google Scholar] [CrossRef]
- Michaels, A.D.; Khan, F.U.; Moyers, B. Experienced Clinicians Improve Detection of Third and Fourth Heart Sounds by Viewing Acoustic Cardiography. Clin. Cardiol. 2010, 33, E36–E42. [Google Scholar] [CrossRef]
- Lv, J.; Dong, B.; Lei, H.; Shi, G.; Wang, H.; Zhu, F.; Wen, C.; Zhang, Q.; Fu, L.; Gu, X.; et al. Artificial Intelligence-Assisted Auscultation in Detecting Congenital Heart Disease. Eur. Heart J. Digit. Health 2021, 2, 119–124. [Google Scholar] [CrossRef]
- Ou, Y. Can Artificial Intelligence-Assisted Auscultation Become the Heimdallr for Diagnosing Congenital Heart Disease? Eur. Heart J.—Digit. Health 2021, 2, 117–118. [Google Scholar] [CrossRef]
- Leng, S.; Tan, R.S.; Chai, K.T.C.; Wang, C.; Ghista, D.; Zhong, L. The Electronic Stethoscope. BioMed Eng. OnLine 2015, 14, 66. [Google Scholar] [CrossRef] [PubMed]
- Lakhe, A.; Sodhi, I.; Warrier, J.; Sinha, V. Development of Digital Stethoscope for Telemedicine. J. Med. Eng. Technol. 2016, 40, 20–24. [Google Scholar] [CrossRef]
- Jeong, Y.; Kim, J.; Kim, D.; Kim, J.; Lee, K. Methods for Improving Deep Learning-Based Cardiac Auscultation Accuracy: Data Augmentation and Data Generalization. Appl. Sci. 2021, 11, 4544. [Google Scholar] [CrossRef]
- Woywodt, A.; Herrmann, A.; Kielstein, J.T.; Haller, H.; Haubitz, M.; Purnhagen, H. A Novel Multimedia Tool to Improve Bedside Teaching of Cardiac Auscultation. Postgrad. Med. J. 2004, 80, 355–357. [Google Scholar] [CrossRef] [PubMed]
- Kindig, J.R.; Beeson, T.P.; Campbell, R.W.; Andries, F.; Tavel, M.E. Acoustical Performance of the Stethoscope: A Comparative Analysis. Am. Heart J. 1982, 104, 269–275. [Google Scholar] [CrossRef] [PubMed]
- Fuster, V. The Stethoscope’s Prognosis. J. Am. Coll. Cardiol. 2016, 67, 1118–1119. [Google Scholar] [CrossRef] [PubMed]

| n (%) or Mean (SD) | With PCS (n = 32) | Without PCS (n = 22) | Cohort without PCS (n = 164) |
|---|---|---|---|
| Age (y) [p = 0.74] | n = 29 a | n = 19 a | N/A |
| 20–24 | 4 (13.8%) | 2 (10.5%) | |
| 25–29 | 20 (69.0%) | 15 (78.9%) | |
| 30–34 | 5 (17.2%) | 2 (10.5%) | |
| Gender (F) [p = 0.14] | 17 (58.6%) | 7 (36.8%) | |
| Ethnicity [p = 0.69] | |||
| Asian | 7 (24.1%) | 6 (31.6%) | |
| Black or African American | 2 (6.9%) | 1 (5.3%) | |
| Hispanic or Latino | 1 (3.4%) | 2 (10.5%) | |
| White | 19 (65.5%) | 10 (52.6%) | |
| Test Scores | n = 32 | n = 22 | n = 164 |
| Practical Score | 60.6 (12) | 61.5 (11) b | 61.7 (12) b |
| Shelf Score | 72.5 (8) | 74.1 (8) b | 74.2 (8) b |
| Final Score | 319.5 (37) | 326.3 (30) b | 324.6 (39) b |
| Murmur a | Total Cohort (n = 196) | With PCS | Without PCS | Total Cohort without PCS | Effect on Identification | |||
|---|---|---|---|---|---|---|---|---|
| % Correct with PCG | % Correct without PCG | % Difference b | McNemar χ2 (p-Value) | % Difference (p-Value) | ||||
| Aortic Regurgitation | 47.7 | 54.4 | −6.7 | 2.6 (0.11) | −9.4 (0.32) | 0 (1.00) | −6.1 (0.18) | No difference |
| S4 | 86.7 | 68.7 | +18.0 | 22.3 (<0.001) | +9.4 (0.37) | +22.7 (0.06) | +19.5 (<0.001) | More frequent with PCG |
| Cardiac Friction Rub | 79.0 | 42.6 | +36.2 | 58.0 (<0.001) | +40.6 (<0.001) | +45.5 (0.004) | +35.4 (<0.001) | More frequent with PCG and PCS |
| Split S2 | 65.1 | 66.7 | −1.6 | 0.14 (0.71) | +6.3 (0.53) | −13.6 (0.26) | −3.0 (0.49) | No difference |
| Mitral Regurgitation | 56.4 | 59.0 | −2.6 | 0.32 (0.57) | +12.5 (0.25) | −18.2 (0.16) | −3.0 (0.57) | No difference |
| Ventricular Septal Defect | 14.4 | 51.3 | −36.9 | 61.7 (<0.001) | −46.9 (<0.001) | −27.3 (0.01) | −34.8 (<0.001) | Less frequent with PCG and PCS |
| Tricuspid Regurgitation | 33.3 | 75.4 | −42.1 | 61.1 (<0.001) | −53.1 (0.001) | −27.3 (0.06) | −39.6 (<0.001) | Less frequent with PCG and PCS c |
| S3 | 7.7 | 60.0 | −52.3 | 96.3 (<0.001) | −56.3 (<0.001) | −50.0 (0.002) | −51.2 (<0.001) | Less frequent with PCG and PCS c |
| Aortic Stenosis | 95.4 | 96.9 | −1.5 | 1.1 (0.29) | −6.3 (0.32) | −4.5 (0.32) | −1.2 (0.53) | No difference c |
| Mitral Stenosis | 18.0 | 5.1 | +12.9 | 17.0 (<0.001) | +6.3 (0.41) | +13.6 (0.08) | +14.0 (<0.001) | More frequent with PCG c |
Disclaimer/Publisher’s Note: The statements, opinions and data contained in all publications are solely those of the individual author(s) and contributor(s) and not of MDPI and/or the editor(s). MDPI and/or the editor(s) disclaim responsibility for any injury to people or property resulting from any ideas, methods, instructions or products referred to in the content. |
© 2024 by the authors. Licensee MDPI, Basel, Switzerland. This article is an open access article distributed under the terms and conditions of the Creative Commons Attribution (CC BY) license (https://creativecommons.org/licenses/by/4.0/).
Share and Cite
Nazari, M.A.; Ahn, J.; Collier, R.; Jacob, J.; Heussner, H.; Doucet-O’Hare, T.; Pacak, K.; Raman, V.; Farrish, E. The Evolving Stethoscope: Insights Derived from Studying Phonocardiography in Trainees. Sensors 2024, 24, 5333. https://doi.org/10.3390/s24165333
Nazari MA, Ahn J, Collier R, Jacob J, Heussner H, Doucet-O’Hare T, Pacak K, Raman V, Farrish E. The Evolving Stethoscope: Insights Derived from Studying Phonocardiography in Trainees. Sensors. 2024; 24(16):5333. https://doi.org/10.3390/s24165333
Chicago/Turabian StyleNazari, Matthew A., Jaeil Ahn, Richard Collier, Joby Jacob, Halen Heussner, Tara Doucet-O’Hare, Karel Pacak, Venkatesh Raman, and Erin Farrish. 2024. "The Evolving Stethoscope: Insights Derived from Studying Phonocardiography in Trainees" Sensors 24, no. 16: 5333. https://doi.org/10.3390/s24165333