Abstract
We present an optimized version of the skin calorimeter for measuring localized skin thermal responses during physical activity. Enhancements include a new holding system, more sensitive thermopiles, and an upgraded spiked heat sink for improved efficiency. In addition, we used a new, improved calorimetric model that takes into account all the variables that influence the measurement process. Resolution in power measurement is 1 mW. Performance tests under air currents and movement disturbances showed that the device maintains high accuracy; the deviation produced by these significant disturbances is less than 5%. Human subject tests, both at rest and during exercise, confirmed its ability to accurately measure localized skin heat flux, heat capacity, and thermal resistance (less than 5% uncertainty). These findings highlight the calorimeter’s potential for applications in sports medicine and physiological studies.
1. Introduction
The localized measurement of skin thermal response is essential for understanding the thermal regulation of the human body and for the study of several physiological and pathological conditions. Heat flux, thermal resistance, and heat capacity significantly influence the thermal behavior and temperature of the skin [1]. At rest, the human body dissipates between 70 and 80 W. During physical activity, dissipation can increase up to 1500 W. Most of this heat is dissipated by convection, radiation, and evaporation [2,3]. Localized measurements of skin heat flux are typically performed using heat flux sensors. However, these sensors disturb the heat flow in the measurement area, leading to results that depend on the sensor type and on the ambient conditions. Several studies have investigated skin heat flux at rest [4], as a function of clothing [5], while heating or cooling the subject [6,7], during different physical activities [8,9], or under extreme environmental conditions [10]. In a recent work, we studied the lack of standardization in skin heat flux measurements, and we proposed a normalization method [11].
On the other hand, indirect calorimetry is used to assess metabolic rates and energy expenditure and is considered today the gold standard, although it does not provide localized information [12]. From heat flow and its variations with temperature, it is possible to measure the heat capacity and thermal resistance of the skin in vivo. Sensors for measuring these quantities typically include integrated heating elements and temperature sensors [13].
Thermal resistance relates the power transmitted through the skin with the temperature change associated. This magnitude is macroscopic, and it is characteristic of the skin area analyzed. Thermal resistance depends on tissue composition, water content, blood flow, perfusion, etc. Several instruments and methods have been developed, such as the Hematron, which consists of a disc with a central heater and temperature sensors in the perimeter [14]; the method of Wang et al., based on heat flux sensors [10]; the ring flat conductivity meter [15]; the ultrathin conformal array [16]; the flexible 3ω sensor [17]; and the guarded thermistor probe of Okabe [18,19]. These measurements have been useful for evaluating vasoconstriction and vasodilatation, to study the effects of compression stockings, and even in cancer studies. In a recent work, we studied the relation between the thermal resistance measured by several authors and the heat-affected zone, which is one of the major difficulties in this field [20].
Regarding heat capacity, differential scanning calorimetry (DSC) is commonly used to measure heat capacity in vitro [21]. Heat capacity depends on the tissue composition and mainly on its water content. The field of in vivo heat capacity measurement did not develop significantly until 2009, when the 3ω method was proposed to measure the thermal properties of the skin [22]. Since then, the most notable instrumentation in the field are Webb RC’s ultrathin conformal arrays of sensors and actuators [16,23], Li Gao’s epidermal photonic devices [24], and Limei Tian’s flexible and stretchable 3ω sensors [17]. In a recent work, we studied the coherence between all these results and its dependence with thermal penetration depth and water content [25]. The applications of these measurements are still under development, but some of these methods have already been used to monitor small skin lesions [26].
Parallel to the development of these instruments, our team has developed a calorimetric sensor, also known as a skin calorimeter. This device was designed to measure the heat flux, thermal resistance, and heat capacity of a 2 × 2 cm2 square skin region. After several experimental measurements, it has been observed that one of the major limitations of this type of instrument is measuring during physical activity. Actually, there is no technology to measure the thermal behavior of localized skin areas during physical activity with enough resolution. In this work, we present a new version of the skin calorimeter, optimized for measurements during physical exercise. This instrument is a new, valuable tool in the field of physical exercise sensors, enabling precise monitoring of heat flux in localized moving parts of the human body, useful in the field of in vivo localized measurements. In addition to the improved design, a more efficient calorimetric model has been employed, allowing continuous and immediate measurement of fast thermal transients. First, the device characteristics and the calorimetric model are presented. Then, the operating range, the sensor’s capacities, and its limitations are explained. Finally, an example of experimental measurement during physical exercise is presented.
2. Materials and Methods
2.1. Skin Calorimeter
The new skin calorimeter design retains the same operating principle as its predecessors but includes several improvements. A new holding system has been introduced to facilitate easy application on the skin (part 1 in Figure 1). The calorimetric unit remains similar to previous versions (part 2 in Figure 1).
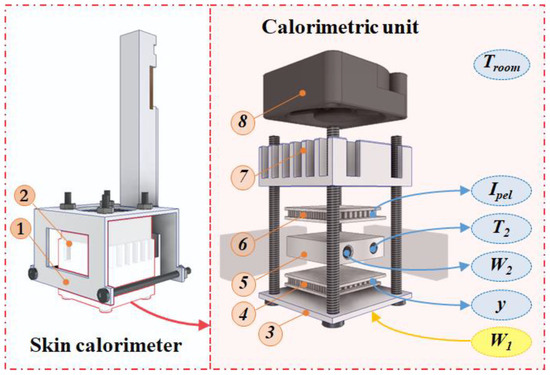
Figure 1.
New skin calorimeter exploded view: (1) holding system, (2) calorimetric unit, (3) measurement plate, (4) measurement thermopile, (5) thermostat, (6) cooling thermopile, (7) heat sink, (8) fan. The main measured variables are indicated in the figure and explained in the text.
A measuring thermopile (part 4 in Figure 1) generates the calorimetric signal y, which is proportional to the temperature difference between the measuring plate (part 3 in Figure 1), responsible for transmitting the power W1 dissipated by the human body or a calibration resistor, and the thermostat (part 5 in Figure 1) with a temperature T2, resulting from the W2 power dissipated inside it (PID control is used). The cooling system consists of a cooling thermopile (part 6 in Figure 1), a heat sink (part 7 in Figure 1), and a fan (part 8 in Figure 1). The fan (MF20C05, SEPA Europe, Eschbach, Germany) operates at 5 V supply. The cooling thermopile supply is variable and defined by its current (Ipel). The aluminum heat sink has been upgraded from a simple extruded heat sink to a machined spiked heat sink, enhancing its efficiency. Both the cooling and measuring thermopiles have been replaced with more sensitive modules (ET2065F2A131211W2.25, Laird Technologies, Chesterfield, MO, USA), increasing the device’s overall sensitivity. This version of the calorimeter can operate from 10 °C below the room temperature (Troom).
The mechanical enhancement includes threading the screws into the measuring plate, making this joint function more like a recessed joint rather than a hinge. This modification reduces the deformation of the measuring plate, thereby improving the device’s sensitivity and response time by minimizing the gap between elements. During assembly, thermal paste is applied between all components to ensure an optimal thermal contact. In addition, the thermostat and the measuring and cooling thermopiles are insulated on the sides with expanded polystyrene and protected from radiation by a layer of reflective aluminum foil.
With these improvements, the calorimeter can operate over a wide range of ambient temperatures (18–32 °C) and thermostat temperatures (15–40 °C) without temperature control saturation. The calorimeter design facilitates heat transfer between the sample and the thermostat and reduces external disturbances, enabling it to operate in motion or with slight air currents, as we will see later.
2.2. Calorimetric Model
Originally, the calorimetric model consisted of a MIMO (multiple input–multiple output) system with two inputs and two outputs. The inputs are the power dissipated by the skin (W1) and the power dissipated in the thermostat (W2). The outputs are the thermostat temperature (T2) and the calorimetric signal (y). In this new device, we incorporated two new inputs into the model to accurately represent the behavior of the calorimeter: the ambient temperature (Troom) and the current of the cooling thermopile (Ipel). Note that these two variables are not usually taken into account in calorimeters because they usually remain constant during calorimetric measurements. In calorimetry, the energy measurements are taken considering the initial state as a reference [27]. However, in physical activities, the local room temperature (Troom) around the calorimeter shows alterations during the measurement. These alterations are influenced by the cooling thermopile (Ipel). To simplify the calorimeter operation, the cooling thermopile operates in a range of intensities in which its behavior can be considered linear. Then, the system has four inputs and two outputs.
The calorimetric model is based on a physical image model that considers two bodies: the sample and the calorimeter itself. Each body is represented by its temperature (T1 and T2) and heat capacity (C1 and C2). The bodies are connected by thermal couplings: the thermal conductance between the sample and the environment is P1, the thermal conductance between the two bodies is P12, and the thermal conductance between the second body and the cold focus is P2. Considering the power developed in each body, the equations of the model are as follows (1):
where k is the Seebeck coefficient of the measurement thermopile. Parameter α represents how the cooling thermopile current (Ipel) affects the cold focus temperature, and β represents how Ipel affects the ambient temperature around the calorimeter.
The behavior of the calorimeter is represented by these equations, and all the variables are measurable at each instant with a sampling period of 0.5 s. The parameters to be identified are the heat capacities C1 and C2; the thermal conductances P1, P2, and P12; the Seebeck coefficient k; and the parameters α and β. All the parameters mentioned depend on the calorimeter’s parts and, hence, are constant, except for two: C1 and P1, which depend on the sample under the calorimeter.
2.3. Calibration
To calibrate the calorimeters, we used a calibration base that consists of an EPS block with a little aluminum block that contains a thermostat. This allows the calibration of the device. Figure 2 shows the calorimeter placed on its calibration base (a) and the calorimeter applied on the thigh of a human subject (b). In this paper, we present the calibration of two calorimeters, designated as S1 and S2.
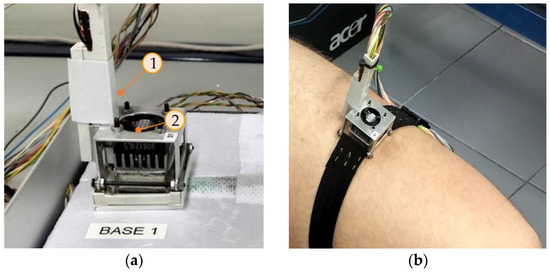
Figure 2.
New skin calorimeter (a) placed in its calibration base and (b) placed on the thigh of a human subject. (1) holding system, (2) calorimetric unit.
We performed several calibrations at various thermostat temperatures (T2) and cooling thermopile currents (Ipel). Both the thermostat temperature and the calorimetric signal were regulated using a PID controller, with a sampling period of 0.5 s. The purpose of these calibrations is to accurately represent the behavior of the calorimeter over its entire operating range. Figure 3 shows one of the calibration measurements performed.
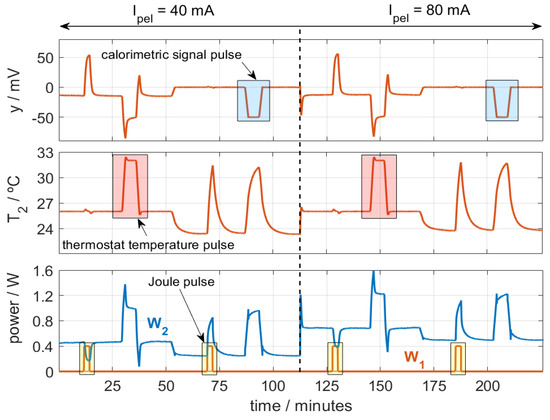
Figure 3.
Calibration measurement with temperature (T2, from 26 to 32 °C), calorimetric signal (y, from 0 to −50 mV), and Joule pulses (W1, from 0 to 0.4 W) for different Ipel values. Troom = 23 °C.
In the figure, three types of pulses are programmed: temperature pulses (T2, from 26 to 32 °C), calorimetric signal pulses (y, 0 to −50 mV), and Joule pulses (W1, from 0 to 0.4 W). The ambient temperature was Troom = 23 °C. Figure 3 represents the signals for calorimeter S1, which behaves similarly to calorimeter S2. To identify the model parameters, we use an iterative method used in previous works [28] that reconstructs the outputs of the model (calorimetric signal and thermostat temperature, T2 and y) from the inputs: the powers W1 and W2, the ambient temperature Troom, and the cooling thermopile current Ipel. To evaluate the accuracy of the model parameters obtained, we used an error criterion that consists of the root mean square error (RMSE) between the calculated signals (yc and T2,c) and the original ones (y0 and T2,0). With n being the number of points, the error criterion is the following (2):
Table 1 shows the mean values of the parameters obtained in the calibration process for both calorimeters S1 and S2. The mean RMSE of the fitting is 0.15 mW, 6.4 μV, and 0.9 mK for W1, y, and T2, respectively.

Table 1.
Parameters obtained in the calibration for calorimeters S1 and S2.
3. Results and Discussion
We have divided the results and discussion section into four parts. First, an experimental study is performed on two types of disturbances that affect the normal operation of skin calorimeters. The first involves air flows in the room caused by open windows, doors, or air-conditioning systems. The second disturbance is the sensor’s movement when attached to a part of the body that is exercising or moving. Finally, some measurements on the human body at rest and during exercise will be presented.
3.1. Experimental Performance Evaluation: Disturbances Caused by Air Currents
To simulate the disturbance caused by the air flow in the room where measurements are performed, a small air blower is directed over the calorimeters placed on the calibration base. Using a small air blower at a distance of 1–2 m can simulate a range of air velocities common in various scenarios of interest. Air blowers typically produce air speeds of 8–10 m/s, which are comparable to the velocities of air conditioning units (2–5 m/s), fans (2–8 m/s depending on the type), and natural air currents entering through a window (1–10 m/s). Therefore, an air blower can be a practical tool for experimental setups requiring varied airflow conditions. These speeds are higher than typical speeds in room measurements but are achievable in some experiments of high physical exercise performance. The blower used is an old AEPI hair dryer (220 V 450 W) running in cold mode. The air speed in the area of the sensors was 8 m/s.
With the calorimeters placed on their calibration base, a measurement was programmed in which the calibration resistor dissipated a constant power of 0.2 W, and the thermostat temperature was programmed for a constant value of 28 °C. The ambient temperature was 25.6 °C, and the cooling supply was 0.1 A. Figure 4 shows the calorimetric signal, the thermostat temperature, the power W2, and the calculated power W1. In this experimental measurement, the air impacts on the heat sink and fans of each calorimeter. For this reason, the hot air from these fans returns to the calorimeters, increasing the temperature around them. This results in an increase of the calorimetric signal (Figure 4a), a disturbance of the thermostat temperature (Figure 4b), and a decrease of the thermostat power (Figure 4c). Using the procedure described (Equation (1)), we calculate the power W1, as shown in Figure 4d. As a conclusion, we can state that this perturbation produces a deviation in the calculation of W1 by 10 mW (5% of the real power).
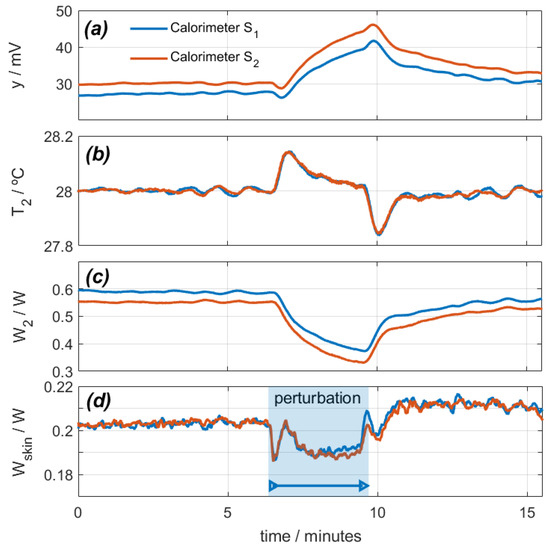
Figure 4.
Effect of a disturbance caused by a directed air blower on calorimeters S1 (blue) and S2 (red): (a) calorimetric signals, (b) thermostat temperatures, (c) thermostat power, (d) calculated calibration base dissipated power (real power is 0.2 W).
3.2. Experimental Performance Evaluation: Disturbances Caused by Calorimeter Movements
When a subject is exercising and calorimeters are attached to the thigh (as in Figure 2b), the devices will move. To reproduce this movement, we constructed an oscillating system driven by a small direct current motor. We programmed oscillations at 112 rpm. The oscillations in normal pedaling on a bicycle range between 60 and 100 rpm. The calibration base and the calorimeters are placed on the oscillating system, as seen in Figure 5.
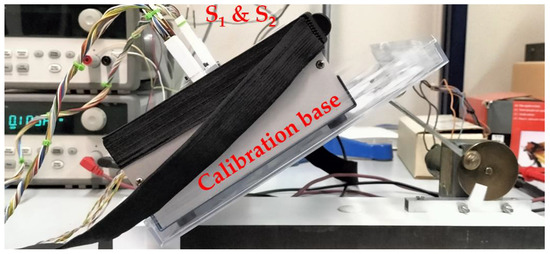
Figure 5.
Experimental setup for studying the movement effect on the calorimeters.
In this case, the calibration resistor dissipates zero power in calorimeter S1 and 25 mW in calorimeter S2. Figure 6 shows the calorimetric signal, the temperature and power of the thermostat, and the calculated W1 power. The disturbance lasts for 16 min.
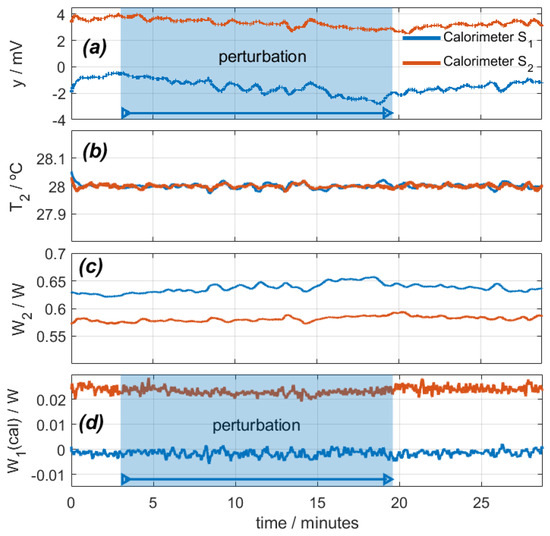
Figure 6.
Study of the effect of sensor movement on an oscillating system (112 rpm): (a) calorimetric signals, (b) thermostat temperatures, (c) thermostat power, (d) calculated calibration base dissipated power (real power is 0 W for calorimeter S1 and 0.025 W for calorimeter S2). Troom = 27.1 °C; Ipel = 0.1 A.
When the disturbance begins, the calorimetric signal decreases due to cooling, the low-frequency oscillations slightly increase, and the high-frequency oscillations increase from ±2 mW to ±3 mW. T2 is set at 28 °C, and W2 is adjusted to maintain this temperature. As a result, the calculated power W1 remains at zero for calorimeter S1 and decreases by 1.5 mW for calorimeter S2, which is not significant considering the inherent noise.
3.3. Experimental Measurements on Human Body At Rest
In this section, we present a measurement with the subject at rest and seated. Using the calorimetric model (Equation (1)) and an iteration process similar to the one used in calibration, we are able to determine the heat flux, the heat capacity, and the thermal resistance of the skin. Measuring heat capacity and thermal resistance requires a thermal perturbation which, in our case, consists of a thermostat temperature pulse. In measurements at rest, this method takes 5–10 min and is accurate. With the calorimeter, we have performed interesting measurements, for example, to monitor the evolution of a second-degree burn [26]. Figure 7 shows an experimental measurement performed on the thigh of a healthy 29-year-old male subject (Figure 2). The subject was seated and at rest. To determine the thermal properties of the skin, thermostat temperature T2 is programmed between 26 and 31 °C periodically. Figure 7 shows the thermostat temperature and the results of the calculation process: the heat capacity Cskin = C1, the thermal resistance Rskin = 1/ P1, and the heat flux of the skin Wskin = W1.
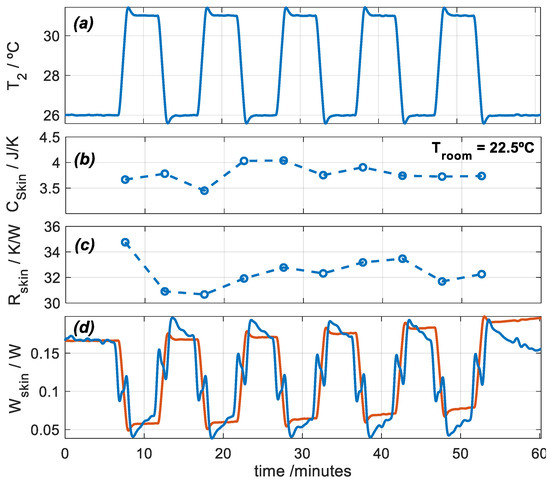
Figure 7.
Experimental measurement performed on the thigh of a healthy 29-year-old male subject seated and at rest: (a) thermostat temperature T2, (b) skin heat capacity Cskin, (c) skin thermal resistance Rskin, and (d) skin heat flux Wskin (blue: deconvolution, red: model, Equation (3)). Troom = 22.5 °C, and RH = 61%.
To obtain these results, two factors were considered when measuring on skin:
- Heat flux can be determined by direct deconvolution by performing an inverse filtering of the first system equation of the calorimetric model (Equation (1)). This result is shown by the blue signal in Figure 7d. For this, mean values of Cskin and Rskin, shown in Figure 7b,c, were used. However, a simple model can represent skin heat flux, as given by Equation (3), which reproduces the inverse form of the thermostat temperature (red signal in Figure 7d). This method is valid only for rest measurements. For exercise measurements, we used direct deconvolution.
- When the calorimeter is applied on the skin, the room temperature around the sensor increases. This rise in room temperature (∆Troom) must be determined. This can be easily done using the second system equation of the calorimetric model (Equation (1)).
3.4. Experimental Measurements on Human Body During Exercise
In the case of physical activities, heat capacity and thermal resistance cannot be measured because the thermal responses of the human body interfere with the temperature pulses. To estimate C1 and P1, we measured these parameters before and after physical activity (Figure 7b,c). Now, two experimental measurements were conducted to analyze the thermal responses of a healthy 29-year-old male subject engaged in physical exercise on a stair stepper (Figure 8).
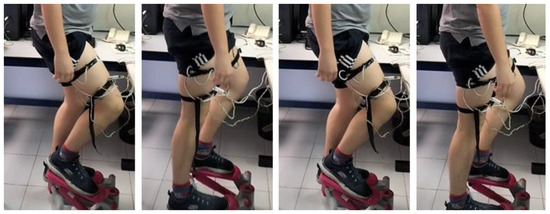
Figure 8.
Healthy 29-year-old male subject performing physical exercise on a stair stepper.
The experiments focused on two specific body regions: the forehead and the thighs. The calorimeters measured continuously and were attached to the skin with the holding system shown in Figure 2. During the first experiment, the subject performed a 10-min exercise at a room temperature of Troom = 22.4 °C. Measurements were taken from the thigh and the forehead, and the thermostat temperature was set at T2 = 26 °C. In the second experiment, the subject exercised for 20 min at a room temperature of Troom = 24.3 °C. This time, the measurements were recorded from both thighs at thermostat temperatures of T2 = 26 °C and T2 = 36 °C. The heat flux dissipated by the skin (Wskin) and heart rate were monitored for both experiments. Figure 9 shows the results.
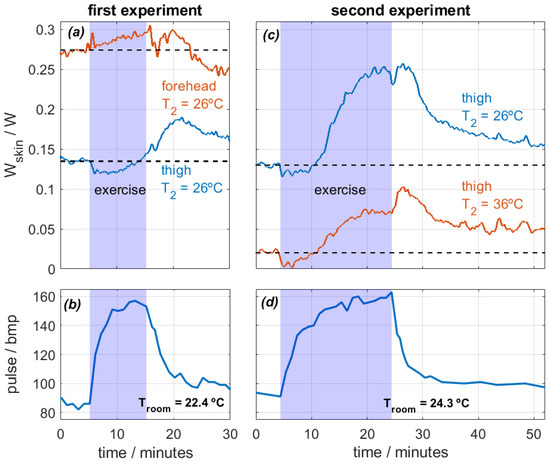
Figure 9.
Experimental measurements performed on the forehead and thighs of a healthy 29-year-old male subject performing physical exercise on a stair stepper. First experiment (a,b): 10 min exercise, Troom = 22.4 °C, measurements on the thigh and the forehead at T2 = 26 °C. Second experiment (c,d): 20 min exercise, Troom = 24.3 °C and HR = 58%, measurements on both thighs at T2 = 26 and 36 °C. Heat flux Wskin (a,c) and heart rate (b,d) are displayed.
Regarding the first experiment, heat flux in the forehead was higher than in the thigh, which is expected [26]. Both values are obtained at the same thermostat temperature and are therefore comparable. When exercise begins, heat flux in the thigh decreases from 0.135 to 0.120 W (−11%) in the first six minutes. This slight reduction is caused by the initial blood flow redistribution. When exercise begins, the body prioritizes supplying blood to the active muscles. This causes a temporary blood flow reduction in the skin, which reduces the skin temperature and thus the heat flux [29].
As exercise continues, all parts of the body experience an increase in heat flux. The forehead, a zone far from the active muscles, experiences a slow heat flux increase over time from 0.274 W to 0.294 W (+7%) and starts to decrease when exercise ends. Note that the forehead does not experience the initial slight heat flux reduction. The thigh heat flux increases slowly over time, reaching a maximum value of 0.190 W (+41%). However, the maximum value is reached after exercise. This phenomenon illustrates the high thermal inertia of the human body; a stationary state is not reached during exercise. The heat flow starts to decrease at the end of the experiment, but it does not reach the initial steady state. For this reason, we prepared a second experiment with longer exercise.
In the second experiment, the heat flux evolution is similar in both thighs, but the values depend on the thermostat temperature T2, as expected. Heat flux decreases slightly in both cases for the first 6 min after the beginning of the exercise. In this case, the heat flux at T2 = 26 °C increases up to 0.25 W (+92%), and the heat flux at T2 = 35 °C increases up to 100 mW. After the exercise, the skin continues dissipating a high heat flux for another 5 min and then slowly decreases over time. Note that when the exercise is over, everything that was heated begins to cool down at different rates. In the forehead, sweating and evaporation were observed, and this probably caused the higher cooling. In the thighs, the cooling is slower. This is probably due to the lack of evaporation and the higher fat content in this zone of the human body, which leads to a higher heat capacity and thermal resistance and thus a higher time constant [26]. All these observations are coherent with the bibliography [6,7,8,9] and show the ability of the calorimeter to assess accurately the localized heat flux during physical activity.
4. Discussion
The experimental device was improved by increasing its sensitivity and making it more user-friendly. A precise methodology for measuring heat flux was also developed, which involves determining the thermal properties of the skin at the skin measurement zone beforehand. Heat flux measurements were conducted on an individual performing moderate physical exercise. Due to the high sensitivity of the instrument, it is possible to non-invasively detect transient phenomena that were previously only measurable through invasive methods, such as inserting a thermistor into the artery [20]. This instrument is a valuable tool in the field of physical exercise sensors, enabling precise monitoring of heat flux in localized moving parts of the human body, useful in the field of in vivo localized measurements. Table 2 compares the skin calorimeter (skin cal.) with a selection of commercial heat flux sensors widely used in research works (film and plate types). The table highlights the geometric characteristics (detection area and thickness), the thermal resistance, and the sensitivity of each sensor. Sensitivity (μV/Wm−2) is defined as the change in output signal (calorimetric signal) per change in heat flux, holding other variables constant. Sensitivity (mV/W) is also indicated as the ratio of the calorimetric signal variation to the variation of heat power.
Table 2.
Comparison between the skin calorimeter and different commercial heat flux sensors.
The skin calorimeter presents several strengths. It incorporates a programmable thermostat that increases its sensitivity compared to other sensors. Heat transmission occurs through conduction, and the thermopile is well-insulated, minimizing interference from radiation and convection. Additionally, the thermostat allows for measurements of heat flux and thermal properties of the skin. There are also significant opportunities for improvement. Further testing with a broader population, including various ages and genders, is necessary to validate its practical application in monitoring physical activity. Miniaturizing the calorimeter is another key opportunity, as this would allow integration into a multisensor device for wearable applications.
However, some challenges remain. Thermal measurements are inherently slow due to the high heat capacities of both the skin and the device. This makes it critical to manage measurement timing carefully to avoid overlapping thermal property readings with continuous heat flux measurements. Additionally, the cooling system requires manual selection of the cooling current for the thermopile to prevent thermostat saturation, which complicates operation and requires prior simulation. Without addressing these limitations, the device may become a bit cumbersome to use in dynamic or fast-paced applications.
5. Conclusions
This study presented an optimized version of the skin calorimeter for measuring localized skin thermal responses during physical activity. We conclude that the instrumentation enhancements and the new calorimetric model allow for high accuracy calibration, with an RMSE of less than 0.15 mW in power measurements. The new calorimeter showed acceptable deviations (5%) under air-current disturbances and stable power measurements during movement, but with increased oscillation (from ±2 mW to ±3 mW). These disturbances simulate measuring during physical activity.
During rest, measurements with thermostat temperature pulses (from 26 to 31 °C) allowed the accurate determination of the heat flux, the heat capacity, and the thermal resistance of the skin. As expected, the heat flux measured depends on the thermostat temperature set. The values obtained are consistent with previous works
Measurements of exercise showed that heat flux increases after exercise, as expected (between 41–90% at a thermostat temperature of 26 °C). However, this increase is not immediate; at the beginning of the exercise, we detected a slight heat flux reduction (8–11%) that lasted about 6 min. This is caused by an initial redistribution of blood flow in the active muscles. We also measured heat flux in the forehead, detecting a heat flux increase also, but with a different time constant. These dynamic behaviors are consistent with the literature.
This optimized skin calorimeter is an advance in direct calorimetry, providing accurate measurements of skin thermal responses under various conditions with significant potential for sport medicine and physiological research. The goal is to establish the skin calorimeter as a complementary and widely used tool for exercise monitoring. To validate its practical application, measurement campaigns are planned with subjects of various ages and sexes. Additionally, recent advances in its development will enable the miniaturization of the device, allowing its integration into a multisensor system for easy skin application.
Author Contributions
Conceptualization, M.R.d.R. and P.J.R.d.R.; data curation, M.R.d.R. and P.J.R.d.R.; formal analysis, M.R.d.R. and P.J.R.d.R.; investigation, M.R.d.R. and P.J.R.d.R.; methodology, M.R.d.R.; project administration, P.J.R.d.R.; resources, M.R.d.R. and P.J.R.d.R.; software, P.J.R.d.R.; supervision, P.J.R.d.R.; validation, M.R.d.R. and P.J.R.d.R.; visualization, P.J.R.d.R.; writing—original draft, M.R.d.R. and P.J.R.d.R.; writing—review and editing, P.J.R.d.R. All authors have read and agreed to the published version of the manuscript.
Funding
This research received no external funding.
Institutional Review Board Statement
The study was conducted in accordance with the Declaration of Helsinki and approved by the Human Experimentation Ethical Committee of the University of las Palmas de Gran Canaria (protocol code CEIH-2024-02, approved on April 2024).
Informed Consent Statement
Informed consent was obtained from all subjects involved in the study.
Data Availability Statement
Data are contained within the article.
Conflicts of Interest
The authors declare no conflicts of interest.
References
- Cohen, M.L. Measurement of the thermal properties of human skin. J. Investig. Dermatol. 1977, 69, 333–338. [Google Scholar] [CrossRef]
- Cramer, M.N.; Jay, O. Biophysical aspects of human thermoregulation during heat stress. Auton. Neurosci. 2016, 196, 3–13. [Google Scholar] [CrossRef]
- Cain, J.B.; Livingstone, S.D.; Nolan, R.W.; Keefe, A.A. Respiratory heat loss during work at various ambient temperatures. Respir. Physiol. 1997, 79, 145–150. [Google Scholar] [CrossRef] [PubMed]
- Keijzer, A.; Woerlee, M.; Kluver, B.D.; Buist, M. Direct measurement of sensible heat transfer between man and his environment. J. Appl. Physiol. 1972, 33, 677–680. [Google Scholar] [CrossRef]
- Anttonen, H.; Puhakka, K.; Niskanen, J.; Ryhanen, P. Cutaneous heat loss in children during anaesthesia. Br. J. Anaesth. 1995, 74, 306–310. [Google Scholar] [CrossRef] [PubMed]
- House, J.R.; Tipton, M.J. Using skin temperature gradients or heat flux measurements to determine thresholds of vasoconstriction and vasodilatation. Eur. J. Appl. Physiol. 2002, 88, 141–145. [Google Scholar] [CrossRef] [PubMed]
- Ostrowski, Z. Modelling and validation of transient heat transfer processes in human skin undergoing local cooling. Przegląd Elektrotechniczny 2015, 1, 78–81. [Google Scholar] [CrossRef]
- Xu, X.; Karis, A.J.; Buller, M.J.; Santee, W.R. Relationship between core temperature, skin temperature, and heat flux during exercise in heat. Eur. J. Appl. Physiol. 2013, 113, 2381–2389. [Google Scholar] [CrossRef]
- Eggenberger, P.; MacRae, B.A.; Kemp, S.; Bürgisser, M.; Rossi, R.M.; Annaheim, S. Prediction of core body temperature based on skin temperature, heat flux, and heart rate under different exercise and clothing conditions in the heat. Front. Physiol. 2018, 10, 1780. [Google Scholar] [CrossRef]
- Wang, L.; Chong, D.; Yi, H. A revised method to predict skin’s thermal resistance. Therm. Sci. 2018, 22, 1795–1802. [Google Scholar] [CrossRef]
- Rodríguez de Rivera, P.J.; Rodríguez de Rivera, M.; Socorro, F.; Rodríguez de Rivera, M. Heat flow measurement of human skin using a calorimetric sensor with a programmable thermostat: An alternative to climate chambers. Measurement 2022, 201, 111693. [Google Scholar] [CrossRef]
- Delsoglio, M.; Achamrah, N.; Berger, M.M.; Pichard, C. Indirect Calorimetry in Clinical Practice. J. Clin. Med. 2019, 8, 1387. [Google Scholar] [CrossRef]
- Madhusudan, B.; Kulkarni, Y.; Renu, V. A role of integrated microheaters in a microfluidics based point-of-care-testing and beyond for healthcare applications. Appl. Mater. Today 2024, 38, 102225. [Google Scholar] [CrossRef]
- Grenier, E.; Gehin, C.; Mcadams, E.; Lun, B.; Gobin, J.P.; Uhl, J.F. Effect of compression stockings on cutaneous microcirculation: Evaluation based on measurements of the skin thermal conductivity. Phlebology 2016, 31, 101–105. [Google Scholar] [CrossRef]
- Van de Staak, W.J.B.M.; Brakkee, A.J.M.; de Rijke-Herweijer, H.E. Measurements of the thermal conductivity of the skin as an indication of skin blood flow. J. Invest. Dermatol. 1968, 51, 149–154. [Google Scholar] [CrossRef] [PubMed][Green Version]
- Webb, R.C.; Pielak, R.M.; Bastien, P.; Ayers, J.; Niittynen, J.; Kurniawan, J.; Manco, M.; Lin, A.; Cho, N.H.; Malyrchuk, V.; et al. Thermal transport characteristics of human skin measured in vivo using ultrathin conformal arrays of thermal sensors and actuators. PLoS ONE 2015, 10, e0118131. [Google Scholar] [CrossRef]
- Tian, L.; Li, Y.; Webb, R.C.; Krishnan, S.; Bian, Z.; Song, J.; Ning, X.; Crawford, K.; Kurniawan, J.; Bonifas, A.; et al. Flexible and stretchable 3ω sensors for thermal characterization of human skin. Adv. Funct. Mater. 2017, 27, 1701282. [Google Scholar] [CrossRef]
- Okabe, T.; Fujimura, T.; Okajima, J.; Aiba, S.; Maruyama, S. Noninvasive measurement of effective thermal conductivity of human skin with a guard-heated thermistor probe. Int. J. Heat Mass Transf. 2018, 126, 625–635. [Google Scholar] [CrossRef]
- Okabe, T.; Fujimura, T.; Okajima, J.; Kambayashi, Y.; Aiba, S.; Maruyama, S. First-in-human clinical study of a novel technique to diagnose malignant melanoma via thermal conductivity measurements. Sci. Rep. 2018, 9, 3853. [Google Scholar] [CrossRef]
- Rodríguez de Rivera, P.J.; Rodríguez de Rivera, M.; Socorro, F.; Calbet, J.A.; Rodríguez de Rivera, M. Advantages of in vivo measurement of human skin thermal conductance using a calorimetric sensor. J. Therm. Anal. Calorim. 2022, 147, 10027–10036. [Google Scholar] [CrossRef]
- Kerstin, G.; Olaf, M.; Ingolf, L.; Müller, G. Review of thermal properties of biological tissues. SPIE-Int. Soc. Opt. Engineering. 1995, 25, 45–65. [Google Scholar]
- Wang, H.; Sen, M. Analysis of the 3-omega method for thermal conductivity measurement. Int. J. Heat Mass Transf. 2009, 52, 2102–2109. [Google Scholar] [CrossRef]
- Webb, R.C.; Bonifas, A.P.; Behnaz, A.; Zhang, Y.; Yu, K.J.; Cheng, H.; Shi, M.; Bian, Z.; Liu, Z.; Kim, Y.-S.; et al. Ultrathin conformal devices for precise and continuous thermal characterization of human skin. Nat. Mater. 2013, 12, 938–944. [Google Scholar] [CrossRef] [PubMed]
- Gao, L.; Zhang, Y.; Malyarchuk, V.; Jia, L.; Jang, K.I.; Webb, R.C.; Fu, H.; Shi, Y.; Zhou, G.; Shi, L.; et al. Epidermal photonic devices for quantitative imaging of temperature and thermal transport characteristics of the skin. Nat. Commun. 2014, 5, 4938. [Google Scholar] [CrossRef]
- Rodríguez de Rivera, P.J.; Rodríguez de Rivera, M.; Socorro, F.; Rodriguez de Rivera, M. In vivo measurement of skin heat capacity: Advantages of the scanning calorimetric sensor. J. Therm. Anal. Calorim. 2022, 147, 12155–12163. [Google Scholar] [CrossRef]
- Rodríguez de Rivera, P.J.; Rodríguez de Rivera, M.; Socorro, F.; Rodríguez de Rivera, M. Heat flow, heat capacity, and thermal resistance of localized surfaces of the human body using a new calorimetric sensor. J. Therm. Anal. Calorim. 2022, 147, 7385–7398. [Google Scholar] [CrossRef]
- Bracken, D.S.; Biddle, R.S.; Carrillo, L.A.; Hypes, P.A.; Rudy, C.R.; Schneider, C.M.; Smith, M.K. Application Guide to Safeguards Calorimetry. Los Alamos National Laboratory Manual LAUR-02-1764; 2002. Available online: https://www.researchgate.net/publication/242170728_Application_Guide_to_Safeguards_Calorimetry (accessed on 1 August 2024).
- Rodríguez de Rivera, P.J.; Rodríguez de Rivera, M.; Socorro, F.; Rodríguez de Rivera, M. Validation of a Skin Calorimeter to Determine the Heat Capacity and the Thermal Resistance of the Skin. Sensors 2023, 23, 4391. [Google Scholar] [CrossRef]
- Trangmar, S.J.; Chiesa, S.T.; Kalsi, K.K.; Niels, H.S.; José, G.A. Whole body hyperthermia but not skin hyperthermia accelerates brain and locomotor limb circulatory strain and impairs exercise capacity in humans. Physiol. Rep. 2017, 5, e13108. [Google Scholar] [CrossRef]
- Heat Flux Sensors by Omega, Thin Film Sensors. Available online: https://sea.omega.com/th/pptst/HFS-3_HFS-4.html#description (accessed on 4 September 2024).
- Heat Flux Sensors by Omega, Thin Film Sensors. Available online: https://es.omega.com/pptst/UHF-HFS-SERIES.html#description (accessed on 4 September 2024).
- Heat Flux Sensors by Hukseflux. Available online: https://www.hukseflux.com/products/heat-flux-sensors/heat-flux-sensors (accessed on 4 September 2024).


Disclaimer/Publisher’s Note: The statements, opinions and data contained in all publications are solely those of the individual author(s) and contributor(s) and not of MDPI and/or the editor(s). MDPI and/or the editor(s) disclaim responsibility for any injury to people or property resulting from any ideas, methods, instructions or products referred to in the content. |
© 2024 by the authors. Licensee MDPI, Basel, Switzerland. This article is an open access article distributed under the terms and conditions of the Creative Commons Attribution (CC BY) license (https://creativecommons.org/licenses/by/4.0/).