

ERIRMS Evaluation of the Reliability of IoT-Aided Remote Monitoring Systems of Low-Voltage Overhead Transmission Lines

 , ,
, , 
 and
and
Abstract
1. Introduction
- ▪
- This study aims to evaluate the reliability of an IoT wireless sensor network used for the remote status monitoring of low-voltage OTPL, and the proposed models provide a solid foundation for SG implementation.
- ▪
- The supply sources of the sensor devices are perfectly configured, ensuring the delivery of information even in the event of a line failure.
- ▪
- Reliable operation of the network is ensured by assessing the reliability of wireless sensors used in the remote monitoring of overhead power lines.
- ▪
- Reliability assessment models and analytical expressions developed for remote monitoring systems and wireless sensor networks were compared with different methods and models and were found to be effective.
- ▪
- On the basis of the information-graphic model, the possibility of the optimal use of the device is created.
2. Related Works
2.1. IoT-Based Remote Monitoring in Power Systems
2.2. Fault Detection and Monitoring
3. Proposal Methods
3.1. Calculation Methods of Technological Losses in the Transmission and Distribution of Electric Energy through Electric Networks
3.2. Structure of Low-Voltage Overhead Power Transmission Networks
3.3. Application of Wireless Sensor Networks in Remote Monitoring Systems
3.4. Reliability of Wireless Sensor Networks in Remote Monitoring Systems
- (the object is introduced as having the ability to work until it is put into operation);
- (it is assumed that the object cannot maintain its working capacity indefinitely);
- , it is assumed that an object cannot be self-restored after a failure (this indicator is not used for systems that are recoverable by service personnel) [45].
4. Result and Discussions
- –
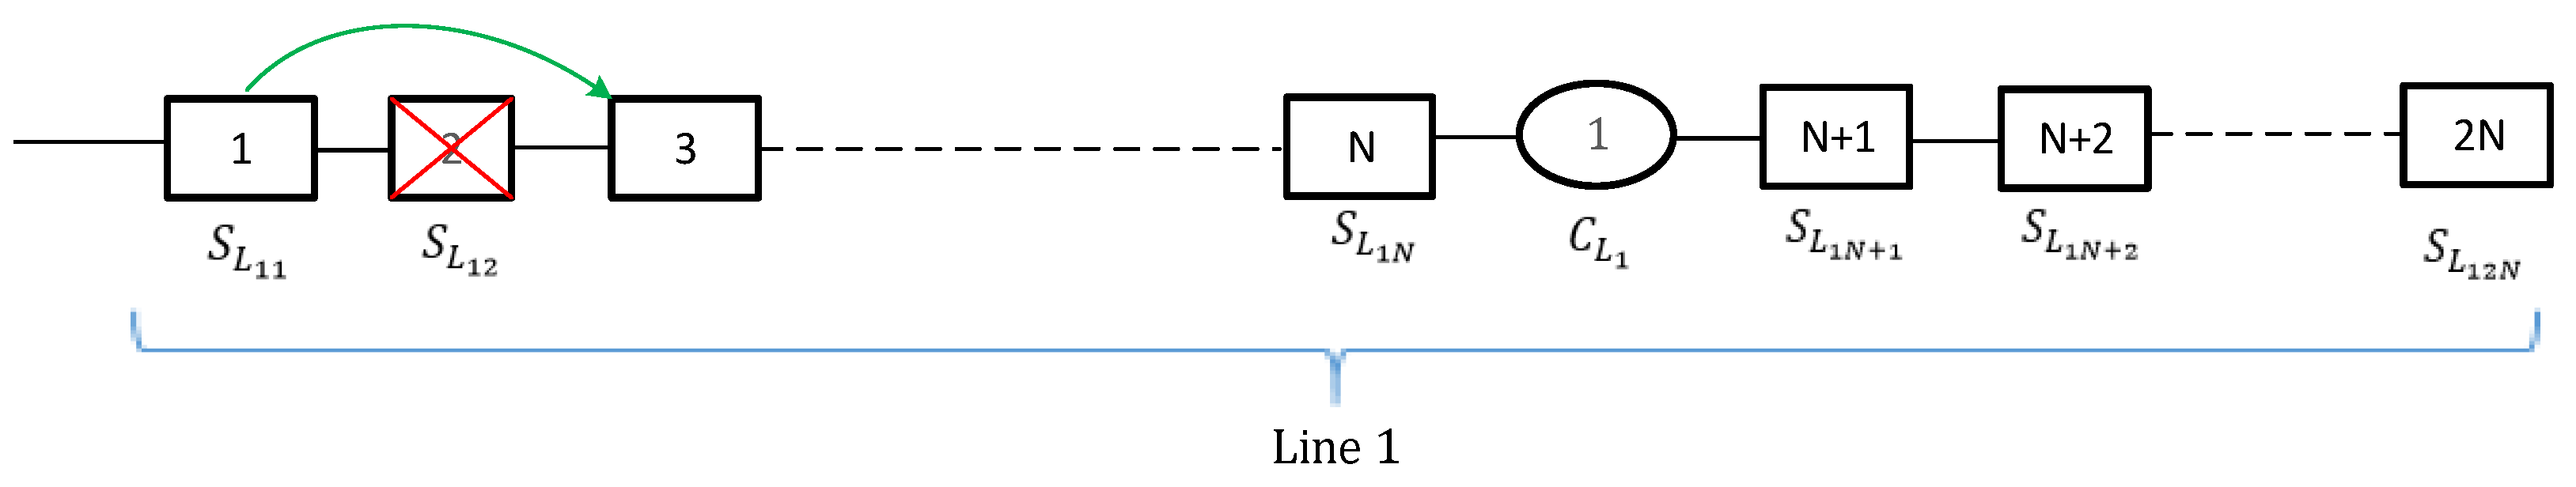
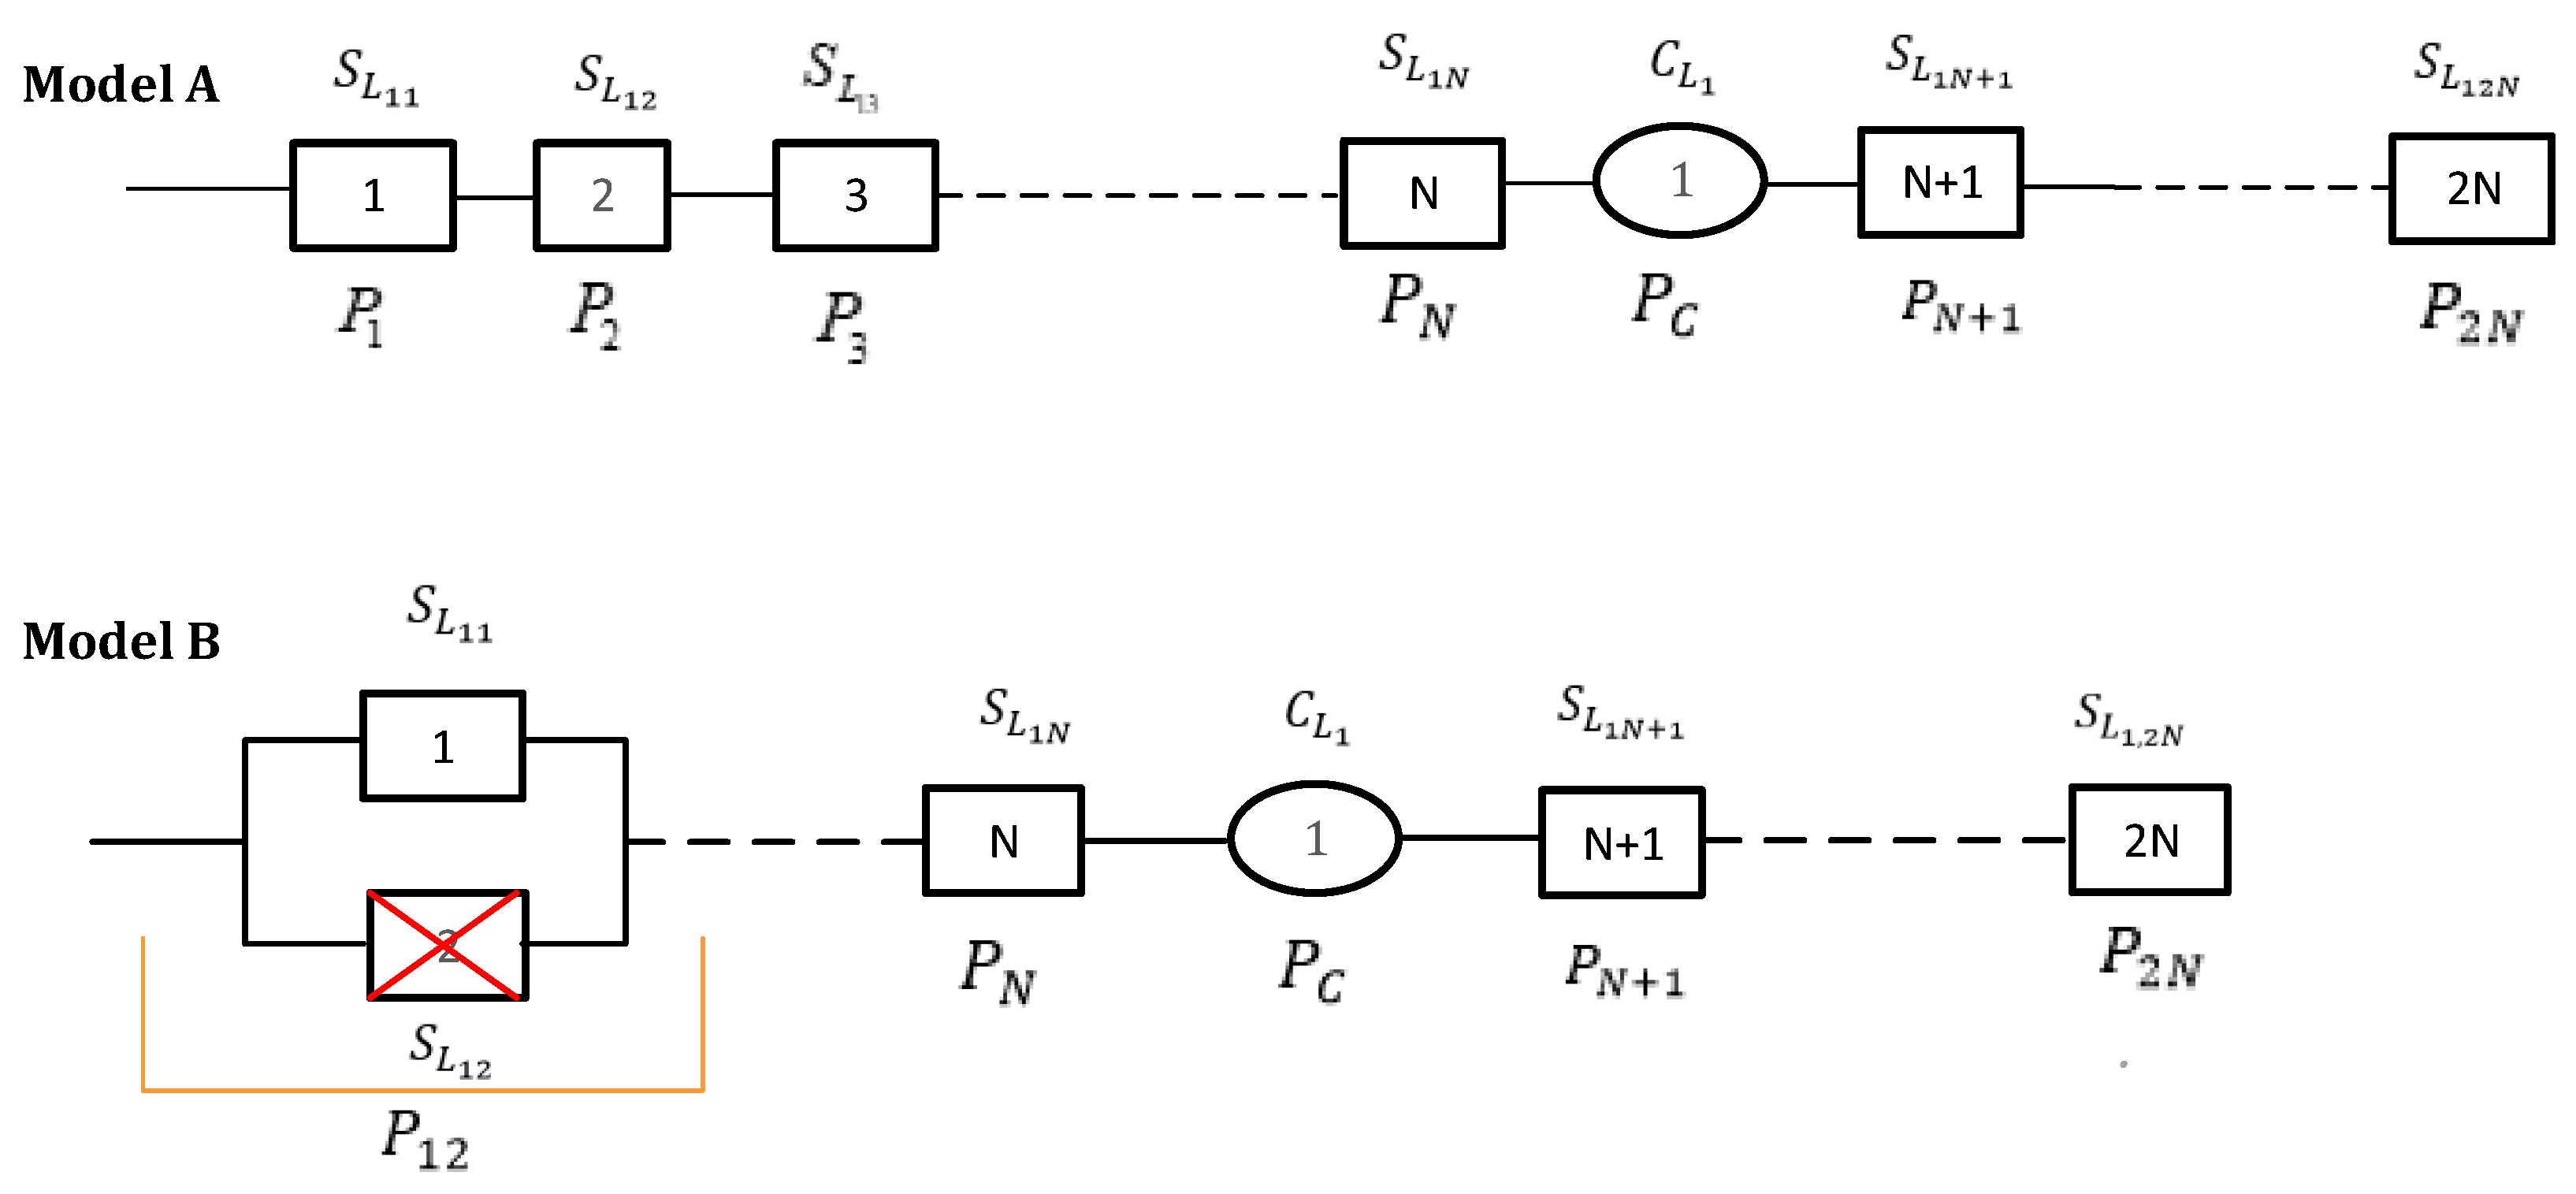
- connection of sensors and concentrators in a functional sequence;
- –
- invariance of the intensity of rejections during operation
- –
| For the first grid N = 200 K = 10 | For the second grid N = 200 K = 5 |
- –
- The maximum distance of information propagation was within the range of the three sensors in a sequence, and it was not transmitted over a greater distance.
- –
- Only one sensor can fail (reject) on one line at the moment.
5. Conclusions
Author Contributions
Funding
Institutional Review Board Statement
Informed Consent Statement
Data Availability Statement
Conflicts of Interest
References
- Moustafa, E. Energy Efficiency—The Innovative Ways for Smart Energy, the Future Towards Modern Utilities; IntechOpen: Rijeka, Croatia, 2012. [Google Scholar] [CrossRef]
- Ekanayake, J.B.; Jenkins, N.; Liyanage, K.M.; Wu, J.; Yokoyama, A. Smart Grid Technology and Applications; John Wiley & Sons: Chichester, UK, 2012; pp. 9–320. [Google Scholar]
- Bibri, S.E.; Alexandre, A.; Sharifi, A.; Krogstie, J. Environmentally sustainable smart cities and their converging AI, IoT, and big data technologies and solutions: An integrated approach to an extensive literature review. Energy Inform. 2023, 6, 9. [Google Scholar] [CrossRef]
- Rácz, L.; Szabó, D.; Göcsei, G.; Németh, B. Distributed thermal monitoring of high-voltage power lines. Sensors 2023, 23, 2400. [Google Scholar] [CrossRef] [PubMed]
- Yapa, C.; De Alwis, C.; Wijewardhana, U.; Liyanage, M.; Ekanayake, J. Power Line Monitoring-Based Consensus Algorithm for Performance Enhancement of Energy Blockchain Applications in Smart Grid 2.0. IEEE Trans. Smart Grid 2024. [Google Scholar] [CrossRef]
- Laninga, J.; Nasr Esfahani, A.; Ediriweera, G.; Jacob, N.; Kordi, B. Monitoring Technologies for HVDC Transmission Lines. Energies 2023, 16, 5085. [Google Scholar] [CrossRef]
- Li, W.; Chen, Y.; Peng, Z.; Wang, X.; Xia, C. Investigation on Induced Energy Extraction from High-Voltage Transmission Lines Based on Three-Coil WPT Systems. Energies 2023, 16, 3079. [Google Scholar] [CrossRef]
- Zychma, D.; Sowa, P. Electromagnetic Transients in Multi-Voltage Transmission Lines during Non-Simultaneous Faults. Energies 2022, 15, 1046. [Google Scholar] [CrossRef]
- Liao, W.; Yang, Q.; Ke, K.; Qiu, Z.; Lei, Y.; Jiao, F. Non-Intrusive Voltage-Inversion Measurement Method for Overhead Transmission Lines Based on Near-End Electric-Field Integration. Energies 2023, 16, 3415. [Google Scholar] [CrossRef]
- Ibrahem, M.I.; Nabil, M.; Fouda, M.M.; Mahmoud, M.M.E.A.; Alasmary, W.; Alsolami, F. Efficient privacy-preserving electricity theft detection with dynamic billing and load monitoring for AMI networks. IEEE Internet Things J. 2020, 8, 1243–1258. [Google Scholar] [CrossRef]
- Murdan, A.P. Internet of Things for enhancing stability and reliability in power systems. J. Electr. Eng. Electron. Control. Comput. Sci. 2023, 9, 1–8. [Google Scholar]
- Punmiya, R.; Choe, S. Energy theft detection using gradient boosting theft detector with feature engineering-based preprocessing. IEEE Trans. Smart Grid 2019, 10, 2326–2329. [Google Scholar] [CrossRef]
- Liu, Y.; Riba, J.-R.; Moreno-Eguilaz, M. Energy balance of wireless sensor nodes based on Bluetooth low energy and thermoelectric energy harvesting. Sensors 2023, 23, 1480. [Google Scholar] [CrossRef] [PubMed]
- Morales-Aragones, J.I.; Williams, M.S.M.; Kupolati, H.; Alonso-Gómez, V.; Gallardo-Saavedra, S.; Redondo-Plaza, A.; Muñoz-García, M.Á.; Sánchez-Pacheco, F.J.; Hernández-Callejo, L. A power-line communication system governed by loop resonance for photovoltaic plant monitoring. Sensors 2022, 22, 9207. [Google Scholar] [CrossRef] [PubMed]
- Wen, M.; Xie, R.; Lu, K.; Wang, L.; Zhang, K. FedDetect: A novel privacy-preserving federated learning framework for energy theft detection in smart grid. IEEE Internet Things J. 2022, 9, 6069–6080. [Google Scholar] [CrossRef]
- Tang, X.; Wang, X.; Cattley, R.; Gu, F.; Ball, A.D. Energy harvesting technologies for achieving self-powered wireless sensor networks in machine condition monitoring: A review. Sensors 2018, 18, 4113. [Google Scholar] [CrossRef]
- Ibrahem, M.I.; Badr, M.M.; Fouda, M.M.; Mahmoud, M.; Alasmary, W.; Fadlullah, Z.M. PMBFE: Efficient and privacy-preserving monitoring and billing using functional encryption for AMI networks. In Proceedings of the International Symposium on Networks, Computers and Communications (ISNCC), Montreal, QC, Canada, 20–22 October 2020; IEEE: Piscataway, NJ, USA, 2020; Volume 2020. [Google Scholar] [CrossRef]
- Kłos, A. Mathematical Models of Electrical Network Systems: Theory and Applications—An Introduction; Springer International Publishing AG: Cham, Switzerland, 2017; ISSN 1876-1100. Available online: https://link.springer.com/book/10.1007/978-3-319-52178-7 (accessed on 10 April 2024).
- Zainuddin, N.M.; Abd. Rahman, M.S.; Ab. Kadir, M.Z.A.; Nik Ali, N.H.; Ali, Z.; Osman, M.; Mansor, M.; Mohd Ariffin, A.; Abd. Rahman, M.S.; Nor, S.F.M.; et al. Review of thermal stress and condition monitoring technologies for overhead transmission lines: Issues and challenges. IEEE Access 2020, 8, 120053–120081. [Google Scholar] [CrossRef]
- Listyukhin, V.A.; Pecherskaya, E.A.; Safronova, O.A.; Artamonov, D.V. Systematization and monitoring of quality parameters of overhead power transmission lines functioning. IOP Conf. Ser. Earth Environ. Sci. 2022, 990, 012058. [Google Scholar] [CrossRef]
- Christopher, A.V.; Swaminathan, G.; Subramanian, M.; Thangaraj, P. Distribution line monitoring system for the detection of power theft using power line communication. In Proceedings of the IEEE Conference on Energy Conversion (CENCON), Johor Bahru, Malaysia, 13–14 October 2014; IEEE: Piscataway, NJ, USA, 2014; pp. 55–60. [Google Scholar] [CrossRef]
- Gungor, V.C.; Hancke, G.P. Industrial wireless sensor networks: Challenges, design principles, and technical approaches. IEEE Trans. Ind. Electron. 2009, 56, 4258–4265. [Google Scholar] [CrossRef]
- Al Mhdawi, A.K.; Al-Raweshidy, H.S. A smart optimization of fault diagnosis in electrical grid using distributed software-defined IoT system. IEEE Syst. J. 2019, 14, 2780–2790. [Google Scholar] [CrossRef]
- Dineshkumar, K.; Ramanathan, P.; Ramasamy, S. Development of ARM processor based electricity theft control system using GSM network. In Proceedings of the International Conference on Circuits, Power and Computing Technologies [ICCPCT-2015], Nagercoil, India, 19–20 March 2015; IEEE: Piscataway, NJ, USA, 2015; pp. 1–6. [Google Scholar] [CrossRef]
- Patil, S.A. Wireless Technology for Power Theft Monitoring; Technical Research Paper Competition for Students (TRPCS-2K17); G. H. Raisoni College of Engineering and Management: Amravati, India, 2017; Available online: https://www.ijsr.net/conf/TRPCS2017/TRPCS2K17-30.pdf (accessed on 5 July 2024).
- Muruganandhan, D.A.; Muthunagai, R.; Rajkumar, S.; Mohamed Vasif, J. Remote monitoring of distribution transformer with power theft detection using PLC & SCADA. In Proceedings of the International Conference on System, Computation, Automation and Networking (ICSCAN), Pondicherry, India, 3–4 July 2020; IEEE: Piscataway, NJ, USA, 2020; Volume 2020, pp. 1–4. [Google Scholar] [CrossRef]
- Zheng, Z.; Yang, Y.; Niu, X.; Dai, H.N.; Zhou, Y. Wide and deep convolutional neural networks for electricity-theft detection to secure smart grids. IEEE Trans. Ind. Inform. 2018, 14, 1606–1615. [Google Scholar] [CrossRef]
- Ul Mehmood, M.; Ulasyar, A.; Khattak, A.; Imran, K.; Sheh Zad, H.; Nisar, S. Cloud based IoT solution for fault detection and localization in power distribution systems. Energies 2020, 13, 2686. [Google Scholar] [CrossRef]
- Peter, G.; Stonier, A.A.; Gupta, P.; Gavilanes, D.; Vergara, M.M.; Sin, J.L. Smart fault monitoring and normalizing of a power distribution system using IoT. Energies 2022, 15, 8206. [Google Scholar] [CrossRef]
- Sobhy, A.; Megahed, T.F.; Abo-Zahhad, M. Overhead transmission lines dynamic rating estimation for renewable energy integration using machine learning. Energy Rep. 2021, 7 (Suppl. S5), 804–813. [Google Scholar] [CrossRef]
- Dwarakesh, K.; Jeyasekar, C. Design and Implementation of Low-cost Remote Monitoring of Distribution Transformer with Consumer wise Energy recording, Load control & Power theft detection using Internet of Things. Int. J. Adv. Res. Electr. Eng. 2018, 2, 71–79. [Google Scholar]
- Chaves, T.R.; Martins, M.A.I.; Martins, K.A.; de Macedo, A.F.; de Francisci, S. Application study in the field of solutions for the monitoring distribution transformers of the overhead power grid. Energies 2021, 14, 6072. [Google Scholar] [CrossRef]
- Yang, T.; Liu, Y.; Li, W. Attack and defence methods in cyber-physical power system. IET Energy Syst. Integr. 2022, 4, 159–170. [Google Scholar] [CrossRef]
- Khujamatov, K.E.; Khasanov, D.T.; Reypnazarov, E.N. Modeling and Research of Automatic Sun Tracking System on the bases of IoT and Arduino UNO. In Proceedings of the International Conference on Information Science and Communications Technologies ICISCT 2019, Tashkent, Uzbekistan, 4–6 November 2019. [Google Scholar] [CrossRef]
- Siddikov, I.X.; Sattarov, K.A.; Khujamatov, K.E. Modeling of the Transformation Elements of Power Sources Control. In Proceedings of the International Conference on ICISCT—2017, Tashkent, Uzbekistan, 2–4 November 2017. [Google Scholar]
- Davronbekov, D.; Khayrullaev, A. Analysis of wave propagation models in RMS of low voltage overhead power line. AIP Conf. Proc. 2024, 3147, 030021. [Google Scholar] [CrossRef]
- Zhao, J.; Yue, X. Condition monitoring of power transmission and transformation equipment based on industrial internet of things technology. Comput. Commun. 2020, 157, 204–212. [Google Scholar] [CrossRef]
- IEC 60038:2009; IEC Standard Voltages. IEC: Geneva, Switzerland, 2009.
- Taleb, H.; Nasser, A.; Andrieux, G.; Charara, N.; Cruz, E.M. Wireless technologies, medical applications and future challenges in WBAN: A survey. Wirel. Netw. 2021, 27, 5271–5295. [Google Scholar] [CrossRef]
- Komolafe, O.M.; Udofia, K.M. A technique for electrical energy theft detection and location in low voltage power distribution systems. J. Eng. Appl. Sci. 2020, 5, 41–49, ISSN: 2575-2022; ISSN: 2575-1468 (Online). [Google Scholar] [CrossRef]
- Golikov, V.A. Classification of indicators of reliability of systems in heavy engineering. J. Phys. Conf. Ser. 2021, 1889, 042069. Available online: https://iopscience.iop.org/article/10.1088/1742-6596/1889/4/042069/meta (accessed on 5 August 2024). [CrossRef]
- Huang, J.; Huang, Z.; Zhan, X. Research on three-state reliability evaluation method of high reliability system based on multi-source prior information. PeerJ Comput. Sci. 2023, 9, e1439. [Google Scholar] [CrossRef] [PubMed] [PubMed Central]
- Silva, I.; Guedes, L.A.; Portugal, P.; Vasques, F. Reliability and Availability Evaluation of Wireless Sensor Networks for Industrial Applications. Sensors 2012, 12, 806–838. [Google Scholar] [CrossRef] [PubMed]
- Rausand, M.; Barros, A.; Hoyland, A. System Reliability Theory: Models, Statistical Methods, and Applications, 3rd ed.; John Wiley: Hoboken, NJ, USA, 2020; 864p, ISBN 978-1-119-37395-7. [Google Scholar]
- De Maria, L.; Golinelli, E.; Perini, U. Innovative optical systems and sensors for on line monitoring of high voltage overhead lines and power components. In Proceedings of the AEIT International Annual Conference, Cagliari, Italy, 20–22 September 2017; IEEE: Piscataway, NJ, USA, 2017; pp. 1–6. [Google Scholar] [CrossRef]
- Juraeva, N.I.; Khayrullaev, A.F.; Hamraev, J.H. Analysis of the energy efficiency of wireless communication when receiving a data stream. IOP Conf. Ser. Mater. Sci. Eng. 2020, 981, 032007. [Google Scholar] [CrossRef]
- Abdalzaher, M.S.; Elsayed, H.A.; Fouda, M.M.; Salim, M.M. Employing machine learning and IoT for earthquake early warning system in smart cities. Energies 2023, 16, 495. [Google Scholar] [CrossRef]
- Choi, S.; Park, C. Convolution Neural Network with Laser-Induced Breakdown Spectroscopy as a Monitoring Tool for Laser Cleaning Process. Sensors 2022, 23, 83. [Google Scholar] [CrossRef] [PubMed]
- Davronbekov, D.A.; Khayrullaev, A.F. Models and algorithms for remote monitoring of the condition of overhead power lines. Bull. TUIT Manag. Commun. Technol. 2022, 2, 2181-1083. [Google Scholar]
- Abdujalilovich, D.D.; Karimovich, M.U. Reliability of the BTS-BSC system with different types of communication lines between them. Int. J. Adv. Trends Comput. Sci. Eng. 2020, 9, 6684–6689. [Google Scholar] [CrossRef]
- Matyokubov, U.K.; Davronbekov, D.A. The impact of mobile communication power supply systems on communication reliability and viability and their solutions. Int. J. Adv. Sci. Technol. 2020, 29, 3374–3385. [Google Scholar]


| Strengths | Weaknesses |
| -prevention of cyber-attacks on energy supply; -Smart modeling; | -using several network devices; -increase in expenditure; -the necessity of obtaining major investments for the advancement of technology |
| Opportunities | Threats |
| -the ability to remotely monitor the network in real time; -detection of technical malfunctions and illegal connections; -optimization of energy loss and assessing network reliability. | -disproportionate adaptation of network with sensor devices; -electromagnetic field effect; -improper organization of the system. |
| Voltage, kV | The Highest Transmitted Active Power, MW2 | The Longest Transmission Distance, km |
|---|---|---|
| 0.4 | 0.05–0.15 | 0.5–1 |
| 6–20 | 2–3 | 10–15 |
| 35 | 5–10 | 30–50 |
| 110 | 25–50 | 50–150 |
| Scheme | Proposal Methodology | Power Transmission Line Events | Development Level |
|---|---|---|---|
| [27] | wide and deep CNN model to detect electricity theft in smart grids | electricity theft | complex |
| [28] | fault detection and isolation using IoT | failure and faults in electricity | simple, effective |
| [29] | Smart fault monitoring and normalizing of a power distribution system using IoT | failure and faults in SCADA | simple, effective |
| [30] | estimation for renewable energy integration using machine learning with the DLR method | solar radiation, wind speed, and ambient temperature | medium |
| [31] | optimal synchronization system for remotely located sensor | break and cause damage, issue with phase | complex |
| [32] | autonomously monitoring the current, voltage, oil level, and winding temperature of a distribution transformer using IoT | consumer-wise energy recording on current and voltage | simplex |
| [33] | cyber-attacks and coordinated cyber—physical attacks on power system | generation transformation and transmission, load current, and phase | very complex |
| Testing Number | Error Voltage Sensor, % | Error Current Sensor, % | Error Temperature Sensor, % |
|---|---|---|---|
| 1 | 0.99 | 0.12 | 0.7 |
| 2 | 1.23 | 0.74 | 0.66 |
| 3 | 0.15 | 1.01 | 0.45 |
| 4 | 0.4 | 0.8 | 1.001 |
| 5 | 0.49 | 0.69 | 0.2 |
| 6 | 1.37 | −0.45 | 0.62 |
| 7 | −0.89 | 0.68 | 0.35 |
| 8 | 1.16 | −0.65 | 1.26 |
| 9 | 0.49 | 0.59 | 0.33 |
| 10 | 2.06 | 2.15 | 1.65 |
| Average error | 0.74 | 0.56 | 0.72 |
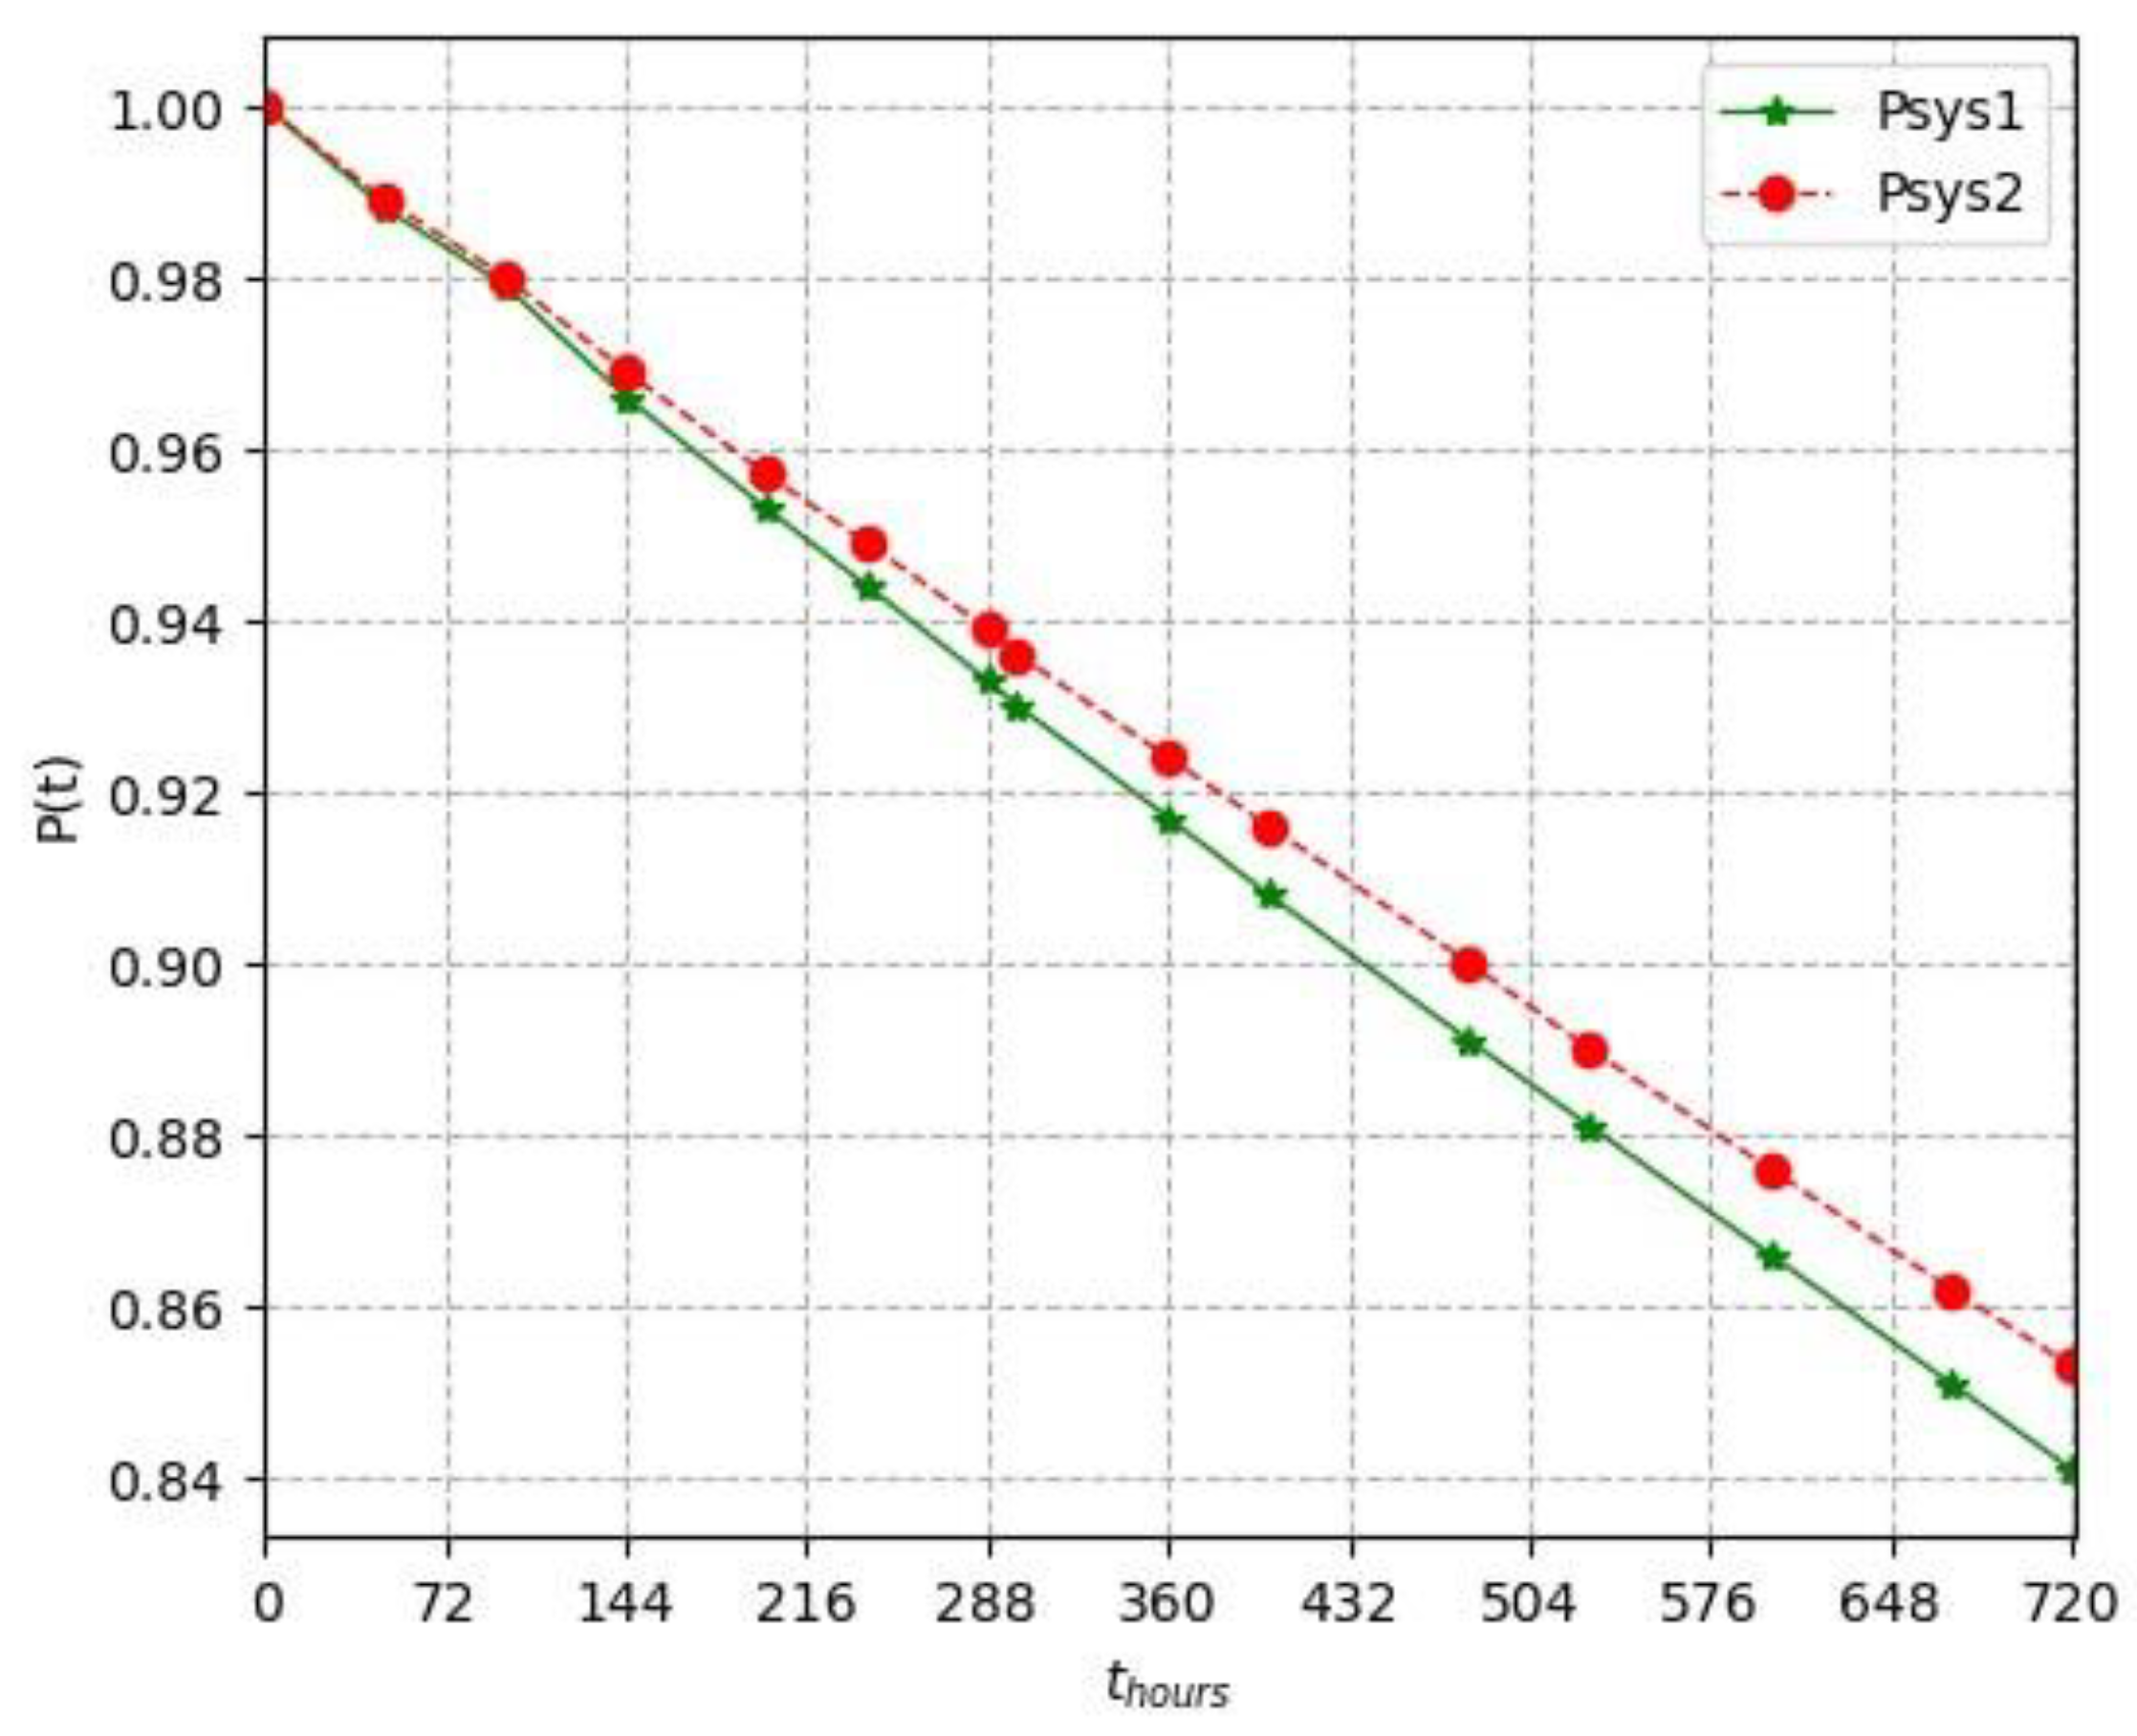
| Reliability Indicators | Different Times During the Month | |||||||||||||
|---|---|---|---|---|---|---|---|---|---|---|---|---|---|---|
| 48 | 96 | 144 | 200 | 240 | 288 | 300 | 360 | 400 | 480 | 528 | 600 | 672 | 720 | |
| 0.988 | 0.979 | 0.966 | 0.953 | 0.944 | 0.933 | 0.930 | 0.917 | 0.908 | 0.891 | 0.881 | 0.866 | 0.851 | 0.841 | |
| 0.989 | 0.980 | 0.969 | 0.957 | 0.949 | 0.939 | 0.936 | 0.924 | 0.916 | 0.9 | 0.890 | 0.876 | 0.862 | 0.853 | |
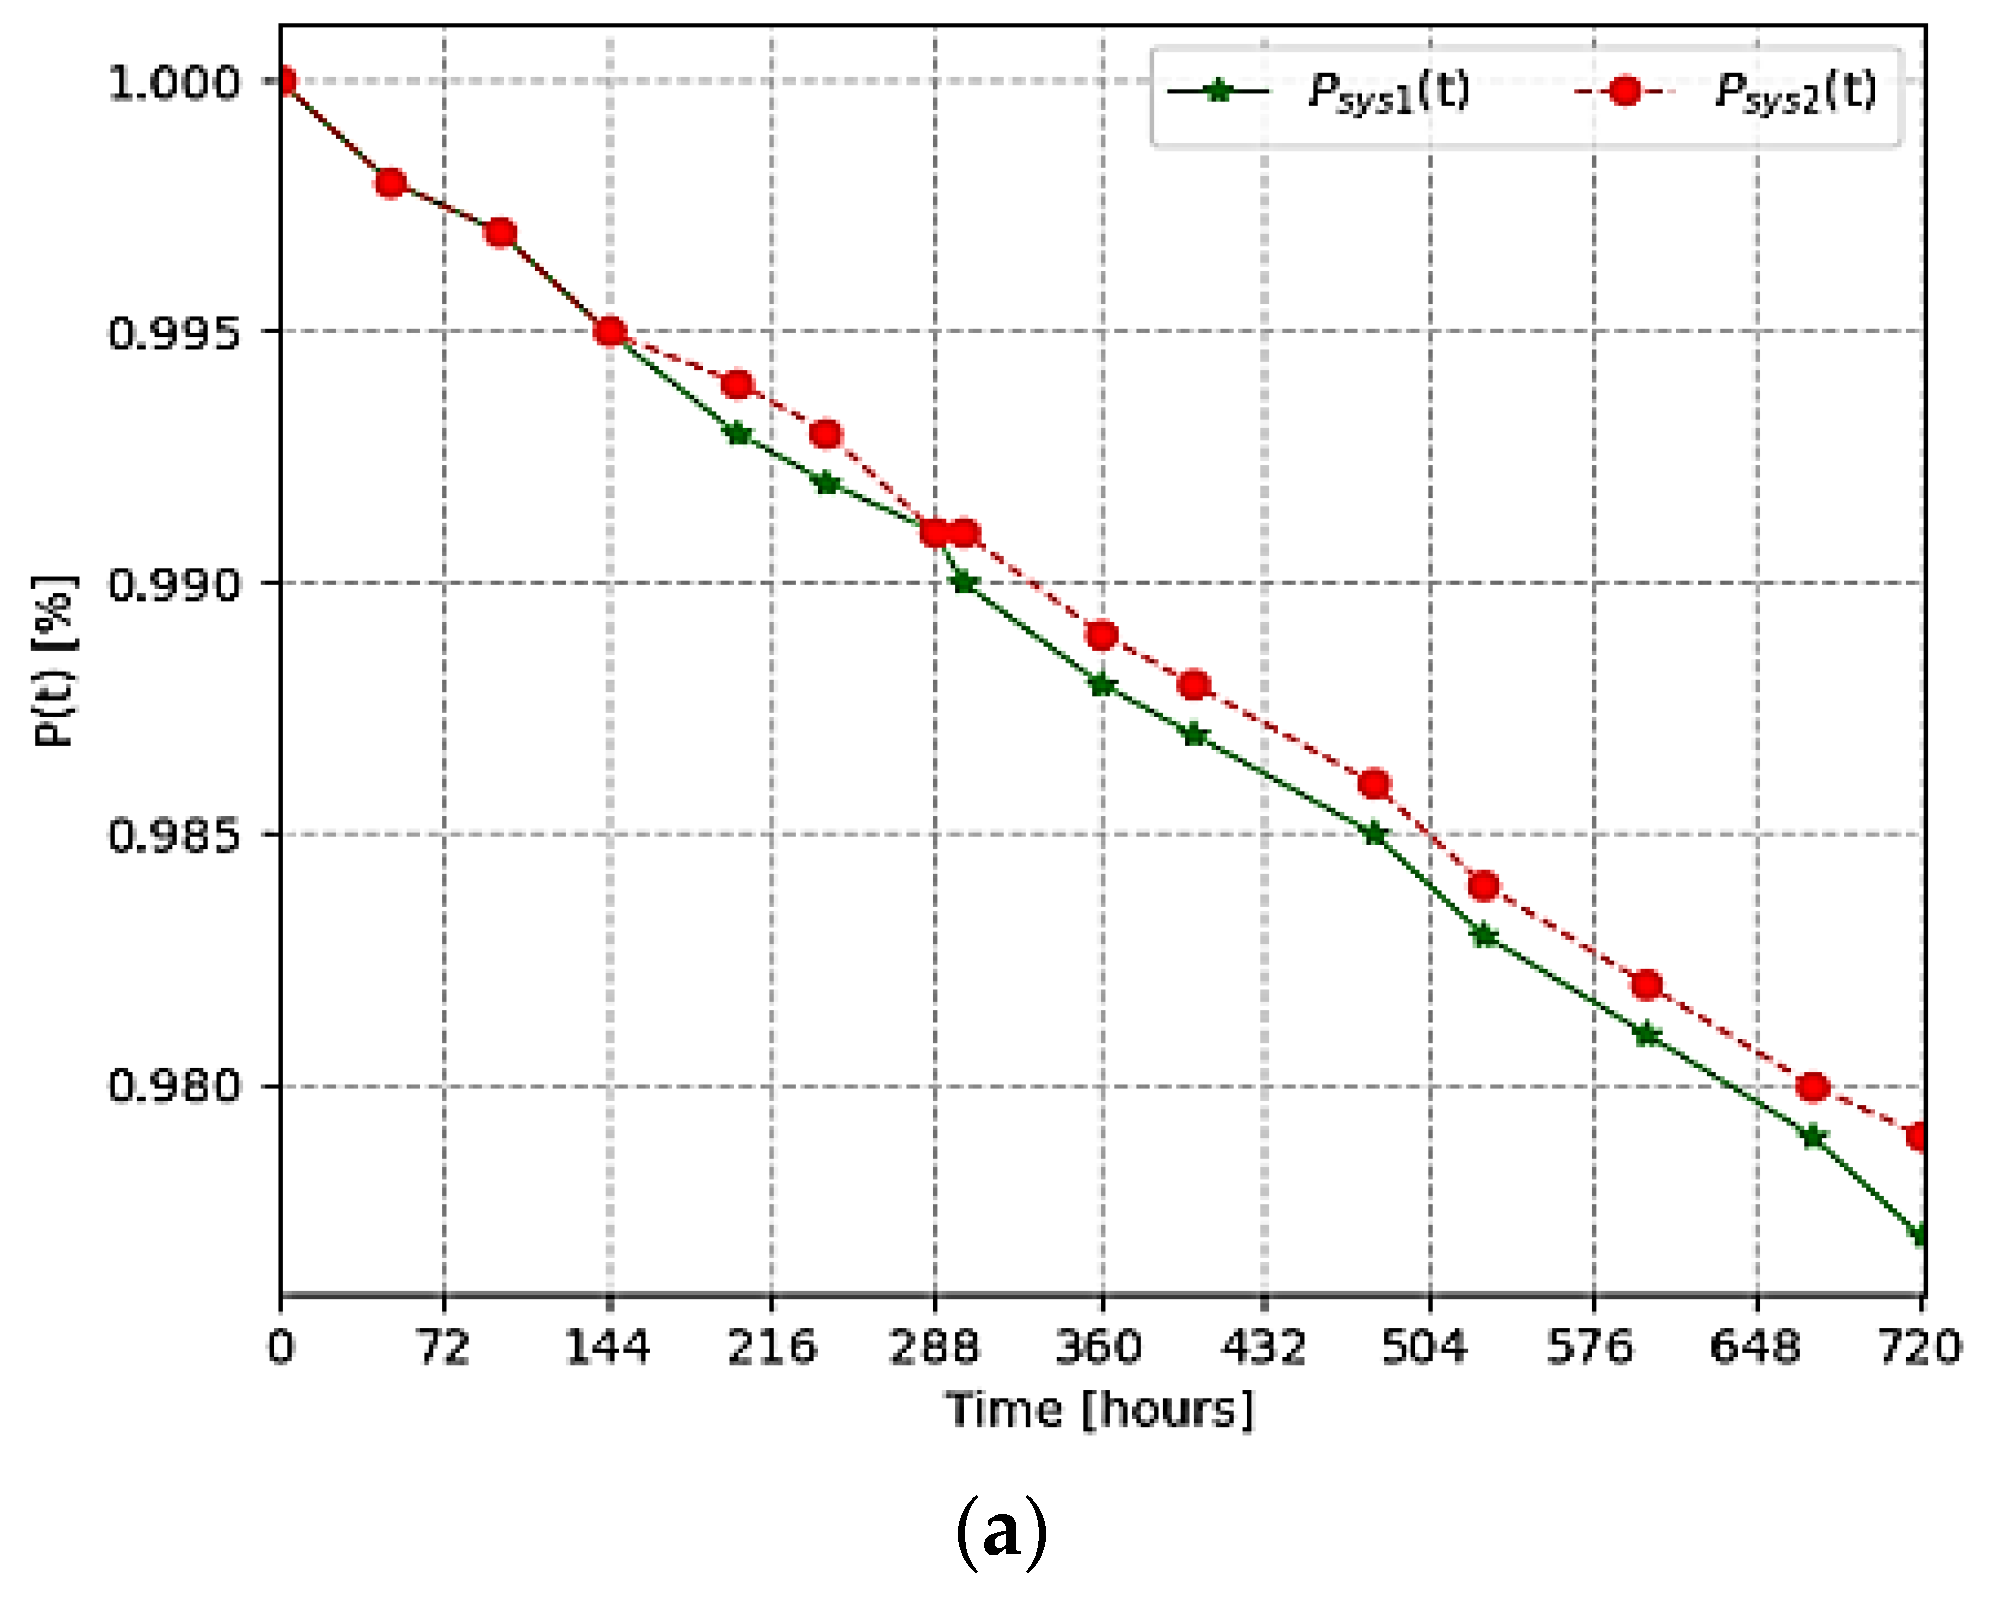
| Reliability Indicators | Different Times During a Month | |||||||||||||
| 48 | 96 | 144 | 200 | 240 | 288 | 300 | 360 | 400 | 480 | 528 | 600 | 672 | 720 | |
| 0.998 | 0.997 | 0.995 | 0.993 | 0.992 | 0.991 | 0.990 | 0.988 | 0.987 | 0.985 | 0.983 | 0.981 | 0.979 | 0.977 | |
| 0.998 | 0.997 | 0.995 | 0.994 | 0.993 | 0.991 | 0.991 | 0.989 | 0.988 | 0.986 | 0.984 | 0.982 | 0.980 | 0.979 | |
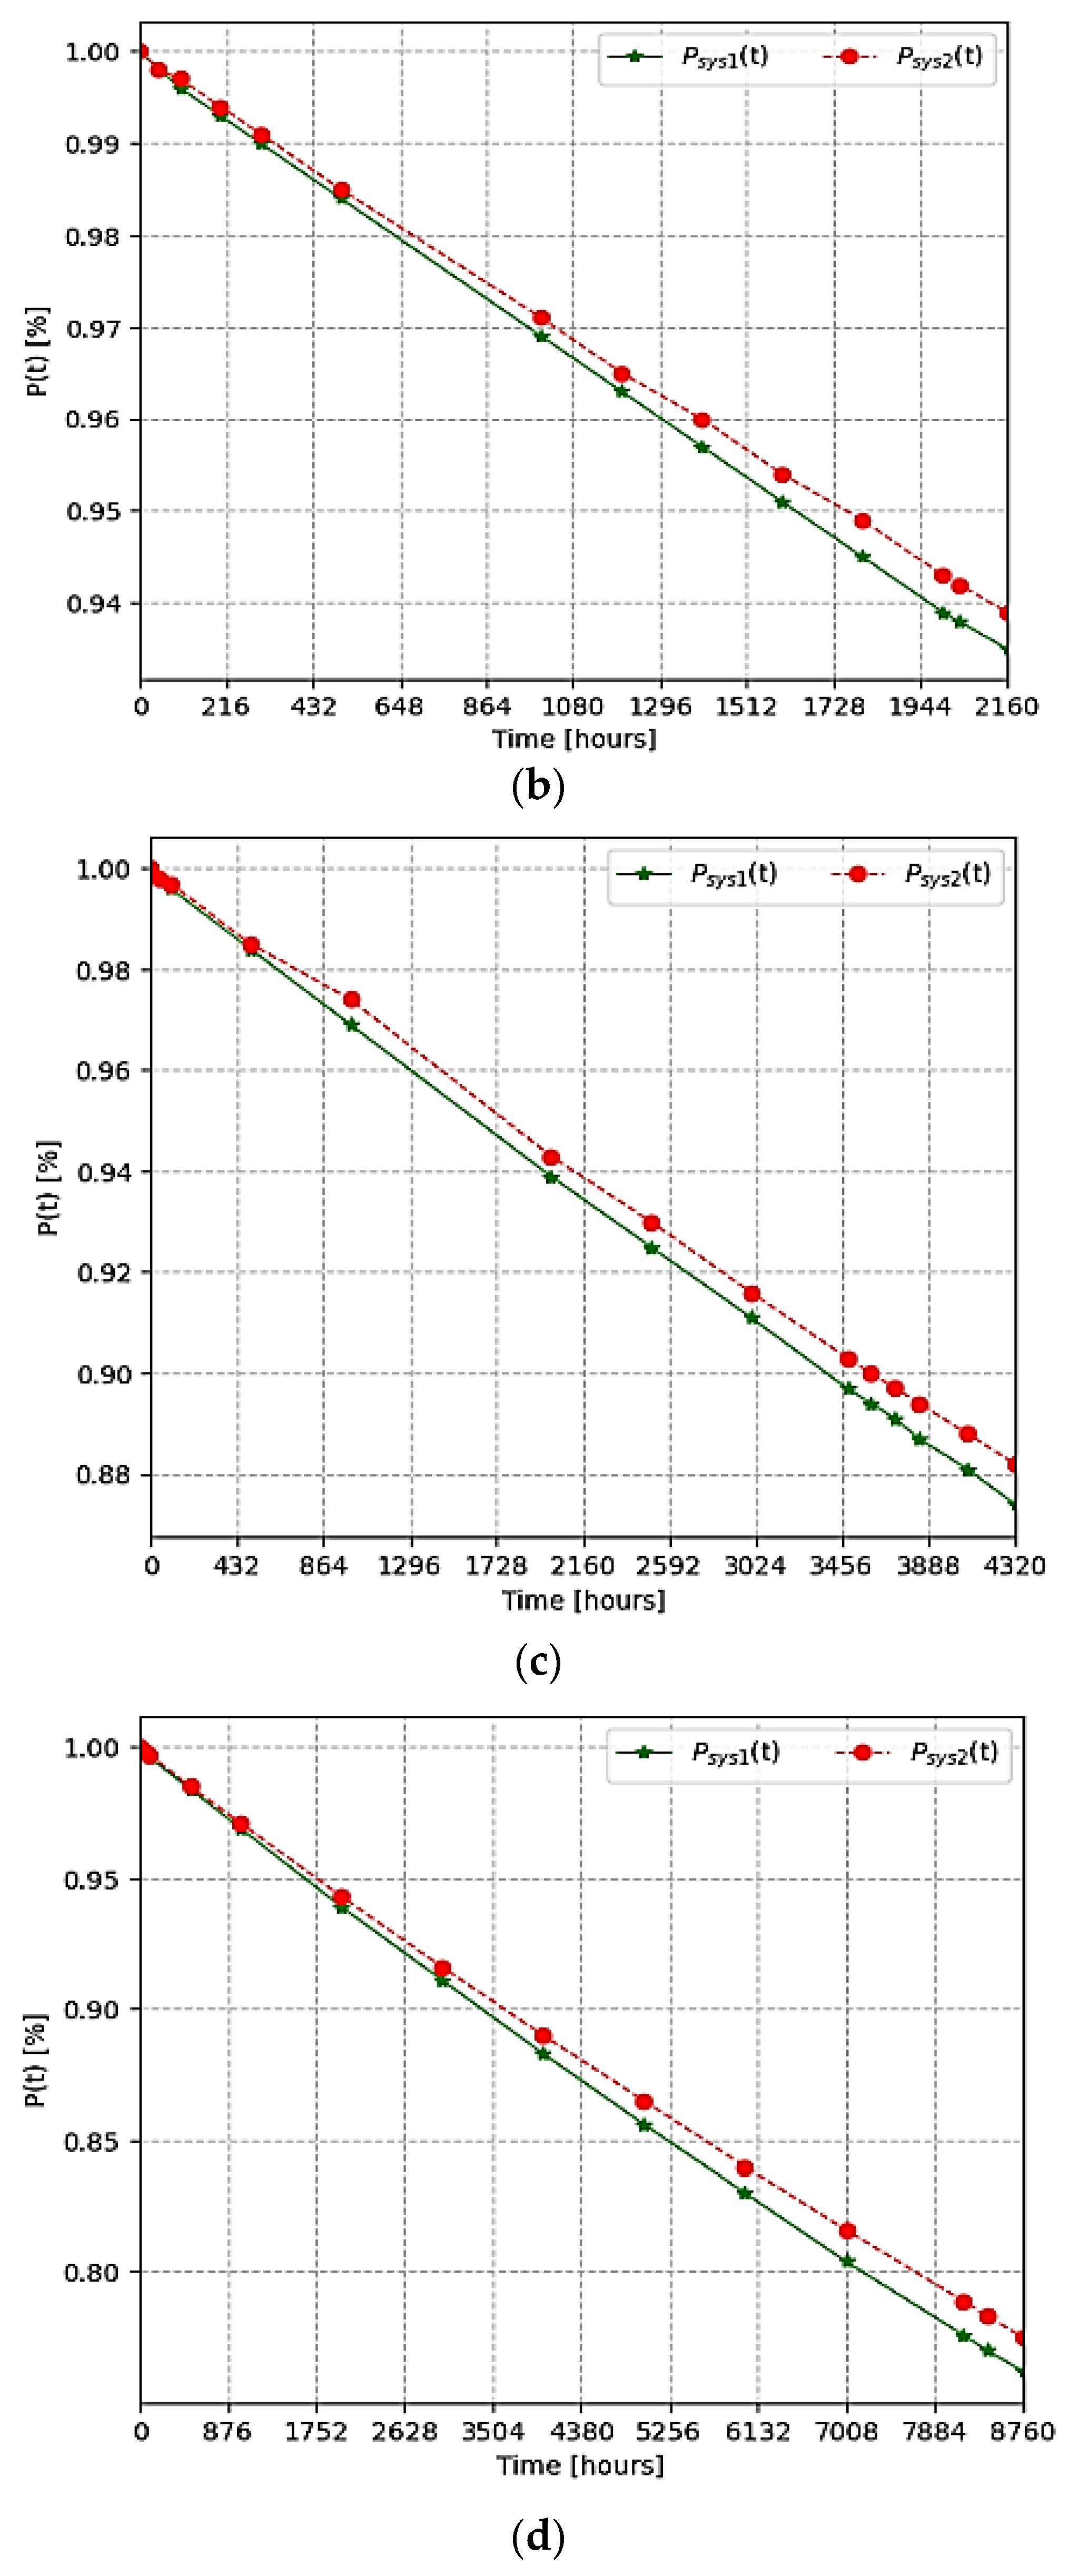
| Reliability Indicators | Different Times Three Months | |||||||||||||
| 48 | 100 | 200 | 300 | 500 | 1000 | 1200 | 1400 | 1600 | 1800 | 2000 | 2040 | 2160 | ||
| 0.998 | 0.996 | 0.993 | 0.990 | 0.984 | 0.969 | 0.963 | 0.957 | 0.951 | 0.945 | 0.939 | 0.938 | 0.935 | ||
| 0.998 | 0.997 | 0.994 | 0.991 | 0.985 | 0.971 | 0.965 | 0.960 | 0.954 | 0.949 | 0.943 | 0.942 | 0.939 | ||
| Reliability indicators | Different Times During Six Months | |||||||||||||
| 48 | 100 | 500 | 1000 | 2000 | 2500 | 3000 | 3480 | 3600 | 3720 | 3840 | 4080 | 4320 | ||
| 0.998 | 0.996 | 0.984 | 0.969 | 0.939 | 0.925 | 0.911 | 0.897 | 0.894 | 0.891 | 0.887 | 0.881 | 0.874 | ||
| 0.998 | 0.997 | 0.985 | 0.974 | 0.943 | 0.930 | 0.916 | 0.903 | 0.900 | 0.897 | 0.894 | 0.888 | 0.882 | ||
| Reliability indicators | Different Times During One Year | |||||||||||||
| 48 | 100 | 500 | 1000 | 2000 | 3000 | 4000 | 5000 | 6000 | 7000 | 8160 | 8400 | 8760 | ||
| 0.998 | 0.996 | 0.984 | 0.969 | 0.939 | 0.911 | 0.883 | 0.856 | 0.830 | 0.804 | 0.776 | 0.770 | 0.762 | ||
| 0.998 | 0.997 | 0.985 | 0.971 | 0.943 | 0.916 | 0.890 | 0.865 | 0.840 | 0.816 | 0.789 | 0.783 | 0.775 | ||
| № | Researched Methods | Field of Application | Measurement Accuracy | Energy Efficiency | Reliability Indicators |
|---|---|---|---|---|---|
| Method 1 | expert assessment based on analytical data | monitoring system of heavy engineering | 0.95 | 0.87 | 0.89 |
| Method 2 | fusion method of three-state reliability evaluation | restorable monitoring system | 0.96 | 0.88 | 0.97 |
| Method 3 | automatic generation of a fault tree evaluation method | automated industrial applications | 0.91 | 0.9 | 0.91 |
| Method 4 | proposal method | remote monitoring system of low voltage overhead power line | 0.97 | 0.95 | 0.98 |
Disclaimer/Publisher’s Note: The statements, opinions and data contained in all publications are solely those of the individual author(s) and contributor(s) and not of MDPI and/or the editor(s). MDPI and/or the editor(s) disclaim responsibility for any injury to people or property resulting from any ideas, methods, instructions or products referred to in the content. |
© 2024 by the authors. Licensee MDPI, Basel, Switzerland. This article is an open access article distributed under the terms and conditions of the Creative Commons Attribution (CC BY) license (https://creativecommons.org/licenses/by/4.0/).
Share and Cite
Khujamatov, H.; Davronbekov, D.; Khayrullaev, A.; Abdullaev, M.; Mukhiddinov, M.; Cho, J. ERIRMS Evaluation of the Reliability of IoT-Aided Remote Monitoring Systems of Low-Voltage Overhead Transmission Lines. Sensors 2024, 24, 5970. https://doi.org/10.3390/s24185970
Khujamatov H, Davronbekov D, Khayrullaev A, Abdullaev M, Mukhiddinov M, Cho J. ERIRMS Evaluation of the Reliability of IoT-Aided Remote Monitoring Systems of Low-Voltage Overhead Transmission Lines. Sensors. 2024; 24(18):5970. https://doi.org/10.3390/s24185970
Chicago/Turabian StyleKhujamatov, Halimjon, Dilmurod Davronbekov, Alisher Khayrullaev, Mirjamol Abdullaev, Mukhriddin Mukhiddinov, and Jinsoo Cho. 2024. "ERIRMS Evaluation of the Reliability of IoT-Aided Remote Monitoring Systems of Low-Voltage Overhead Transmission Lines" Sensors 24, no. 18: 5970. https://doi.org/10.3390/s24185970
APA StyleKhujamatov, H., Davronbekov, D., Khayrullaev, A., Abdullaev, M., Mukhiddinov, M., & Cho, J. (2024). ERIRMS Evaluation of the Reliability of IoT-Aided Remote Monitoring Systems of Low-Voltage Overhead Transmission Lines. Sensors, 24(18), 5970. https://doi.org/10.3390/s24185970