

Machine Learning for Multimodal Mental Health Detection: A Systematic Review of Passive Sensing Approaches


Abstract
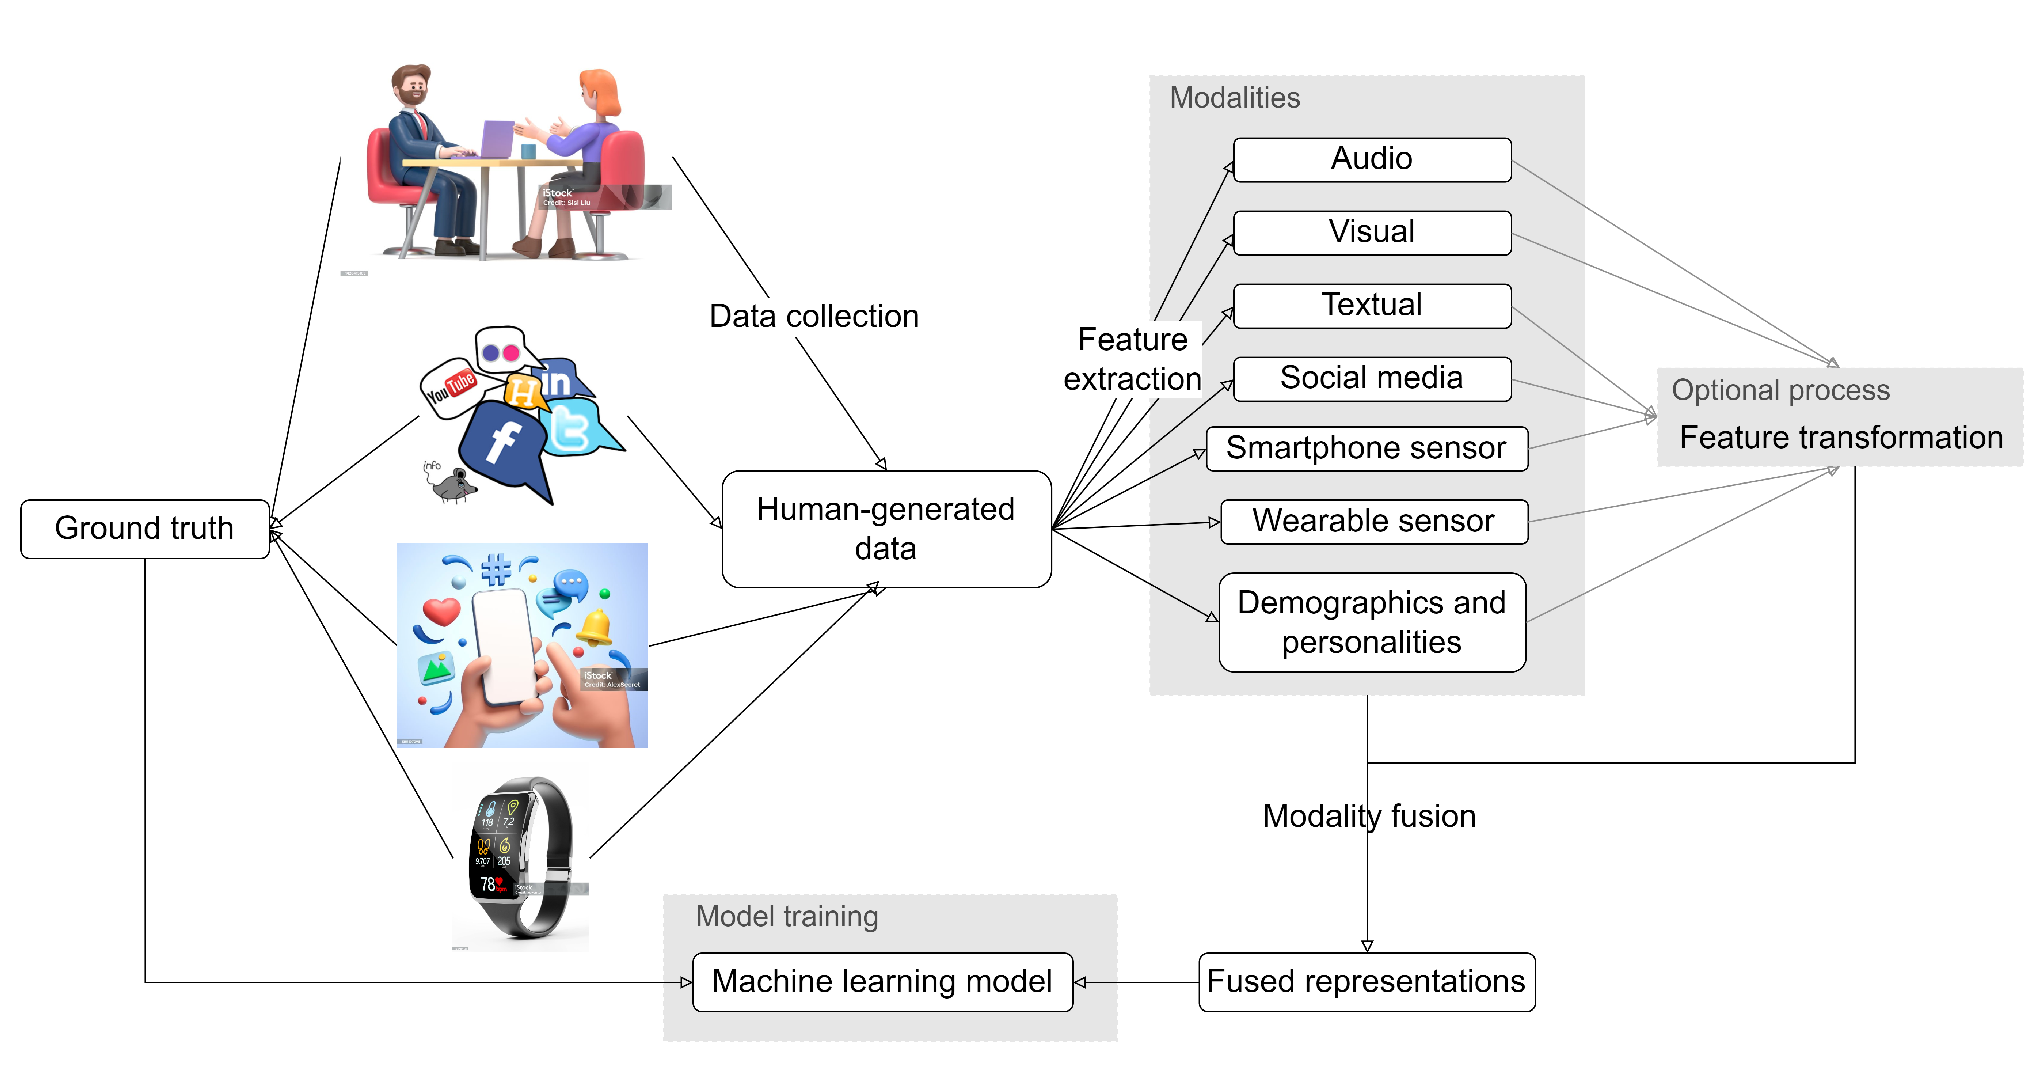
1. Introduction
- RQ1—Which sources of passive sensing data are most effective for supporting the detection of MH disorders?
- RQ2—Which data fusion approaches are most effective for combining data features of varying modalities to prepare for training ML models to detect MH disorders?
- RQ3—What ML approaches have previous researchers used to successfully detect MH disorders from multimodal data?
2. Materials and Methods
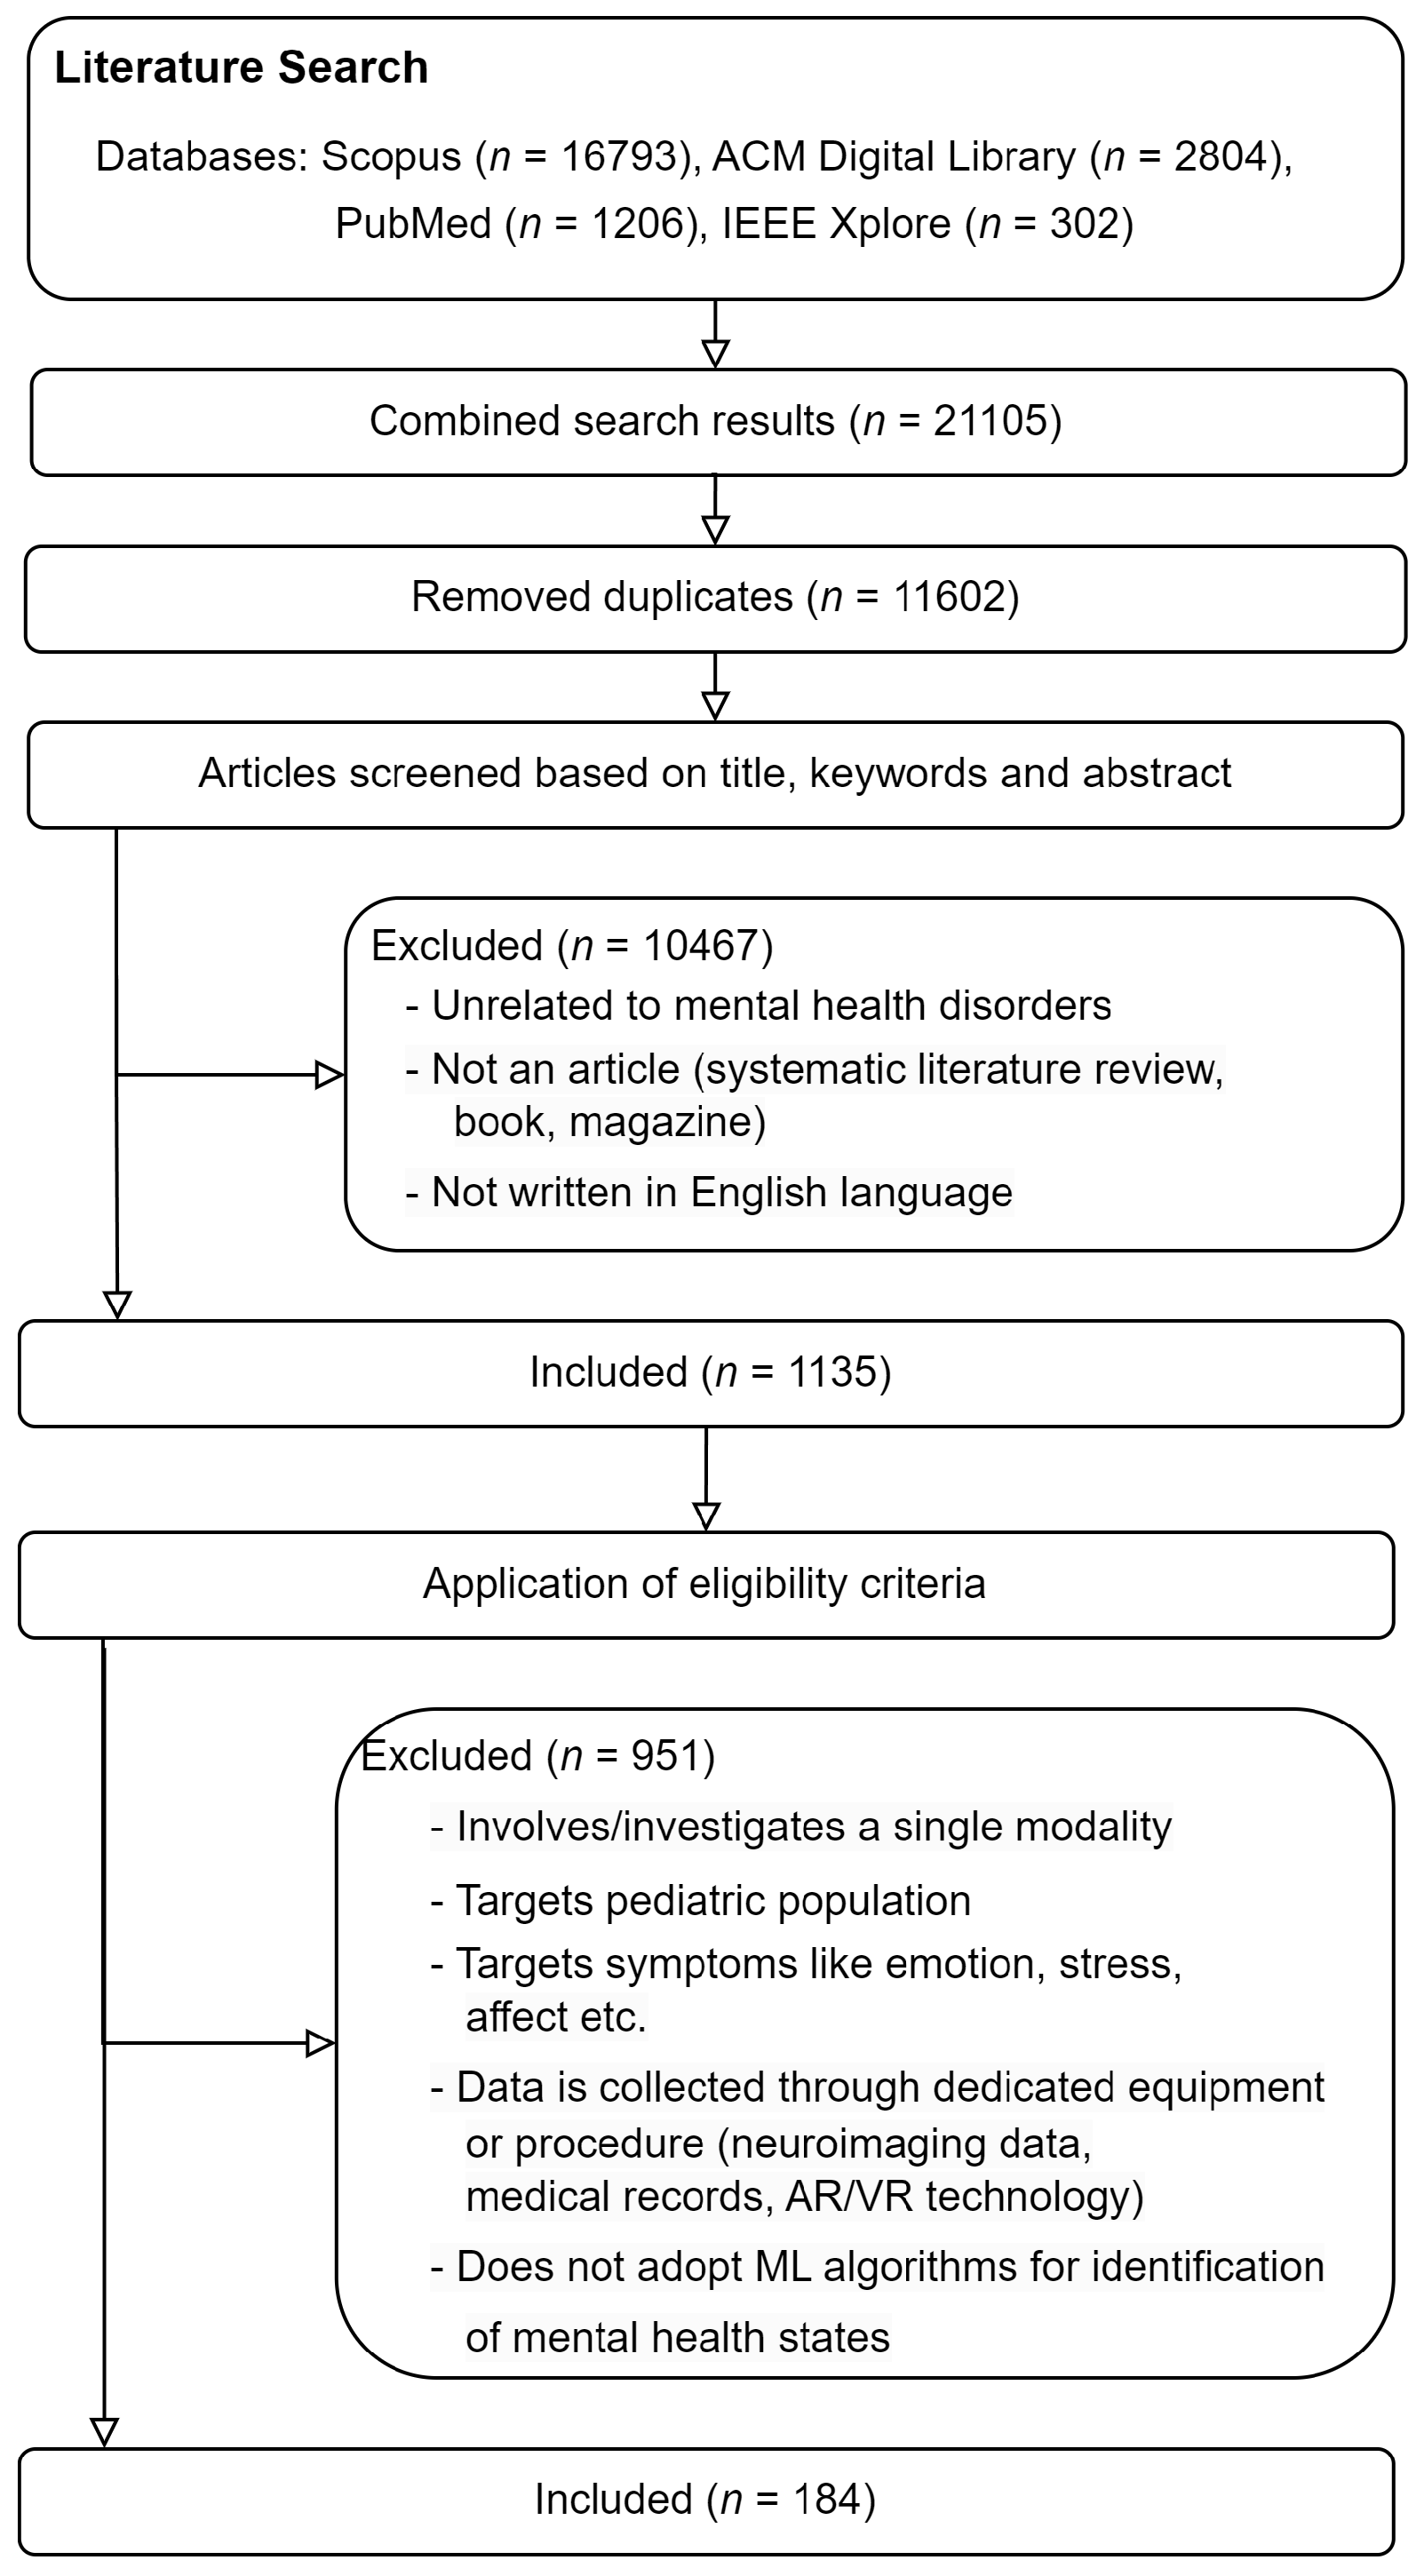
2.1. Search Strategy
2.2. Inclusion and Exclusion Criteria
- The study collects data passively via ubiquitous or wearable devices, considering the cost-effectiveness and general accessibility.
- The data is human generated, i.e., derived from individuals’ actions in an environment or interactions with specific platforms or devices.
- The data source involves at least two different modalities.
- The study adopts ML algorithms intending to detect one or more MH disorders.
- The study is written in English.
- The study was published from the year 2015 onwards (further details in the following section).
- The study investigates data sources of a single modality or exclusively focuses on a specific modality, e.g., text-based approaches.
- The study specifically targets the pediatric population, i.e., toddlers and children below ten years old, as defined within the suggested adolescent age range of 10–24 years [39].
- The study targets a particular symptom of specific MH disorders, e.g., low mood, which is a common sign of depression.
- Data collection requires dedicated equipment or authorized resources:
- -
- Brain neuroimaging data, e.g., functional magnetic resonance imaging (fMRI), structural MRI (sMRI), electroencephalogram (EEG), electromyography (EMG), and photoplethysmography (PPG) signals
- -
- Clinical data, e.g., electronic health records (EHRs) and clinical notes
- -
- Genomic data
- -
- Body motions collected using specialized motion capture platforms or motor sensors
- -
- Makes use of Augmented Augmented Reality (AR) or Virtual Reality (VR) technology
- The study does not employ ML algorithms for detection/prediction, e.g., focusing on correlation/association analysis, treatment/intervention strategies, or proposing study protocols.
- The study is a survey, book, conference proceeding, workshop, or magazine
- The study is unpublished or non-peer-reviewed.
2.3. Selection Process
2.4. Data Extraction
2.5. Quality Assessment
3. Results

3.1. Data Source
3.1.1. Audio and Video Recordings
3.1.2. Social Media
3.1.3. Smartphones
3.1.4. Wearable Devices
3.2. Data Ground Truth
3.2.1. Clinical Assessments
3.2.2. Self-Reports
3.3. Modality and Features
3.3.1. Audio
3.3.2. Visual
3.3.3. Textual
3.3.4. Social Media
3.3.5. Smartphone and Wearable Sensors
- (1)
- Physical Mobility Features: Studies have shown that negative MH states and greater depression severity are associated with lower levels of physical activity, demonstrated via fewer footsteps, less exercising [154], being stationary for a greater proportion of time [205], and less motion variability [149], whereas a study on the student population showed an opposite trend for increased physical activity [157]. Movements across locations in terms of distance, location variability, significant locations (deduced through location clusters) [177], and time spent in these places [164] were also valuable. For instance, researchers found greater depression severity or negative MH states associated with less distance variance, less normalized location entropy [154,158], lower number of significant visited places with increased average length of stay [158], and fewer visits to new places [205]. In contrast, Kim et al.’s [162] investigation on adolescents with major depressive disorders (MDD) found that they traveled longer distances than healthy controls. Timing and location semantics could further contribute more detailed insights, such as the discoveries of individuals with negative MH states staying stationary more in the morning but less in the evening [205], those with more severe depression spending more time at home [154,175], and schizophrenia patients visiting more places in the morning [206]. Researchers also acquired sleep information either through inferences from a combination of sensor information relating to physical movement, environment, and phone-locked states or through the APIs of sleep inferences in wearable devices. Sleep patterns and regularity were demonstrated to correlate with depressive symptoms [150,158] where individuals with positive MH states wake up earlier [205], whereas MDD patients showed more irregular sleep (inferred from sleep regularity index) [149].
- (2)
- Phone Interaction Features: Phone usage (i.e., inferred from the frequency and duration of screen unlocks) and application usage were potentially helpful. For instance, several studies [158] found a high frequency of screen unlocks and low average unlock duration for each unlock as potential depressive symptoms. However, while Wang et al. [205] demonstrated the association between negative MH states and lower phone usage, the opposite trend was observed in students and adolescents with depressive symptoms who used smartphones longer [150,162,164]. Researchers also investigated more fine-grained features, such as phone usage at different times of the day, where they found schizophrenic patients exhibiting less phone usage at night but more in the afternoon [206]. Additionally, individuals with MH disorders also showed distinctive application engagement, such as Opoku Asare et al.’s [166] findings that individuals with depressive symptoms used social applications more frequently and for a longer duration. Generally, they also showed more active application engagement in the early hours or midnight compared to healthy controls, who showed diluted engagement patterns throughout the day. Meanwhile, Choudhary et al. [212] revealed that individuals with anxiety exhibited more frequent usage of applications from “passive information consumption apps”, “games”, and “health and fitness” categories.
- (3)
- Sociability Features: Sociability features, such as the number of incoming/outgoing phone calls and text messages and the duration of phone calls, were also potential indicators of MH disorders [164,175]. For instance, negative MH states are associated with making more phone calls and text messaging [205,222] and reaching out to more new contacts [222]. On the other hand, adult and adolescent populations suffering from MDD were revealed to receive fewer incoming messages [149] and more phone calls [162], respectively. Lastly, ambient environments could also play a role since individuals with schizophrenia were found to be around louder acoustic environments with human voices [206], whereas those with negative MH states demonstrated a higher tendency to be around fewer conversations [205] than healthy controls.
3.3.6. Demographics and Personalities
3.4. Modality Fusion
3.4.1. Feature Transformation to Prepare for Fusion
3.4.2. Multimodal Fusion Techniques
3.5. Machine Learning Models
- Supervised learning—trained on labeled input–output pairs to learn patterns for mapping unseen inputs to outputs.
- Ensemble learning—combines multiple base learners of any kind (e.g., linear, tree-based or NN models) to obtain better predictive performance, assuming that errors of a single base learner will be compensated by the others [292].
- Multi-task learning—attempts to solve multiple tasks simultaneously by taking advantage of the similarities between tasks [289].
- Others—incorporates semi-supervised, unsupervised, or combination of approaches from various categories.
3.5.1. Supervised Learning
3.5.2. Neural-Network-Based Supervised Learning
3.5.3. Ensemble Learning
3.5.4. Multi-Task Learning (MTL)
3.5.5. Others
3.6. Additional Findings
3.6.1. Modality and Feature Comparisons
3.6.2. Personalized Machine Learning Models
4. Discussion
4.1. Principal Findings
4.1.1. RQ1—Which Sources of Data Are Most Effective for Supporting the Detection of MH Disorders?
4.1.2. RQ2—Which Data Fusion Approaches Are Most Effective for Combining Data Features of Varying Modalities to Prepare for Training ML Models to Detect MH Disorders?
4.1.3. RQ3—What ML Approaches Have Previous Researchers Used to Successfully Detect MH Disorders from Multimodal Data?
4.2. Evaluation of Data Sources
4.2.1. Criterion 1—Reliability of Data
4.2.2. Criterion 2—Validity of Ground Truth Acquisition
4.2.3. Criterion 3—Cost
4.2.4. Criterion 4—General Acceptance
4.2.5. Overall Findings
4.3. Guidelines for Data Source Selection
- Define research objectives and scope: Clearly defined research objectives and questions can guide researchers to determine the kind of information required to achieve the research goals and, subsequently, to evaluate the extent of the data source in accurately representing or capturing relevant information. Determining the scope of the study is crucial to pinpoint and assess the relevance of data information to ensure that collected data effectively contributes to the desired outcomes.
- Determine the target population: Identifying the target population and its characteristics involves various aspects, including the targeted MH disorders, demographics, cultural backgrounds, and geographical distribution. These aspects are mutually influential since individuals’ behaviors and data may vary based on reactions to different MH disorders, with further influence caused by cultural backgrounds and demographics, such as age, gender, and occupation. Additionally, geographical distribution and economic backgrounds may influence an individual’s accessibility to a specific data collection tool. This consideration ensures that the data collected is representative and applicable to the population of interest, enhancing the overall effectiveness of the approach.
- Identify candidate data sources and evaluate their feasibility: Evaluating the feasibility of each data source in light of the research objectives and target population identified above assists researchers in making informed decisions. Given the contexts and environments in which the target population is situated, researchers can assess which data source is the most practical and relevant. For example, researchers may consider employing remote sensing to introduce the unobtrusiveness of data collection for high-risk MH disorders or overcome geographical challenges. This assessment should consider its feasibility in terms of cost and accessibility, and it should be informed by Figure 5 to ensure that the selected data source can effectively capture relevant MH symptoms.
- Consult stakeholders: Engaging stakeholders, including healthcare professionals, patients, and families, provides various perspectives of parties involved in supporting individuals with MH disorders. These consultations verify and offer insights into the acceptability and feasibility of data sources and help ensure that researchers’ decisions align with ethical considerations and stakeholders’ comfort.
- Ethical considerations and guidelines: Researchers should further consult institutional review boards and established guidelines to ensure the compliance of data collection procedures with ethical standards and research practices. This step is crucial to safeguard participants’ rights and privacy, enhancing the credibility of the study.
- Assess the significance of ground truth information: Evaluating the significance of ground truth information informs how researchers gauge its impact on the study and whether specific workarounds are necessary to enhance ground truth reliability and validity during data collection. This evaluation will then aid researchers in designing the data collection procedure and determining the extent of reliance on ground truth to support future analysis, reasoning, and deductions.
5. Conclusions
Author Contributions
Funding
Institutional Review Board Statement
Informed Consent Statement
Data Availability Statement
Acknowledgments
Conflicts of Interest
Abbreviations
| AdaBoost | Adaptive Boosting |
| ADHD | Attention Deficit Hyperactivity Disorder |
| BDI | Beck Depression Inventory |
| CES-D | Center for Epidemiological Studies Depression Scale |
| CNN | Convolutional neural network |
| DNN | Deep neural network |
| DSM-V | Diagnostic and Statistical Manual of Mental Disorders, Fifth Edition |
| ED | Eating disorder |
| GAD-7 | General Anxiety Disorder-7 |
| GPS | Global Positioning System |
| GRU | Gated recurrent unit |
| HDRS | Hamilton Depression Rating Scale |
| LSTM | Long short-term memory |
| MDD | Major depressive disorder |
| MFCC | Mel frequency cepstral coefficients |
| MH | Mental health |
| ML | Machine learning |
| MLP | Multi-layer perceptron |
| MRI | Magnetic Resonance Imaging |
| MTL | Multi-task learning |
| NN | Neural network |
| OCD | Obsessive-compulsive disorder |
| PHQ-9 | Patient Health Questionnaire-9 |
| PTSD | Post-traumatic stress disorder |
| RF | Random forest |
| SLR | Systematic literature review |
| SVM | Support vector machine |
| XGBoost | Xtreme Gradient Boosting |
Appendix A. Existing Modality Features
| Features | Tools | Studies | Feature Category |
|---|---|---|---|
| Low-level descriptors: jitter, shimmer, amplitude, pitch perturbation quotients, Mel-frequency cepstral coefficients (MFCCs), Teager-energy cepstrum coefficients (TECCs) [320], Discrete Cosine Transform (DCT) coefficients | OpenSmile [267], COVAREP [321], YAAFE [322], Praat [323], Python libraries (pyAudioAnalysis [324], DisVoice [325]), My-Voice Analysis [326], Surfboard [327], librosa [328] | [12,48,51,72,74,78,81,87,88,90,91,92,94,97,99,101,104,107,108,184,192,195,196,197,198,199,211,214] | Voice |
| Existing acoustic feature sets: Interspeech 2010 Paralinguistics [329], Interspeech 2013 ComParE [330], extended Geneva Minimalistic Acoustic Parameter Set (eGeMAPS) [331]) | OpenSmile [267] | [51,57,59,61,63,74,81,97,103,192,194,195,196,197,198] | Voice |
| Speech, pause, laughter, utterances, articulation, phonation, intent expressivity | Praat [323], DeepSpeech [332] | [12,48,79,107,184,193,203,211] | Speech |
| Vocal tract physiology features | N/A | [49] | Speech |
| Embeddings of audio samples | VGG-16 [261], VGGish [333], DeepSpeech [332], DenseNet [334], SoundNet [259], SincNet [335], Wav2Vec [336], sentence embedding model [337], HuBERT [338], convolutional neural network (CNN), bidirectional LSTM (BiLSTM), ResNet [308], graph temporal convolution neural network (GTCN) [339] | [59,60,67,72,74,80,86,89,93,96,100,136,174,195] | Representations |
| Graph features: average degree, clustering coefficient and shortest path, density, transitivity, diameter, local and global efficiency | Visibility graph (two data points visible to each other are connected with an edge) | [81] | Representations |
| Statistical descriptors of voice/speech features: mean, standard deviation, variance, extreme values, kurtosis, 1st and 99th percentiles, skewness, quartiles, interquartile range, range, total, duration rate, occurrences, coefficient of variation (CV) | Manual computation, histograms, DeepSpeech [332] | [12,55,56,91,92,99,107,193,197,214] | Derived |
| Bag-of-AudioWords (BoAW) representations of voice/speech features | openXBOW [340] | [59,74] | Representations, Derived |
| High-level representations of features/representations (capture spatial and temporal information) | Gated recurrent unit (GRU) [341], LSTM, BiLSTM, combination of CNN residual and LSTM-based encoder–decoder networks [75], time-distributed CNN (T-CNN), multi-scale temporal dilated convolution (MS-TDConv) blocks, denoising autoencoder | [61,65,67,73,75,77,87,94,100,199] | Representations, Derived |
| Session-level representations from segment-level features/representations | Simple concatenation, Fisher vector encoding, Gaussian Mixture Model (GMM) | [192,199,214] | Representations, Derived |
| Facial/body appearance, landmarks, eye gaze, head pose | OpenFace [269], OpenCV [270], Viola Jones’ face detector [342], CascadeObjectDetector function in MATLAB’s vision toolbox, Haar classifier [270], Gauss–Newton Deformable Part Model (GN-DPM) [343], OpenPose [271], ZFace [344], CNN [46], Faster-RCNN (Region CNN) [147], multilevel convolutional coarse-to-fine network cascade [345], Inception-ResNet-V2 [346], VGG-Face [68], DenseNet [334], Affectiva https://go.affectiva.com/affdex-for-market-research (accessed on 10 December 2023), DBFace https://github.com/dlunion/DBFace (accessed on 10 December 2023), FaceMesh https://developers.google.com/android/reference/com/google/mlkit/vision/facemesh/FaceMesh (accessed on 10 December 2023), dlib [347] | [25,53,55,56,68,79,80,83,91,92,94,98,99,101,108,174,193,199,201,203,220] | Subject/Object |
| Appearance coefficients of facial image and shape | Active Orientation Model (AOM) [348] | [50] | Subject/Object |
| Probability distribution of 365 common scenes | Places365-CNN [349] | [220] | Subject/Object |
| Features | Tools | Studies | Feature Category |
|---|---|---|---|
| Feature descriptors: local binary patterns, Edge Orientation Histogram, Local Phase Quantization, Histogram of Oriented Gradients (HOG) | OpenFace [269] | [47,48,53,195] | Subject/Object, Derived |
| Geometric features: displacement, mean shape of chosen points, difference between coordinates of specific landmarks, Euclidean distance, angle between landmarks, angular orientation | Manual computation, subject-specific active appearance model (AMM), AFAR toolbox [350] | [47,51,54,56,70,79,83,91,99,195,198,203] | Subject/Object, Derived |
| Motion features: movement across video frames, range and speed of displacements (facial landmarks, eye gaze direction, eye open and close, head pose, upper body points) | 3D convolutional layers on persons detected at frame-level, Motion history histogram (MHH) [351], feature dynamic history histogram (FDHH), residual network-based dynamic feature descriptor [75] | [52,53,68,75,147,193] | Subject/Object, Derived |
| Facial action units (FAUs), facial expressions | OpenFace [269], Face++ [352], FACET software [353], AU detection module of AFAR [350] | [25,79,91,99,194,196,198] | Subject/Object, Emotion-related |
| FAU features: occurrences, intensities, facial expressivity, peak expressivity, behavioral entropy | MHH, Modulation spectrum (MS), Fast Fourier transform (FFT) | [83,99,101,107,194,354] | Emotion-related, Derived |
| Emotion profiles (EPs) | SVM-based EP detector [355] | [101] | Emotion-related |
| Sentiment score | ResNeXt [356] | [186] | Emotion-related |
| Turbulence features capturing sudden erratic changes in behaviors | N/A | [192] | Derived |
| Deep visual representations from images or video frames | VGG-16 [261], VGG-Face [357], VGGNet [261], AlexNet [358], ResNet [308] ResNet-50 [359], ResNeXt [356], EfficientNet [360], InceptionResNetV2 [346], CNN, dense201 [195], self-supervised DINO (self-distillation with no labels) [361], GTCN [339], unsupervised Convolutional Auto-Encoder (CAE) (replaces autoencoder’s fully connected layer with CNN) [195] | [53,58,60,74,82,84,85,89,93,95,98,106,111,115,116,117,122,125,126,129,131,132,135,160,187,195,201,220] | Representations |
| High-level (frame-level) representations of low-level features (LLDs, facial landmarks, FAUs) | Stacked Denoising Autoencoders (SDAE) [306], DenseXception block-based CNN [221] (replace DenseNet’s convolution layer with Xception layer), CNN-LSTM, denoising autoencoder, LSTM-based multitask learning modality encoder [62], 3D convolutional layers, LSTM | [55,62,87,98,199,221] | Representations, Derived |
| Session-level representations from frame-level features/representations | Average of frame-level representations, Fisher vector (FV) encoding, improved FV coding [265], GMM, Temporal Attentive Pooling (TAP) [75] | [55,75,117,199] | Representations, Derived |
| Texts extracted from images | python-tesseract [362] | [25,126,128,140] | Textual |
| Image labels/tags | Deep CNN-based multi-label classifier [113], Contrastive Language Image Pre-training (CLIP) [363], Imagga [364] (CNN-based automatic tagging system) | [113,124,128,129] | Textual |
| Bag-of-Words (BoVW) features | Multi-scale Dense SIFT features (MSDF) [365] | [124,195] | Textual, Derived |
| Color distribution-cool, clear, and dominant colors, pixel intensities | Probabilistic Latent Semantic Analysis model [366] (assigns a color to each image pixel), cold color range [367], RGB histogram | [20,140,145,204,220] | Color-related |
| Brightness, saturation, hue, value, sharpness, contrast, correlation, energy, homogeneity | HSV (Hue, Saturation, color) [368] color model | [20,106,109,113,145,204,220] | Color-related |
| Statistical descriptors for each HSV distribution: quantiles, mean, variance, skewness, kurtosis | N/A | [145,204] | Color-related, Derived |
| Pleasure, arousal, and dominance | Compute from brightness and saturation values [276] | [220] | Emotion-related, Derived |
| Number of pixels, width, height, if image is modified (indicated via exif file) | N/A | [204] | Image metadata |
| Features | Tools | Studies | Feature Category |
|---|---|---|---|
| Count of words: general, condition-specific (depressed, suicidal, eating disorder-related) keywords, emojis | N/A | [20,104,109,123,126,127,130,133,134,137,145,146,187,188,218,219] | Linguistic |
| Words referring to social processes (e.g., reference to family, friends, social affiliation), and psychological states (e.g., negative/positive emotions) | Linguistic Inquiry and Word Count (LIWC) [278], LIWC 2007 Spanish dictionary [369], Chinese Suicide Dictionary [370], Chinese LIWC [371], TextMind [372], Suite of Automatic Linguistic Analysis Tools (SALAT) [279]—Simple Natural Language Processing (SiNLP) [373] | [20,79,109,118,121,128,186,194,196,197,198,204,211,219,374] | Linguistic |
| Part-of-speech (POS) tags: adjectives, nouns, pronouns | Jieba [375], Natural Language Toolkit (NLTK) [280], TextBlob [376], spaCy, Penn Treebank [377], Empath [378] | [61,100,104,123,126,135,184,185,189,195,218,219] | Linguistic |
| Word count-related representations: Term Frequency–Inverse Document Frequency (TF-IDF), Bag of Words (BoW), n-grams, Term Frequency–Category Ratio (TF-CR) [379] | Word2Vec embeddings, language models | [115,116,118,124,128,130,140,143,144,148,185,186,188,198,217,374] | Linguistic, Representations |
| Readability metrics: Automated Readability Index (ARI), Simple Measure of Gobbledygook (SMOG), Coleman–Liau Index (CLI), Flesch reading ease, Gunning fog index, syllable count scores | Textstat [380] | [218,220] | Linguistic |
| Lexicon-based representations [381] | Depression domain lexicon [382], Chinese suicide dictionary [370] | [120,135,189] | Representations |
| Sentiment scores, valence, arousal, and dominance (VAD) ratings | NLTK [280], IBM Watson Tone Analyzer, Azure Text Analytics, Google NLP, NRC emotion lexicon [383], senti-py [384], Stanford NLP toolkit [281], Sentiment Analysis and Cognition Engine (SEANCE) [282], text SA API of Baidu Intelligent Cloud Platform [123], Valence Aware Dictionary and Sentiment Reasoner (VADER) [385], Chinese emotion lexicons DUTIR [386], Affective Norms for English Words ratings (ANEW) [283], EmoLex [387], SenticNet [388], Lasswell [389], AFINN SA tool [390], LabMT [391], text2emotion [392], BERT [266] | [20,54,61,86,110,115,118,119,121,123,126,127,128,130,132,133,137,143,144,145,146,148,184,185,186,188,194,196,197,198,218,219,374] | Sentiment-related |
| Happiness scores of emojis | Emoji sentiment scale [393] | [110] | Sentiment-related |
| Emotion transitions from love to joy, from love to anxiety/sorrow (inspired by [394]) | Chinese emotion lexicons DUTIR [386] | [187] | Sentiment-related |
| Word representations | Global vectors for word representation (GloVe) [395], Word2Vec [396], FastText [397], Embeddings from Language Models (ELMo) [398], BERT [266], ALBERT [297], XLNet [285], bidirectional gated recurrent unit (BiGRU) [341], itwiki (Italian Wikipedia2Vec model), Spanish model [399], EmoBERTa [298] (incorporate linguistic and emotional information), MiniLM [400] (supports multiple languages), GPT [401], TextCNN [402], Bi-LSTM [294] | [49,60,65,67,69,72,73,77,78,81,82,87,88,90,95,96,97,98,100,106,111,112,113,116,122,125,128,129,131,135,136,138,142,145,147,148,185,186,187,201,214,218,308] | Semantic-related, Representations |
| Sentence representations | Paragraph Vector (PV) [284], Universal Sentence Encoder [403], Sentence-BERT [404] | [52,59,70,71,89,102,103,174,199] | Semantic-related, Representations |
| Topic modeling, topic-level features | Scikit-learn’s Latent Dirichlet Allocation module [405], Biterm Topic Model [406] | [20,43,114,118,119,126,130,134,136,137,146,185,188,194,217,219] | Semantic-related |
| Description categories | IBM Watson’s Natural Language Understanding tool (https://cloud.ibm.com/apidocs/natural-language-understanding#text-analytics-features (accessed on 10 December 2023)) | [132] | Semantic-related |
| High-level representations from low-level features/representations (e.g., sentence-level from word-level, to capture sequential and/or significant information) | BiLSTM with an attention layer, stacked CNN and BiGRU with attention, summarization [119] using K-means clustering and BART [407], combination of LSTM with attention mechanism and CNN, BiGRU with attention | [73,95,97,119,136,145,159,201] | Representations, Derived |
| User-level representations from post-level representations | CNN-based triplet network [408] from existing Siamese network [409] (consider cosine similarities between post-level representations between each individual and others in the same and different target groups), LSTM with attention mechanism | [128,138] | Representations, Derived |
| Session-level representations from segment-level representations | Fisher vector encoding | [199] | Representations, Derived |
| Subject-level average, median, standard deviation of sentiment scores, representations, POS counts | N/A | [110,185,186] | Derived |
| Subject-level representations in conversation | Graph attention network—vertex as question/answer pair incorporating LeakyReLU on neighbors with respective attention coefficients, edge between adjacent questions | [97] | Representations, Derived |
| Features | Tools | Studies | Feature Category |
|---|---|---|---|
| Posts distribution (original posts, posts with images, posts of specific emotions/sentiments)-frequency, time | N/A | [109,112,122,123,126,130,134,137,142,145,188,218,219] | Post metadata |
| Username, followers, followings, status/bio description, profile header and background images, location, time zone | N/A | [109,115,118,122,123,126,130,134,137,142,145,171,188,218,219] | User metadata |
| Likes, comments, hashtags, mentions, retweets (Twitter), favourites (Twitter) | N/A | [115,126,135,137,142,171,185,189] | Social interactions, Post metadata |
| Stressful periods with stress level and category (study, work, family, interpersonal relation, romantic relation, or self-cognition) | Algorithm [410] applied on users’ posting behaviors | [187] | Post metadata, Derived |
| Aggregate posting time by 4 seasons, 7 days of the week, 4 epochs of the day (morning, afternoon, evening, midnight), or specific times (daytime, sleep time, weekdays, weekends) | N/A | [125,130,135,186,188,189,219] | Post metadata, Derived |
| Encoding of numerical features | Categorize into quartiles (low, below average, average, high) | [115] | Representations, Derived |
| Social interaction graph-node: user-level representations concatenated from post-level representations, edge: actions of following, mentioning, replying to comments, quoting | node2vec [411], Ego-network [412] | [139,185] | Social interactions |
| Personalized graph-user-level node: user-level representations made up of property nodes, property node (individual), personal information, personality, mental health experience, post behavior, emotion expression and social interactions, user–user edge: mutual following-follower relationship, user-property edge: user’s characteristics | Attention mechanism to weigh property by contribution to individual’s mental health condition (user-property edge) and emotional influence (user–user edge) | [187] | Social interactions |
| Retweet network node: user-level representations, directed edge: tweets of a user is retweeted by the directed user | Clustering-based neighborhood recognition-form communities with densely connected nodes, expand communities using similarity with adjacent nodes | [141] | Representations |
| Features | Tools | Studies | Feature Category |
|---|---|---|---|
| Phone calls and text messages: frequency, duration, entropy | N/A | [104,105,149,155,156,159,161,162,166,169,170,171,175,190,205,206,209,222,223] | Calls and messages |
| Phone unlocks: frequency, duration | Manual computation, RAPIDS [413]-a tool for data pre-processing and biomarker computation | [99,149,150,155,156,158,160,161,162,166,167,171,176,190,205,206,208,212,374,171] | Phone interactions |
| Phone charge duration | N/A | [163] | Phone interactions |
| Running applications: type, frequency, duration of usage | N/A | [99,149,150,155,156,158,160,161,162,166,169,170,171,190,205,206,208,212,374] | Phone interactions |
| Activity states (e.g., walking, stationary, exercising, running, unknown): frequency, duration | Android activity recognition API, activity recognition model (LSTM-RNN [414], SVM), Google Activity Recognition Transition API (using gyroscope and accelerometer) | [150,152,154,160,163,169,170,176,177,190,205,206] | Physical mobility |
| Footsteps | API of mobile devices, Euclidean norm of accelerometer data | [154,169,170] | Physical mobility |
| Distance traveled, displacement from home, location variance and entropy, time spent at specific places, transitions | Manual computation, RAPIDS [413] | [99,150,151,153,154,155,158,160,161,162,165,166,175,176,177,200,205,206,208,209] | Physical mobility |
| Location cluster features: number of clusters, largest cluster as primary location, most and least visited clusters | DBSCAN clustering [415], Adaptive K-means clustering [416] | [150,151,153,154,160,165,176,177,205,208] | Physical mobility |
| Speed | Compute from GPS and/or accelerometer | [153,165,166,209] | Physical mobility |
| Intensity of action | Compute rotational momentum from GPS and gyroscope | [162] | Physical mobility |
| GPS sensor, calls and phone screen unlock features | RAPIDS [413]-a tool for data pre-processing and biomarker computation | [158,164] | Physical mobility, Calls and messages, Phone interactions |
| WiFi association events (when a smartphone is associated or dissociated with a nearby access point at a location’s WiFi network) | N/A | [153] | Connectivity |
| Occurrences of unique Bluetooth addresses, most/least frequently detected devices | N/A | [99,151,155,156,175] | Connectivity |
| Surrounding sound: amplitude, conversations, human/non-human voices | N/A | [150,163,166,205,206,207,208,209] | Ambient environment |
| Surrounding illuminance: amplitude, mean, variance, standard deviation | N/A | [99,163,190,205,208,209] | Ambient environment |
| Silent and noise episodes: count, sum, minimum decibels | Detect via intermittent samples until noise state changes | [166] | Ambient environment |
| Sleep duration, wake and sleep onset | Infer from ambient light, audio amplitude, activity state, and screen on/off | [150,160,161,167,169,170,175,176,206] | Derived, Physical mobility |
| Keystroke features: count, transitions, time between two consecutive keystrokes | N/A | [166,202] | Phone interactions |
| Time between two successive touch interactions (tap, long tap, touch) | N/A | [166] | Phone interactions |
| Day-level features | Statistical functions (mean, median, mode, standard deviation, interquartile range) at the day-level or day of the week (weekdays, weekends) | [151,152,154,156,159,163,164,170,176,206] | Derived |
| Epoch-level features | Statistical functions at partitions of a day-morning, afternoon, evening, night | [149,151,152,156,159,163,166,176,206] | Derived |
| Hour-level features | Statistical functions at each hour of the day | [208,209] | Derived |
| Week-level features | Statistical functions at the week-level, distance from weekly mean | [162,164] | Derived |
| Rhythm-related features: ultradian, circadian, and infradian rhythms, regularity index [417], periodicity based on time windows | Manual computation, Cosinor [418]-a rhythmic regression function | [151,152,153,155,157,158,176,207] | Derived |
| Degrees of complexity and irregularity | Shannon entropy of sensor features | [166] | Derived |
| Statistical, temporal and spectral time series features | Time Series Feature Extraction Library (TSFEL) [419] | [104,105] | Derived |
| High-level cluster-based features: cluster labels, likelihood scores, distance scores, transitions | Gaussian mixture model (GMM) [420], partition around methods (PAM) clustering model [421] | [208,209] | Derived |
| Network of social interactions and personal characteristics: node type corresponds to a modality/category (e.g., individual, personality traits, social status, physical health, well-being, mental health status) | Heterogeneous Information Network (HIN) [422] | [173] | Representations |
| Representations capturing important patterns across timestamps | Transformer encoder [295] | [179] | Representations |
| Features | Tools | Studies | Feature Category |
|---|---|---|---|
| Duration and onset of sleep status (asleep, restless, awake, unknown), sleep efficiency, sleep debt | API of wristband | [149,151,155,156,164,171,180,181,182,191,374] | Physical mobility |
| Number of steps, active and sedentary bouts, floor climb | API of wristband | [150,151,155,156,164,171,179,180,181,182,191,374] | Physical mobility |
| Heart rate (HR), galvanic skin response (GSR), skin temperature (ST), electrodermal activity (EDA) | API of Wristband | [149,150,164,169,170,172,178,179,182,191] | Physiological |
| Outliers of systolic and diastolic periods: centering tendency, spreading degree, distribution shape and symmetry degree values from blood volume pressure | N/A | [178] | Physiological, Derived |
| Motion features from accelerometer data: acceleration, motion | N/A | [149] | Physical mobility |
| Heart rate variability (HRV), rapid eye movement, wake after sleep onset, metabolic equivalent for task (MET) for physical activity | API of Oura ring | [158] | Physiological, Physical mobility |
| High-level features from HR, GSR, and ST signals | CNN-LSTM | [215] | Representations |
| Basal metabolic rate (BMR) calories | API of wristband | [179,180] | Physiological |
| Features | Tools | Studies | Feature Category |
|---|---|---|---|
| Gender, age, location | Sina microblog user account | [187] | Demographic |
| Gender, age, relationships, education levels | bBridge [423], big data platform for social multimedia analytics | [20] | Demographic |
| Age, gender | Age and gender lexica [424], M3-inference model [425] performs multimodal analysis on profile images, usernames, and descriptions on social media profiles | [121,143,144] | Demographic |
| Big 5 personality scores | IBM’s Personality Insights [426], BERT-MLP model [427] on textual content | [57,121,130,143,144,188] | Personality |
| Proportion of perfection and ruminant thinking-related words in textual content (inspired by [287]) | Perfection and ruminant-thinking-related lexicons | [187] | Personality |
| Interpersonal sensitivity: amount of stressful periods associated with interpersonal relations | Algorithm [410] applied on users’ posting behaviors | [187] | Personality |
Appendix B. Existing Modality Fusion Techniques
| Category | Method | Tools | Studies |
|---|---|---|---|
| Feature level | Concatenate into a single representation | N/A | [67,84,85,89,96,97,105,132,142,143,145,146,166,170,179,197,199,200,201,217] |
| Score/Decision level | Sum-rule, product-rule, max-rule, AND and OR operations, or majority voting on modality-level scores | N/A | [48,51,56,77,87,98,126,173,193,198,201] |
| Weighted average or sum of modality-level scores | N/A | [51,68,147,198,200] | |
| Average confidence scores from lower-level prediction | N/A | [121] | |
| Combine predictions of individual modalities as inputs to secondary ML models | SVM, decision tree, random forest, novel ML models | [48,52,56,64,71,72,74,103,122,155,193] | |
| Hierarchical score/decision-level fusion | Weighted voting fusion network [428] | [122,195] | |
| Summation of question-level scores from rules enforced on modality-specific predictions | N/A | [88] | |
| Model level | Map multiple features into a single vector | LSTM-based encoder–decoder network, LSTM-based neural network, BiLSTM, LSTM, fully connected layer, tensor fusion network | [46,59,75,80,86,95,187] |
| Concatenate feature representations as a single input to learn high-level representations | Dense and fully connected layers with attention mechanisms, CNN, multi-head attention network, transformer [295], novel time-aware LSTM | [70,73,77,89,91,92,94,125,189,214] | |
| Learn shared representations from weighted modality-specific representations | Gated Multimodal Unit (GMU) [429], parallel attention model, attention layer, sparse MLP (mix vertical and horizontal information via weight sharing and sparse connection), multimodal encoder–decoder, multimodal factorized bilinear pooling (combines compact output features of multi-modal low-rank bilinear [430] and robustness of multi-modal compact bilinear [431]), multi-head intermodal attention fusion, transformer [295], feed-forward network, low-rank multimodal fusion network [432] | [62,65,67,76,93,100,102,106,113,117,131,135,136,142,143,144,174,218,433] | |
| Learn joint sparse representations | Dictionary learning | [20] | |
| Learn and fuse outputs from different modality-specific parts at fixed time steps | Cell-coupled LSTM with L-skip fusion mechanism | [101] | |
| Learn cross-modality representations that incorporate interactions between modalities | LXMERT [434], transformer encoder with cross-attention layers (representations of a modality as query and the other as key/value, and vice versa), memory fusion network [435] | [82,92,129] | |
| Horizontal and vertical kernels to capture patterns across different levels | CASER [309] | [170] |
Appendix C. Existing Machine Learning Models
| Category | Machine Learning Models | Application Method | Studies |
|---|---|---|---|
| Supervised learning | Linear regression, logistic regression, least absolute shrinkage and selection operator (Lasso) regularized linear regression [436], ElasticNet regression [437], stochastic gradient descent (SGD) regression, Gaussian staircase model, partial least square (PLS) [438] regression (useful for collinear features), generalized linear models | Learn relationship between features to predict continuous values (scores of assessment scales) or probabilities (correspond to output classes) | [20,43,49,53,55,68,70,99,104,105,126,130,134,140,150,154,163,164,167,175,179,182,188,200,211,212,213,219,222,223] |
| SVM | Find a hyperplane that best fits features (regression) or divides features into classes (classification), secondary model in score-level fusion | [47,50,79,99,104,105,115,121,130,134,140,148,162,163,169,178,179,188,198,210,219,223] | |
| One class SVM [439] | Anomaly detection by treating outliers as points on the other side of hyperplane | [165] | |
| Three-step hierarchical logistic regression | Incremental inclusion of three feature groups in conventional logistic regression | [181] | |
| Discriminant functions-Naive Bayes, quadratic discriminant analysis (QDA), linear discriminant analysis (LDA), Gaussian naive Bayes | Determine class based on Bayesian probabilities, detect state changes | [12,99,104,140,148,152,163,222] | |
| Decision tree | Construct a tree that splits into leaf nodes based on feature | [99,134,140,148,164,178] | |
| Mixed-effect classification and regression trees-generalized linear mixed-effects model (GLMM) trees [440] | Capture interactions and nonlinearity among features while accounting for longitudinal structure | [191] | |
| Neural network | Fully connected (FC) layers, multilayer perceptron (MLP), CNN, LSTM, BiLSTM, GRU, temporal convolutional network (TCN) [441] (with dilation for long sequences)-with activation function like Sigmoid, Softmax, ReLU, LeakyReLU, and GeLU | Predict scores of assessment scales (regression) or probability distribution over classes (classification) | [60,78,80,84,85,86,87,88,90,91,92,93,94,96,98,105,111,113,117,131,133,135,136,142,143,144,146,162,163,167,168,170,172,174,178,179,190,197,199,201,218,219,221,223,308] |
| DCNN-DNN (combination of deep CNN and DNN), GCNN-LSTM (combination of gated convolutional neural network, which replaces a convolution block in CNN with a gated convolution block, and LSTM) | The latter neural network makes predictions based on high-level global features learned by the prior | [52,308] | |
| Cross-domain DNN with feature adaptive transformation and combination strategy (DNN-FATC) | Enhance detection in the target domain by transferring information from a heterogenous source domain | [109] | |
| Attention-based TCN | Classify features using relational classification attention [442] | [72] | |
| One-hot transformer (lower complexity than original sine and cosine functions) | Apply one-hot encoding on features for classification | [72] | |
| Transformer [295] | Apply self-attention across post-level representations, attention masking masks missing information | [129] | |
| Transformer-based sequence classification models-BERT, RoBERTa [296], XLNet [285], Informer [443] (for long sequences) | Perform classification using custom pre-trained tokenizers augmented with special tokens for tokenization | [121,179] | |
| Hierarchical attention network (HAN) [444] | Predict on user-level representations derived from stacked attention-based post-level representations, each made up of attention-based word-level representations | [128] | |
| LSTM-based encoder and decoder | Learn factorized joint distributions to generate modality-specific generative factors and multimodal discriminative factors to reconstruct unimodal inputs and predict labels respectively | [82] | |
| GRU-RNN as baseline model with FC layers as personalized model | Train baseline model using data from all samples and fine-tune personalized model on individual samples | [161] | |
| CNN-based triplet network [408] | Incorporate representations of homogeneous users | [138] | |
| Stacked graph convolutional network | Perform classification on heterogeneous graphs by learning embeddings, sorting graph nodes, and performing graph comparisons | [139] | |
| GRU-D (introduce decay rates in conventional GRU to control decay mechanism) | Learn feature-specific hidden decay rates from inputs | [171] | |
| Ensemble learning | Random forest (RF) [300], eXtreme Gradient Boosting (XGBoost), AdaBoost [301], Gradient Boosted Regression Tree [302] (GDBT) (less sensitive to outliers and more robust to overfitting) | Predict based on numerical input features | [51,99,104,105,114,126,130,134,140,148,151,155,157,160,163,164,167,169,178,179,182,183,188,203,204,206,212,219,222,223] |
| RF | Secondary model that predicts from regression scores and binary outputs of individual modality predictions | [71,81] | |
| Balanced RF [445] (RF on imbalanced data) | Aggregate predictions of ensemble on balanced down-sampled data | [209] | |
| XGBoost-based subject-specific hierarchical recall network | Deduce subject-level labels based on whether the output probability of XGBoost at a specific layer exceeds a predetermined threshold | [194] | |
| Stacked ensemble learning architecture | Obtain the first level of predictions from KNN, naive Bayes, Lasso regression, ridge regression, and SVM, then use them as features of a second-layer logistic regression | [123] | |
| Feature-stacking (a meta-learning approach) [303] | Use logistic regression as an L1 learner to combine predictions of weak L0 learners on different feature sets | [185] | |
| Greedy Ensembles of Weighted Extreme Learning Machines (GEWELMs), WELM [446] (weighted mapping for unbalanced class), Kernel ELM | ELM [447] as a building block that maps inputs to class-based outputs via least square regression | [63,127,192] | |
| Stacked ensemble classifier | Use MLP as meta learner to integrate outputs of CNN base learners | [126] | |
| Cost-sensitive boosting pruning trees-AdaBoost with pruned decision trees | Weighted pruning prunes redundant leaves to increase generalization and robustness | [137] | |
| Weighted voting model | Weight predictions of baseline ML models (DT, Naive Bayes, KNN, SVM, generalized linear models, GDBT) based on class probabilities and deduce final outcome from the highest weighted class | [140] | |
| Ensemble of SVM, DT, and naive Bayes | N/A | [89] | |
| Combination of personalized LSTM-based and RF models | Train personalized LSTM on hourly time series data (of another sample most similar to the sample of concern based on demographic characteristics and baseline MH states), and RF on statistical and cluster-based features | [208] | |
| Multi-task learning | CNN | Train jointly to produce two output branches, regression score and probability distribution for classification | [61,62] |
| LSTM-RNN, attention-based LSTM subnetwork, MLP with shared and task-specific layers | Train for depression prediction with emotion recognition as the secondary task | [46,106,132] | |
| LSTM with Swish [448] activation function (speeds up training with the advantages of linear and ReLU activation), GRU with FC layers, DNN with multi-task loss function | Perform both regression and classification simultaneously | [74,102,118,141,193] | |
| Multi-task FC layers | Train jointly to predict severity level and discrete probability distribution | [97] | |
| Multi-output support least-squares vector regression machines (m-SVR) [304] | Map multivariate inputs to a multivariate output space to predict several tasks | [207] | |
| 2-layer MLP with shared and task-specific dense layers with dynamic weight tuning technique | Train to perform individual predictions for positive and control groups | [180] | |
| Bi-LSTM-based DNNs to provide auxiliary outputs into DNN for main output | Auxiliary outputs correspond to additional predictions to incorporate additional information | [176] | |
| DNN (FC layers with Softmax activation) for auxiliary and main outputs | Train DNNs individually on different feature combinations as individual tasks to obtain auxiliary losses for joint optimization function of main output | [145] | |
| Multi-task neural network with shared LSTM layer and two task-specific LSTM layers | Train to predict male and female samples individually | [70] | |
| Others | Semi-supervised learning-ladder network classifier [305] of stacked noisy encoder and denoising autoencoder [306] | Reconstruct input using outputs of noisy encoder in the current layer and decoder from the previous layer, combine with MLP (inspired by [449]) | [196] |
| DMF [450], RESCAL [451], DEDICOM [452], HERec [453] | Perform recommender system [307] approach on features modeled using HIN | [173] | |
| Graphlets [454], colored graphlets [455], DeepWalk [456], Metapath2vec++ [457] | Perform node classification on features modeled using HIN | [173] | |
| Combination of DBSCAN and K-Means | Density-based clustering | [78] | |
| Clustering-based-KNN | Deduce predicted class through voting of K-nearest data | [140,163,166,178,212,223] | |
| Linear superimpose of modality-specific features | Learn fitting parameters (between 0 and 1) that adjust the proportions of modality-specific features in the final outcome | [83] | |
| Two-staged prediction with outlier detection | Baseline ML model (LR, SVM, KNN, DT, GBDT, AdaBoost, RF, Gaussian naive Bayes, LDA, QDA, DNN, CNN) performs day-level predictions, t-test detects outliers in first stage outputs | [163] | |
| Label association mechanism | Apply to one-hot vectors of predictions from modality-specific DNNs | [189] | |
| Isolation Forest (ISOFOR) [458], Local Outlier Factor (LOF) [459], Connectivity-Based Outlier Factor (COF) [460] | Unsupervised anomaly detection | [166] | |
| Similarity and threshold relative to the model of normality (MoN) (from the average of deep representations of training instances in respective target groups) | Deduce predicted class based on higher similarity with corresponding MoN | [85] | |
| Federated learning based on DNN | Train global model on all data and fine-tune the last layer locally | [168] |
References
- Institute of Health Metrics and Evaluation. Global Health Data Exchange (GHDx); Institute of Health Metrics and Evaluation: Seattle, WA, USA, 2019. [Google Scholar]
- World Health Organization. Mental Health and COVID-19: Early Evidence of the Pandemic’s Impact: Scientific Brief, 2 March 2022; Technical Report; World Health Organization: Geneva, Switzerland, 2022. [Google Scholar]
- Australian Bureau of Statistics (2020–2022). National Study of Mental Health and Wellbeing. 2022. Available online: https://www.abs.gov.au/statistics/health/mental-health/national-study-mental-health-and-wellbeing/latest-release (accessed on 10 December 2023).
- National Institute of Mental Health. Statistics of Mental Illness. 2021. Available online: https://www.nimh.nih.gov/health/statistics/mental-illness (accessed on 10 December 2023).
- Bloom, D.; Cafiero, E.; Jané-Llopis, E.; Abrahams-Gessel, S.; Bloom, L.; Fathima, S.; Feigl, A.; Gaziano, T.; Hamandi, A.; Mowafi, M.; et al. The Global Economic Burden of Noncommunicable Diseases; Technical Report; Harvard School of Public Health: Boston, MA, USA, 2011. [Google Scholar]
- World Health Organization. Mental Health and Substance Use. In Comprehensive Mental Health Action Plan 2013–2030; World Health Organization: Geneva, Switzerland, 2021. [Google Scholar]
- Borg, M. The Nature of Recovery as Lived in Everyday Life: Perspectives of Individuals Recovering from Severe Mental Health Problems. Ph.D. Thesis, Norwegian University of Science and Technology, Trondheim, Norway, 2007. [Google Scholar]
- Barge-Schaapveld, D.Q.; Nicolson, N.A.; Berkhof, J.; Devries, M.W. Quality of life in depression: Daily life determinants and variability. Psychiatry Res. 1999, 88, 173–189. [Google Scholar] [CrossRef] [PubMed]
- Rapee, R.M.; Heimberg, R.G. A cognitive-behavioral model of anxiety in social phobia. Behav. Res. Ther. 1997, 35, 741–756. [Google Scholar] [CrossRef]
- Stewart-Brown, S. Emotional wellbeing and its relation to health. BMJ 1998, 317, 1608–1609. [Google Scholar] [CrossRef]
- Goldman, L.S.; Nielsen, N.H.; Champion, H.C.; The Council on American Medical Association Council on Scientific Affairs. Awareness, Diagnosis, and Treatment of Depression. J. Gen. Intern. Med. 1999, 14, 569–580. [Google Scholar] [CrossRef]
- Grünerbl, A.; Muaremi, A.; Osmani, V.; Bahle, G.; Öhler, S.; Tröster, G.; Mayora, O.; Haring, C.; Lukowicz, P. Smartphone-Based Recognition of States and State Changes in Bipolar Disorder Patients. IEEE J. Biomed. Health Inform. 2015, 19, 140–148. [Google Scholar] [CrossRef]
- Kakuma, R.; Minas, H.; Ginneken, N.; Dal Poz, M.; Desiraju, K.; Morris, J.; Saxena, S.; Scheffler, R. Human resources for mental health care: Current situation and strategies for action. Lancet 2011, 378, 1654–1663. [Google Scholar] [CrossRef]
- Le Glaz, A.; Haralambous, Y.; Kim-Dufor, D.H.; Lenca, P.; Billot, R.; Ryan, T.C.; Marsh, J.; DeVylder, J.; Walter, M.; Berrouiguet, S.; et al. Machine Learning and Natural Language Processing in Mental Health: Systematic Review. J. Med. Internet Res. 2021, 23, e15708. [Google Scholar] [CrossRef]
- Rahman, R.A.; Omar, K.; Mohd Noah, S.A.; Danuri, M.S.N.M.; Al-Garadi, M.A. Application of Machine Learning Methods in Mental Health Detection: A Systematic Review. IEEE Access 2020, 8, 183952–183964. [Google Scholar] [CrossRef]
- Graham, S.; Depp, C.; Lee, E.E.; Nebeker, C.; Tu, X.; Kim, H.C.; Jeste, D.V. Artificial Intelligence for Mental Health and Mental Illnesses: An Overview. Curr. Psychiatry Rep. 2019, 21, 116. [Google Scholar] [CrossRef]
- Thieme, A.; Belgrave, D.; Doherty, G. Machine Learning in Mental Health: A Systematic Review of the HCI Literature to Support the Development of Effective and Implementable ML Systems. ACM Trans. Comput. Hum. Interact. 2020, 27, 1–53. [Google Scholar] [CrossRef]
- Javaid, M.; Haleem, A.; Pratap Singh, R.; Suman, R.; Rab, S. Significance of machine learning in healthcare: Features, pillars and applications. Int. J. Intell. Netw. 2022, 3, 58–73. [Google Scholar] [CrossRef]
- Riaz Choudhry, F.; Vasudevan Mani, L.C.M.; Khan, T.M. Beliefs and perception about mental health issues: A meta-synthesis. Neuropsychiatr. Dis. Treat. 2016, 12, 2807–2818. [Google Scholar] [CrossRef] [PubMed]
- Shen, G.; Jia, J.; Nie, L.; Feng, F.; Zhang, C.; Hu, T.; Chua, T.S.; Zhu, W. Depression Detection via Harvesting Social Media: A Multimodal Dictionary Learning Solution. In Proceedings of the 26th International Joint Conference on Artificial Intelligence, Melbourne, Australia, 19–25 August 2017; pp. 3838–3844. [Google Scholar]
- Manickam, P.; Mariappan, S.A.; Murugesan, S.M.; Hansda, S.; Kaushik, A.; Shinde, R.; Thipperudraswamy, S.P. Artificial Intelligence (AI) and Internet of Medical Things (IoMT) Assisted Biomedical Systems for Intelligent Healthcare. Biosensors 2022, 12, 562. [Google Scholar] [CrossRef]
- Skaik, R.; Inkpen, D. Using Social Media for Mental Health Surveillance: A Review. ACM Comput. Surv. 2020, 53, 1–31. [Google Scholar] [CrossRef]
- Chen, X.; Genc, Y. A Systematic Review of Artificial Intelligence and Mental Health in the Context of Social Media. In Proceedings of the Artificial Intelligence in HCI, Virtual, 26 June–1 July 2022; pp. 353–368. [Google Scholar]
- Deshmukh, V.M.; Rajalakshmi, B.; Dash, S.; Kulkarni, P.; Gupta, S.K. Analysis and Characterization of Mental Health Conditions based on User Content on Social Media. In Proceedings of the 2022 International Conference on Advances in Computing, Communication and Applied Informatics (ACCAI), Chennai, India, 28–29 January 2022; pp. 1–5. [Google Scholar] [CrossRef]
- Yazdavar, A.H.; Mahdavinejad, M.S.; Bajaj, G.; Romine, W.; Sheth, A.; Monadjemi, A.H.; Thirunarayan, K.; Meddar, J.M.; Myers, A.; Pathak, J.; et al. Multimodal mental health analysis in social media. PLoS ONE 2020, 15, e0226248. [Google Scholar] [CrossRef]
- Garcia Ceja, E.; Riegler, M.; Nordgreen, T.; Jakobsen, P.; Oedegaard, K.; Torresen, J. Mental health monitoring with multimodal sensing and machine learning: A survey. Pervasive Mob. Comput. 2018, 51, 1–26. [Google Scholar] [CrossRef]
- Hickey, B.A.; Chalmers, T.; Newton, P.; Lin, C.T.; Sibbritt, D.; McLachlan, C.S.; Clifton-Bligh, R.; Morley, J.; Lal, S. Smart Devices and Wearable Technologies to Detect and Monitor Mental Health Conditions and Stress: A Systematic Review. Sensors 2021, 21, 3461. [Google Scholar] [CrossRef]
- Woodward, K.; Kanjo, E.; Brown, D.J.; McGinnity, T.M.; Inkster, B.; Macintyre, D.J.; Tsanas, A. Beyond Mobile Apps: A Survey of Technologies for Mental Well-Being. IEEE Trans. Affect. Comput. 2022, 13, 1216–1235. [Google Scholar] [CrossRef]
- Craik, K.H. The lived day of an individual: A person-environment perspective. Pers. Environ. Psychol. New Dir. Perspect. 2000, 2, 233–266. [Google Scholar]
- Harari, G.M.; Müller, S.R.; Aung, M.S.; Rentfrow, P.J. Smartphone sensing methods for studying behavior in everyday life. Curr. Opin. Behav. Sci. 2017, 18, 83–90. [Google Scholar] [CrossRef]
- Stucki, R.A.; Urwyler, P.; Rampa, L.; Müri, R.; Mosimann, U.P.; Nef, T. A Web-Based Non-Intrusive Ambient System to Measure and Classify Activities of Daily Living. J. Med. Internet Res. 2014, 16, e175. [Google Scholar] [CrossRef]
- Page, M.J.; McKenzie, J.E.; Bossuyt, P.M.; Boutron, I.; Hoffmann, T.C.; Mulrow, C.D.; Shamseer, L.; Tetzlaff, J.M.; Akl, E.A.; Brennan, S.E.; et al. The PRISMA 2020 statement: An updated guideline for reporting systematic reviews. BMJ 2021, 372, 105906. [Google Scholar] [CrossRef]
- Liberati, A.; Altman, D.G.; Tetzlaff, J.; Mulrow, C.; Gøtzsche, P.C.; Ioannidis, J.P.A.; Clarke, M.; Devereaux, P.J.; Kleijnen, J.; Moher, D. The PRISMA statement for reporting systematic reviews and meta-analyses of studies that evaluate healthcare interventions: Explanation and elaboration. BMJ 2009, 339, W-65–W-94. [Google Scholar] [CrossRef]
- Moher, D.; Liberati, A.; Tetzlaff, J.; Altman, D.G.; Group, T.P. Preferred Reporting Items for Systematic Reviews and Meta-Analyses: The PRISMA Statement. PLoS Med. 2009, 6, 336–341. [Google Scholar] [CrossRef] [PubMed]
- Kitchenham, B.; Charters, S. Guidelines for Performing Systematic Literature Reviews in Software Engineering; Technical Report; University of Durham: Durham, UK, 2007. [Google Scholar]
- Zhang, T.; Schoene, A.; Ji, S.; Ananiadou, S. Natural language processing applied to mental illness detection: A narrative review. npj Digit. Med. 2022, 5, 46. [Google Scholar] [CrossRef]
- Valstar, M.; Schuller, B.; Smith, K.; Eyben, F.; Jiang, B.; Bilakhia, S.; Schnieder, S.; Cowie, R.; Pantic, M. AVEC 2013: The Continuous Audio/Visual Emotion and Depression Recognition Challenge. In Proceedings of the 3rd ACM International Workshop on Audio/Visual Emotion Challenge (AVEC ’13), Barcelona, Spain, 21 October 2013; pp. 3–10. [Google Scholar] [CrossRef]
- Valstar, M.; Schuller, B.; Smith, K.; Almaev, T.; Eyben, F.; Krajewski, J.; Cowie, R.; Pantic, M. AVEC 2014: 3D Dimensional Affect and Depression Recognition Challenge. In Proceedings of the 4th International Workshop on Audio/Visual Emotion Challenge (AVEC ’14), Orlando, FL, USA, 7 November 2014; pp. 3–10. [Google Scholar] [CrossRef]
- Sawyer, S.M.; Azzopardi, P.S.; Wickremarathne, D.; Patton, G.C. The age of adolescence. Lancet Child Adolesc. Health 2018, 2, 223–228. [Google Scholar] [CrossRef]
- Semrud-Clikeman, M.; Goldenring Fine, J. Pediatric versus adult psychopathology: Differences in neurological and clinical presentations. In The Neuropsychology of Psychopathology; Contemporary Neuropsychology; Springer: New York, NY, USA, 2013; pp. 11–27. [Google Scholar]
- Cobham, V.E.; McDermott, B.; Haslam, D.; Sanders, M.R. The Role of Parents, Parenting and the Family Environment in Children’s Post-Disaster Mental Health. Curr. Psychiatry Rep. 2016, 18, 53. [Google Scholar] [CrossRef]
- Tuma, J.M. Mental health services for children: The state of the art. Am. Psychol. 1989, 44, 188–199. [Google Scholar] [CrossRef]
- Gong, Y.; Poellabauer, C. Topic Modeling Based Multi-Modal Depression Detection. In Proceedings of the 7th Annual Workshop on Audio/Visual Emotion Challenge (AVEC ’17), Mountain View, CA, USA, 23 October 2017; pp. 69–76. [Google Scholar] [CrossRef]
- Van Praag, H. Can stress cause depression? Prog. Neuro-Psychopharmacol. Biol. Psychiatry 2004, 28, 891–907. [Google Scholar] [CrossRef]
- Power, M.J.; Tarsia, M. Basic and complex emotions in depression and anxiety. Clin. Psychol. Psychother. 2007, 14, 19–31. [Google Scholar] [CrossRef]
- Chao, L.; Tao, J.; Yang, M.; Li, Y. Multi task sequence learning for depression scale prediction from video. In Proceedings of the 2015 International Conference on Affective Computing and Intelligent Interaction (ACII), Xi’an, China, 21–24 September 2015; pp. 526–531. [Google Scholar] [CrossRef]
- Yang, L.; Jiang, D.; He, L.; Pei, E.; Oveneke, M.C.; Sahli, H. Decision Tree Based Depression Classification from Audio Video and Language Information. In Proceedings of the 6th International Workshop on Audio/Visual Emotion Challenge (AVEC ’16), Amsterdam, The Netherlands, 16 October 2016; pp. 89–96. [Google Scholar] [CrossRef]
- Pampouchidou, A.; Simantiraki, O.; Fazlollahi, A.; Pediaditis, M.; Manousos, D.; Roniotis, A.; Giannakakis, G.; Meriaudeau, F.; Simos, P.; Marias, K.; et al. Depression Assessment by Fusing High and Low Level Features from Audio, Video, and Text. In Proceedings of the 6th International Workshop on Audio/Visual Emotion Challenge (AVEC ’16), Amsterdam, The Netherlands, 16 October 2016; Association for Computing Machinery: New York, NY, USA, 2016; pp. 27–34. [Google Scholar] [CrossRef]
- Williamson, J.R.; Godoy, E.; Cha, M.; Schwarzentruber, A.; Khorrami, P.; Gwon, Y.; Kung, H.T.; Dagli, C.; Quatieri, T.F. Detecting Depression Using Vocal, Facial and Semantic Communication Cues. In Proceedings of the 6th International Workshop on Audio/Visual Emotion Challenge (AVEC ’16), Amsterdam, The Netherlands, 16 October 2016; pp. 11–18. [Google Scholar] [CrossRef]
- Smailis, C.; Sarafianos, N.; Giannakopoulos, T.; Perantonis, S. Fusing Active Orientation Models and Mid-Term Audio Features for Automatic Depression Estimation. In Proceedings of the 9th ACM International Conference on PErvasive Technologies Related to Assistive Environments (PETRA ’16), Corfu Island, Greece, 29 June–1 July 2016; Association for Computing Machinery: New York, NY, USA, 2016. [Google Scholar] [CrossRef]
- Nasir, M.; Jati, A.; Shivakumar, P.G.; Nallan Chakravarthula, S.; Georgiou, P. Multimodal and Multiresolution Depression Detection from Speech and Facial Landmark Features. In Proceedings of the 6th International Workshop on Audio/Visual Emotion Challenge (AVEC ’16), Amsterdam, The Netherlands, 16 October 2016; Association for Computing Machinery: New York, NY, USA, 2016; pp. 43–50. [Google Scholar] [CrossRef]
- Yang, L.; Jiang, D.; Xia, X.; Pei, E.; Oveneke, M.C.; Sahli, H. Multimodal Measurement of Depression Using Deep Learning Models. In Proceedings of the 7th Annual Workshop on Audio/Visual Emotion Challenge (AVEC ’17), Mountain View, CA, USA, 23–27 October 2017; Association for Computing Machinery: New York, NY, USA, 2017; pp. 53–59. [Google Scholar] [CrossRef]
- Jan, A.; Meng, H.; Gaus, Y.F.B.A.; Zhang, F. Artificial Intelligent System for Automatic Depression Level Analysis Through Visual and Vocal Expressions. IEEE Trans. Cogn. Dev. Syst. 2018, 10, 668–680. [Google Scholar] [CrossRef]
- Samareh, A.; Jin, Y.; Wang, Z.; Chang, X.; Huang, S. Detect depression from communication: How computer vision, signal processing, and sentiment analysis join forces. IISE Trans. Healthc. Syst. Eng. 2018, 8, 196–208. [Google Scholar] [CrossRef]
- Dibeklioğlu, H.; Hammal, Z.; Cohn, J.F. Dynamic Multimodal Measurement of Depression Severity Using Deep Autoencoding. IEEE J. Biomed. Health Inform. 2018, 22, 525–536. [Google Scholar] [CrossRef]
- Alghowinem, S.; Goecke, R.; Wagner, M.; Epps, J.; Hyett, M.; Parker, G.; Breakspear, M. Multimodal Depression Detection: Fusion Analysis of Paralinguistic, Head Pose and Eye Gaze Behaviors. IEEE Trans. Affect. Comput. 2018, 9, 478–490. [Google Scholar] [CrossRef]
- Kim, J.Y.; Kim, G.Y.; Yacef, K. Detecting Depression in Dyadic Conversations with Multimodal Narratives and Visualizations. In Proceedings of the AI 2019: Advances in Artificial Intelligence, Adelaide, Australia, 2–5 December 2019; Liu, J., Bailey, J., Eds.; Springer International Publishing: Cham, Switzerland, 2019; pp. 303–314. [Google Scholar]
- Victor, E.; Aghajan, Z.M.; Sewart, A.R.; Christian, R. Detecting depression using a framework combining deep multimodal neural networks with a purpose-built automated evaluation. Psychol. Assess. 2019, 31, 1019–1027. [Google Scholar] [CrossRef]
- Ray, A.; Kumar, S.; Reddy, R.; Mukherjee, P.; Garg, R. Multi-Level Attention Network Using Text, Audio and Video for Depression Prediction. In Proceedings of the 9th International on Audio/Visual Emotion Challenge and Workshop (AVEC ’19), Nice, France, 21–25 October 2019; Association for Computing Machinery: New York, NY, USA, 2019; pp. 81–88. [Google Scholar] [CrossRef]
- Rodrigues Makiuchi, M.; Warnita, T.; Uto, K.; Shinoda, K. Multimodal Fusion of BERT-CNN and Gated CNN Representations for Depression Detection. In Proceedings of the 9th International on Audio/Visual Emotion Challenge and Workshop (AVEC ’19), Nice, France, 21–25 October 2019; Association for Computing Machinery: New York, NY, USA, 2019; pp. 55–63. [Google Scholar] [CrossRef]
- Fan, W.; He, Z.; Xing, X.; Cai, B.; Lu, W. Multi-Modality Depression Detection via Multi-Scale Temporal Dilated CNNs. In Proceedings of the Proceedings of the 9th International on Audio/Visual Emotion Challenge and Workshop (AVEC ’19), Nice, France, 21–25 October 2019; Association for Computing Machinery: New York, NY, USA, 2019; pp. 73–80. [Google Scholar] [CrossRef]
- Qureshi, S.A.; Saha, S.; Hasanuzzaman, M.; Dias, G. Multitask Representation Learning for Multimodal Estimation of Depression Level. IEEE Intell. Syst. 2019, 34, 45–52. [Google Scholar] [CrossRef]
- Kaya, H.; Fedotov, D.; Dresvyanskiy, D.; Doyran, M.; Mamontov, D.; Markitantov, M.; Akdag Salah, A.A.; Kavcar, E.; Karpov, A.; Salah, A.A. Predicting Depression and Emotions in the Cross-Roads of Cultures, Para-Linguistics, and Non-Linguistics. In Proceedings of the 9th International on Audio/Visual Emotion Challenge and Workshop (AVEC ’19), Nice, France, 21–25 October 2019; Association for Computing Machinery: New York, NY, USA, 2019; pp. 27–35. [Google Scholar] [CrossRef]
- Muszynski, M.; Zelazny, J.; Girard, J.M.; Morency, L.P. Depression Severity Assessment for Adolescents at High Risk of Mental Disorders. In Proceedings of the 2020 International Conference on Multimodal Interaction (ICMI ’20), Virtual, 25–29 October 2020; Association for Computing Machinery: New York, NY, USA, 2020; pp. 70–78. [Google Scholar] [CrossRef]
- Aloshban, N.; Esposito, A.; Vinciarelli, A. Detecting Depression in Less Than 10 Seconds: Impact of Speaking Time on Depression Detection Sensitivity. In Proceedings of the 2020 International Conference on Multimodal Interaction (ICMI ’20), Virtual, 25–29 October 2020; Association for Computing Machinery: New York, NY, USA, 2020; pp. 79–87. [Google Scholar] [CrossRef]
- Liu, Z.; Wang, D.; Ding, Z.; Chen, Q. A Novel Bimodal Fusion-based Model for Depression Recognition. In Proceedings of the 2020 IEEE International Conference on E-health Networking, Application & Services (HEALTHCOM), Shenzhen, China, 1–2 March 2021; pp. 1–4. [Google Scholar] [CrossRef]
- Toto, E.; Tlachac, M.; Rundensteiner, E.A. AudiBERT: A Deep Transfer Learning Multimodal Classification Framework for Depression Screening. In Proceedings of the 30th ACM International Conference on Information & Knowledge Management (CIKM ’21), Queensland, Australia, 1–5 November 2021; Association for Computing Machinery: New York, NY, USA, 2021; pp. 4145–4154. [Google Scholar] [CrossRef]
- Chordia, A.; Kale, M.; Mayee, M.; Yadav, P.; Itkar, S. Automatic Depression Level Analysis Using Audiovisual Modality. In Smart Computing Techniques and Applications: Proceedings of the Fourth International Conference on Smart Computing and Informatics; Satapathy, S.C., Bhateja, V., Favorskaya, M.N., Adilakshmi, T., Eds.; Springer: Singapore, 2021; pp. 425–439. [Google Scholar]
- Muzammel, M.; Salam, H.; Othmani, A. End-to-end multimodal clinical depression recognition using deep neural networks: A comparative analysis. Comput. Methods Programs Biomed. 2021, 211, 106433. [Google Scholar] [CrossRef]
- Oureshi, S.A.; Dias, G.; Saha, S.; Hasanuzzaman, M. Gender-Aware Estimation of Depression Severity Level in a Multimodal Setting. In Proceedings of the 2021 International Joint Conference on Neural Networks (IJCNN), Shenzhen, China, 18–22 July 2021; pp. 1–8. [Google Scholar] [CrossRef]
- Yang, L.; Jiang, D.; Sahli, H. Integrating Deep and Shallow Models for Multi-Modal Depression Analysis—Hybrid Architectures. IEEE Trans. Affect. Comput. 2021, 12, 239–253. [Google Scholar] [CrossRef]
- Ye, J.; Yu, Y.; Wang, Q.; Li, W.; Liang, H.; Zheng, Y.; Fu, G. Multi-modal depression detection based on emotional audio and evaluation text. J. Affect. Disord. 2021, 295, 904–913. [Google Scholar] [CrossRef]
- Shen, Y.; Yang, H.; Lin, L. Automatic Depression Detection: An Emotional Audio-Textual Corpus and A Gru/Bilstm-Based Model. In Proceedings of the ICASSP 2022—2022 IEEE International Conference on Acoustics, Speech and Signal Processing (ICASSP), Virtual, 1–3 May 2022; pp. 6247–6251. [Google Scholar] [CrossRef]
- Liu, J.; Huang, Y.; Chai, S.; Sun, H.; Huang, X.; Lin, L.; Chen, Y.W. Computer-Aided Detection of Depressive Severity Using Multimodal Behavioral Data. In Handbook of Artificial Intelligence in Healthcare: Advances and Applications; Springer: Cham, Switzerland, 2022; Volume 1, pp. 353–371. [Google Scholar] [CrossRef]
- Uddin, M.A.; Joolee, J.B.; Sohn, K.A. Deep Multi-Modal Network Based Automated Depression Severity Estimation. IEEE Trans. Affect. Comput. 2022, 14, 2153–2167. [Google Scholar] [CrossRef]
- Cao, Y.; Hao, Y.; Li, B.; Xue, J. Depression prediction based on BiAttention-GRU. J. Ambient. Intell. Humaniz. Comput. 2022, 13, 5269–5277. [Google Scholar] [CrossRef]
- Mao, K.; Zhang, W.; Wang, D.B.; Li, A.; Jiao, R.; Zhu, Y.; Wu, B.; Zheng, T.; Qian, L.; Lyu, W.; et al. Prediction of Depression Severity Based on the Prosodic and Semantic Features with Bidirectional LSTM and Time Distributed CNN. IEEE Trans. Affect. Comput. 2022, 14, 2251–2265. [Google Scholar] [CrossRef]
- Aloshban, N.; Esposito, A.; Vinciarelli, A. What You Say or How You Say It? Depression Detection Through Joint Modeling of Linguistic and Acoustic Aspects of Speech. Cogn. Comput. 2021, 14, 1585–1598. [Google Scholar] [CrossRef]
- Bilalpur, M.; Hinduja, S.; Cariola, L.A.; Sheeber, L.B.; Alien, N.; Jeni, L.A.; Morency, L.P.; Cohn, J.F. Multimodal Feature Selection for Detecting Mothers’ Depression in Dyadic Interactions with their Adolescent Offspring. In Proceedings of the 2023 IEEE 17th International Conference on Automatic Face and Gesture Recognition (FG), Waikoloa Beach, HI, USA, 5–8 January 2023; pp. 1–8. [Google Scholar] [CrossRef]
- Flores, R.; Tlachac, M.; Toto, E.; Rundensteiner, E. AudiFace: Multimodal Deep Learning for Depression Screening. In Proceedings of the 7th Machine Learning for Healthcare Conference ( PMLR), Durham, NC, USA, 5–6 August 2022; Proceedings of Machine Learning Research. Lipton, Z., Ranganath, R., Sendak, M., Sjoding, M., Yeung, S., Eds.; 2022; Volume 182, pp. 609–630. [Google Scholar]
- Ghadiri, N.; Samani, R.; Shahrokh, F. Integration of Text and Graph-Based Features for Depression Detection Using Visibility Graph. In Proceedings of the 22nd International Conference on Intelligent Systems Design and Applications (ISDA 2022) on Intelligent Systems Design and Applications, Virtual, 12–14 December 2022; Abraham, A., Pllana, S., Casalino, G., Ma, K., Bajaj, A., Eds.; Springer: Cham, Switzerland, 2023; pp. 332–341. [Google Scholar]
- Huang, G.; Shen, W.; Lu, H.; Hu, F.; Li, J.; Liu, H. Multimodal Depression Detection based on Factorized Representation. In Proceedings of the 2022 International Conference on High Performance Big Data and Intelligent Systems (HDIS), Tianjin, China, 10–11 December 2022; pp. 190–196. [Google Scholar] [CrossRef]
- Liu, D.; Liu, B.; Lin, T.; Liu, G.; Yang, G.; Qi, D.; Qiu, Y.; Lu, Y.; Yuan, Q.; Shuai, S.C.; et al. Measuring depression severity based on facial expression and body movement using deep convolutional neural network. Front. Psychiatry 2022, 13, 1017064. [Google Scholar] [CrossRef] [PubMed]
- Othmani, A.; Zeghina, A.O. A multimodal computer-aided diagnostic system for depression relapse prediction using audiovisual cues: A proof of concept. Healthc. Anal. 2022, 2, 100090. [Google Scholar] [CrossRef]
- Othmani, A.; Zeghina, A.O.; Muzammel, M. A Model of Normality Inspired Deep Learning Framework for Depression Relapse Prediction Using Audiovisual Data. Comput. Methods Programs Biomed. 2022, 226, 107132. [Google Scholar] [CrossRef]
- Park, J.; Moon, N. Design and Implementation of Attention Depression Detection Model Based on Multimodal Analysis. Sustainability 2022, 14, 3569. [Google Scholar] [CrossRef]
- Prabhu, S.; Mittal, H.; Varagani, R.; Jha, S.; Singh, S. Harnessing emotions for depression detection. Pattern Anal. Appl. 2022, 25, 537–547. [Google Scholar] [CrossRef]
- Sudhan, H.V.M.; Kumar, S.S. Multimodal Depression Severity Detection Using Deep Neural Networks and Depression Assessment Scale. In Proceedings of the International Conference on Computational Intelligence and Data Engineering, Vijayawada, India, 12–13 August 2022; Chaki, N., Devarakonda, N., Cortesi, A., Seetha, H., Eds.; Springer: Singapore, 2022; pp. 361–375. [Google Scholar]
- T J, S.J.; Jacob, I.J.; Mandava, A.K. D-ResNet-PVKELM: Deep neural network and paragraph vector based kernel extreme machine learning model for multimodal depression analysis. Multimed. Tools Appl. 2023, 82, 25973–26004. [Google Scholar] [CrossRef]
- Vandana; Marriwala, N.; Chaudhary, D. A hybrid model for depression detection using deep learning. Meas. Sens. 2023, 25, 100587. [Google Scholar] [CrossRef]
- Gu, Y.; Zhang, C.; Ma, F.; Jia, X.; Ni, S. AI-Driven Depression Detection Algorithms from Visual and Audio Cues. In Proceedings of the 2023 3rd International Conference on Frontiers of Electronics, Information and Computation Technologies (ICFEICT), Yangzhou, China, 26–29 May 2023; pp. 468–475. [Google Scholar] [CrossRef]
- Yoon, J.; Kang, C.; Kim, S.; Han, J. D-vlog: Multimodal Vlog Dataset for Depression Detection. Proc. AAAI Conf. Artif. Intell. 2022, 36, 12226–12234. [Google Scholar] [CrossRef]
- Zhou, L.; Liu, Z.; Shangguan, Z.; Yuan, X.; Li, Y.; Hu, B. TAMFN: Time-Aware Attention Multimodal Fusion Network for Depression Detection. IEEE Trans. Neural Syst. Rehabil. Eng. 2023, 31, 669–679. [Google Scholar] [CrossRef] [PubMed]
- Zhou, L.; Liu, Z.; Yuan, X.; Shangguan, Z.; Li, Y.; Hu, B. CAIINET: Neural network based on contextual attention and information interaction mechanism for depression detection. Digit. Signal Process. 2023, 137, 103986. [Google Scholar] [CrossRef]
- Qingjun Zhu, J.X.; Peng, L. College students’ mental health evaluation model based on tensor fusion network with multimodal data during the COVID-19 pandemic. Biotechnol. Genet. Eng. Rev. 2023, 1–15. [Google Scholar] [CrossRef]
- Lam, G.; Dongyan, H.; Lin, W. Context-aware Deep Learning for Multi-modal Depression Detection. In Proceedings of the ICASSP 2019—2019 IEEE International Conference on Acoustics, Speech and Signal Processing (ICASSP), Brighton, UK, 12–17 May 2019; pp. 3946–3950. [Google Scholar] [CrossRef]
- Niu, M.; Chen, K.; Chen, Q.; Yang, L. HCAG: A Hierarchical Context-Aware Graph Attention Model for Depression Detection. In Proceedings of the ICASSP 2021—2021 IEEE International Conference on Acoustics, Speech and Signal Processing (ICASSP), Toronto, ON, Canada, 6–11 June 2021; pp. 4235–4239. [Google Scholar] [CrossRef]
- Ma, W.; Qiu, S.; Miao, J.; Li, M.; Tian, Z.; Zhang, B.; Li, W.; Feng, R.; Wang, C.; Cui, Y.; et al. Detecting depression tendency based on deep learning and multi-sources data. Biomed. Signal Process. Control 2023, 86, 105226. [Google Scholar] [CrossRef]
- Thati, R.P.; Dhadwal, A.S.; Kumar, P.; P, S. A novel multi-modal depression detection approach based on mobile crowd sensing and task-based mechanisms. Multimed. Tools Appl. 2023, 82, 4787–4820. [Google Scholar] [CrossRef] [PubMed]
- Tlachac, M.; Flores, R.; Reisch, M.; Kayastha, R.; Taurich, N.; Melican, V.; Bruneau, C.; Caouette, H.; Lovering, J.; Toto, E.; et al. StudentSADD: Rapid Mobile Depression and Suicidal Ideation Screening of College Students during the Coronavirus Pandemic. Proc. ACM Interact. Mob. Wearable Ubiquitous Technol. 2022, 6, 1–32. [Google Scholar] [CrossRef]
- Su, M.H.; Wu, C.H.; Huang, K.Y.; Yang, T.H. Cell-Coupled Long Short-Term Memory With L -Skip Fusion Mechanism for Mood Disorder Detection Through Elicited Audiovisual Features. IEEE Trans. Neural Netw. Learn. Syst. 2020, 31, 124–135. [Google Scholar] [CrossRef]
- Zhang, Z.; Lin, W.; Liu, M.; Mahmoud, M. Multimodal Deep Learning Framework for Mental Disorder Recognition. In Proceedings of the 2020 15th IEEE International Conference on Automatic Face and Gesture Recognition (FG 2020), Buenos Aires, Argentina, 16–20 November 2020; pp. 344–350. [Google Scholar] [CrossRef]
- Ceccarelli, F.; Mahmoud, M. Multimodal temporal machine learning for Bipolar Disorder and Depression Recognition. Pattern Anal. Appl. 2022, 25, 493–504. [Google Scholar] [CrossRef]
- Tlachac, M.; Toto, E.; Lovering, J.; Kayastha, R.; Taurich, N.; Rundensteiner, E. EMU: Early Mental Health Uncovering Framework and Dataset. In Proceedings of the 2021 20th IEEE International Conference on Machine Learning and Applications (ICMLA), Virtual, 13–16 December 2021; pp. 1311–1318. [Google Scholar] [CrossRef]
- Tlachac, M.; Flores, R.; Reisch, M.; Houskeeper, K.; Rundensteiner, E.A. DepreST-CAT: Retrospective Smartphone Call and Text Logs Collected during the COVID-19 Pandemic to Screen for Mental Illnesses. Proc. ACM Interact. Mob. Wearable Ubiquitous Technol. 2022, 6, 1–32. [Google Scholar] [CrossRef]
- Zhang, Y.; Li, X.; Rong, L.; Tiwari, P. Multi-Task Learning for Jointly Detecting Depression and Emotion. In Proceedings of the 2021 IEEE International Conference on Bioinformatics and Biomedicine (BIBM), Houston, TX, USA, 9–12 December 2021; pp. 3142–3149. [Google Scholar] [CrossRef]
- Schultebraucks, K.; Yadav, V.; Shalev, A.Y.; Bonanno, G.A.; Galatzer-Levy, I.R. Deep learning-based classification of posttraumatic stress disorder and depression following trauma utilizing visual and auditory markers of arousal and mood. Psychol. Med. 2022, 52, 957–967. [Google Scholar] [CrossRef] [PubMed]
- Liu, Y. Using convolutional neural networks for the assessment research of mental health. Comput. Intell. Neurosci. 2022, 2022, 1636855. [Google Scholar] [CrossRef] [PubMed]
- Shen, T.; Jia, J.; Shen, G.; Feng, F.; He, X.; Luan, H.; Tang, J.; Tiropanis, T.; Chua, T.S.; Hall, W. Cross-Domain Depression Detection via Harvesting Social Media. In Proceedings of the 27th International Joint Conference on Artificial Intelligence, Stockholm, Sweden, 13–19 July 2018; pp. 1611–1617. [Google Scholar] [CrossRef]
- Ricard, B.J.; Marsch, L.A.; Crosier, B.; Hassanpour, S. Exploring the Utility of Community-Generated Social Media Content for Detecting Depression: An Analytical Study on Instagram. J. Med. Internet Res. 2018, 20, e11817. [Google Scholar] [CrossRef] [PubMed]
- Gui, T.; Zhu, L.; Zhang, Q.; Peng, M.; Zhou, X.; Ding, K.; Chen, Z. Cooperative Multimodal Approach to Depression Detection in Twitter. In Proceedings of the Thirty-Third AAAI Conference on Artificial Intelligence and Thirty-First Innovative Applications of Artificial Intelligence Conference and Ninth AAAI Symposium on Educational Advances in Artificial Intelligence ( AAAI’19/IAAI’19/EAAI’19), Honolulu, HI, USA, 27 January–1 February 2019; AAAI Press: Washington, DC, USA, 2019. [Google Scholar] [CrossRef]
- Wang, Y.; Wang, Z.; Li, C.; Zhang, Y.; Wang, H. A Multimodal Feature Fusion-Based Method for Individual Depression Detection on Sina Weibo. In Proceedings of the 2020 IEEE 39th International Performance Computing and Communications Conference (IPCCC), Austin, TX, USA, 6–8 November 2020; pp. 1–8. [Google Scholar] [CrossRef]
- Hu, P.; Lin, C.; Su, H.; Li, S.; Han, X.; Zhang, Y.; Mei, J. BlueMemo: Depression Analysis through Twitter Posts. In Proceedings of the Twenty-Ninth International Conference on International Joint Conferences on Artificial Intelligence (IJCAI-20), Yokohama, Japan, 11–17 July 2020; pp. 5252–5254. [Google Scholar] [CrossRef]
- Li, Y.; Cai, M.; Qin, S.; Lu, X. Depressive Emotion Detection and Behavior Analysis of Men Who Have Sex with Men via Social Media. Front. Psychiatry 2020, 11, 830. [Google Scholar] [CrossRef] [PubMed]
- ALSAGRI, H.S.; YKHLEF, M. Machine Learning-Based Approach for Depression Detection in Twitter Using Content and Activity Features. IEICE Trans. Inf. Syst. 2020, 103, 1825–1832. [Google Scholar] [CrossRef]
- Mann, P.; Paes, A.; Matsushima, E. See and Read: Detecting Depression Symptoms in Higher Education Students Using Multimodal Social Media Data. Proc. Int. AAAI Conf. Web Soc. Media 2020, 14, 440–451. [Google Scholar] [CrossRef]
- Lin, C.; Hu, P.; Su, H.; Li, S.; Mei, J.; Zhou, J.; Leung, H. SenseMood: Depression Detection on Social Media. In Proceedings of the 2020 International Conference on Multimedia Retrieval (ICMR ’20), Dublin, Ireland, 8–11 June 2020; Association for Computing Machinery: New York, NY, USA, 2020; pp. 407–411. [Google Scholar] [CrossRef]
- Ghosh, S.; Anwar, T. Depression Intensity Estimation via Social Media: A Deep Learning Approach. IEEE Trans. Comput. Soc. Syst. 2021, 8, 1465–1474. [Google Scholar] [CrossRef]
- Zogan, H.; Razzak, I.; Jameel, S.; Xu, G. DepressionNet: Learning Multi-Modalities with User Post Summarization for Depression Detection on Social Media. In Proceedings of the 44th International ACM SIGIR Conference on Research and Development in Information Retrieval (SIGIR ’21), Paris, France, 21–25 July 2021; Association for Computing Machinery: New York, NY, USA, 2021; pp. 133–142. [Google Scholar] [CrossRef]
- Bi, Y.; Li, B.; Wang, H. Detecting Depression on Sina Microblog Using Depressing Domain Lexicon. In Proceedings of the 2021 IEEE International Conference on Dependable, Autonomic and Secure Computing, International Conference on Pervasive Intelligence and Computing, International Conference on Cloud and Big Data Computing, International Conference on Cyber Science and Technology Congress (DASC/PiCom/CBDCom/CyberSciTech), AB, Canada, 25–28 October 2021; pp. 965–970. [Google Scholar] [CrossRef]
- Zhang, Y.; Lyu, H.; Liu, Y.; Zhang, X.; Wang, Y.; Luo, J. Monitoring Depression Trends on Twitter During the COVID-19 Pandemic: Observational Study. JMIR Infodemiol. 2021, 1, e26769. [Google Scholar] [CrossRef]
- Chiu, C.Y.; Lane, H.Y.; Koh, J.L.; Chen, A.L.P. Multimodal depression detection on instagram considering time interval of posts. J. Intell. Inf. Syst. 2021, 56, 25–47. [Google Scholar] [CrossRef]
- Liu, J.; Shi, M. A Hybrid Feature Selection and Ensemble Approach to Identify Depressed Users in Online Social Media. Front. Psychol. 2022, 12, 802821. [Google Scholar] [CrossRef]
- Safa, R.; Bayat, P.; Moghtader, L. Automatic detection of depression symptoms in twitter using multimodal analysis. J. Supercomput. 2022, 78, 4709–4744. [Google Scholar] [CrossRef] [PubMed]
- Cheng, J.C.; Chen, A.L.P. Multimodal time-aware attention networks for depression detection. J. Intell. Inf. Syst. 2022, 59, 319–339. [Google Scholar] [CrossRef]
- Anshul, A.; Pranav, G.S.; Rehman, M.Z.U.; Kumar, N. A Multimodal Framework for Depression Detection During COVID-19 via Harvesting Social Media. IEEE Trans. Comput. Soc. Syst. 2023, 1–17. [Google Scholar] [CrossRef]
- Angskun, J.; Tipprasert, S.; Angskun, T. Big data analytics on social networks for real-time depression detection. J. Big Data 2022, 9, 69. [Google Scholar] [CrossRef] [PubMed]
- Uban, A.S.; Chulvi, B.; Rosso, P. Explainability of Depression Detection on SocialMedia: From Deep LearningModels to Psychological Interpretations andMultimodality. In Early Detection of Mental Health Disorders by Social Media Monitoring: The First Five Years of the eRisk Project; Springer: Cham, Switzerland, 2022; pp. 289–320. [Google Scholar] [CrossRef]
- Bucur, A.M.; Cosma, A.; Rosso, P.; Dinu, L.P. It’s Just a Matter of Time: Detecting Depression with Time-Enriched Multimodal Transformers. In Proceedings of the Advances in Information Retrieval, Dublin, Ireland, 2–6 April 2023; Kamps, J., Goeuriot, L., Crestani, F., Maistro, M., Joho, H., Davis, B., Gurrin, C., Kruschwitz, U., Caputo, A., Eds.; Springer: Cham, Switzerland, 2023; pp. 200–215. [Google Scholar]
- Chatterjee, M.; Kumar, P.; Sarkar, D. Generating a Mental Health Curve for Monitoring Depression in Real Time by Incorporating Multimodal Feature Analysis Through Social Media Interactions. Int. J. Intell. Inf. Technol. 2023, 19, 1–25. [Google Scholar] [CrossRef]
- Deng, B.; Wang, Z.; Shu, X.; Shu, J. Transformer-Based Graphic-Text Fusion Depressive Tendency Detection. In Proceedings of the 2023 6th International Conference on Artificial Intelligence and Big Data (ICAIBD), Chengdu, China, 26–29 May 2023; pp. 701–705. [Google Scholar] [CrossRef]
- Ghosh, S.; Ekbal, A.; Bhattacharyya, P. What Does Your Bio Say? Inferring Twitter Users’ Depression Status From Multimodal Profile Information Using Deep Learning. IEEE Trans. Comput. Soc. Syst. 2022, 9, 1484–1494. [Google Scholar] [CrossRef]
- Jayapal, C.; Yamuna, S.M.; Manavallan, S.; Devasenan, M. Detection of Mental Health Using Deep Learning Technique. In Proceedings of the Communication and Intelligent Systems, Dublin, Ireland, 2–6 April 2023; Sharma, H., Shrivastava, V., Bharti, K.K., Wang, L., Eds.; Springer: Singapore, 2023; pp. 507–520. [Google Scholar]
- Liaw, A.S.; Chua, H.N. Depression Detection on Social Media With User Network and Engagement Features Using Machine Learning Methods. In Proceedings of the 2022 IEEE International Conference on Artificial Intelligence in Engineering and Technology (IICAIET), Kota Kinabalu, Malaysia, 13–15 September 2022; pp. 1–6. [Google Scholar] [CrossRef]
- Li, Z.; An, Z.; Cheng, W.; Zhou, J.; Zheng, F.; Hu, B. MHA: A multimodal hierarchical attention model for depression detection in social media. Health Inf. Sci. Syst. 2023, 11, 6. [Google Scholar] [CrossRef]
- Long, X.; Zhang, Y.; Shu, X.; Shu, J. Image-text Fusion Model for Depression Tendency Detection Based on Attention. In Proceedings of the 2023 6th International Conference on Artificial Intelligence and Big Data (ICAIBD), Chengdu, China, 26–29 May 2023; pp. 730–734. [Google Scholar] [CrossRef]
- Tong, L.; Liu, Z.; Jiang, Z.; Zhou, F.; Chen, L.; Lyu, J.; Zhang, X.; Zhang, Q.; Sadka, A.; Wang, Y.; et al. Cost-Sensitive Boosting Pruning Trees for Depression Detection on Twitter. IEEE Trans. Affect. Comput. 2023, 14, 1898–1911. [Google Scholar] [CrossRef]
- Pirayesh, J.; Chen, H.; Qin, X.; Ku, W.S.; Yan, D. MentalSpot: Effective Early Screening for Depression Based on Social Contagion. In Proceedings of the 30th ACM International Conference on Information & Knowledge Management (CIKM ’21), Virtual, 1–5 November 2021; Association for Computing Machinery: New York, NY, USA, 2021; pp. 1437–1446. [Google Scholar] [CrossRef]
- Mihov, I.; Chen, H.; Qin, X.; Ku, W.S.; Yan, D.; Liu, Y. MentalNet: Heterogeneous Graph Representation for Early Depression Detection. In Proceedings of the 2022 IEEE International Conference on Data Mining (ICDM), Orlando, FL, USA, 28 November–1 December 2022; pp. 1113–1118. [Google Scholar] [CrossRef]
- Nuankaew, W.; Doenribram, D.; Jareanpon, C.; Nuankaew, P.; Thanarat, P. A New Probabilistic Weighted Voting Model for Depressive Disorder Classification from Captions and Colors of Images. ICIC Express Lett. 2023, 17, 531. [Google Scholar]
- Suganthi, V.; Punithavalli, M. User Depression and Severity Level Prediction During COVID-19 Epidemic from Social Network Data. ARPN J. Eng. Appl. Sci. 2023, 18, 1187–1194. [Google Scholar] [CrossRef]
- Suri, M.; Semwal, N.; Chaudhary, D.; Gorton, I.; Kumar, B. I Don’t Feel so Good! Detecting Depressive Tendencies Using Transformer-Based Multimodal Frameworks. In Proceedings of the 2022 5th International Conference on Machine Learning and Natural Language Processing (MLNLP ’22), Xi’an, China, 25–27 March 2022; Association for Computing Machinery: New York, NY, USA, 2023; pp. 360–365. [Google Scholar] [CrossRef]
- Valencia-Segura, K.M.; Escalante, H.J.; Villasenor-Pineda, L. Automatic Depression Detection in Social Networks Using Multiple User Characterizations. Comput. Sist. 2023, 27, 283–294. [Google Scholar] [CrossRef]
- Valencia-Segura, K.M.; Escalante, H.J.; Villaseñor-Pineda, L. Leveraging Multiple Characterizations of Social Media Users for Depression Detection Using Data Fusion. In Proceedings of the Mexican Conference on Pattern Recognition, Tepic, Mexico, 21–24 June 2022; Vergara-Villegas, O.O., Cruz-Sánchez, V.G., Sossa-Azuela, J.H., Carrasco-Ochoa, J.A., Martínez-Trinidad, J.F., Olvera-López, J.A., Eds.; Springer: Cham, Switzerland, 2022; pp. 215–224. [Google Scholar]
- Wang, Y.; Wang, Z.; Li, C.; Zhang, Y.; Wang, H. Online social network individual depression detection using a multitask heterogenous modality fusion approach. Inf. Sci. 2022, 609, 727–749. [Google Scholar] [CrossRef]
- Zogan, H.; Razzak, I.; Wang, X.; Jameel, S.; Xu, G. Explainable depression detection with multi-aspect features using a hybrid deep learning model on social media. World Wide Web 2022, 25, 281–304. [Google Scholar] [CrossRef] [PubMed]
- Malhotra, A.; Jindal, R. Multimodal Deep Learning based Framework for Detecting Depression and Suicidal Behaviour by Affective Analysis of Social Media Posts. EAI Endorsed Trans. Pervasive Health Technol. 2018, 6, 164259. [Google Scholar] [CrossRef]
- V, A.M.; C, D.K.A.; S, S.; M, E.; Senthilkumar, M. Cluster Ensemble Method and Convolution Neural Network Model for Predicting Mental Illness. Int. J. Adv. Sci. Eng. Inf. Technol. 2023, 13, 392–398. [Google Scholar] [CrossRef]
- Ghandeharioun, A.; Fedor, S.; Sangermano, L.; Ionescu, D.; Alpert, J.; Dale, C.; Sontag, D.; Picard, R. Objective assessment of depressive symptoms with machine learning and wearable sensors data. In Proceedings of the 2017 Seventh International Conference on Affective Computing and Intelligent Interaction (ACII), San Antonio, TX, USA, 23–26 October 2017; pp. 325–332. [Google Scholar] [CrossRef]
- Wang, R.; Wang, W.; daSilva, A.; Huckins, J.F.; Kelley, W.M.; Heatherton, T.F.; Campbell, A.T. Tracking Depression Dynamics in College Students Using Mobile Phone and Wearable Sensing. Proc. ACM Interact. Mob. Wearable Ubiquitous Technol. 2018, 2, 1–26. [Google Scholar] [CrossRef]
- Xu, X.; Chikersal, P.; Doryab, A.; Villalba, D.K.; Dutcher, J.M.; Tumminia, M.J.; Althoff, T.; Cohen, S.; Creswell, K.G.; Creswell, J.D.; et al. Leveraging Routine Behavior and Contextually-Filtered Features for Depression Detection among College Students. Proc. ACM Interact. Mob. Wearable Ubiquitous Technol. 2019, 3, 1–33. [Google Scholar] [CrossRef]
- Masud, M.T.; Rahman, N.; Alam, A.; Griffiths, M.D.; Alamin, M. Non-Pervasive Monitoring of Daily-Life Behavior to Access Depressive Symptom Severity Via Smartphone Technology. In Proceedings of the 2020 IEEE Region 10 Symposium (TENSYMP), Dhaka, Bangladesh, 5–7 June 2020; pp. 602–607. [Google Scholar] [CrossRef]
- Ware, S.; Yue, C.; Morillo, R.; Lu, J.; Shang, C.; Bi, J.; Kamath, J.; Russell, A.; Bamis, A.; Wang, B. Predicting depressive symptoms using smartphone data. Smart Health 2020, 15, 100093. [Google Scholar] [CrossRef]
- Masud, M.T.; Mamun, M.A.; Thapa, K.; Lee, D.; Griffiths, M.D.; Yang, S.H. Unobtrusive monitoring of behavior and movement patterns to detect clinical depression severity level via smartphone. J. Biomed. Inform. 2020, 103, 103371. [Google Scholar] [CrossRef]
- Chikersal, P.; Doryab, A.; Tumminia, M.; Villalba, D.K.; Dutcher, J.M.; Liu, X.; Cohen, S.; Creswell, K.G.; Mankoff, J.; Creswell, J.D.; et al. Detecting Depression and Predicting Its Onset Using Longitudinal Symptoms Captured by Passive Sensing: A Machine Learning Approach With Robust Feature Selection. ACM Trans. Comput. Hum. Interact. 2021, 28. [Google Scholar] [CrossRef]
- Xu, X.; Chikersal, P.; Dutcher, J.M.; Sefidgar, Y.S.; Seo, W.; Tumminia, M.J.; Villalba, D.K.; Cohen, S.; Creswell, K.G.; Creswell, J.D.; et al. Leveraging Collaborative-Filtering for Personalized Behavior Modeling: A Case Study of Depression Detection among College Students. Proc. ACM Interact. Mob. Wearable Ubiquitous Technol. 2021, 5, 1–27. [Google Scholar] [CrossRef]
- Yan, R.; Liu, X.; Dutcher, J.; Tumminia, M.; Villalba, D.; Cohen, S.; Creswell, D.; Creswell, K.; Mankoff, J.; Dey, A.; et al. A Computational Framework for Modeling Biobehavioral Rhythms from Mobile and Wearable Data Streams. ACM Trans. Intell. Syst. Technol. 2022, 13, 1–7. [Google Scholar] [CrossRef]
- Opoku Asare, K.; Moshe, I.; Terhorst, Y.; Vega, J.; Hosio, S.; Baumeister, H.; Pulkki-Råback, L.; Ferreira, D. Mood ratings and digital biomarkers from smartphone and wearable data differentiates and predicts depression status: A longitudinal data analysis. Pervasive Mob. Comput. 2022, 83, 101621. [Google Scholar] [CrossRef]
- Suruliraj, B.; Orji, R. Federated Learning Framework for Mobile Sensing Apps in Mental Health. In Proceedings of the 2022 IEEE 10th International Conference on Serious Games and Applications for Health (SeGAH), Sydney, Australia, 10–12 August 2022; pp. 1–7. [Google Scholar] [CrossRef]
- Hong, J.; Kim, J.; Kim, S.; Oh, J.; Lee, D.; Lee, S.; Uh, J.; Yoon, J.; Choi, Y. Depressive Symptoms Feature-Based Machine Learning Approach to Predicting Depression Using Smartphone. Healthcare 2022, 10, 1189. [Google Scholar] [CrossRef]
- Kathan, A.; Harrer, M.; Küster, L.; Triantafyllopoulos, A.; He, X.; Milling, M.; Gerczuk, M.; Yan, T.; Rajamani, S.T.; Heber, E.; et al. Personalised depression forecasting using mobile sensor data and ecological momentary assessment. Front. Digit. Health 2022, 4, 964582. [Google Scholar] [CrossRef] [PubMed]
- Kim, J.S.; Wang, B.; Kim, M.; Lee, J.; Kim, H.; Roh, D.; Lee, K.H.; Hong, S.B.; Lim, J.S.; Kim, J.W.; et al. Prediction of Diagnosis and Treatment Response in Adolescents With Depression by Using a Smartphone App and Deep Learning Approaches: Usability Study. JMIR Form. Res. 2023, 7, e45991. [Google Scholar] [CrossRef] [PubMed]
- Liu, Y.; Kang, K.D.; Doe, M.J. HADD: High-Accuracy Detection of Depressed Mood. Technologies 2022, 10, 123. [Google Scholar] [CrossRef]
- Mullick, T.; Radovic, A.; Shaaban, S.; Doryab, A. Predicting Depression in Adolescents Using Mobile and Wearable Sensors: Multimodal Machine Learning–Based Exploratory Study. JMIR Form. Res. 2022, 6, e35807. [Google Scholar] [CrossRef]
- Gerych, W.; Agu, E.; Rundensteiner, E. Classifying Depression in Imbalanced Datasets Using an Autoencoder- Based Anomaly Detection Approach. In Proceedings of the 2019 IEEE 13th International Conference on Semantic Computing (ICSC), Newport Beach, CA, USA, 30 January–1 February 2019; pp. 124–127. [Google Scholar] [CrossRef]
- Opoku Asare, K.; Visuri, A.; Vega, J.; Ferreira, D. Me in the Wild: An Exploratory Study Using Smartphones to Detect the Onset of Depression. In Proceedings of the Wireless Mobile Communication and Healthcare, Virtual, 30 November–2 December 2022; Gao, X., Jamalipour, A., Guo, L., Eds.; Springer: Cham, Switzerland, 2022; pp. 121–145. [Google Scholar]
- Otte Andersen, T.; Skovlund Dissing, A.; Rosenbek Severinsen, E.; Kryger Jensen, A.; Thanh Pham, V.; Varga, T.V.; Hulvej Rod, N. Predicting stress and depressive symptoms using high-resolution smartphone data and sleep behavior in Danish adults. Sleep 2022, 45, zsac067. [Google Scholar] [CrossRef]
- Tabassum, N.; Ahmed, M.; Shorna, N.J.; Sowad, M.M.U.R.; Haque, H.M.Z. Depression Detection Through Smartphone Sensing: A Federated Learning Approach. Int. J. Interact. Mob. Technol. (iJIM) 2023, 17, 40–56. [Google Scholar] [CrossRef]
- Narziev, N.; Goh, H.; Toshnazarov, K.; Lee, S.A.; Chung, K.M.; Noh, Y. STDD: Short-Term Depression Detection with Passive Sensing. Sensors 2020, 20, 1396. [Google Scholar] [CrossRef] [PubMed]
- Yan, Y.; Tu, M.; Wen, H. A CNN Model with Discretized Mobile Features for Depression Detection. In Proceedings of the 2022 IEEE-EMBS International Conference on Wearable and Implantable Body Sensor Networks (BSN), Ioannina, Greece, 27–30 September 2022; pp. 1–4. [Google Scholar] [CrossRef]
- Zou, B.; Zhang, X.; Xiao, L.; Bai, R.; Li, X.; Liang, H.; Ma, H.; Wang, G. Sequence Modeling of Passive Sensing Data for Treatment Response Prediction in Major Depressive Disorder. IEEE Trans. Neural Syst. Rehabil. Eng. 2023, 31, 1786–1795. [Google Scholar] [CrossRef] [PubMed]
- Hassantabar, S.; Zhang, J.; Yin, H.; Jha, N.K. MHDeep: Mental Health Disorder Detection System Based on Wearable Sensors and Artificial Neural Networks. ACM Trans. Embed. Comput. Syst. 2022, 21, 1–22. [Google Scholar] [CrossRef]
- Liu, S.; Vahedian, F.; Hachen, D.; Lizardo, O.; Poellabauer, C.; Striegel, A.; Milenković, T. Heterogeneous Network Approach to Predict Individuals’ Mental Health. ACM Trans. Knowl. Discov. Data 2021, 15, 1–26. [Google Scholar] [CrossRef]
- Grimm, B.; Talbot, B.; Larsen, L. PHQ-V/GAD-V: Assessments to Identify Signals of Depression and Anxiety from Patient Video Responses. Appl. Sci. 2022, 12, 9150. [Google Scholar] [CrossRef]
- Currey, D.; Torous, J. Digital phenotyping correlations in larger mental health samples: Analysis and replication. BJPsych Open 2022, 8, e106. [Google Scholar] [CrossRef]
- Wang, W.; Nepal, S.; Huckins, J.F.; Hernandez, L.; Vojdanovski, V.; Mack, D.; Plomp, J.; Pillai, A.; Obuchi, M.; daSilva, A.; et al. First-Gen Lens: Assessing Mental Health of First-Generation Students across Their First Year at College Using Mobile Sensing. Proc. ACM Interact. Mob. Wearable Ubiquitous Technol. 2022, 6, 1–32. [Google Scholar] [CrossRef]
- Thakur, S.S.; Roy, R.B. Predicting mental health using smart-phone usage and sensor data. J. Ambient. Intell. Humaniz. Comput. 2021, 12, 9145–9161. [Google Scholar] [CrossRef]
- Choi, J.; Lee, S.; Kim, S.; Kim, D.; Kim, H. Depressed Mood Prediction of Elderly People with a Wearable Band. Sensors 2022, 22, 4174. [Google Scholar] [CrossRef]
- Dai, R.; Kannampallil, T.; Kim, S.; Thornton, V.; Bierut, L.; Lu, C. Detecting Mental Disorders with Wearables: A Large Cohort Study. In Proceedings of the 8th ACM/IEEE Conference on Internet of Things Design and Implementation (IoTDI ’23), San Antonio, TX, USA, 9–12 May 2023; Association for Computing Machinery: New York, NY, USA, 2023; pp. 39–51. [Google Scholar] [CrossRef]
- Dai, R.; Kannampallil, T.; Zhang, J.; Lv, N.; Ma, J.; Lu, C. Multi-Task Learning for Randomized Controlled Trials: A Case Study on Predicting Depression with Wearable Data. Proc. ACM Interact. Mob. Wearable Ubiquitous Technol. 2022, 6, 1–23. [Google Scholar] [CrossRef]
- Horwitz, A.; Czyz, E.; Al-Dajani, N.; Dempsey, W.; Zhao, Z.; Nahum-Shani, I.; Sen, S. Utilizing daily mood diaries and wearable sensor data to predict depression and suicidal ideation among medical interns. J. Affect. Disord. 2022, 313, 1–7. [Google Scholar] [CrossRef] [PubMed]
- Horwitz, A.G.; Kentopp, S.D.; Cleary, J.; Ross, K.; Wu, Z.; Sen, S.; Czyz, E.K. Using machine learning with intensive longitudinal data to predict depression and suicidal ideation among medical interns over time. Psychol. Med. 2022, 53, 5778–5785. [Google Scholar] [CrossRef]
- Shah, A.P.; Vaibhav, V.; Sharma, V.; Al Ismail, M.; Girard, J.; Morency, L.P. Multimodal Behavioral Markers Exploring Suicidal Intent in Social Media Videos. In Proceedings of the 2019 International Conference on Multimodal Interaction (ICMI ’19), Suzhou, China, 14–18 October 2019; Association for Computing Machinery: New York, NY, USA, 2019; pp. 409–413. [Google Scholar] [CrossRef]
- Belouali, A.; Gupta, S.; Sourirajan, V.; Yu, J.; Allen, N.; Alaoui, A.; Dutton, M.A.; Reinhard, M.J. Acoustic and language analysis of speech for suicidal ideation among US veterans. BioData Min. 2021, 14, 11. [Google Scholar] [CrossRef] [PubMed]
- Mishra, R.; Prakhar Sinha, P.; Sawhney, R.; Mahata, D.; Mathur, P.; Ratn Shah, R. SNAP-BATNET: Cascading Author Profiling and Social Network Graphs for Suicide Ideation Detection on Social Media. In Proceedings of the 2019 Conference of the North American Chapter of the Association for Computational Linguistics: Student Research Workshop, Dublin, Ireland, 22–27 May 2019; Association for Computational Linguistics: Minneapolis, MN, USA, 2019; pp. 147–156. [Google Scholar] [CrossRef]
- Ramírez-Cifuentes, D.; Freire, A.; Baeza-Yates, R.; Puntí, J.; Medina-Bravo, P.; Velazquez, D.A.; Gonfaus, J.M.; Gonzàlez, J. Detection of suicidal ideation on social media: Multimodal, relational, and behavioral analysis. J. Med. Internet Res. 2020, 22, e17758. [Google Scholar] [CrossRef]
- Cao, L.; Zhang, H.; Feng, L. Building and Using Personal Knowledge Graph to Improve Suicidal Ideation Detection on Social Media. IEEE Trans. Multimed. 2022, 24, 87–102. [Google Scholar] [CrossRef]
- Chatterjee, M.; Kumar, P.; Samanta, P.; Sarkar, D. Suicide ideation detection from online social media: A multi-modal feature based technique. Int. J. Inf. Manag. Data Insights 2022, 2, 100103. [Google Scholar] [CrossRef]
- Li, Z.; Cheng, W.; Zhou, J.; An, Z.; Hu, B. Deep learning model with multi-feature fusion and label association for suicide detection. Multimed. Syst. 2023, 29, 2193–2203. [Google Scholar] [CrossRef]
- Heckler, W.F.; Feijó, L.P.; de Carvalho, J.V.; Barbosa, J.L.V. Thoth: An intelligent model for assisting individuals with suicidal ideation. Expert Syst. Appl. 2023, 233, 120918. [Google Scholar] [CrossRef]
- Czyz, E.K.; King, C.A.; Al-Dajani, N.; Zimmermann, L.; Hong, V.; Nahum-Shani, I. Ecological Momentary Assessments and Passive Sensing in the Prediction of Short-Term Suicidal Ideation in Young Adults. JAMA Netw. Open 2023, 6, e2328005. [Google Scholar] [CrossRef]
- Syed, Z.S.; Sidorov, K.; Marshall, D. Automated Screening for Bipolar Disorder from Audio/Visual Modalities. In Proceedings of the 2018 on Audio/Visual Emotion Challenge and Workshop, Seoul, Republic of Korea, 22 October 2022; Association for Computing Machinery: New York, NY, USA, 2018; pp. 39–45. [Google Scholar] [CrossRef]
- Yang, L.; Li, Y.; Chen, H.; Jiang, D.; Oveneke, M.C.; Sahli, H. Bipolar Disorder Recognition with Histogram Features of Arousal and Body Gestures. In Proceedings of the 2018 on Audio/Visual Emotion Challenge and Workshop (AVEC’18), Seoul, Republic of Korea, 22 October 2018; Association for Computing Machinery: New York, NY, USA, 2018; pp. 15–21. [Google Scholar] [CrossRef]
- Xing, X.; Cai, B.; Zhao, Y.; Li, S.; He, Z.; Fan, W. Multi-Modality Hierarchical Recall Based on GBDTs for Bipolar Disorder Classification. In Proceedings of the 2018 on Audio/Visual Emotion Challenge and Workshop (AVEC’18), Seoul, Republic of Korea, 22 October 2018; Association for Computing Machinery: New York, NY, USA, 2018; pp. 31–37. [Google Scholar] [CrossRef]
- Cao, S.; Yan, H.; Rao, P.; Zhao, K.; Yu, X.; He, J.; Yu, L.; Xiao, Y. Bipolar Disorder Classification Based on Multimodal Recordings. In Proceedings of the 2021 10th International Conference on Computing and Pattern Recognition (ICCPR 2021), Shanghai, China, 15–17 October 2022; Association for Computing Machinery: New York, NY, USA, 2022; pp. 188–194. [Google Scholar] [CrossRef]
- AbaeiKoupaei, N.; Osman, H.A. Multimodal Semi-supervised Bipolar Disorder Classification. In Proceedings of the Intelligent Data Engineering and Automated Learning—IDEAL 2021, Manchester, UK, 25 November 2021; Yin, H., Camacho, D., Tino, P., Allmendinger, R., Tallón-Ballesteros, A.J., Tang, K., Cho, S.B., Novais, P., Nascimento, S., Eds.; Springer: Cham, Switzerland, 2021; pp. 575–586. [Google Scholar]
- AbaeiKoupaei, N.; Al Osman, H. A Multi-Modal Stacked Ensemble Model for Bipolar Disorder Classification. IEEE Trans. Affect. Comput. 2023, 14, 236–244. [Google Scholar] [CrossRef]
- Baki, P.; Kaya, H.; Çiftçi, E.; Güleç, H.; Salah, A.A. A Multimodal Approach for Mania Level Prediction in Bipolar Disorder. IEEE Trans. Affect. Comput. 2022, 13, 2119–2131. [Google Scholar] [CrossRef]
- Sivagnanam, L.; Visalakshi, N.K. Multimodal Machine Learning Framework to Detect the Bipolar Disorder. In Advances in Parallel Computing Algorithms, Tools and Paradigms; IOS Press: Amsterdam, The Netherlands, 2022. [Google Scholar] [CrossRef]
- Su, H.Y.; Wu, C.H.; Liou, C.R.; Lin, E.C.L.; See Chen, P. Assessment of Bipolar Disorder Using Heterogeneous Data of Smartphone-Based Digital Phenotyping. In Proceedings of the ICASSP 2021–2021 IEEE International Conference on Acoustics, Speech and Signal Processing (ICASSP), Toronto, ON, Canada, 6–11 June 2021; pp. 4260–4264. [Google Scholar] [CrossRef]
- Duwairi, R.; Halloush, Z. A Multi-View Learning Approach for Detecting Personality Disorders Among Arab Social Media Users. ACM Trans. Asian Low-Resour. Lang. Inf. Process. 2023, 22, 1–19. [Google Scholar] [CrossRef]
- Bennett, C.C.; Ross, M.K.; Baek, E.; Kim, D.; Leow, A.D. Predicting clinically relevant changes in bipolar disorder outside the clinic walls based on pervasive technology interactions via smartphone typing dynamics. Pervasive Mob. Comput. 2022, 83, 101598. [Google Scholar] [CrossRef]
- Richter, V.; Neumann, M.; Kothare, H.; Roesler, O.; Liscombe, J.; Suendermann-Oeft, D.; Prokop, S.; Khan, A.; Yavorsky, C.; Lindenmayer, J.P.; et al. Towards Multimodal Dialog-Based Speech & Facial Biomarkers of Schizophrenia. In Proceedings of the Companion Publication of the 2022 International Conference on Multimodal Interaction (ICMI ’22 Companion), Montreal, QC, Canada, 18–22 October 2022; Association for Computing Machinery: New York, NY, USA, 2022; pp. 171–176. [Google Scholar] [CrossRef]
- Birnbaum, M.L.; Norel, R.; Van Meter, A.; Ali, A.F.; Arenare, E.; Eyigoz, E.; Agurto, C.; Germano, N.; Kane, J.M.; Cecchi, G.A. Identifying signals associated with psychiatric illness utilizing language and images posted to Facebook. npj Schizophr. 2020, 6, 38. [Google Scholar] [CrossRef]
- Wang, R.; Aung, M.S.H.; Abdullah, S.; Brian, R.; Campbell, A.T.; Choudhury, T.; Hauser, M.; Kane, J.; Merrill, M.; Scherer, E.A.; et al. CrossCheck: Toward Passive Sensing and Detection of Mental Health Changes in People with Schizophrenia. In Proceedings of the 2016 ACM International Joint Conference on Pervasive and Ubiquitous Computing (UbiComp ’16), Heidelberg, Germany, 12–16 September 2016; Association for Computing Machinery: New York, NY, USA, 2016; pp. 886–897. [Google Scholar] [CrossRef]
- Wang, R.; Wang, W.; Aung, M.S.H.; Ben-Zeev, D.; Brian, R.; Campbell, A.T.; Choudhury, T.; Hauser, M.; Kane, J.; Scherer, E.A.; et al. Predicting Symptom Trajectories of Schizophrenia Using Mobile Sensing. Proc. ACM Interact. Mob. Wearable Ubiquitous Technol. 2017, 1, 1–24. [Google Scholar] [CrossRef]
- Tseng, V.W.S.; Sano, A.; Ben-Zeev, D.; Brian, R.; Campbell, A.T.; Hauser, M.; Kane, J.M.; Scherer, E.A.; Wang, R.; Wang, W.; et al. Using behavioral rhythms and multi-task learning to predict fine-grained symptoms of schizophrenia. Sci. Rep. 2020, 10, 15100. [Google Scholar] [CrossRef]
- Lamichhane, B.; Zhou, J.; Sano, A. Psychotic Relapse Prediction in Schizophrenia Patients Using A Personalized Mobile Sensing-Based Supervised Deep Learning Model. IEEE J. Biomed. Health Inform. 2023, 27, 3246–3257. [Google Scholar] [CrossRef]
- Zhou, J.; Lamichhane, B.; Ben-Zeev, D.; Campbell, A.; Sano, A. Predicting Psychotic Relapse in Schizophrenia With Mobile Sensor Data: Routine Cluster Analysis. JMIR mHealth uHealth 2022, 10, e31006. [Google Scholar] [CrossRef]
- Osipov, M.; Behzadi, Y.; Kane, J.M.; Petrides, G.; Clifford, G.D. Objective identification and analysis of physiological and behavioral signs of schizophrenia. J. Ment. Health 2015, 24, 276–282. [Google Scholar] [CrossRef]
- Teferra, B.G.; Borwein, S.; DeSouza, D.D.; Rose, J. Screening for Generalized Anxiety Disorder From Acoustic and Linguistic Features of Impromptu Speech: Prediction Model Evaluation Study. JMIR Form. Res. 2022, 6, e39998. [Google Scholar] [CrossRef]
- Choudhary, S.; Thomas, N.; Alshamrani, S.; Srinivasan, G.; Ellenberger, J.; Nawaz, U.; Cohen, R. A Machine Learning Approach for Continuous Mining of Nonidentifiable Smartphone Data to Create a Novel Digital Biomarker Detecting Generalized Anxiety Disorder: Prospective Cohort Study. JMIR Med. Inform. 2022, 10, e38943. [Google Scholar] [CrossRef] [PubMed]
- Ding, Y.; Liu, J.; Zhang, X.; Yang, Z. Dynamic Tracking of State Anxiety via Multi-Modal Data and Machine Learning. Front. Psychiatry 2022, 13, 757961. [Google Scholar] [CrossRef] [PubMed]
- Chen, C.P.; Gau, S.S.F.; Lee, C.C. Learning Converse-Level Multimodal Embedding to Assess Social Deficit Severity for Autism Spectrum Disorder. In Proceedings of the 2020 IEEE International Conference on Multimedia and Expo (ICME), London, UK, 6–10 July 2020; pp. 1–6. [Google Scholar] [CrossRef]
- Khullar, V.; Singh, H.P.; Bala, M. Meltdown/Tantrum Detection System for Individuals with Autism Spectrum Disorder. Appl. Artif. Intell. 2021, 35, 1708–1732. [Google Scholar] [CrossRef]
- Mallol-Ragolta, A.; Dhamija, S.; Boult, T.E. A Multimodal Approach for Predicting Changes in PTSD Symptom Severity. In Proceedings of the 20th ACM International Conference on Multimodal Interaction (ICMI ’18), Boulder, CA, USA, 16–18 October 2018; Association for Computing Machinery: New York, NY, USA, 2018; pp. 324–333. [Google Scholar] [CrossRef]
- Tébar, B.; Gopalan, A. Early Detection of Eating Disorders using Social Media. In Proceedings of the 2021 IEEE/ACM Conference on Connected Health: Applications, Systems and Engineering Technologies (CHASE), Orlando, FL, USA, 16–17 December 2021; pp. 193–198. [Google Scholar] [CrossRef]
- Abuhassan, M.; Anwar, T.; Liu, C.; Jarman, H.K.; Fuller-Tyszkiewicz, M. EDNet: Attention-Based Multimodal Representation for Classification of Twitter Users Related to Eating Disorders. In Proceedings of the ACM Web Conference 2023 (WWW ’23), Houston, TX, USA, 3–6 September 2023; Association for Computing Machinery: New York, NY, USA, 2023; pp. 4065–4074. [Google Scholar] [CrossRef]
- Noguero, D.S.; Ramírez-Cifuentes, D.; Ríssola, E.A.; Freire, A. Gender Bias When Using Artificial Intelligence to Assess Anorexia Nervosa on Social Media: Data-Driven Study. J. Med. Internet Res. 2023, 25, e45184. [Google Scholar] [CrossRef] [PubMed]
- Xu, Z.; Pérez-Rosas, V.; Mihalcea, R. Inferring Social Media Users’ Mental Health Status from Multimodal Information. In Proceedings of the Twelfth Language Resources and Evaluation Conference, Marseille, France, 11–16 May 2020; European Language Resources Association: Marseille, France, 2020; pp. 6292–6299. [Google Scholar]
- Meng, X.; Zhang, J.; Ren, G. The evaluation model of college students’ mental health in the environment of independent entrepreneurship using neural network technology. J. Healthc. Eng. 2021, 2021, 4379623. [Google Scholar] [CrossRef] [PubMed]
- Singh, V.K.; Long, T. Automatic assessment of mental health using phone metadata. Proc. Assoc. Inf. Sci. Technol. 2018, 55, 450–459. [Google Scholar] [CrossRef]
- Park, J.; Arunachalam, R.; Silenzio, V.; Singh, V.K. Fairness in Mobile Phone–Based Mental Health Assessment Algorithms: Exploratory Study. JMIR Form. Res. 2022, 6, e34366. [Google Scholar] [CrossRef]
- Liu, S. 3D Illustration of Cartoon Characters Talking And Discussing. Communication and Talking Concept. 3D Rendering on White Background. 2022. Available online: https://www.istockphoto.com/photo/3d-illustration-of-cartoon-characters-talking-and-discussing-communication-and-gm1428415103-471910717 (accessed on 22 November 2023).
- Arefin, S. Social Media. 2014. Available online: https://www.flickr.com/photos/54888897@N05/5102912860/ (accessed on 10 December 2023).
- Secret, A. Hand Holding Phone with Social Media Icon Stock Photo. 2021. Available online: https://www.istockphoto.com/photo/hand-holding-phone-with-social-media-icon-gm1351107098-426983736?phrase=smartphone+cartoon (accessed on 10 December 2023).
- Adventtr. Health Monitoring Information on Generic Smartwatch Screen Stock Photo. 2021. Available online: https://www.istockphoto.com/photo/health-monitoring-information-on-generic-smartwatch-screen-gm1307154121-397513158?utm_source=flickr&utm_medium=affiliate&utm_campaign=srp_photos_top&utm_term=smartphone+and+wearable+cartoon&utm_content=https%3A%2F%2Fwww.flickr.com%2Fsearch%2F&ref=sponsored (accessed on 10 December 2023).
- Gratch, J.; Artstein, R.; Lucas, G.; Stratou, G.; Scherer, S.; Nazarian, A.; Wood, R.; Boberg, J.; DeVault, D.; Marsella, S.; et al. Th Distress Analysis Interview Corpus of human and computer interviews. In Proceedings of the Ninth International Conference on Language Resources and Evaluation (LREC’14), Reykjavik, Iceland, 26–31 May 2014; European Language Resources Association (ELRA): Reykjavik, Iceland, 2014; pp. 3123–3128. [Google Scholar]
- Suendermann-Oeft, D.; Robinson, A.; Cornish, A.; Habberstad, D.; Pautler, D.; Schnelle-Walka, D.; Haller, F.; Liscombe, J.; Neumann, M.; Merrill, M.; et al. NEMSI: A Multimodal Dialog System for Screening of Neurological or Mental Conditions. In Proceedings of the 19th ACM International Conference on Intelligent Virtual Agents (IVA ’19), Paris, France, 2–5 July 2019; Association for Computing Machinery: New York, NY, USA, 2019; pp. 245–247. [Google Scholar] [CrossRef]
- Çiftçi, E.; Kaya, H.; Güleç, H.; Salah, A.A. The Turkish Audio-Visual Bipolar Disorder Corpus. In Proceedings of the 2018 First Asian Conference on Affective Computing and Intelligent Interaction (ACII Asia), Beijing, China, 20–22 May 2018; pp. 1–6. [Google Scholar] [CrossRef]
- Yates, A.; Cohan, A.; Goharian, N. Depression and Self-Harm Risk Assessment in Online Forums. In Proceedings of the 2017 Conference on Empirical Methods in Natural Language Processing (EMNLP), Copenhagen, Denmark, 7—11 September 2017; Association for Computational Linguistics: Copenhagen, Denmark, 2017; pp. 2958–2968. [Google Scholar]
- Schueller, S.M.; Begale, M.; Penedo, F.J.; Mohr, D.C. Purple: A Modular System for Developing and Deploying Behavioral Intervention Technologies. J. Med. Internet Res. 2014, 16, e181. [Google Scholar] [CrossRef]
- Farhan, A.A.; Yue, C.; Morillo, R.; Ware, S.; Lu, J.; Bi, J.; Kamath, J.; Russell, A.; Bamis, A.; Wang, B. Behavior vs. introspection: Refining prediction of clinical depression via smartphone sensing data. In Proceedings of the 2016 IEEE Wireless Health (WH), Bethesda, MD, USA, 25–27 October 2016; pp. 1–8. [Google Scholar] [CrossRef]
- Montag, C.; Baumeister, H.; Kannen, C.; Sariyska, R.; Meßner, E.M.; Brand, M. Concept, Possibilities and Pilot-Testing of a New Smartphone Application for the Social and Life Sciences to Study Human Behavior Including Validation Data from Personality Psychology. J 2019, 2, 102–115. [Google Scholar] [CrossRef]
- Bai, R.; Xiao, L.; Guo, Y.; Zhu, X.; Li, N.; Wang, Y.; Chen, Q.; Feng, L.; Wang, Y.; Yu, X.; et al. Tracking and Monitoring Mood Stability of Patients With Major Depressive Disorder by Machine Learning Models Using Passive Digital Data: Prospective Naturalistic Multicenter Study. JMIR Mhealth Uhealth 2021, 9, e24365. [Google Scholar] [CrossRef]
- Ferreira, D.; Kostakos, V.; Dey, A.K. AWARE: Mobile Context Instrumentation Framework. Front. ICT 2015, 2, 6. [Google Scholar] [CrossRef]
- Wang, R.; Chen, F.; Chen, Z.; Li, T.; Harari, G.; Tignor, S.; Zhou, X.; Ben-Zeev, D.; Campbell, A.T. StudentLife: Assessing Mental Health, Academic Performance and Behavioral Trends of College Students Using Smartphones. In Proceedings of the 2014 ACM International Joint Conference on Pervasive and Ubiquitous Computing (UbiComp ’14), Seattle, WA, USA, 13–17 September 2014; Association for Computing Machinery: New York, NY, USA, 2014; pp. 3–14. [Google Scholar] [CrossRef]
- Ringeval, F.; Schuller, B.; Valstar, M.; Gratch, J.; Cowie, R.; Scherer, S.; Mozgai, S.; Cummins, N.; Schmitt, M.; Pantic, M. AVEC 2017: Real-Life Depression, and Affect Recognition Workshop and Challenge. In Proceedings of the 7th Annual Workshop on Audio/Visual Emotion Challenge (AVEC ’17), Mountain View, CA, USA, 23–27 October 2017; Association for Computing Machinery: New York, NY, USA, 2017; pp. 3–9. [Google Scholar] [CrossRef]
- Ringeval, F.; Schuller, B.; Valstar, M.; Cummins, N.; Cowie, R.; Tavabi, L.; Schmitt, M.; Alisamir, S.; Amiriparian, S.; Messner, E.M.; et al. AVEC 2019 Workshop and Challenge: State-of-Mind, Detecting Depression with AI, and Cross-Cultural Affect Recognition. In Proceedings of the 9th International on Audio/Visual Emotion Challenge and Workshop (AVEC ’19), Nice, France, 21–25 October 2019; Association for Computing Machinery: New York, NY, USA, 2019; pp. 3–12. [Google Scholar] [CrossRef]
- Dhamija, S.; Boult, T.E. Exploring Contextual Engagement for Trauma Recovery. In Proceedings of the 2017 IEEE Conference on Computer Vision and Pattern Recognition Workshops (CVPRW), Honolulu, HI, USA, 21–26 July 2017; pp. 2267–2277. [Google Scholar] [CrossRef]
- Orton, I. Vision based body gesture meta features for Affective Computing. arXiv 2020, arXiv:2003.00809. [Google Scholar]
- Cohan, A.; Desmet, B.; Yates, A.; Soldaini, L.; MacAvaney, S.; Goharian, N. SMHD: A Large-Scale Resource for Exploring Online Language Usage for Multiple Mental Health Conditions. In Proceedings of the 27th International Conference on Computational Linguistics (COLING), Santa Fe, NM, USA, 20–26 August 2018; Association for Computational Linguistics: Dublin, Ireland, 2018; pp. 1485–1497. [Google Scholar]
- Cao, L.; Zhang, H.; Feng, L.; Wei, Z.; Wang, X.; Li, N.; He, X. Latent Suicide Risk Detection on Microblog via Suicide-Oriented Word Embeddings and Layered Attention. In Proceedings of the 2019 Conference on Empirical Methods in Natural Language Processing and the 9th International Joint Conference on Natural Language Processing (EMNLP-IJCNLP), Bali, Indonesia, 8–12 December 2019; Association for Computational Linguistics: Dublin, Ireland, 2019; pp. 1718–1728. [Google Scholar] [CrossRef]
- Wang, X.; Chen, S.; Li, T.; Li, W.; Zhou, Y.; Zheng, J.; Zhang, Y.; Tang, B. Assessing depression risk in Chinese microblogs: A corpus and machine learning methods. In Proceedings of the 2019 IEEE International Conference on Healthcare Informatics (ICHI), Xi’an, China, 10–13 June 2019; pp. 1–5. [Google Scholar] [CrossRef]
- Losada, D.E.; Crestani, F. A Test Collection for Research on Depression and Language Use. In Proceedings of the 7th International Conference of the Cross-Language Evaluation Forum for European Languages, Evora, Portugal, 5–8 September 2016; Experimental IR Meets Multilinguality, Multimodality, and Interaction. Springer: Cham, Switzerland, 2016; pp. 28–39. [Google Scholar]
- Losada, D.E.; Crestani, F.; Parapar, J. Overview of eRisk: Early Risk Prediction on the Internet. In Proceedings of the Experimental IR Meets Multilinguality, Multimodality, and Interaction, Avignon, France, 10–14 September 2018; Bellot, P., Trabelsi, C., Mothe, J., Murtagh, F., Nie, J.Y., Soulier, L., SanJuan, E., Cappellato, L., Ferro, N., Eds.; Springer: Cham, Switzerland, 2018; pp. 343–361. [Google Scholar]
- Vesel, C.; Rashidisabet, H.; Zulueta, J.; Stange, J.P.; Duffecy, J.; Hussain, F.; Piscitello, A.; Bark, J.; Langenecker, S.A.; Young, S.; et al. Effects of mood and aging on keystroke dynamics metadata and their diurnal patterns in a large open-science sample: A BiAffect iOS study. J. Am. Med. Inform. Assoc. 2020, 27, 1007–1018. [Google Scholar] [CrossRef] [PubMed]
- Mattingly, S.M.; Gregg, J.M.; Audia, P.; Bayraktaroglu, A.E.; Campbell, A.T.; Chawla, N.V.; Das Swain, V.; De Choudhury, M.; D’Mello, S.K.; Dey, A.K.; et al. The Tesserae Project: Large-Scale, Longitudinal, In Situ, Multimodal Sensing of Information Workers. In Proceedings of the Extended Abstracts of the 2019 CHI Conference on Human Factors in Computing Systems (CHI EA ’19), Glasgow, UK, 4–9 May 2019; Association for Computing Machinery: New York, NY, USA, 2019; pp. 1–8. [Google Scholar] [CrossRef]
- Coppersmith, G.; Dredze, M.; Harman, C.; Hollingshead, K.; Mitchell, M. CLPsych 2015 Shared Task: Depression and PTSD on Twitter. In Proceedings of the 2nd Workshop on Computational Linguistics and Clinical Psychology: From Linguistic Signal to Clinical Reality, Denver CO, USA, 31 July 2015; Association for Computational Linguistics: Denver, CO, USA, 2015; pp. 31–39. [Google Scholar] [CrossRef]
- Denny, J.C.; Rutter, J.L.; Goldstein, D.B.; Philippakis, A.; Smoller, J.W.; Jenkins, G.; Dishman, E. The “All of Us” Research Program. New Engl. J. Med. 2019, 381, 668–676. [Google Scholar] [CrossRef] [PubMed]
- Ramírez-Cifuentes, D.; Freire, A.; Baeza-Yates, R.; Lamora, N.S.; Álvarez, A.; González-Rodríguez, A.; Rochel, M.L.; Vives, R.L.; Velazquez, D.A.; Gonfaus, J.M.; et al. Characterization of Anorexia Nervosa on Social Media: Textual, Visual, Relational, Behavioral, and Demographical Analysis. J. Med. Internet Res. 2021, 23, e25925. [Google Scholar] [CrossRef] [PubMed]
- Teferra, B.G.; Borwein, S.; DeSouza, D.D.; Simpson, W.; Rheault, L.; Rose, J. Acoustic and Linguistic Features of Impromptu Speech and Their Association With Anxiety: Validation Study. JMIR Ment. Health 2022, 9, e36828. [Google Scholar] [CrossRef]
- Palan, S.; Schitter, C. Prolific.ac—A subject pool for online experiments. J. Behav. Exp. Financ. 2018, 17, 22–27. [Google Scholar] [CrossRef]
- Hamilton, M. A Rating Scale for Depression. J. Neurol. Neurosurg. Psychiatry 1960, 23, 56–62. [Google Scholar] [CrossRef]
- Kroenke, K.; Spitzer, R.L. The PHQ-9: A New Depression Diagnostic and Severity Measure. Psychiatr. Ann. 2002, 32, 509–515. [Google Scholar] [CrossRef]
- Beck, A.T.; Ward, C.H.; Mendelson, M.; Mock, J.; Erbaugh, J. An Inventory for Measuring Depression. Arch. Gen. Psychiatry 1961, 4, 561–571. [Google Scholar] [CrossRef]
- Radloff, L.S. The CES-D Scale: A Self-Report Depression Scale for Research in the General Population. Appl. Psychol. Meas. 1977, 1, 385–401. [Google Scholar] [CrossRef]
- Kroenke, K.; Spitzer, R.L.; Williams, J.B. The PHQ-9: Validity of a brief depression severity measure. J. Gen. Intern. Med. 2001, 16, 606–613. [Google Scholar] [CrossRef] [PubMed]
- Aytar, Y.; Vondrick, C.; Torralba, A. SoundNet: Learning Sound Representations from Unlabeled Video. In Proceedings of the 30th International Conference on Neural Information Processing Systems (NIPS’16), Barcelona, Spain, 5–10 December 2016; Curran Associates Inc.: Red Hook, NY, USA, 2016; pp. 892–900. [Google Scholar]
- Hochreiter, S.; Schmidhuber, J. Long Short-Term Memory. Neural Comput. 1997, 9, 1735–1780. [Google Scholar] [CrossRef] [PubMed]
- Simonyan, K.; Zisserman, A. Very Deep Convolutional Networks for Large-Scale Image Recognition. In Proceedings of the 2nd International Conference on Learning Representations, Banff, AB, Canada, 14–16 April 2014; pp. 892–900. [Google Scholar]
- Deng, J.; Dong, W.; Socher, R.; Li, L.J.; Li, K.; Fei-Fei, L. ImageNet: A large-scale hierarchical image database. In Proceedings of the 2009 IEEE Conference on Computer Vision and Pattern Recognition, Miami, FL, USA, 20–25 June 2009; pp. 248–255. [Google Scholar] [CrossRef]
- Ekman, P. Basic Emotions. In Handbook of Cognition and Emotion; John Wiley & Sons, Ltd.: Hoboken, NJ, USA, 1999; Chapter 3; pp. 45–60. [Google Scholar] [CrossRef]
- Plutchik, R. Chapter 1—A General Psychoevolutionary Theory of Emotion. In Theories of Emotion; Plutchik, R., Kellerman, H., Eds.; Academic Press: Cambridge, MA, USA, 1980; pp. 3–33. [Google Scholar] [CrossRef]
- Perronnin, F.; Sánchez, J.; Mensink, T. Improving the Fisher Kernel for Large-Scale Image Classification. In Proceedings of the Computer Vision (ECCV 2010), Heraklion, Greece, 5–11 September 2010; Daniilidis, K., Maragos, P., Paragios, N., Eds.; Springer: Berlin/Heidelberg, Germany, 2010; pp. 143–156. [Google Scholar]
- Devlin, J.; Chang, M.W.; Lee, K.; Toutanova, K. BERT: Pre-training of Deep Bidirectional Transformers for Language Understanding. In Proceedings of the 2019 Conference of the North American Chapter of the Association for Computational Linguistics: Human Language Technologies, Volume 1 (Long and Short Papers), Minneapolis, MN, USA, 2–7 June 2019; Association for Computational Linguistics: Minneapolis, MN, USA, 2019; pp. 4171–4186. [Google Scholar] [CrossRef]
- Eyben, F.; Wöllmer, M.; Schuller, B. Opensmile: The Munich Versatile and Fast Open-Source Audio Feature Extractor. In Proceedings of the 18th ACM International Conference on Multimedia (MM ’10), Firenze, Italy, 25–29 October 2010; Association for Computing Machinery: New York, NY, USA, 2010; pp. 1459–1462. [Google Scholar] [CrossRef]
- Crocco, M.; Cristani, M.; Trucco, A.; Murino, V. Audio Surveillance: A Systematic Review. ACM Comput. Surv. 2016, 48, 1–46. [Google Scholar] [CrossRef]
- Baltrusaitis, T.; Zadeh, A.; Lim, Y.C.; Morency, L.P. OpenFace 2.0: Facial Behavior Analysis Toolkit. In Proceedings of the 2018 13th IEEE International Conference on Automatic Face & Gesture Recognition (FG 2018), Xi’an, China, 15–19 May 2018. [Google Scholar] [CrossRef]
- Bradski, G. The OpenCV Library. Dr. Dobb’s J. Softw. Tools 2000, 25, 120–123. [Google Scholar]
- Cao, Z.; Simon, T.; Wei, S.E.; Sheikh, Y. Realtime Multi-Person 2D Pose Estimation using Part Affinity Fields. In Proceedings of the IEEE Conference on Computer Vision and Pattern Recognition, Honolulu, HI, USA, 21–26 July 2017. [Google Scholar] [CrossRef]
- Ekman, P.; Friesen, W.V. Facial Action Coding System; Consulting Psychologists Press: Washington, DC, USA, 1978. [Google Scholar] [CrossRef]
- Prince, E.B.; Martin, K.B.; Messinger, D.S. Facial Action Coding System. In The SAGE Encyclopedia of Communication Research Methods; SAGE Publications, Inc.: London, UK, 2017. [Google Scholar] [CrossRef]
- Zhi, R.; Liu, M.; Zhang, D. A comprehensive survey on automatic facial action unit analysis. Vis. Comput. 2020, 36, 1067–1093. [Google Scholar] [CrossRef]
- Lin, C.; Mottaghi, S.; Shams, L. The effects of color and saturation on the enjoyment of real-life images. Psychon. Bull. Rev. 2023, 30, 1–12. [Google Scholar] [CrossRef]
- Valdez, P.; Mehrabian, A. Effects of color on emotions. J. Exp. Psychol. Gen. 1994, 123, 394–409. [Google Scholar] [CrossRef]
- Hashemipour, S.; Ali, M. Amazon Web Services (AWS)—An Overview of the On-Demand Cloud Computing Platform. In Proceedings of the Emerging Technologies in Computing, Virtual, 27–29 August 2020; Miraz, M.H., Excell, P.S., Ware, A., Soomro, S., Ali, M., Eds.; Springer: Cham, Switzerland, 2020; pp. 40–47. [Google Scholar]
- Pennebaker Conglomerates, Inc. Linguistic Inquiry and Word Count: LIWC-22. 2022. Available online: https://www.liwc.app (accessed on 10 December 2023).
- NLP Tools for the Social Sciences. Suite of Automatic Linguistic Analysis Tools (SALAT). 2023. Available online: https://www.linguisticanalysistools.org/ (accessed on 10 December 2023).
- Bird, S.; Loper, E. NLTK: The Natural Language Toolkit. In Proceedings of the ACL Interactive Poster and Demonstration Sessions, Stroudsburg, PA, USA, 21–26 July 2004; Association for Computational Linguistics: Barcelona, Spain, 2004; pp. 214–217. [Google Scholar]
- Manning, C.; Surdeanu, M.; Bauer, J.; Finkel, J.; Bethard, S.; McClosky, D. The Stanford CoreNLP Natural Language Processing Toolkit. In Proceedings of the 52nd Annual Meeting of the Association for Computational Linguistics: System Demonstrations, Baltimore, MD, USA, 22–27 June 2014; Association for Computational Linguistics: Baltimore, MD, USA, 2014; pp. 55–60. [Google Scholar] [CrossRef]
- Crossley, S.A.; Kyle, K.; McNamara, D.S. Sentiment Analysis and Social Cognition Engine (SEANCE): An automatic tool for sentiment, social cognition, and social-order analysis. Behav. Res. Methods 2017, 49, 803–821. [Google Scholar] [CrossRef]
- Bradley, M.M.; Lang, P.J. Affective Norms for English Words (ANEW): Instruction Manual and Affective Ratings; Technical Report C-1; The Center for Research in Psychophysiology, University of Florida: Gainesville, FL, USA, 1999. [Google Scholar]
- Le, Q.; Mikolov, T. Distributed Representations of Sentences and Documents. In Proceedings of the 31st International Conference on International Conference on Machine Learning (ICML’14), Stockholm, Sweden, 10–15 July 2014; Volume 32, pp. II–1188–II–1196. [Google Scholar]
- Yang, Z.; Dai, Z.; Yang, Y.; Carbonell, J.; Salakhutdinov, R.; Le, Q.V. XLNet: Generalized Autoregressive Pretraining for Language Understanding. In Proceedings of the 33rd International Conference on Neural Information Processing Systems, Vancouver, BC, Canada, 8–14 December 2019; Curran Associates Inc.: Red Hook, NY, USA, 2019. [Google Scholar]
- Hakulinen, C.; Elovainio, M.; Pulkki-Råback, L.; Virtanen, M.; Kivimäki, M.; Jokela, M. Personality and depressive symptoms: Individual participant meta-analysis of 10 cohort studies. Depress. Anxiety 2015, 32, 461–470. [Google Scholar] [CrossRef]
- Greenspon, T.S. Is there an Antidote to Perfectionism? Psychol. Sch. 2014, 51, 986–998. [Google Scholar] [CrossRef]
- Clark-Carter, D. z Scores. In Wiley StatsRef: Statistics Reference Online; John Wiley & Sons, Ltd.: Hoboken, NJ, USA, 2014. [Google Scholar] [CrossRef]
- Mahesh, B. Machine Learning Algorithms—A Review. Int. J. Sci. Res. 2020, 9, 381–386. [Google Scholar]
- Wang, S.C. Artificial Neural Network. In Interdisciplinary Computing in Java Programming; Springer: Boston, MA, USA, 2003; pp. 81–100. [Google Scholar] [CrossRef]
- Gu, J.; Wang, Z.; Kuen, J.; Ma, L.; Shahroudy, A.; Shuai, B.; Liu, T.; Wang, X.; Wang, G.; Cai, J.; et al. Recent advances in convolutional neural networks. Pattern Recognit. 2018, 77, 354–377. [Google Scholar] [CrossRef]
- Sagi, O.; Rokach, L. Ensemble learning: A survey. WIREs Data Min. Knowl. Discov. 2018, 8, e1249. [Google Scholar] [CrossRef]
- Schmidhuber, J. Deep learning in neural networks: An overview. Neural Netw. 2015, 61, 85–117. [Google Scholar] [CrossRef] [PubMed]
- Graves, A. Supervised Sequence Labelling With Recurrent Neural Networks. In Studies in Computational Intelligence; Springer: Berlin/Heidelberg, Germany, 2012; Volume 385. [Google Scholar] [CrossRef]
- Vaswani, A.; Shazeer, N.; Parmar, N.; Uszkoreit, J.; Jones, L.; Gomez, A.N.; Kaiser, L.; Polosukhin, I. Attention is All You Need. In Proceedings of the 31st International Conference on Neural Information Processing Systems (NIPS’17), Long Beach, CA, USA, 3–8 December 2017; Curran Associates Inc.: Red Hook, NY, USA, 2017; pp. 6000–6010. [Google Scholar]
- Liu, Y.; Ott, M.; Goyal, N.; Du, J.; Joshi, M.; Chen, D.; Levy, O.; Lewis, M.; Zettlemoyer, L.; Stoyanov, V. RoBERTa: A Robustly Optimized BERT Pretraining Approach. arXiv 2019, arXiv:1907.11692. [Google Scholar]
- Lan, Z.; Chen, M.; Goodman, S.; Gimpel, K.; Sharma, P.; Soricut, R. ALBERT: A Lite BERT for Self-supervised Learning of Language Representations. In Proceedings of the 8th International Conference on Learning Representations, Addis Ababa, Ethiopia, 26–30 April 2020. [Google Scholar]
- Kim, T.; Vossen, P. EmoBERTa: Speaker-Aware Emotion Recognition in Conversation with RoBERTa. arXiv 2021, arXiv:2108.12009. [Google Scholar]
- Rasheed, K.; Qayyum, A.; Ghaly, M.; Al-Fuqaha, A.; Razi, A.; Qadir, J. Explainable, trustworthy, and ethical machine learning for healthcare: A survey. Comput. Biol. Med. 2022, 149, 106043. [Google Scholar] [CrossRef]
- Breiman, L. Random Forests. Mach. Learn. 2001, 45, 5–32. [Google Scholar] [CrossRef]
- Freund, Y.; Schapire, R.E. A desicion-theoretic generalization of on-line learning and an application to boosting. In Proceedings of the Computational Learning Theory, Barcelona, Spain, 13–15 March 1995; Vitányi, P., Ed.; Springer: Berlin/Heidelberg, Germany, 1995; pp. 23–37. [Google Scholar]
- Friedman, J.H. Greedy function approximation: A gradient boosting machine. Ann. Stat. 2001, 29, 1189–1232. [Google Scholar] [CrossRef]
- Lui, M. Feature Stacking for Sentence Classification in Evidence-Based Medicine. In Proceedings of the Australasian Language Technology Association Workshop 2012, Dunedin, New Zealand, 4–6 December 2012; pp. 134–138. [Google Scholar]
- Xu, S.; An, X.; Qiao, X.; Zhu, L.; Li, L. Multi-output least-squares support vector regression machines. Pattern Recognit. Lett. 2013, 34, 1078–1084. [Google Scholar] [CrossRef]
- Rasmus, A.; Berglund, M.; Honkala, M.; Valpola, H.; Raiko, T. Semi-supervised Learning with Ladder Networks. In Proceedings of the Advances in Neural Information Processing Systems, Montreal, QC, Canada, 7–12 December 2015; Cortes, C., Lawrence, N., Lee, D., Sugiyama, M., Garnett, R., Eds.; Curran Associates, Inc.: Red Hook, NY, USA, 2015; Volume 28. [Google Scholar]
- Vincent, P.; Larochelle, H.; Lajoie, I.; Bengio, Y.; Manzagol, P.A. Stacked Denoising Autoencoders: Learning Useful Representations in a Deep Network with a Local Denoising Criterion. J. Mach. Learn. Res. 2010, 11, 3371–3408. [Google Scholar]
- Ricci, F.; Rokach, L.; Shapira, B. Introduction to Recommender Systems Handbook. In Recommender Systems Handbook; Springer: Boston, MA, USA, 2011; pp. 1–35. [Google Scholar] [CrossRef]
- He, K.; Zhang, X.; Ren, S.; Sun, J. Deep Residual Learning for Image Recognition. In Proceedings of the 2016 IEEE Conference on Computer Vision and Pattern Recognition (CVPR), Las Vegas, NV, USA, 27–30 June 2016; pp. 770–778. [Google Scholar] [CrossRef]
- Tang, J.; Wang, K. Personalized Top-N Sequential Recommendation via Convolutional Sequence Embedding. In Proceedings of the Eleventh ACM International Conference on Web Search and Data Mining (WSDM ’18), Los Angeles, CA, USA, 15–29 September 2018; Association for Computing Machinery: New York, NY, USA, 2018; pp. 565–573. [Google Scholar] [CrossRef]
- Mehrabi, N.; Morstatter, F.; Saxena, N.; Lerman, K.; Galstyan, A. A Survey on Bias and Fairness in Machine Learning. ACM Comput. Surv. 2021, 54, 1–35. [Google Scholar] [CrossRef]
- Amiri, Z.; Heidari, A.; Darbandi, M.; Yazdani, Y.; Jafari Navimipour, N.; Esmaeilpour, M.; Sheykhi, F.; Unal, M. The Personal Health Applications of Machine Learning Techniques in the Internet of Behaviors. Sustainability 2023, 15, 2406. [Google Scholar] [CrossRef]
- Adler, D.A.; Wang, F.; Mohr, D.C.; Choudhury, T. Machine learning for passive mental health symptom prediction: Generalization across different longitudinal mobile sensing studies. PLoS ONE 2022, 17, e0266516. [Google Scholar] [CrossRef]
- Morgan, C.; Tonkin, E.L.; Craddock, I.; Whone, A.L. Acceptability of an In-home Multimodal Sensor Platform for Parkinson Disease: Nonrandomized Qualitative Study. JMIR Hum. Factors 2022, 9, e36370. [Google Scholar] [CrossRef]
- McCarney, R.; Warner, J.; Iliffe, S.; van Haselen, R.; Griffin, M.; Fisher, P. The Hawthorne Effect: A randomised, controlled trial. BMC Med. Res. Methodol. 2007, 7, 30. [Google Scholar] [CrossRef]
- American Psychiatric Publishing. Diagnostic and Statistical Manual of Mental Disorders: DSM-5™, 5th ed.; American Psychiatric Publishing: Washington, DC, USA, 2013. [Google Scholar]
- Hussain, M.; Al-Haiqi, A.; Zaidan, A.; Zaidan, B.; Kiah, M.; Anuar, N.B.; Abdulnabi, M. The landscape of research on smartphone medical apps: Coherent taxonomy, motivations, open challenges and recommendations. Comput. Methods Programs Biomed. 2015, 122, 393–408. [Google Scholar] [CrossRef]
- Tsai, J.; Kelley, P.; Cranor, L.; Sadeh, N. Location-Sharing Technologies: Privacy Risks and Controls. Innov. Law Policy eJournal 2009, 6, 119. [Google Scholar]
- Taylor, J.; Pagliari, C. Mining social media data: How are research sponsors and researchers addressing the ethical challenges? Res. Ethics 2018, 14, 1–39. [Google Scholar] [CrossRef]
- Mavrogiorgou, A.; Kleftakis, S.; Mavrogiorgos, K.; Zafeiropoulos, N.; Menychtas, A.; Kiourtis, A.; Maglogiannis, I.; Kyriazis, D. beHEALTHIER: A Microservices Platform for Analyzing and Exploiting Healthcare Data. In Proceedings of the 2021 IEEE 34th International Symposium on Computer-Based Medical Systems (CBMS), Aveiro, Portugal, 7–9 June 2021; pp. 283–288. [Google Scholar] [CrossRef]
- Georgogiannis, A.; Digalakis, V. Speech Emotion Recognition using non-linear Teager energy based features in noisy environments. In Proceedings of the 2012 Proceedings of the 20th European Signal Processing Conference (EUSIPCO), Bucharest, Romania, 27–31 August 2012; pp. 2045–2049.
- Degottex, G.; Kane, J.; Drugman, T.; Raitio, T.; Scherer, S. COVAREP—A collaborative voice analysis repository for speech technologies. In Proceedings of the 2014 IEEE International Conference on Acoustics, Speech and Signal Processing (ICASSP), Florence, Italy, 4–9 May 2014; pp. 960–964. [Google Scholar]
- Mathieu, B.; Essid, S.; Fillon, T.; Prado, J.; Richard, G. YAAFE, an Easy to Use and Efficient Audio Feature Extraction Software. In Proceedings of the 11th International Society for Music Information Retrieval Conference, Utrecht, The Netherlands, 9–13 August 2010; pp. 441–446. Available online: http://ismir2010.ismir.net/proceedings/ismir2010-75.pdf (accessed on 10 December 2023).
- Jadoul, Y.; Thompson, B.; de Boer, B. Introducing Parselmouth: A Python interface to Praat. J. Phon. 2018, 71, 1–15. [Google Scholar] [CrossRef]
- Giannakopoulos, T. pyAudioAnalysis: An Open-Source Python Library for Audio Signal Analysis. PLoS ONE 2015, 10, e0144610. [Google Scholar] [CrossRef] [PubMed]
- Orozco-Arroyave, J.R.; Vásquez-Correa, J.C.; Vargas-Bonilla, J.F.; Arora, R.; Dehak, N.; Nidadavolu, P.; Christensen, H.; Rudzicz, F.; Yancheva, M.; Chinaei, H.; et al. NeuroSpeech: An open-source software for Parkinson’s speech analysis. Digit. Signal Process. 2018, 77, 207–221. [Google Scholar] [CrossRef]
- MYOLUTION Lab My-Voice-Analysis. 2018. Available online: https://github.com/Shahabks/my-voice-analysis (accessed on 10 December 2023).
- Lenain, R.; Weston, J.; Shivkumar, A.; Fristed, E. Surfboard: Audio Feature Extraction for Modern Machine Learning. In Proceedings of the 21th Annual Conference of the International Speech Communication Association (INTERSPEECH 2020), Shanghai, China, 25–29 October 2020; pp. 2917–2921. [Google Scholar] [CrossRef]
- McFee, B.; Raffel, C.; Liang, D.; Ellis, D.P.W.; McVicar, M.; Battenberg, E.; Nieto, O. librosa: Audio and Music Signal Analysis in Python. In Proceedings of the 14th Python in Science Conference, Austin, TX, USA, 6–12 July 2015; pp. 18–24. [Google Scholar] [CrossRef]
- Schuller, B.; Steidl, S.; Batliner, A.; Burkhardt, F.; Devillers, L.; Müller, C.; Narayanan, S. The INTERSPEECH 2010 paralinguistic challenge. In Proceedings of the 11th Annual Conference of the International Speech Communication Association (INTERSPEECH 2010), Makuhari, Japan, 26–30 September 2010; pp. 2794–2797. [Google Scholar] [CrossRef]
- Schuller, B.; Steidl, S.; Batliner, A.; Vinciarelli, A.; Scherer, K.; Ringeval, F.; Chetouani, M.; Weninger, F.; Eyben, F.; Marchi, E.; et al. The INTERSPEECH 2013 computational paralinguistics challenge: Social signals, conflict, emotion, autism. In Proceedings of the Annual Conference of the International Speech Communication Association (INTERSPEECH 2013), Lyon, France, 25–29 August 2013; pp. 148–152. [Google Scholar] [CrossRef]
- Eyben, F.; Scherer, K.R.; Schuller, B.W.; Sundberg, J.; André, E.; Busso, C.; Devillers, L.Y.; Epps, J.; Laukka, P.; Narayanan, S.S.; et al. The Geneva Minimalistic Acoustic Parameter Set (GeMAPS) for Voice Research and Affective Computing. IEEE Trans. Affect. Comput. 2016, 7, 190–202. [Google Scholar] [CrossRef]
- Hannun, A.; Case, C.; Casper, J.; Catanzaro, B.; Diamos, G.; Elsen, E.; Prenger, R.; Satheesh, S.; Sengupta, S.; Coates, A.; et al. Deep Speech: Scaling up end-to-end speech recognition. arXiv 2014, arXiv:1412.5567. [Google Scholar] [CrossRef]
- Hershey, S.; Chaudhuri, S.; Ellis, D.P.W.; Gemmeke, J.F.; Jansen, A.; Moore, R.C.; Plakal, M.; Platt, D.; Saurous, R.A.; Seybold, B.; et al. CNN architectures for large-scale audio classification. In Proceedings of the 2017 IEEE International Conference on Acoustics, Speech and Signal Processing (ICASSP), New Orleans, LA, USA, 5–19 March 2017; pp. 131–135. [Google Scholar] [CrossRef]
- Huang, G.; Liu, Z.; Van Der Maaten, L.; Weinberger, K.Q. Densely Connected Convolutional Networks. In Proceedings of the 2017 IEEE Conference on Computer Vision and Pattern Recognition (CVPR), Honolulu, HI, USA, 21–26 July 2017; pp. 2261–2269. [Google Scholar] [CrossRef]
- Ravanelli, M.; Bengio, Y. Interpretable Convolutional Filters with SincNet. arXiv 2018, arXiv:1811.09725. [Google Scholar]
- Baevski, A.; Zhou, Y.; Mohamed, A.; Auli, M. wav2vec 2.0: A Framework for Self-Supervised Learning of Speech Representations. In Proceedings of the Advances in Neural Information Processing Systems, Virtual, 6–12 December 2020; Larochelle, H., Ranzato, M., Hadsell, R., Balcan, M., Lin, H., Eds.; Curran Associates, Inc.: Red Hook, NY, USA, 2020; Volume 33, pp. 12449–12460. [Google Scholar]
- Lin, Z.; Feng, M.; dos Santos, C.N.; Yu, M.; Xiang, B.; Zhou, B.; Bengio, Y. A Structured Self-Attentive Sentence Embedding. In Proceedings of the International Conference on Learning Representations, Toulon, France, 24–26 April 2017. [Google Scholar]
- Hsu, W.N.; Bolte, B.; Tsai, Y.H.H.; Lakhotia, K.; Salakhutdinov, R.; Mohamed, A. HuBERT: Self-Supervised Speech Representation Learning by Masked Prediction of Hidden Units. IEEE/ACM Trans. Audio, Speech, Lang. Process. 2021, 29, 3451–3460. [Google Scholar] [CrossRef]
- Huang, Z.; Zhang, J.; Ma, L.; Mao, F. GTCN: Dynamic Network Embedding Based on Graph Temporal Convolution Neural Network. In Proceedings of the Intelligent Computing Theories and Application, Bari, Italy, 2–5 October 2020; Huang, D.S., Jo, K.H., Eds.; Springer: Cham, Switzerland, 2020; pp. 583–593. [Google Scholar]
- Schmitt, M.; Schuller, B. openXBOW—Introducing the Passau Open-Source Crossmodal Bag-of-Words Toolkit. J. Mach. Learn. Res. 2017, 18, 1–5. [Google Scholar]
- Chung, J.; Gulcehre, C.; Cho, K.; Bengio, Y. Empirical Evaluation of Gated Recurrent Neural Networks on Sequence Modeling. arXiv 2014, arXiv:1412.3555. [Google Scholar] [CrossRef]
- Viola, P.; Jones, M. Robust Real-Time Object Detection. Int. J. Comput. Vis. IJCV 2001, 57, 5385–5395. [Google Scholar]
- Tzimiropoulos, G.; Pantic, M. Gauss-Newton Deformable Part Models for Face Alignment In-the-Wild. In Proceedings of the 2014 IEEE Conference on Computer Vision and Pattern Recognition, Columbus, OH, USA, 23–28 June 2014; pp. 1851–1858. [Google Scholar] [CrossRef]
- Jeni, L.A.; Cohn, J.F.; Kanade, T. Dense 3D face alignment from 2D videos in real-time. In Proceedings of the 2015 11th IEEE International Conference and Workshops on Automatic Face and Gesture Recognition (FG), Ljubljana, Slovenia, 4–8 May 2015; Volume 1. [Google Scholar]
- Zhou, E.; Fan, H.; Cao, Z.; Jiang, Y.; Yin, Q. Extensive Facial Landmark Localization with Coarse-to-Fine Convolutional Network Cascade. In Proceedings of the 2013 IEEE International Conference on Computer Vision Workshops, Sydney, Australia, 2–8 December 2013; pp. 386–391. [Google Scholar] [CrossRef]
- Szegedy, C.; Ioffe, S.; Vanhoucke, V.; Alemi, A.A. Inception-v4, Inception-ResNet and the Impact of Residual Connections on Learning. In Proceedings of the Thirty-First AAAI Conference on Artificial Intelligence (AAAI’17), San Francisco, CA, USA, 4–9 February 2017; AAAI Press: Washington, DC, USA, 2017; pp. 4278–4284. [Google Scholar]
- King, D.E. Dlib-ml: A Machine Learning Toolkit. J. Mach. Learn. Res. 2009, 10, 1755–1758. [Google Scholar]
- Tzimiropoulos, G.; Alabort-i Medina, J.; Zafeiriou, S.; Pantic, M. Generic Active Appearance Models Revisited. In Proceedings of the Computer Vision (ACCV 2012), Daejeon, Republic of Korea, 5–9 November 2012; Lee, K.M., Matsushita, Y., Rehg, J.M., Hu, Z., Eds.; Springer: Berlin/Heidelberg, Germany, 2013; pp. 650–663. [Google Scholar]
- Zhou, B.; Lapedriza, A.; Khosla, A.; Oliva, A.; Torralba, A. Places: A 10 Million Image Database for Scene Recognition. IEEE Trans. Pattern Anal. Mach. Intell. 2018, 40, 1452–1464. [Google Scholar] [CrossRef] [PubMed]
- Onal Ertugrul, I.; Jeni, L.A.; Ding, W.; Cohn, J.F. AFAR: A Deep Learning Based Tool for Automated Facial Affect Recognition. In Proceedings of the 2019 14th IEEE International Conference on Automatic Face & Gesture Recognition (FG 2019), Lille, France, 14–18 May 2019. [Google Scholar]
- Meng, H.; Pears, N.; Bailey, C. A Human Action Recognition System for Embedded Computer Vision Application. In Proceedings of the 2007 IEEE Conference on Computer Vision and Pattern Recognition, Minneapolis, MN, USA, 17–22 June 2007; pp. 1–6. [Google Scholar] [CrossRef]
- Face++ AI Open Platform. Face++. 2012. Available online: https://www.faceplusplus.com/ (accessed on 20 September 2023).
- Littlewort, G.; Whitehill, J.; Wu, T.; Fasel, I.; Frank, M.; Movellan, J.; Bartlett, M. The computer expression recognition toolbox (CERT). In Proceedings of the 2011 IEEE International Conference on Automatic Face & Gesture Recognition (FG), Santa Barbara, CA, USA, 21–25 March 2011; pp. 298–305. [Google Scholar] [CrossRef]
- Meng, H.; Huang, D.; Wang, H.; Yang, H.; AI-Shuraifi, M.; Wang, Y. Depression Recognition Based on Dynamic Facial and Vocal Expression Features Using Partial Least Square Regression. In Proceedings of the 3rd ACM International Workshop on Audio/Visual Emotion Challenge (AVEC ’13), Barcelona, Spain, 21 October 2013; Association for Computing Machinery: New York, NY, USA, 2013; pp. 21–30. [Google Scholar] [CrossRef]
- Mower, E.; Matarić, M.J.; Narayanan, S. A Framework for Automatic Human Emotion Classification Using Emotion Profiles. IEEE Trans. Audio Speech Lang. Process. 2011, 19, 1057–1070. [Google Scholar] [CrossRef]
- Xie, S.; Girshick, R.; Dollár, P.; Tu, Z.; He, K. Aggregated Residual Transformations for Deep Neural Networks. In Proceedings of the 2017 IEEE Conference on Computer Vision and Pattern Recognition (CVPR), Honolulu, HI, USA, 21–26 July 2017; pp. 5987–5995. [Google Scholar] [CrossRef]
- Parkhi, O.M.; Vedaldi, A.; Zisserman, A. Deep Face Recognition. In Proceedings of the British Machine Vision Conference (BMVC), Swansea, UK, 7–10 September 2015; Xie, X., Jones, M.W., Tam, G.K.L., Eds.; BMVA Press: Durham, UK, 2015; pp. 41.1–41.12. [Google Scholar] [CrossRef]
- Krizhevsky, A.; Sutskever, I.; Hinton, G.E. ImageNet Classification with Deep Convolutional Neural Networks. Commun. ACM 2017, 60, 84–90. [Google Scholar] [CrossRef]
- Kollias, D.; Tzirakis, P.; Nicolaou, M.A.; Papaioannou, A.; Zhao, G.; Schuller, B.; Kotsia, I.; Zafeiriou, S. Deep Affect Prediction in-the-Wild: Aff-Wild Database and Challenge, Deep Architectures, and Beyond. Int. J. Comput. Vis. 2019, 127, 907–929. [Google Scholar] [CrossRef]
- Tan, M.; Le, Q.V. EfficientNet: Rethinking Model Scaling for Convolutional Neural Networks. In Proceedings of the International Conference on Machine Learning (PMLR), Long Beach, CA, USA, 9–15 June 2019. [Google Scholar] [CrossRef]
- Caron, M.; Touvron, H.; Misra, I.; Jégou, H.; Mairal, J.; Bojanowski, P.; Joulin, A. Emerging Properties in Self-Supervised Vision Transformers. In Proceedings of the IEEE/CVF International Conference on Computer Vision (ICCV), Montreal, BC, Canada, 11–17 October 2021; pp. 9650–9660. [Google Scholar]
- Hoffstaetter, S.; Bochi, J.; Lee, M.; Kistner, L.; Mitchell, R.; Cecchini, E.; Hagen, J.; Morawiec, D.; Bedada, E.; Akyüz, U. Pytesseract: A Python wrapper for Google Tesseract. 2019. Available online: https://github.com/madmaze/pytesseract (accessed on 20 September 2023).
- Radford, A.; Kim, J.W.; Hallacy, C.; Ramesh, A.; Goh, G.; Agarwal, S.; Sastry, G.; Askell, A.; Mishkin, P.; Clark, J.; et al. Learning Transferable Visual Models From Natural Language Supervision. In Proceedings of the 38th International Conference on Machine Learning (PMLR, 2021), Virtual, 18–24 July 2021; Volume 139, pp. 8748–8763. [Google Scholar]
- Technologies Imagga. Imagga. 2023. Available online: https://imagga.com/ (accessed on 20 September 2023).
- Sikka, K.; Wu, T.; Susskind, J.; Bartlett, M. Exploring Bag of Words Architectures in the Facial Expression Domain. In Proceedings of the Computer Vision—ECCV 2012. Workshops and Demonstrations, Florence, Italy, 7–13 October 2012; Fusiello, A., Murino, V., Cucchiara, R., Eds.; Springer: Berlin/Heidelberg, Germany, 2012; pp. 250–259. [Google Scholar]
- van de Weijer, J.; Schmid, C.; Verbeek, J.; Larlus, D. Learning Color Names for Real-World Applications. IEEE Trans. Image Process. 2009, 18, 1512–1523. [Google Scholar] [CrossRef]
- Lin, H.; Jia, J.; Guo, Q.; Xue, Y.; Li, Q.; Huang, J.; Cai, L.; Feng, L. User-Level Psychological Stress Detection from Social Media Using Deep Neural Network. In Proceedings of the 22nd ACM International Conference on Multimedia (MM ’14), Orlando, FL, USA, 3–7 November 2014; Association for Computing Machinery: New York, NY, USA, 2014; pp. 507–516. [Google Scholar] [CrossRef]
- Ibraheem, N.; Hasan, M.; Khan, R.Z.; Mishra, P. Understanding Color Models: A Review. ARPN J. Sci. Technol. 2012, 2, 265–275. [Google Scholar]
- Ramírez-esparza, N.; Pennebaker, J.W.; Andrea García, F.; Amd suriá, R. La psicología del uso de las palabras: Un programa de computadora que analiza textos en español. Rev. Mex. Psicol. 2007, 24, 85–99. [Google Scholar]
- Lv, M.; Li, A.; Liu, T.; Zhu, T. Creating a Chinese suicide dictionary for identifying suicide risk on social media. PeerJ 2015, 3, e1455. [Google Scholar] [CrossRef]
- Huang, C.L.; Chung, C.; Hui, N.; Lin, Y.C.; Seih, Y.T.; Lam, B.; Pennebaker, J. Development of the Chinese linguistic inquiry and word count dictionary. Chin. J. Psychol. 2012, 54, 185–201. [Google Scholar]
- Gao, R.; Hao, B.; Li, H.; Gao, Y.; Zhu, T. Developing Simplified Chinese Psychological Linguistic Analysis Dictionary for Microblog. In Proceedings of the Brain and Health Informatics: International Conference (BHI 2013), Maebashi, Japan, 29–31 October 2013; Imamura, K., Usui, S., Shirao, T., Kasamatsu, T., Schwabe, L., Zhong, N., Eds.; Springer: Cham, Switzerland, 2013; pp. 359–368. [Google Scholar]
- Crossley, S.A.; Allen, L.K.; Kyle, K.; McNamara, D.S. Analyzing Discourse Processing Using a Simple Natural Language Processing Tool. Discourse Process. 2014, 51, 511–534. [Google Scholar] [CrossRef]
- Das Swain, V.; Chen, V.; Mishra, S.; Mattingly, S.M.; Abowd, G.D.; De Choudhury, M. Semantic Gap in Predicting Mental Wellbeing through Passive Sensing. In Proceedings of the 2022 CHI Conference on Human Factors in Computing Systems (CHI ’22), New Orleans, LA, USA, 3–5 May 2022; Association for Computing Machinery: New York, NY, USA, 2022. [Google Scholar] [CrossRef]
- Sun, J. Jieba Chinese Word Segmentation Tool; ACM: New York, NY, USA, 2012. [Google Scholar]
- Loria, S.; Keen, P.; Honnibal, M.; Yankovsky, R.; Karesh, D.; Dempsey, E.; Childs, W.; Schnurr, J.; Qalieh, A.; Ragnarsson, L.; et al. TextBlob: Simplified Text Processing. 2013. Available online: https://textblob.readthedocs.io/en/dev/ (accessed on 10 December 2023).
- Marcus, M.P.; Santorini, B.; Marcinkiewicz, M.A. Building a Large Annotated Corpus of English: The Penn Treebank. Comput. Linguist. 1993, 19, 313–330. [Google Scholar]
- Fast, E.; Chen, B.; Bernstein, M.S. Empath. In Proceedings of the 2016 CHI Conference on Human Factors in Computing Systems ACM, San Jose, CA, USA, 7–12 May 2016. [Google Scholar] [CrossRef]
- Zubiaga, A. TF-CR: Weighting Embeddings for Text Classification. arXiv 2020, arXiv:2012.06606. [Google Scholar] [CrossRef]
- Bansal, S.; Aggarwal, C. Textstat; Freie University Berlin: Berlin, Germany, 2014. [Google Scholar]
- Wenliang, C.; Jingbo, Z.; Muhua, Z.; Tianshun, Y. Text Representation Using Domain Dictionary. J. Comput. Res. Dev. 2005, 42, 2155. [Google Scholar]
- Li, G.; Li, B.; Huang, L.; Hou, S. Automatic Construction of a Depression-Domain Lexicon Based on Microblogs: Text Mining Study. JMIR Med. Inform. 2020, 8, e17650. [Google Scholar] [CrossRef]
- Mohammad, S.M.; Turney, P.D. NRC Emotion Lexicon; Technical Report; National Research Council of Canada: Montreal, QC, Canada, 2013. [Google Scholar] [CrossRef]
- Hofman, E. Senti-py: A Sentiment Analysis Classifier in Spanish; Springer: Berlin/Heidelberg, Germany, 2018. [Google Scholar]
- Hutto, C.; Gilbert, E. VADER: A Parsimonious Rule-Based Model for Sentiment Analysis of Social Media Text. Proc. Int. Aaai Conf. Web Soc. Media 2014, 8, 216–225. [Google Scholar] [CrossRef]
- School of Computer Science and Technology. Chinese Emotion Lexicons; School of Computer Science and Technology: Luton, UK, 2020. [Google Scholar]
- Mohammad, S.M.; Turney, P.D. Crowdsourcing a Word–Emotion Association Lexicon. Comput. Intell. 2013, 29, 436–465. [Google Scholar] [CrossRef]
- Cambria, E.; Speer, R.; Havasi, C.; Hussain, A. SenticNet: A Publicly Available Semantic Resource for Opinion Mining. In Proceedings of the AAAI Fall Symposium: Commonsense Knowledge, Arlington, VA, USA, 11–13 November 2010. [Google Scholar]
- Namenwirth, J. The Lasswell Value Dictionary; Springer: Berlin/Heidelberg, Germany, 1968. [Google Scholar]
- Nielsen, F.Å. A new ANEW: Evaluation of a word list for sentiment analysis in microblogs. In Proceedings of the ESWC2011 Workshop on ’Making Sense of Microposts’: Big things come in small packages 718 in CEUR Workshop Proceedings, Heraklion, Crete, 30 May 2011; pp. 93–98. [Google Scholar]
- Dodds, P.S.; Harris, K.D.; Kloumann, I.M.; Bliss, C.A.; Danforth, C.M. Temporal Patterns of Happiness and Information in a Global Social Network: Hedonometrics and Twitter. PLoS ONE 2011, 6, e026752. [Google Scholar] [CrossRef]
- Gupta, A.; Band, A.; Sharma, S.R. text2emotion. 2020. Available online: https://github.com/aman2656/text2emotion-library (accessed on 20 September 2023).
- Kralj Novak, P.; Smailović, J.; Sluban, B.; Mozetič, I. Sentiment of Emojis. PLoS ONE 2015, 10, e.0144296. [Google Scholar] [CrossRef]
- Ren, F.; Kang, X.; Quan, C. Examining Accumulated Emotional Traits in Suicide Blogs With an Emotion Topic Model. IEEE J. Biomed. Health Inform. 2016, 20, 1384–1396. [Google Scholar] [CrossRef] [PubMed]
- Pennington, J.; Socher, R.; Manning, C.D. GloVe: Global Vectors for Word Representation. In Proceedings of the Empirical Methods in Natural Language Processing (EMNLP), Doha, Qatar, 25–29 October 2014; pp. 1532–1543. [Google Scholar]
- Mikolov, T.; Sutskever, I.; Chen, K.; Corrado, G.; Dean, J. Distributed Representations of Words and Phrases and Their Compositionality. In Proceedings of the 26th International Conference on Neural Information Processing Systems (NIPS’13), Lake Tahoe, NV, USA, 3–6 December 2013; Curran Associates Inc.: Red Hook, NY, USA, 2013; Volume 2, pp. 3111–3119. [Google Scholar]
- Bojanowski, P.; Grave, E.; Joulin, A.; Mikolov, T. Enriching Word Vectors with Subword Information. Trans. Assoc. Comput. Linguist. 2016, 5, 135–146. [Google Scholar] [CrossRef]
- Peters, M.E.; Neumann, M.; Iyyer, M.; Gardner, M.; Clark, C.; Lee, K.; Zettlemoyer, L. Deep Contextualized Word Representations. In Proceedings of the 2018 Conference of the North American Chapter of the Association for Computational Linguistics: Human Language Technologies, Volume 1 (Long Papers), New Orleans, LA, USA, 1–6 June 2018; Association for Computational Linguistics: New Orleans, LA, USA, 2018; pp. 2227–2237. [Google Scholar] [CrossRef]
- Deriu, J.; Lucchi, A.; De Luca, V.; Severyn, A.; Müller, S.; Cieliebak, M.; Hofmann, T.; Jaggi, M. Leveraging Large Amounts of Weakly Supervised Data for Multi-Language Sentiment Classification. In Proceedings of the 26th International Conference on World Wide Web (CHE, 2017; WWW ’17), Perth, Australia, 3–7 May 2017; pp. 1045–1052. [Google Scholar] [CrossRef]
- Wang, W.; Wei, F.; Dong, L.; Bao, H.; Yang, N.; Zhou, M. MiniLM: Deep Self-Attention Distillation for Task-Agnostic Compression of Pre-Trained Transformers. In Proceedings of the Advances in Neural Information Processing Systems, Long Beach, CA, USA, 6–12 December 2020; Larochelle, H., Ranzato, M., Hadsell, R., Balcan, M., Lin, H., Eds.; Curran Associates, Inc.: Red Hook, NY, USA, 2020; Volume 33, pp. 5776–5788. [Google Scholar]
- Brown, T.; Mann, B.; Ryder, N.; Subbiah, M.; Kaplan, J.D.; Dhariwal, P.; Neelakantan, A.; Shyam, P.; Sastry, G.; Askell, A.; et al. Language Models are Few-Shot Learners. In Proceedings of the Advances in Neural Information Processing Systems, Long Beach, CA, USA, 6–12 December 2020; Larochelle, H., Ranzato, M., Hadsell, R., Balcan, M., Lin, H., Eds.; Curran Associates, Inc.: Red Hook, NY, USA, 2020; Volume 33, pp. 1877–1901. [Google Scholar]
- Alshubaily, I. TextCNN with Attention for Text Classification. arXiv 2021, arXiv:2108.01921. [Google Scholar]
- Cer, D.; Yang, Y.; Kong, S.y.; Hua, N.; Limtiaco, N.; John, R.S.; Constant, N.; Guajardo-Cespedes, M.; Yuan, S.; Tar, C.; et al. Universal Sentence Encoder. arXiv 2018, arXiv:1803.11175. [Google Scholar] [CrossRef]
- Reimers, N.; Gurevych, I. Sentence-BERT: Sentence Embeddings using Siamese BERT-Networks. arXiv 2019, arXiv:1908.10084. [Google Scholar]
- Pedregosa, F.; Varoquaux, G.; Gramfort, A.; Michel, V.; Thirion, B.; Grisel, O.; Blondel, M.; Prettenhofer, P.; Weiss, R.; Dubourg, V.; et al. Scikit-Learn: Machine Learning in Python. J. Mach. Learn. Res. 2011, 12, 2825–2830. [Google Scholar]
- Yan, X.; Guo, J.; Lan, Y.; Cheng, X. A Biterm Topic Model for Short Texts. In Proceedings of the Proceedings of the 22nd International Conference on World Wide Web (WWW ’13), Virtual, 13–17 May 2013; Association for Computing Machinery: New York, NY, USA, 2013; pp. 1445–1456. [Google Scholar] [CrossRef]
- Lewis, M.; Liu, Y.; Goyal, N.; Ghazvininejad, M.; Mohamed, A.; Levy, O.; Stoyanov, V.; Zettlemoyer, L. BART: Denoising Sequence-to-Sequence Pre-training for Natural Language Generation, Translation, and Comprehension. In Proceedings of the 58th Annual Meeting of the Association for Computational Linguistics, Virtual, 5–10 July 2020; Association for Computational Linguistics: Toronto, ON, Canada, 2020; pp. 7871–7880. [Google Scholar] [CrossRef]
- Wang, J.; Song, Y.; Leung, T.; Rosenberg, C.; Wang, J.; Philbin, J.; Chen, B.; Wu, Y. Learning Fine-Grained Image Similarity with Deep Ranking. In Proceedings of the 2014 IEEE Conference on Computer Vision and Pattern Recognition, Seattle, WA, USA, 14–19 June 2014; pp. 1386–1393. [Google Scholar] [CrossRef]
- Bromley, J.; Bentz, J.W.; Bottou, L.; Guyon, I.M.; LeCun, Y.; Moore, C.; Säckinger, E.; Shah, R. Signature Verification Using A “Siamese” Time Delay Neural Network. Int. J. Pattern Recognit. Artif. Intell. 1993, 7, 669–688. [Google Scholar] [CrossRef]
- Li, Q.; Xue, Y.; Zhao, L.; Jia, J.; Feng, L. Analyzing and Identifying Teens’ Stressful Periods and Stressor Events From a Microblog. IEEE J. Biomed. Health Inform. 2017, 21, 1434–1448. [Google Scholar] [CrossRef]
- Grover, A.; Leskovec, J. Node2vec: Scalable Feature Learning for Networks. In Proceedings of the 22nd ACM SIGKDD International Conference on Knowledge Discovery and Data Mining (KDD ’16), San Francisco, CA, USA, 13–17 August 2016; Association for Computing Machinery: New York, NY, USA, 2016; pp. 855–864. [Google Scholar] [CrossRef]
- Dunbar, R.; Arnaboldi, V.; Conti, M.; Passarella, A. The structure of online social networks mirrors those in the offline world. Soc. Netw. 2015, 43, 39–47. [Google Scholar] [CrossRef]
- Vega, J.; Li, M.; Aguillera, K.; Goel, N.; Joshi, E.; Khandekar, K.; Durica, K.C.; Kunta, A.R.; Low, C.A. Reproducible Analysis Pipeline for Data Streams: Open-Source Software to Process Data Collected With Mobile Devices. Front. Digit. Health 2021, 3, 769823. [Google Scholar] [CrossRef]
- Sak, H.; Senior, A.W.; Beaufays, F. Long short-term memory recurrent neural network architectures for large scale acoustic modeling. In Proceedings of the Interspeech, Singapore, 14–18 September 2014. [Google Scholar]
- Ester, M.; Kriegel, H.P.; Sander, J.; Xu, X. A Density-Based Algorithm for Discovering Clusters in Large Spatial Databases with Noise. In Proceedings of the Second International Conference on Knowledge Discovery and Data Mining (KDD’96), Portland, OR, USA, 2–4 August 1996; AAAI Press: Washington, DC, USA, 1996; pp. 226–231. [Google Scholar]
- Saeb, S.; Zhang, M.; Karr, C.J.; Schueller, S.M.; Corden, M.E.; Kording, K.P.; Mohr, D.C. Mobile Phone Sensor Correlates of Depressive Symptom Severity in Daily-Life Behavior: An Exploratory Study. J. Med. Internet Res. 2015, 17, e175. [Google Scholar] [CrossRef] [PubMed]
- Canzian, L.; Musolesi, M. Trajectories of Depression: Unobtrusive Monitoring of Depressive States by Means of Smartphone Mobility Traces Analysis. In Proceedings of the 2015 ACM International Joint Conference on Pervasive and Ubiquitous Computing (UbiComp ’15), Osaka, Japan, 7–11 September 2015; Association for Computing Machinery: New York, NY, USA, 2015; pp. 1293–1304. [Google Scholar] [CrossRef]
- Cornelissen, G. Cosinor-based rhythmometry. Theor. Biol. Med. Model. 2014, 11, 16. [Google Scholar] [CrossRef] [PubMed]
- Barandas, M.; Folgado, D.; Fernandes, L.; Santos, S.; Abreu, M.; Bota, P.; Liu, H.; Schultz, T.; Gamboa, H. TSFEL: Time Series Feature Extraction Library. SoftwareX 2020, 11, 100456. [Google Scholar] [CrossRef]
- Geary, D.N.; McLachlan, G.J.; Basford, K.E. Mixture Models: Inference and Applications to Clustering. J. R. Stat. Soc. Ser. (Statistics Soc.) 1989, 152, 126. [Google Scholar] [CrossRef]
- Kaufmann, L.; Rousseeuw, P. Clustering by Means of Medoids. Data Analysis Based on the L1-Norm and Related Methods; KU Leuven: Leuven, Belgium, 1987; pp. 405–416. [Google Scholar]
- Shi, C.; Li, Y.; Zhang, J.; Sun, Y.; Yu, P.S. A survey of heterogeneous information network analysis. IEEE Trans. Knowl. Data Eng. 2017, 29, 17–37. [Google Scholar] [CrossRef]
- Farseev, A.; Samborskii, I.; Chua, T.S. BBridge: A Big Data Platform for Social Multimedia Analytics. In Proceedings of the 24th ACM International Conference on Multimedia, (MM ’16), Vancouver, BC, Canada, 26–31 October 2016; Association for Computing Machinery: New York, NY, USA, 2016; pp. 759–761. [Google Scholar] [CrossRef]
- Sap, M.; Park, G.; Eichstaedt, J.C.; Kern, M.L.; Stillwell, D.J.; Kosinski, M.; Ungar, L.H.; Schwartz, H.A. Developing age and gender predictive lexica over social media. In Proceedings of the 2014 Conference on Empirical Methods in Natural Language Processing (EMNLP), Doha, Qatar, 25–29 October 2014. [Google Scholar]
- Wang, Z.; Hale, S.; Adelani, D.I.; Grabowicz, P.; Hartman, T.; Flöck, F.; Jurgens, D. Demographic Inference and Representative Population Estimates from Multilingual Social Media Data. In Proceedings of the The World Wide Web Conference ACM, Amsterdam, The Netherlands, 21–23 October 2019. [Google Scholar] [CrossRef]
- The International Business Machines Corporation (IBM). IBM Watson Natural Language Understanding. 2021. Available online: https://www.ibm.com/products/natural-language-understanding (accessed on 20 September 2023).
- Mehta, Y.; Fatehi, S.; Kazameini, A.; Stachl, C.; Cambria, E.; Eetemadi, S. Bottom-Up and Top-Down: Predicting Personality with Psycholinguistic and Language Model Features. In Proceedings of the 2020 IEEE International Conference on Data Mining (ICDM), Sorrento, Italy, 17–20 November 2020; pp. 1184–1189. [Google Scholar] [CrossRef]
- Sun, B.; Li, L.; Wu, X.; Zuo, T.; Chen, Y.; Zhou, G.; He, J.; Zhu, X. Combining feature-level and decision-level fusion in a hierarchical classifier for emotion recognition in the wild. J. Multimodal User Interfaces 2016, 10, 125–137. [Google Scholar] [CrossRef]
- Arevalo, J.; Solorio, T.; Montes-y Gómez, M.; González, F.A. Gated multimodal networks. Neural Comput. Appl. 2020, 32, 10209–10228. [Google Scholar] [CrossRef]
- Kim, J.H.; On, K.W.; Lim, W.; Kim, J.; Ha, J.W.; Zhang, B.T. Hadamard Product for Low-rank Bilinear Pooling. arXiv 2016, arXiv:1610.04325. [Google Scholar] [CrossRef]
- Fukui, A.; Park, D.H.; Yang, D.; Rohrbach, A.; Darrell, T.; Rohrbach, M. Multimodal Compact Bilinear Pooling for Visual Question Answering and Visual Grounding. In Proceedings of the 2016 Conference on Empirical Methods in Natural Language Processing. Association for Computational Linguistics, Austin, TX, USA, 1–5 November 2016. [Google Scholar] [CrossRef]
- Liu, Z.; Shen, Y.; Lakshminarasimhan, V.B.; Liang, P.P.; Zadeh, A.B.; Morency, L.P. Efficient Low-rank Multimodal Fusion With Modality-Specific Factors. In Proceedings of the 56th Annual Meeting of the Association for Computational Linguistics (Volume 1: Long Papers), Melbourne, Australia, 15–20 July 2018; Association for Computational Linguistics: Toronto, ON, Canada, 2018. [Google Scholar] [CrossRef]
- Yu, Z.; Yu, J.; Fan, J.; Tao, D. Multi-modal Factorized Bilinear Pooling with Co-attention Learning for Visual Question Answering. In Proceedings of the 2017 IEEE International Conference on Computer Vision (ICCV), Venice, Italy, 22–29 October 2017. [Google Scholar] [CrossRef]
- Tan, H.; Bansal, M. LXMERT: Learning Cross-Modality Encoder Representations from Transformers. In Proceedings of the 2019 Conference on Empirical Methods in Natural Language Processing and the 9th International Joint Conference on Natural Language Processing (EMNLP-IJCNLP), Qingdao, China, 13–17 October 2019; Association for Computational Linguistics: Hong Kong, China, 2019; pp. 5100–5111. [Google Scholar] [CrossRef]
- Zadeh, A.; Liang, P.P.; Mazumder, N.; Poria, S.; Cambria, E.; Morency, L.P. Memory Fusion Network for Multi-View Sequential Learning. In Proceedings of the Thirty-Second AAAI Conference on Artificial Intelligence and Thirtieth Innovative Applications of Artificial Intelligence Conference and Eighth AAAI Symposium on Educational Advances in Artificial Intelligence (AAAI’18/IAAI’18/EAAI’18), New Orleans, LA, USA, 2–7 February 2018; AAAI Press: Washington, DC, USA, 2018. [Google Scholar]
- Tibshirani, R. Regression Shrinkage and Selection Via the Lasso. J. R. Stat. Soc. Ser. (Methodol.) 1996, 58, 267–288. [Google Scholar] [CrossRef]
- Zou, H.; Hastie, T.J. Regularization and variable selection via the elastic net. J. R. Stat. Soc. Ser. (Statistical Methodol.) 2005, 67, 301–320. [Google Scholar] [CrossRef]
- de Jong, S. SIMPLS: An alternative approach to partial least squares regression. Chemom. Intell. Lab. Syst. 1993, 18, 251–263. [Google Scholar] [CrossRef]
- Schölkopf, B.; Platt, J.C.; Shawe-Taylor, J.; Smola, A.J.; Williamson, R.C. Estimating the Support of a High-Dimensional Distribution. Neural Comput. 2001, 13, 1443–1471. [Google Scholar] [CrossRef] [PubMed]
- Fokkema, M.; Smits, N.; Zeileis, A.; Hothorn, T.; Kelderman, H. Detecting treatment-subgroup interactions in clustered data with generalized linear mixed-effects model trees. Behav. Res. Methods 2017, 50, 2016–2034. [Google Scholar] [CrossRef] [PubMed]
- van den Oord, A.; Dieleman, S.; Zen, H.; Simonyan, K.; Vinyals, O.; Graves, A.; Kalchbrenner, N.; Senior, A.; Kavukcuoglu, K. WaveNet: A Generative Model for Raw Audio. arXiv 2016, arXiv:1609.03499. [Google Scholar]
- Zhou, P.; Shi, W.; Tian, J.; Qi, Z.; Li, B.; Hao, H.; Xu, B. Attention-Based Bidirectional Long Short-Term Memory Networks for Relation Classification. In Proceedings of the 54th Annual Meeting of the Association for Computational Linguistics (Volume 2: Short Papers), East Stroudsburg, PA, USA, 7–12 August 2016; Association for Computational Linguistics: Berlin, Germany, 2016; pp. 207–212. [Google Scholar] [CrossRef]
- Zhou, H.; Zhang, S.; Peng, J.; Zhang, S.; Li, J.; Xiong, H.; Zhang, W. Informer: Beyond Efficient Transformer for Long Sequence Time-Series Forecasting. Proc. AAAI Conf. Artif. Intell. 2021, 35, 11106–11115. [Google Scholar] [CrossRef]
- Yang, Z.; Yang, D.; Dyer, C.; He, X.; Smola, A.; Hovy, E. Hierarchical Attention Networks for Document Classification. In Proceedings of the 2016 Conference of the North American Chapter of the Association for Computational Linguistics: Human Language Technologies, San Diego, CA, USA, 12–17 June 2016; Association for Computational Linguistics: San Diego, CA, USA, 2016; pp. 1480–1489. [Google Scholar] [CrossRef]
- Chen, C.; Breiman, L. Using Random Forest to Learn Imbalanced Data; University of California: Berkeley, CA, USA, 2004. [Google Scholar]
- Zong, W.; Huang, G.B.; Chen, Y. Weighted extreme learning machine for imbalance learning. Neurocomputing 2013, 101, 229–242. [Google Scholar] [CrossRef]
- Huang, G.B.; Zhu, Q.Y.; Siew, C.K. Extreme learning machine: A new learning scheme of feedforward neural networks. In Proceedings of the 2004 IEEE International Joint Conference on Neural Networks (IEEE Cat. No.04CH37541), Budapest, Hungary, 25–29 July 2004; Volume 2, pp. 985–990. [Google Scholar] [CrossRef]
- Ramachandran, P.; Zoph, B.; Le, Q.V. Searching for Activation Functions. arXiv 2018, arXiv:1710.05941. [Google Scholar]
- Pezeshki, M.; Fan, L.; Brakel, P.; Courville, A.; Bengio, Y. Deconstructing the Ladder Network Architecture. In Proceedings of the 33rd International Conference on Machine Learning (PMLR), New York, NY, USA, 20–22 June 2016; Volume 48, pp. 2368–2376. [Google Scholar]
- Drumond, L.R.; Diaz-Aviles, E.; Schmidt-Thieme, L.; Nejdl, W. Optimizing Multi-Relational Factorization Models for Multiple Target Relations. In Proceedings of the 23rd ACM International Conference on Information and Knowledge Management (CIKM ’14), Shanghai, China, 3–7 November 2014; Association for Computing Machinery: New York, NY, USA, 2014; pp. 191–200. [Google Scholar] [CrossRef]
- Nickel, M.; Tresp, V.; Kriegel, H.P. A Three-Way Model for Collective Learning on Multi-Relational Data. In Proceedings of the 28th International Conference on Machine Learning (ICML’11), Bellevue, WA, USA, 28 June–2 July 2011; Omnipress: Madison, WI, USA, 2011; pp. 809–816. [Google Scholar]
- Bader, B.W.; Harshman, R.A.; Kolda, T.G. Temporal Analysis of Semantic Graphs Using ASALSAN. In Proceedings of the Seventh IEEE International Conference on Data Mining (ICDM 2007), Omaha, NE, USA, 28–31 October 2007; pp. 33–42. [Google Scholar] [CrossRef]
- Shi, C.; Hu, B.; Zhao, W.; Yu, P. Heterogeneous Information Network Embedding for Recommendation. IEEE Trans. Knowl. Data Eng. 2017, 31, 357–370. [Google Scholar] [CrossRef]
- Milenković, T.; Przulj, N. Uncovering biological network function via graphlet degree signatures. Cancer Inform. 2008, 6, 257–273. [Google Scholar] [CrossRef]
- Gu, S.; Johnson, J.; Faisal, F.E.; Milenković, T. From homogeneous to heterogeneous network alignment via colored graphlets. Sci. Rep. 2017, 8, 12524. [Google Scholar] [CrossRef]
- Perozzi, B.; Al-Rfou, R.; Skiena, S. DeepWalk. In Proceedings of the 20th ACM SIGKDD International Conference on Knowledge Discovery and Data Mining ACM, New York, NY, USA, 24–27 August 2014. [Google Scholar] [CrossRef]
- Dong, Y.; Chawla, N.V.; Swami, A. Metapath2vec: Scalable Representation Learning for Heterogeneous Networks. In Proceedings of the 23rd ACM SIGKDD International Conference on Knowledge Discovery and Data Mining (KDD ’17), Halifax, NS, USA, 13–17 August 2017; Association for Computing Machinery: New York, NY, USA, 2017; pp. 135–144. [Google Scholar] [CrossRef]
- Liu, F.T.; Ting, K.M.; Zhou, Z.H. Isolation-Based Anomaly Detection. ACM Trans. Knowl. Discov. Data 2012, 6, 1–39. [Google Scholar] [CrossRef]
- Breunig, M.M.; Kriegel, H.P.; Ng, R.T.; Sander, J. LOF: Identifying Density-Based Local Outliers. SIGMOD Rec. 2000, 29, 93–104. [Google Scholar] [CrossRef]
- Feasel, K. Connectivity-Based Outlier Factor (COF). In Finding Ghosts in Your Data: Anomaly Detection Techniques with Examples in Python; Apress: Berkeley, CA, USA, 2022; pp. 185–201. [Google Scholar] [CrossRef]

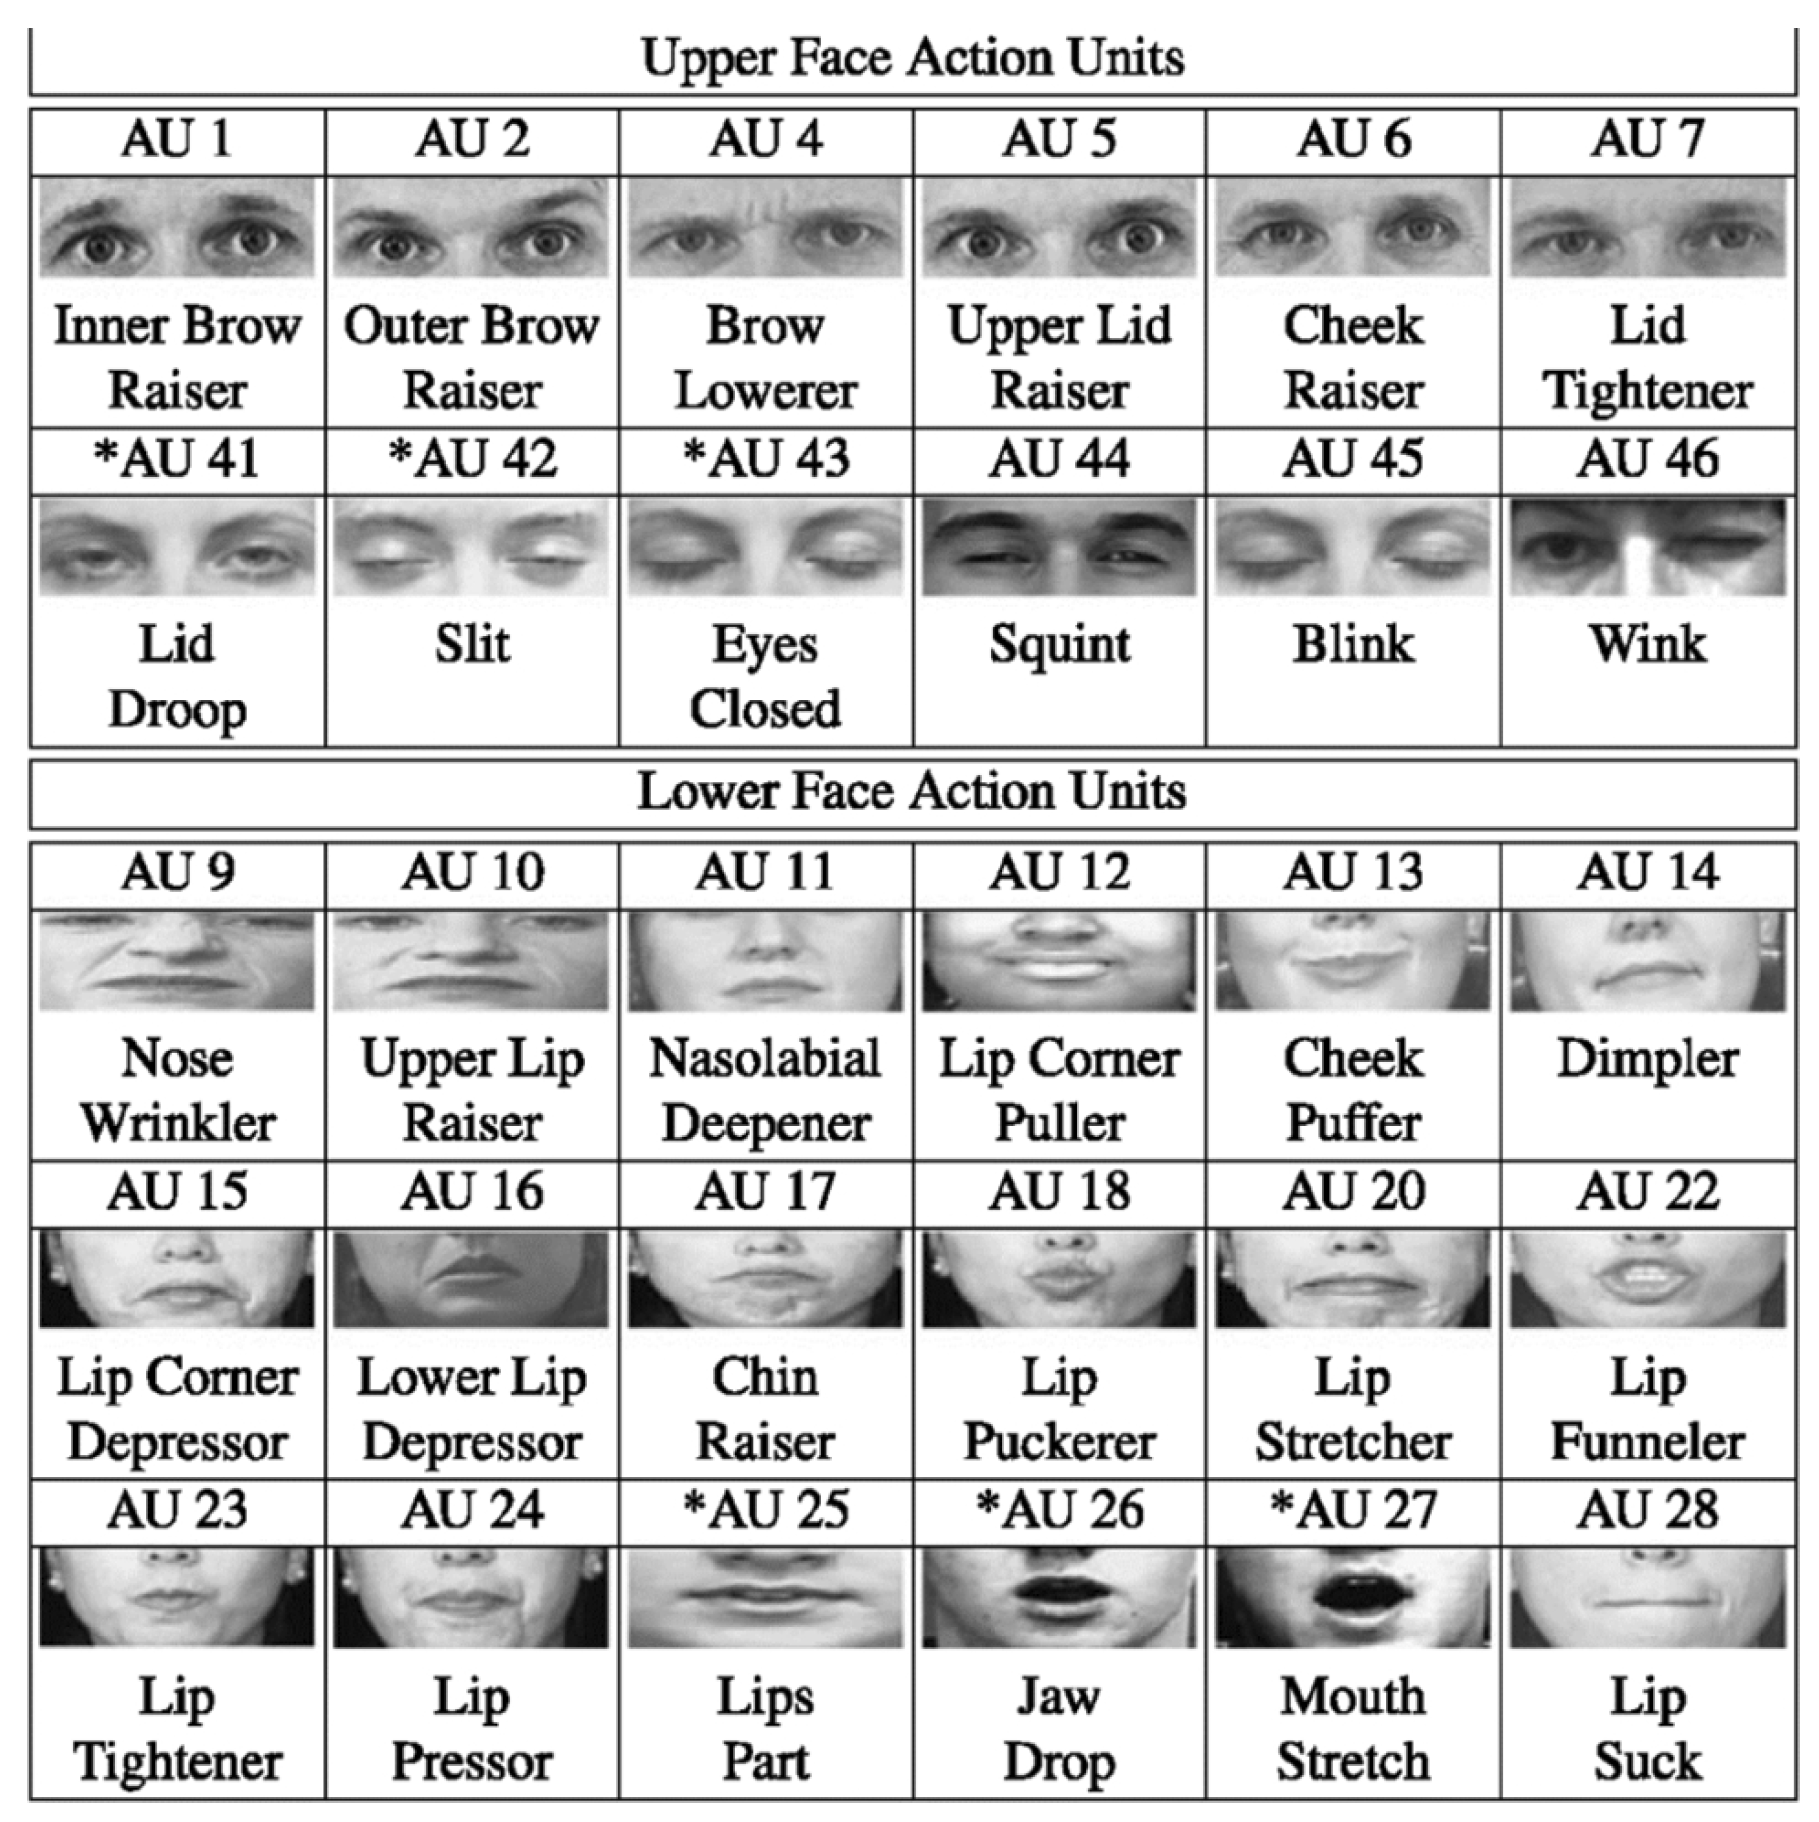
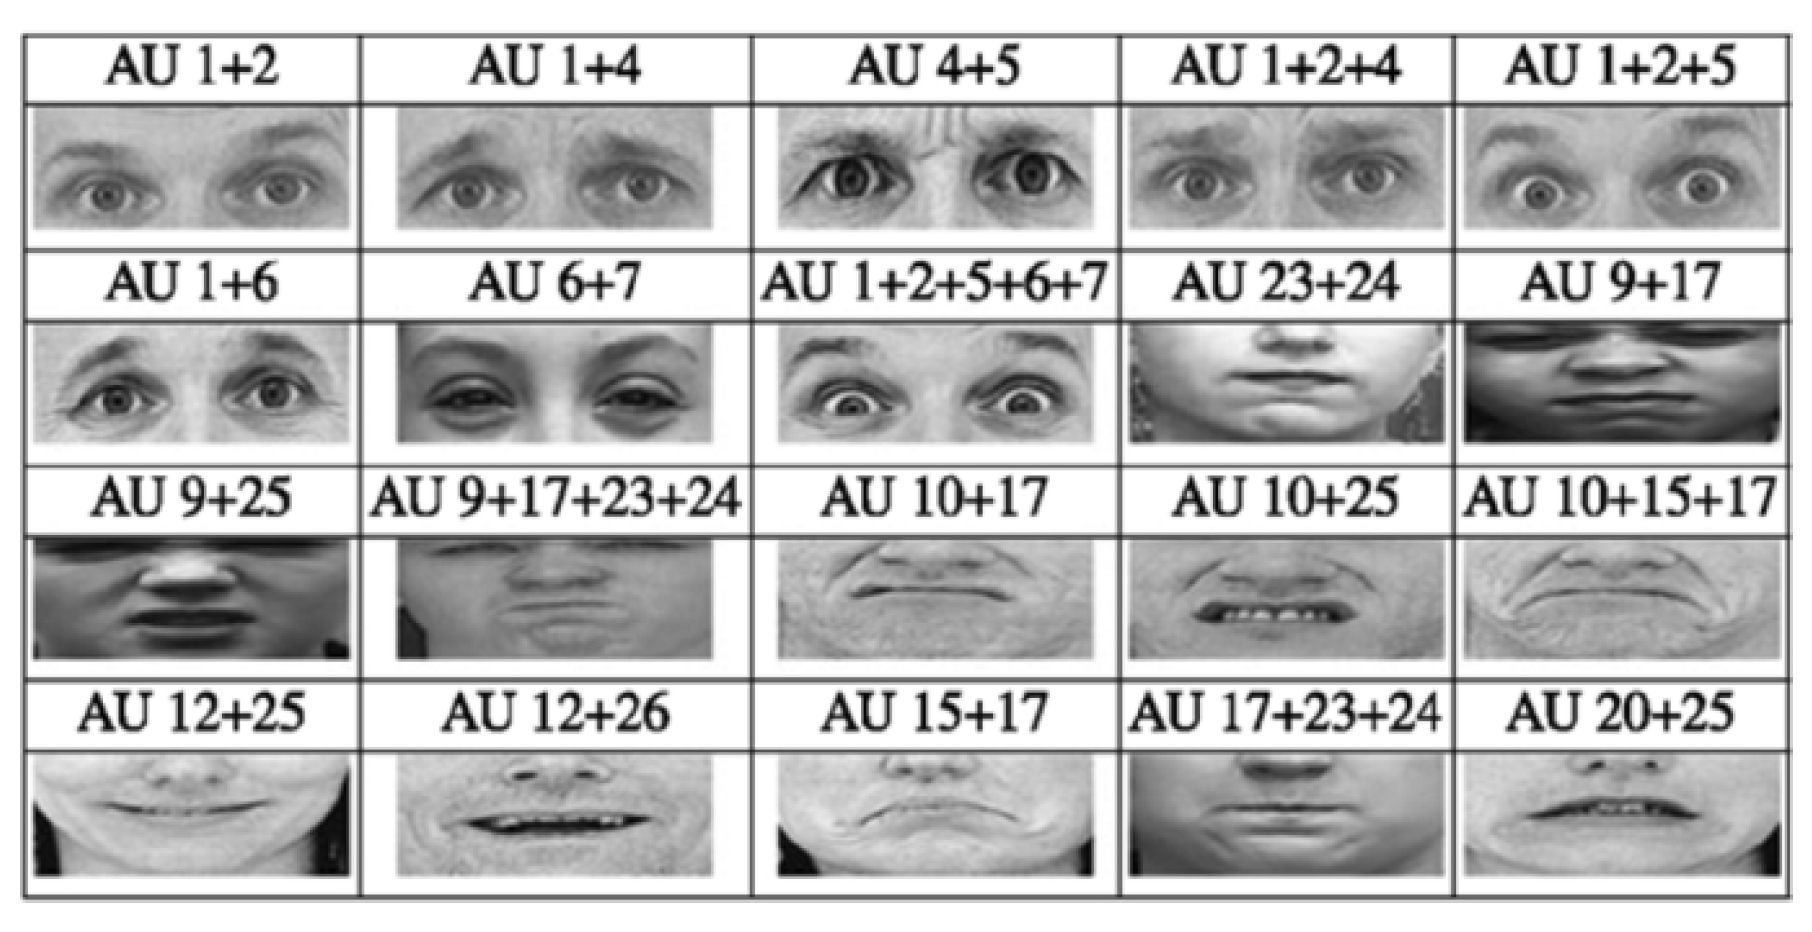
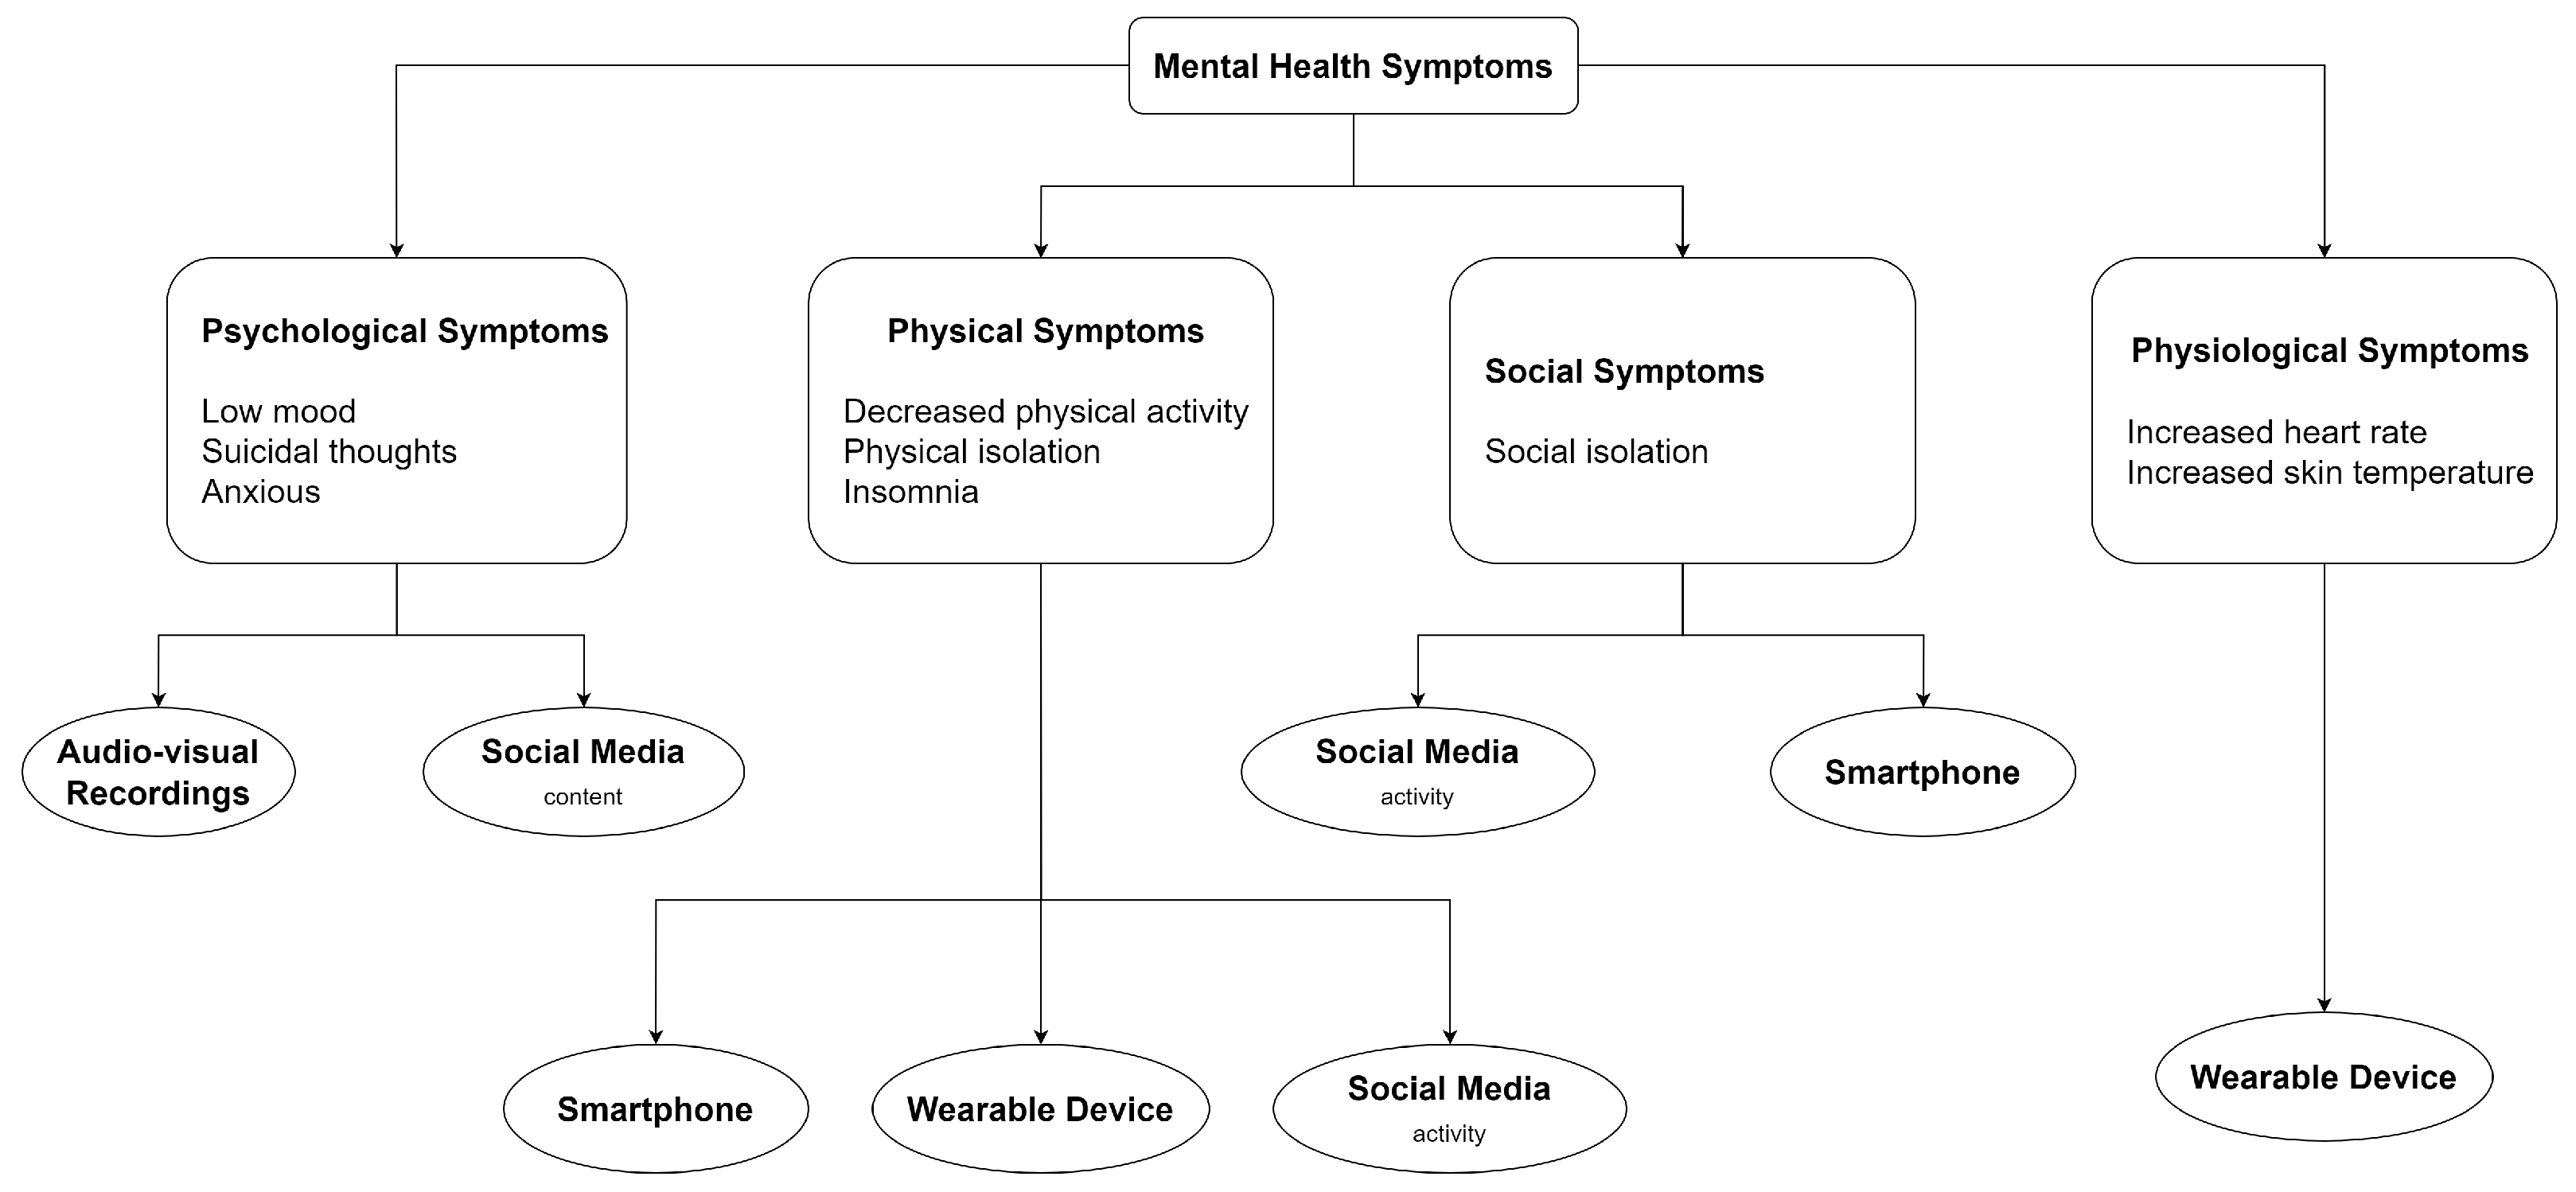
| Category | Keywords |
|---|---|
| Mental disorder | Mental health, mental disorder, mental illness, mental wellness, mental wellbeing |
| Method | Artificial intelligence, machine learning, model |
| Outcome | Detect, predict, classify, monitor, recognize, identify |
| Data source/modality | Social media, text, speech, voice, audio, visual, image, video, smartphone, mobile, wearable, sensor |
| ID | Item | RQ |
|---|---|---|
| I1 | Reference (authors and year) | N/A |
| I2 | Title | N/A |
| I3 | Mental health disorder investigated | N/A |
| I4 | Data collection process | RQ1 |
| I5 | Ground truth/data labeling | RQ1 |
| I6 | Feature extraction process | RQ2 |
| I7 | Feature transformation process if any | RQ2 |
| I8 | Feature fusion process | RQ2 |
| I9 | Machine learning model | RQ3 |
| I10 | Results achieved | N/A |
| I11 | Analysis findings if any | N/A |
| ID | Criteria | Scoring |
|---|---|---|
| QC1 | Was there an adequate description of the context in which the research was carried out? | The design, setup, and experimental procedure are adequately (1), partially (0.5), or poorly described (0) |
| QC2 | Were the participants representative of the population to which the results will generalize? | The participants fully (1), partially (0.5), or do not (0) represent the stated target population |
| QC3 | Was there a control group for comparison? | Control group has (1) or has not (0) been included |
| QC4 | Were the measures used in the research relevant for answering the research questions? | Adopted methodology and evaluation methods are fully (1), partially (0.5), or not (0) aligned with research objectives |
| QC5 | Were the data collection methods adequately described? | Data collection methods are adequately (1), partially (0.5), or poorly (0) described |
| QC6 | Were the data types (continuous, ordinal, categorical) and/or structures (dimensions) explained? | All (1), some (0.5), or none (0) of the data types and structures of various modalities are explained |
| QC7 | Were the feature extraction methods adequately described? | Feature extraction methods are adequately (1), partially (0.5), or poorly (0) described |
| QC8 | Were the machine learning approaches adequately described? | Machine learning models and architectures are adequately (1), partially (0.5), or poorly (0) described |
| QC9 | On a scale of 1–5, how reliable/effective was the machine learning approach? | Effectiveness, reliability and consistency of machine learning approach is well (5), partially (3), or poorly (0) justified through evaluation, analysis and baseline comparison |
| QC10 | Was there a clear statement of findings? | Experimental findings are well (1), partially (0.5), or poorly (0) described |
| QC11 | Were limitations to the results discussed? | Result limitations are well (1), partially (0.5), or poorly (0) identified |
| QC12 | Was the study of value for research or practice? | Research methodology or outcomes well (1), partially (0.5), or poorly (0) contribute valuable findings or application |
| Dataset | Description | Mental Health Disorders | Source Category |
|---|---|---|---|
| Distress Analysis Interview Corpus—Wizard of Oz (DAIC-WOZ) [228] | Video recordings and text transcriptions of interviews conducted by a virtual interviewer on individual participants (used in Audio-Visual Emotion Challenge (AVEC) 2014 [38], 2016 [47], 2017 [238], and 2019 [239]) | Post-traumatic stress disorder (PTSD), depression, anxiety | AV |
| Turkish Audio-Visual Bipolar Disorder Corpus [230] | Video recordings of patients during follow-ups in a hospital | Bipolar disorder | AV |
| Engagement Arousal Self-Efficacy (EASE) [240] | Video recordings of individuals undergoing self-regulated tasks by interacting with a website | PTSD | AV |
| Well-being [241] | Video recordings of conversational interviews conducted by a computer science researcher | Depression, anxiety | AV |
| Emotional Audio-Textual Depression Corpus (EATD-Corpus) [73] | Audio responses and text transcripts extracted from student interviews conducted by a virtual interviewer through an application | Depression | AV |
| Reddit Self-Reported Depression Diagnosis Corpus (RSDD) [231] | Reddit posts of self-claimed and control users | Depression | SM |
| Self-Reported Mental Health Diagnosis Corpus (SMHD) [242] | Twitter posts of users with one or multiple mental health conditions and control users | ADHD, anxiety, autism, bipolar disorder, borderline personality disorder, depression, eating disorder, OCD, PTSD, schizophrenia, seasonal affective disorder | SM |
| Multi-modal Getty Image depression and emotion (MGID) dataset [106] | Textual and visual documents from Getty Image with equal amount of depressive and non-depressive samples | Depression | SM |
| Sina-Weibo suicidal dataset [243] | Sina microblog posts of suicidal and control users | Suicidal ideation | SM |
| Weibo User Depression Detection dataset (WU3D) [112] | Sina microblog posts of depressed candidates and control users, and user information such as nickname, gender and profile description | Depression | SM |
| Chinese Microblog depression dataset [244] | Sina microblog posts following the last posts of individuals who have committed suicide | Depression | SM |
| eRisk 2016 dataset [245] | Textual posts and comments of depressed and control users from Twitter, MTV’s A Thin Line (ATL) and Reddit | Depression | SM |
| eRisk 2018 dataset [246] | Textual posts and comments from Twitter, MTV’s A Thin Line (ATL) and Reddit | Depression, anorexia | SM |
| StudentLife [237] | Smartphone sensor data of students from a college | Mental wellbeing, stress, depression | SS |
| CrossCheck [205] | Smartphone sensor data of schizophrenia patients | Schizophrenia | SS |
| Student Suicidal Ideation and Depression Detection (StudentSADD [100] | Voice recordings and textual responses obtained using smartphone microphones and keyboards | Suicidal ideation, depression | AV, SS |
| BiAffect dataset [247] | Keyboard typing dynamics captured by a mobile application | Depression | SS |
| Tesserae dataset [248] | Smartphone and smartwatch sensor data, Bluetooth beacon signals, and Instagram and Twitter data of information workers | Mood, anxiety, stress | SS, WS, SM |
| CLPsych 2015 Shared Task dataset [249] | Twitter posts of users who publicly stated a diagnosis of depression or PTSD with corresponding control users of the same estimated gender with the closest estimated age | Depression, PTSD | SM |
| multiRedditDep dataset [128] | Reddit images posted by users who posted at least once in the /r/depression forum | Depression | SM |
| Fitbit Bring-Your-Own-Device (BYOD) project by “All of Us” research program [250] | Fitbit data (e.g., steps, calories, and active duration), clinical assessments, demographics | Depression, anxiety | WS |
| PsycheNet dataset [138] | Social contagion-based dataset containing timelines of Twitter users and those with whom they maintain bidirectional friendships | Depression | SM |
| PsycheNet-G dataset [139] | Extends PsycheNet dataset [138] by incorporating users’ social interactions, including bidirectional replies, mentions, and quote-tweets | Depression | SM |
| Spanish Twitter Anorexia Nervosa (AN)-related dataset [251] | Tweets posted by users whom clinical experts identified to fall into categories of AN (at early and advanced stages of AN but do not undergo treatment), treatment, recovered, focused control (control users that used AN-related vocabulary), and random control | AN | SM |
| Audio-visual depressive language corpus (AViD-Corpus) [37] | Video clips of individuals performing PowerPoint-guided tasks, such as sustained vowel, loud vowel, and smiling vowel phonations, and speaking out loud while solving a task (used in AVEC 2013 [37]) | Depression | AV |
| Existing call log dataset [222] | Call and text messaging logs and GPS data collected via mobile application and in-person demographic and mental wellbeing surveys | Mental wellbeing | SS |
| Speech dataset [252] | Audio recordings of individuals performing two speech tasks via an external web application and demographics obtained from recruitment platform, Prolific [253] | Anxiety | AV |
| Early Mental Health Uncovering (EMU) dataset [104] | Data gathered via a mobile application that collects sensor data (i.e., text and call logs, calendar logs, and GPS), Twitter posts, and audio samples from scripted and unscripted prompts and administers PHQ-9 and GAD-7 questionnaires and demographic (i.e., gender, age, and student status) questions | Depression, anxiety | SS, AV, SM |
| Depression Stereotype Threat Call and Text log subset (DepreST-CAT) [105] | Data gathered via modifying the EMU application [104] to collect additional demographic (i.e., gender, age, student status, history of depression treatment, and racial/ethnic identity) and COVID-19 related questions | Depression, anxiety | SS, AV, SM |
| D-vlog dataset [92] | YouTube videos with equal amounts of depressed and non-depressed vlogs | Depression | AV |
| Modality | Category | Description | Examples |
|---|---|---|---|
| Audio | Voice | Characteristics of audio signals | Mel-frequency cepstral coefficients (MFCCs), pitch, energy, harmonic-to-noise ratio (HNR), zero-crossing rate (ZCR) |
| Speech | Speech characteristics | Utterance, pause, articulation | |
| Representations | Extracted from model architectures applied onto audio samples or representations | Features extracted from specific layers of pre-trained deep SoundNet [259] network applied onto audio samples | |
| Derived | Derived from other features via computation methods or models | High-level features extracted from long short-term memory (LSTM) [260] model applied onto SoundNet representations to capture temporal information | |
| Visual | Subject/object | Presence or features of a person or object | Face appearance, facial landmarks, upper body points |
| Representations | Extracted from model architectures applied onto image frames or representations | Features extracted from specific layers of VGG-16 network [261] (pre-trained on ImageNet [262]) applied onto visual frames | |
| Emotion-related | Capture emotions associated with facial expressions or image sentiment | Facial action units (FAUs) corresponding to Ekman’s model of six emotions [263], i.e., anger, disgust, fear, joy, sadness, and surprise, or eight basic emotions [264] that additionally include trust, negative and positive | |
| Textual | Textual content or labels | Quotes in images identified via optical character recognition (OCR) | |
| Color-related | Color information | Hue, saturation, color | |
| Image metadata | Image characteristics and format | Width, height, presence of exchangeable image file format (exif) file | |
| Derived | Derived from other features via computation methods or models | Fisher vector (FV) encoding [265] of facial landmarks | |
| Textual | Linguistic | Language in terms of choice of words and sentence structure | Pronouns, verbs, suicidal keywords |
| Sentiment-related | Emotion and sentiment components extracted via sentiment analysis (SA) tools | Valence, arousal and dominance (VAD) ratings | |
| Semantic-related | Meaning of texts | Topics and categories describing text content | |
| Representations | Vector representations generated using language models | Features extracted from pre-trained Bidirectional Encoder Representations from Transformers (BERT) [266] applied onto texts | |
| Derived | Derived from other features via computation methods or models | Features extracted from LSTM with attention mechanism applied onto textual representations to emphasize significant words | |
| Social media | Post metadata | Information associated with a social media post | Posting time, likes received |
| User metadata | Information associated with a social media user account | Profile description and image, followers, followings | |
| Representations | Representations of social network and interactions with other users | Graph network representing each user using a node and connecting two users mutually following each other | |
| Derived | Derived from other features via aggregation or encoding | Number of posts made on the weekends | |
| Smartphone sensor | Calls and messages | Relating to phone calls and text messaging | Frequency and duration of incoming/outgoing phone calls |
| Physical mobility | Inferences from accelerometer, gyroscope, and GPS data | Walking duration, distance traveled | |
| Phone interactions | Accessing phone, applications, and keyboards | Duration of phone unlocks, frequency of using specific applications, keystroke transitions | |
| Ambient environment | Surrounding illumination and noise | Brightness, human conversations | |
| Connectivity | Connections with external devices and environment | Association events with WiFi access points, occurrences of nearby Bluetooth devices | |
| Representations | High-level representations of time series sensor data | Features extracted from transformer to capture temporal patterns | |
| Derived | Derived from low-level features via computation or aggregation | Average weekly visited location clusters, sleep duration estimated from phone being locked and being stationary in a dark environment at night | |
| Wearable sensor | Physical mobility | Inferences related to physical motion and sleep | Number of steps, sleep duration and onset time |
| Physiological | Physiological signals | Heart rate, skin temperature | |
| Representations | High-level representations of time series sensor data | Features extracted from LSTM applied onto heart rate signals | |
| Demographics and Personalities | Demographic | Personal demographic information | Age, gender |
| Personality | An individual’s personality | Big 5 personality scores |
Disclaimer/Publisher’s Note: The statements, opinions and data contained in all publications are solely those of the individual author(s) and contributor(s) and not of MDPI and/or the editor(s). MDPI and/or the editor(s) disclaim responsibility for any injury to people or property resulting from any ideas, methods, instructions or products referred to in the content. |
© 2024 by the authors. Licensee MDPI, Basel, Switzerland. This article is an open access article distributed under the terms and conditions of the Creative Commons Attribution (CC BY) license (https://creativecommons.org/licenses/by/4.0/).
Share and Cite
Khoo, L.S.; Lim, M.K.; Chong, C.Y.; McNaney, R. Machine Learning for Multimodal Mental Health Detection: A Systematic Review of Passive Sensing Approaches. Sensors 2024, 24, 348. https://doi.org/10.3390/s24020348
Khoo LS, Lim MK, Chong CY, McNaney R. Machine Learning for Multimodal Mental Health Detection: A Systematic Review of Passive Sensing Approaches. Sensors. 2024; 24(2):348. https://doi.org/10.3390/s24020348
Chicago/Turabian StyleKhoo, Lin Sze, Mei Kuan Lim, Chun Yong Chong, and Roisin McNaney. 2024. "Machine Learning for Multimodal Mental Health Detection: A Systematic Review of Passive Sensing Approaches" Sensors 24, no. 2: 348. https://doi.org/10.3390/s24020348
APA StyleKhoo, L. S., Lim, M. K., Chong, C. Y., & McNaney, R. (2024). Machine Learning for Multimodal Mental Health Detection: A Systematic Review of Passive Sensing Approaches. Sensors, 24(2), 348. https://doi.org/10.3390/s24020348