
Viewer Engagement in Response to Mixed and Uniform Emotional Content in Marketing Videos—An Electroencephalographic Study


Abstract
1. Introduction
2. Materials and Methods
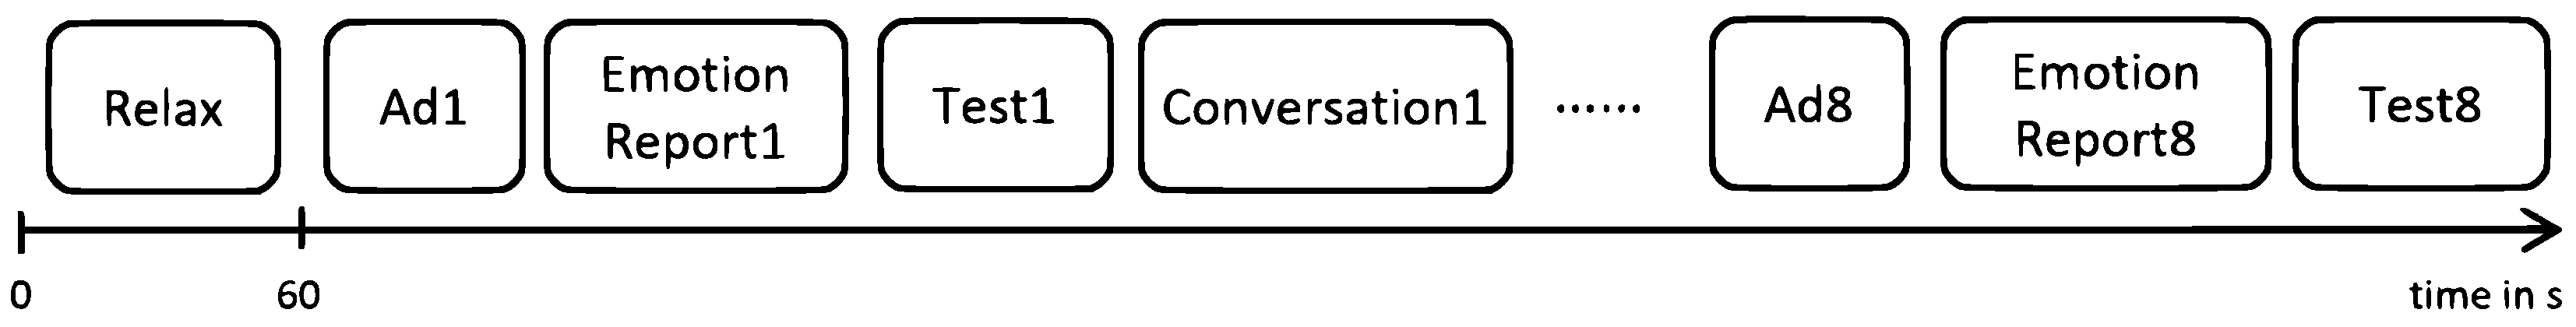
2.1. Experiment Setup
2.2. Videos
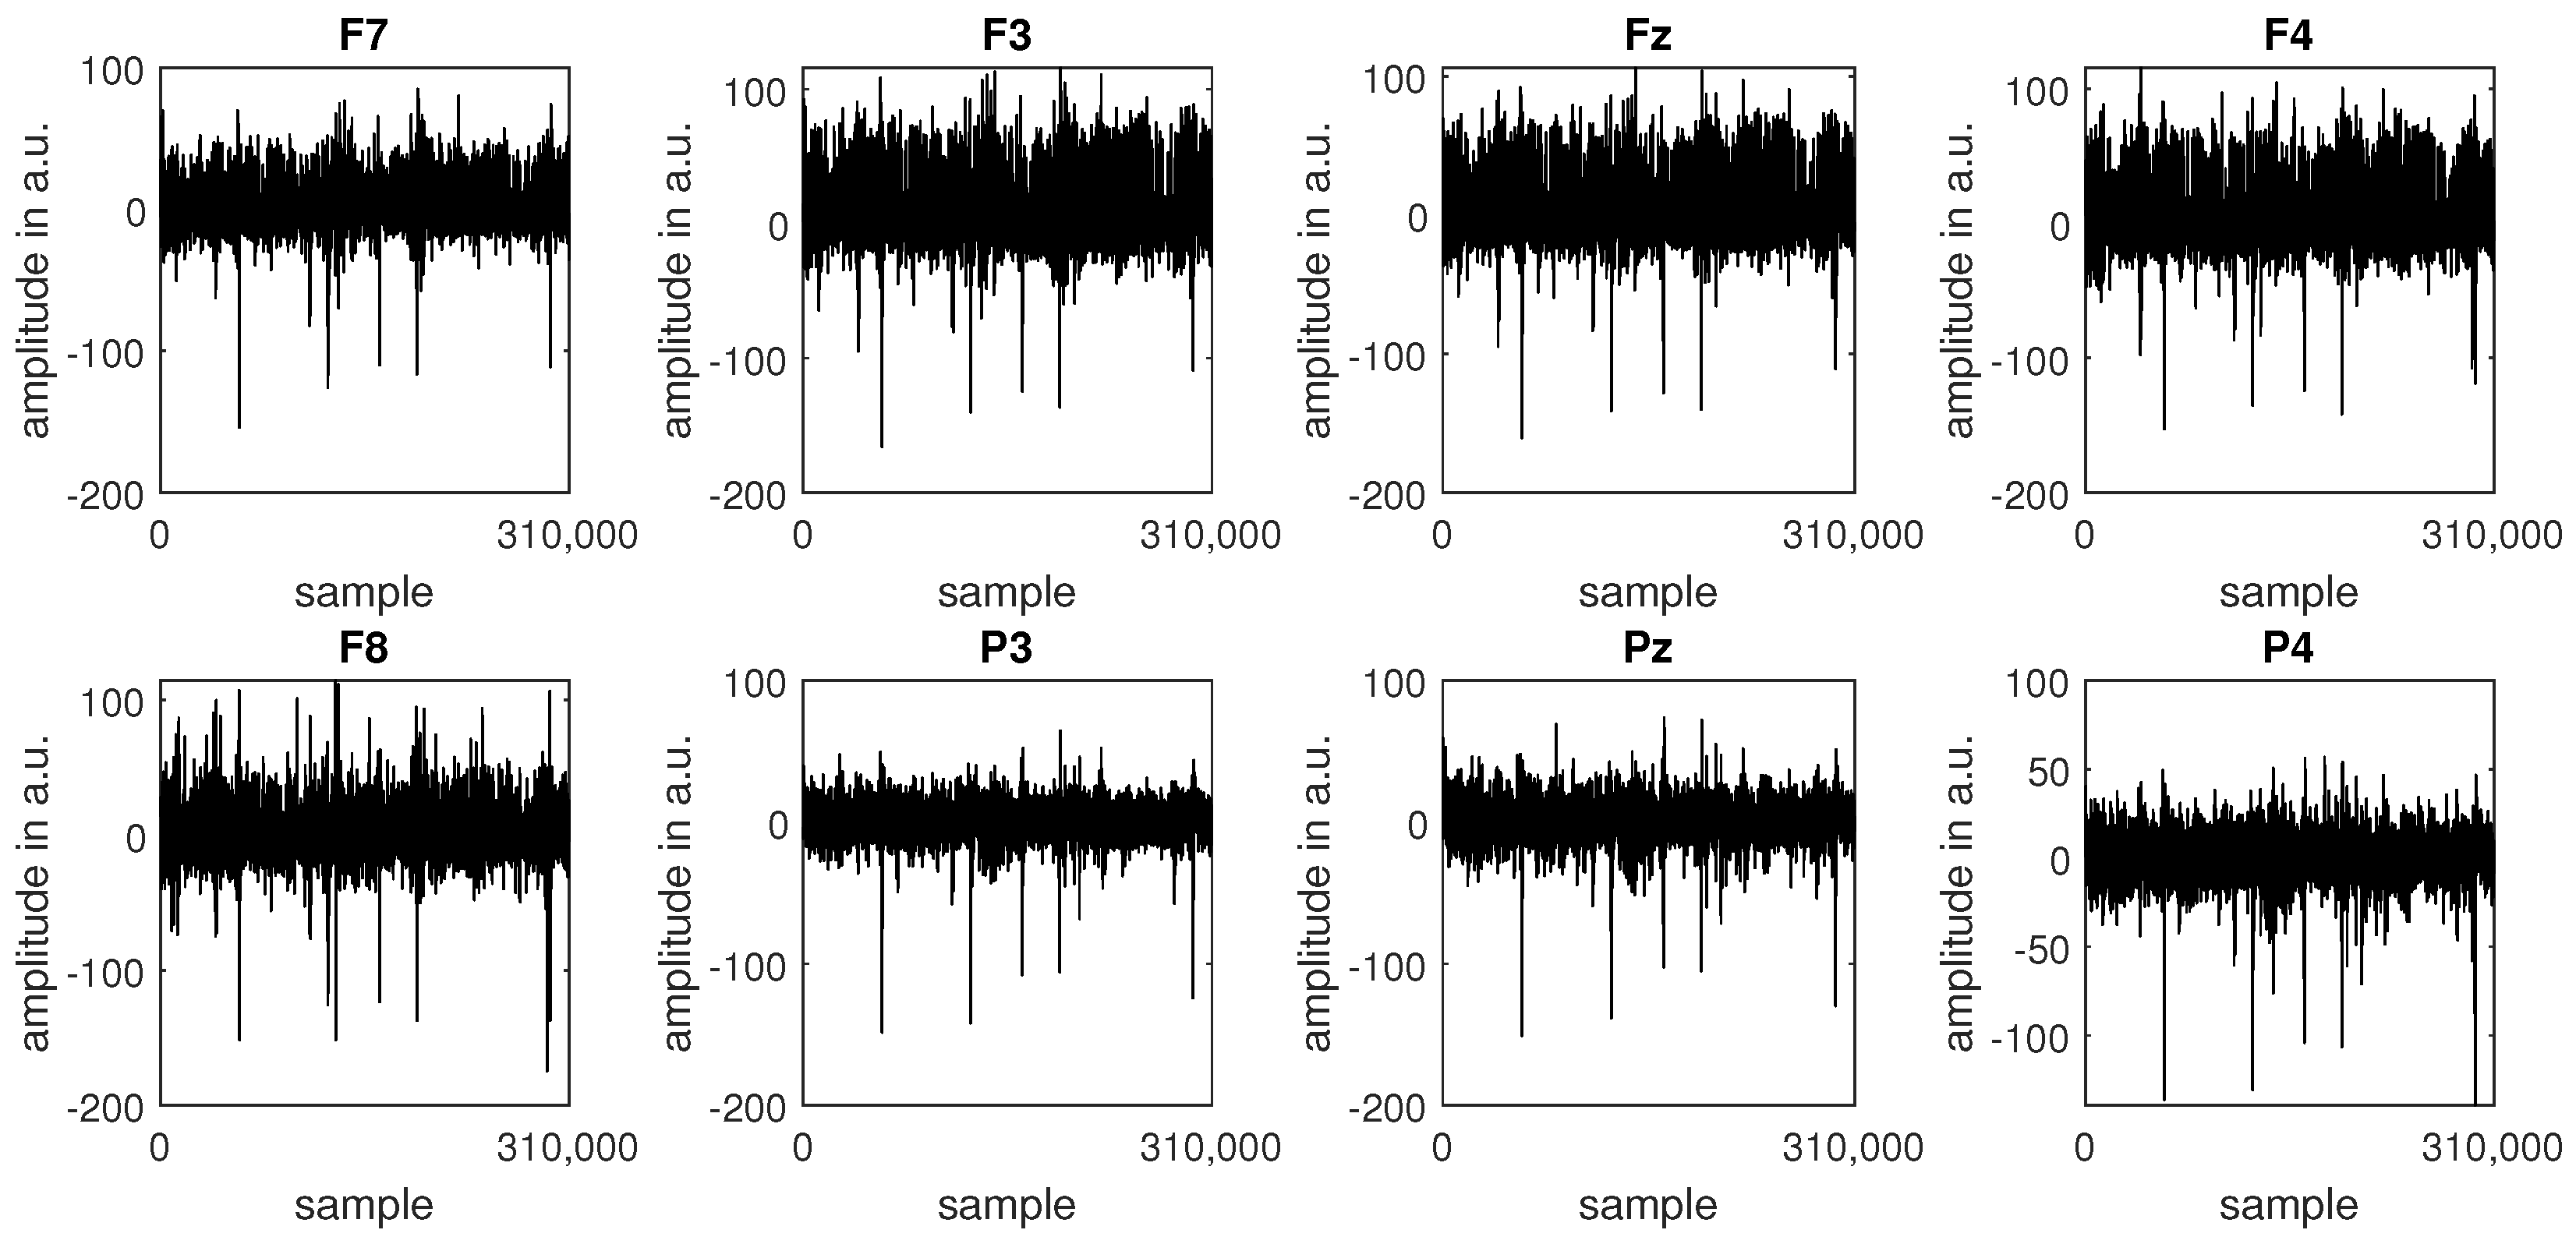
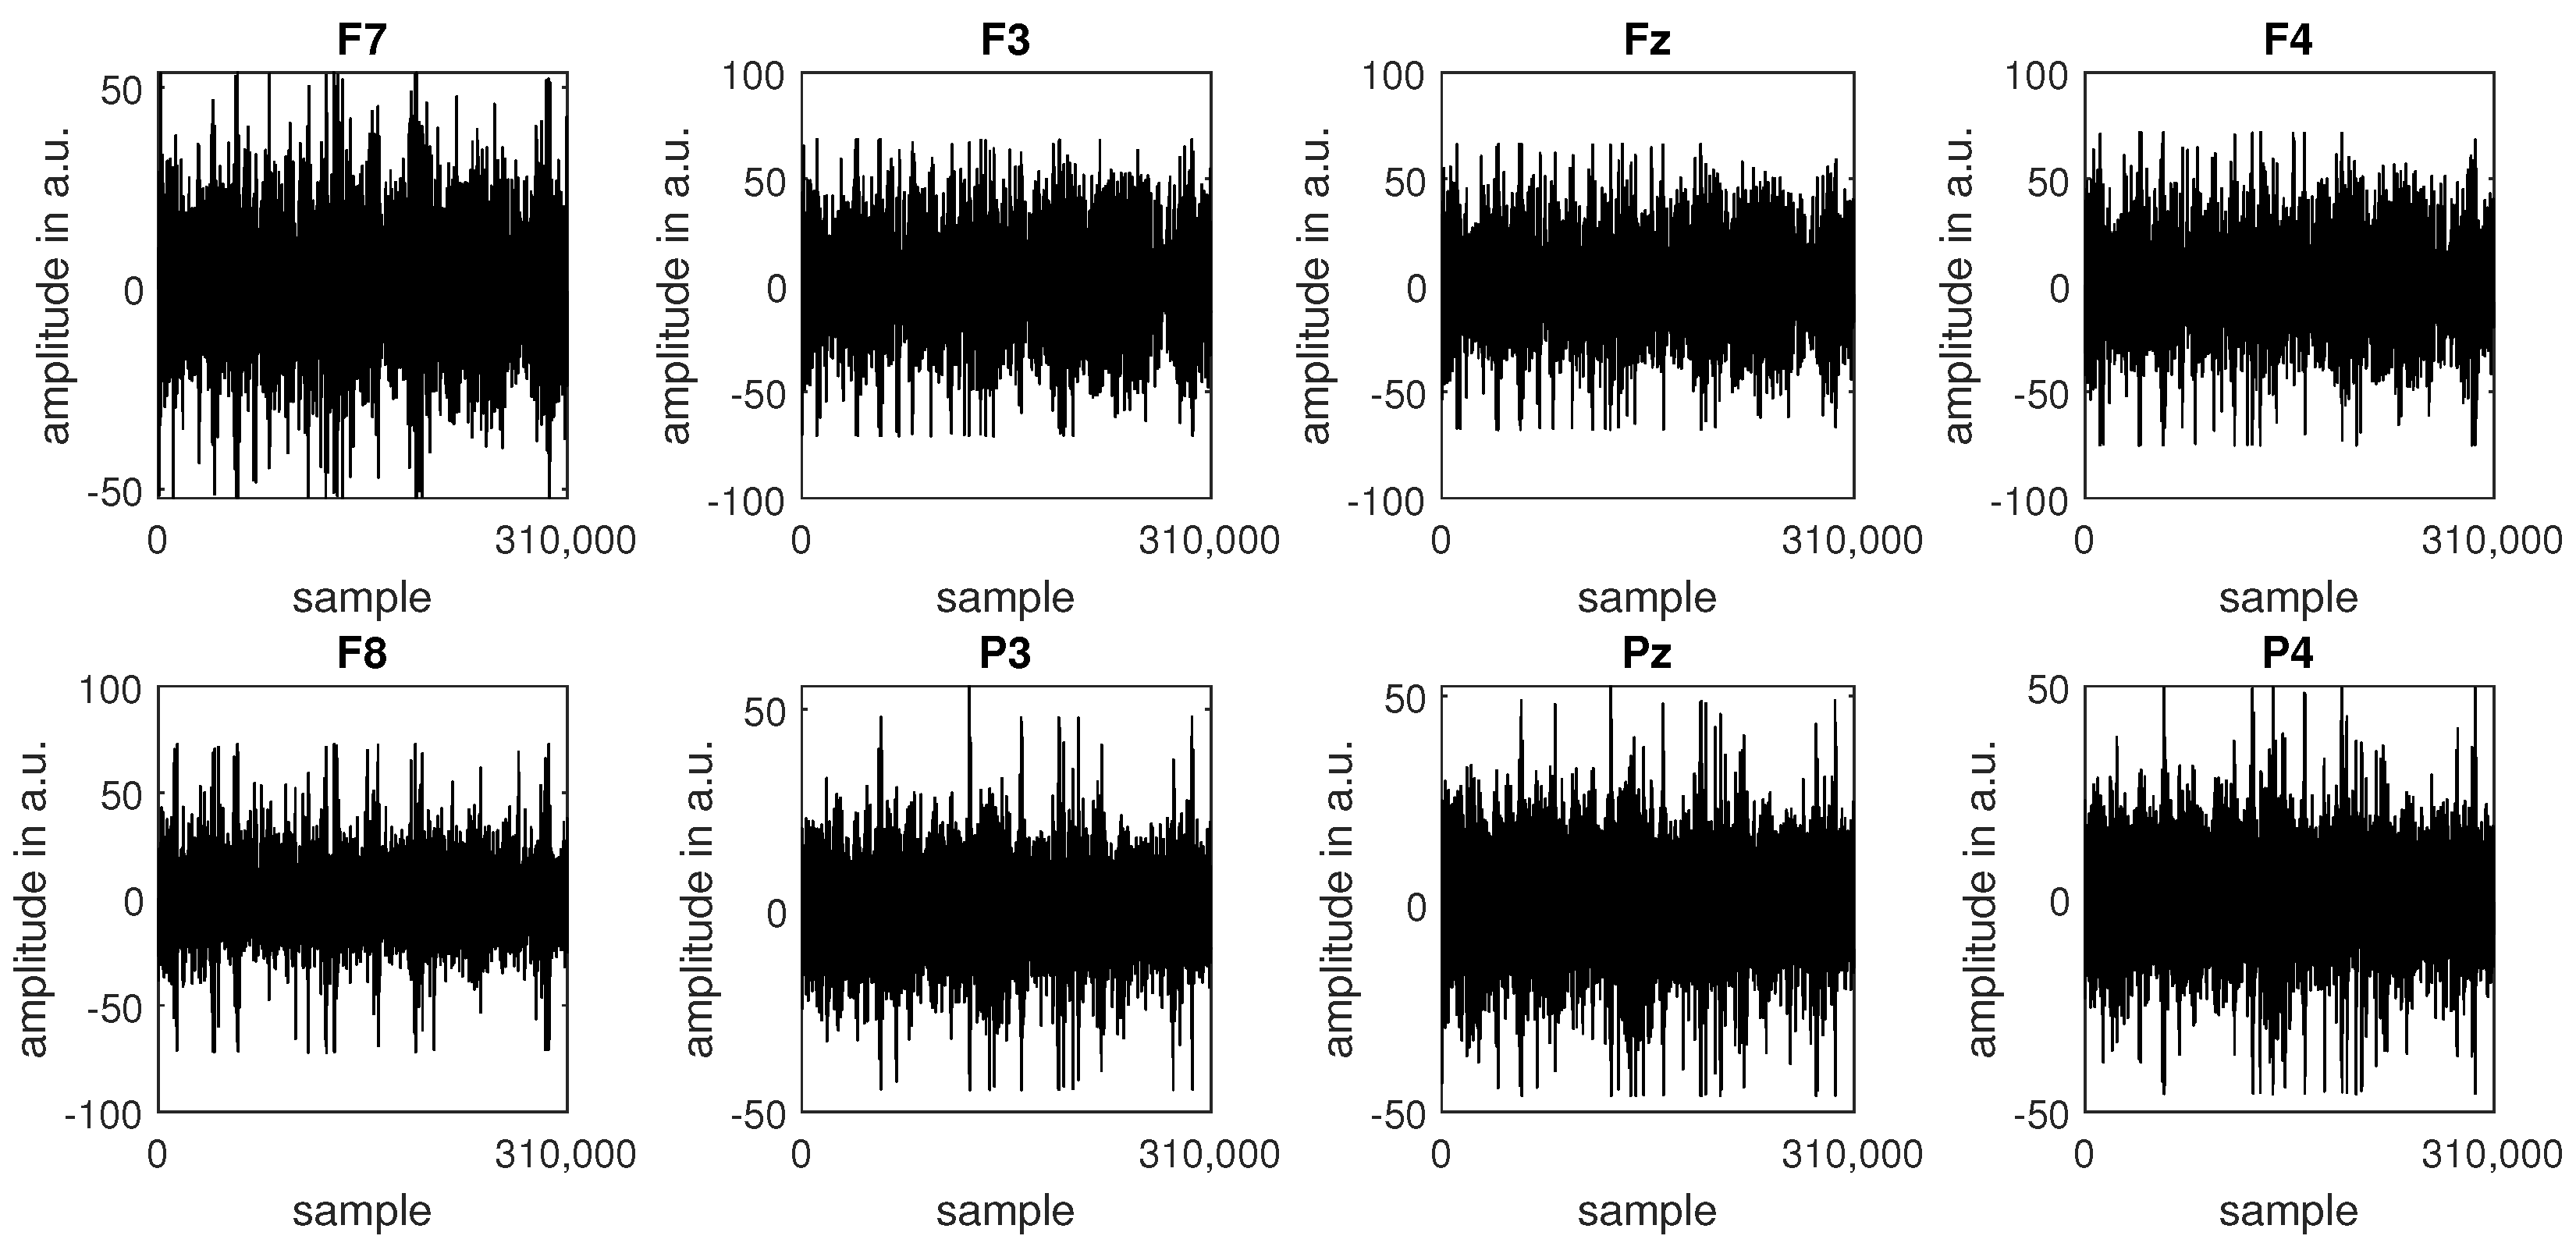
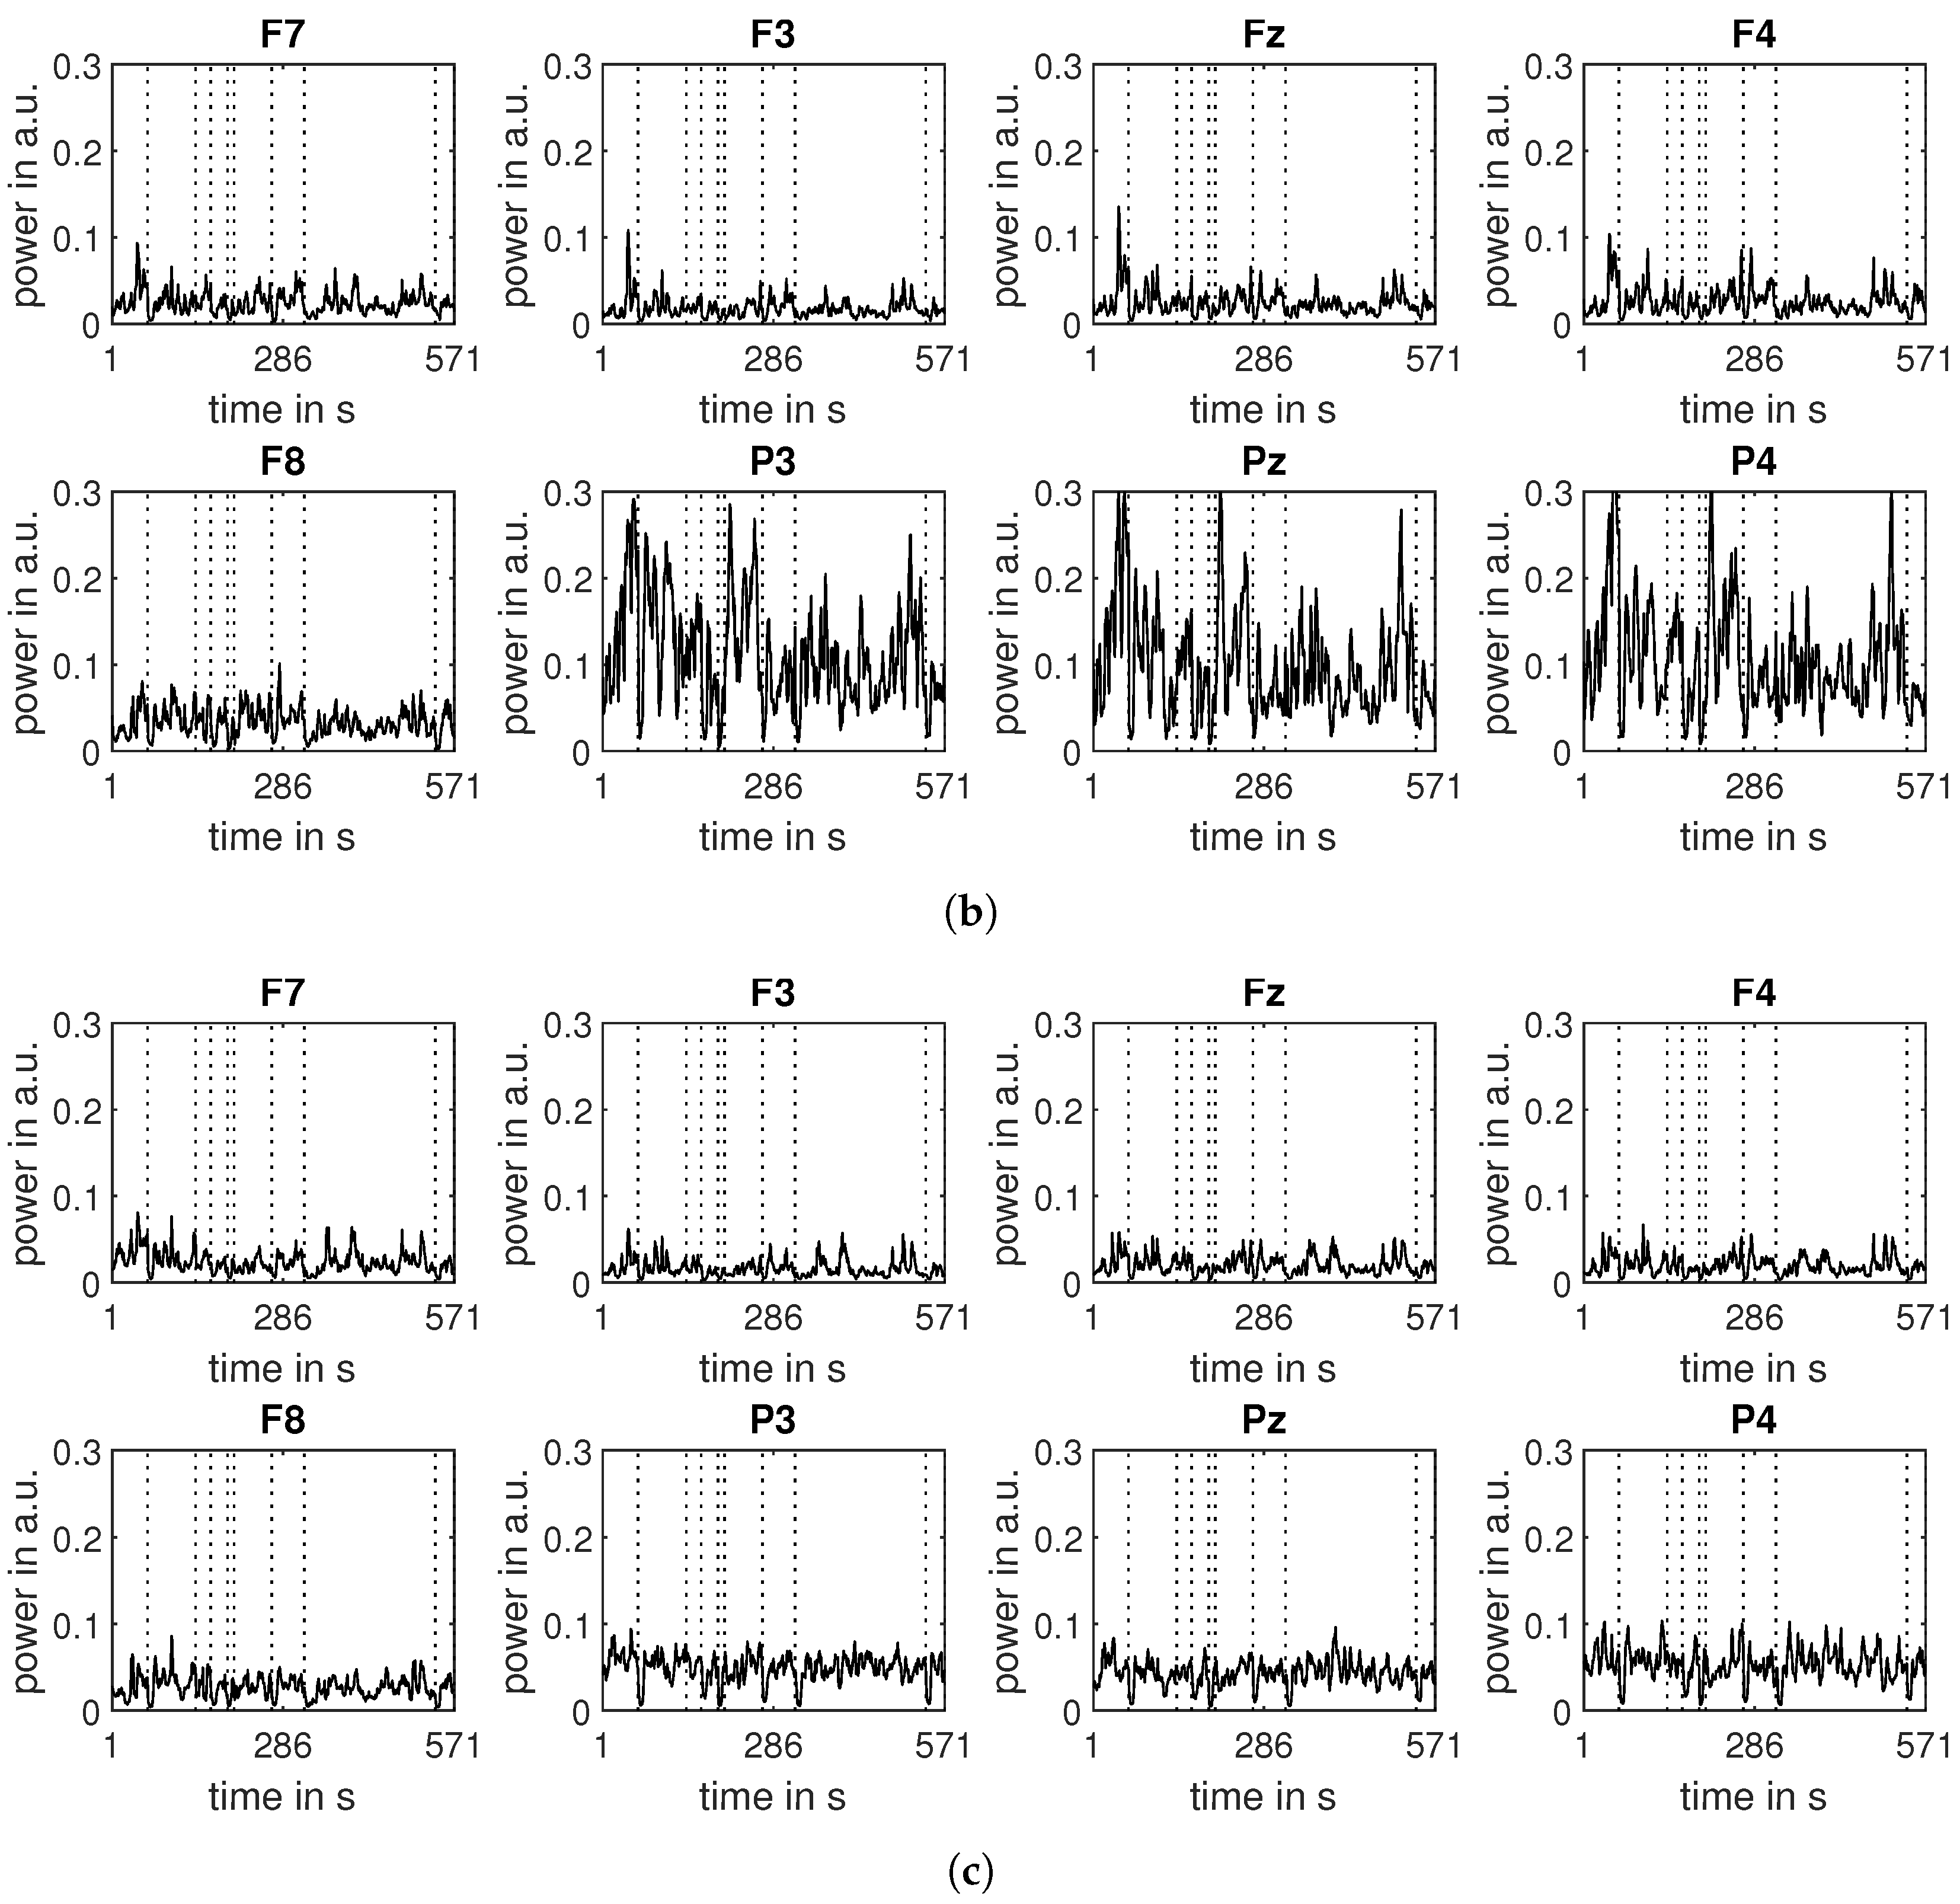
2.3. EEG Signal Processing
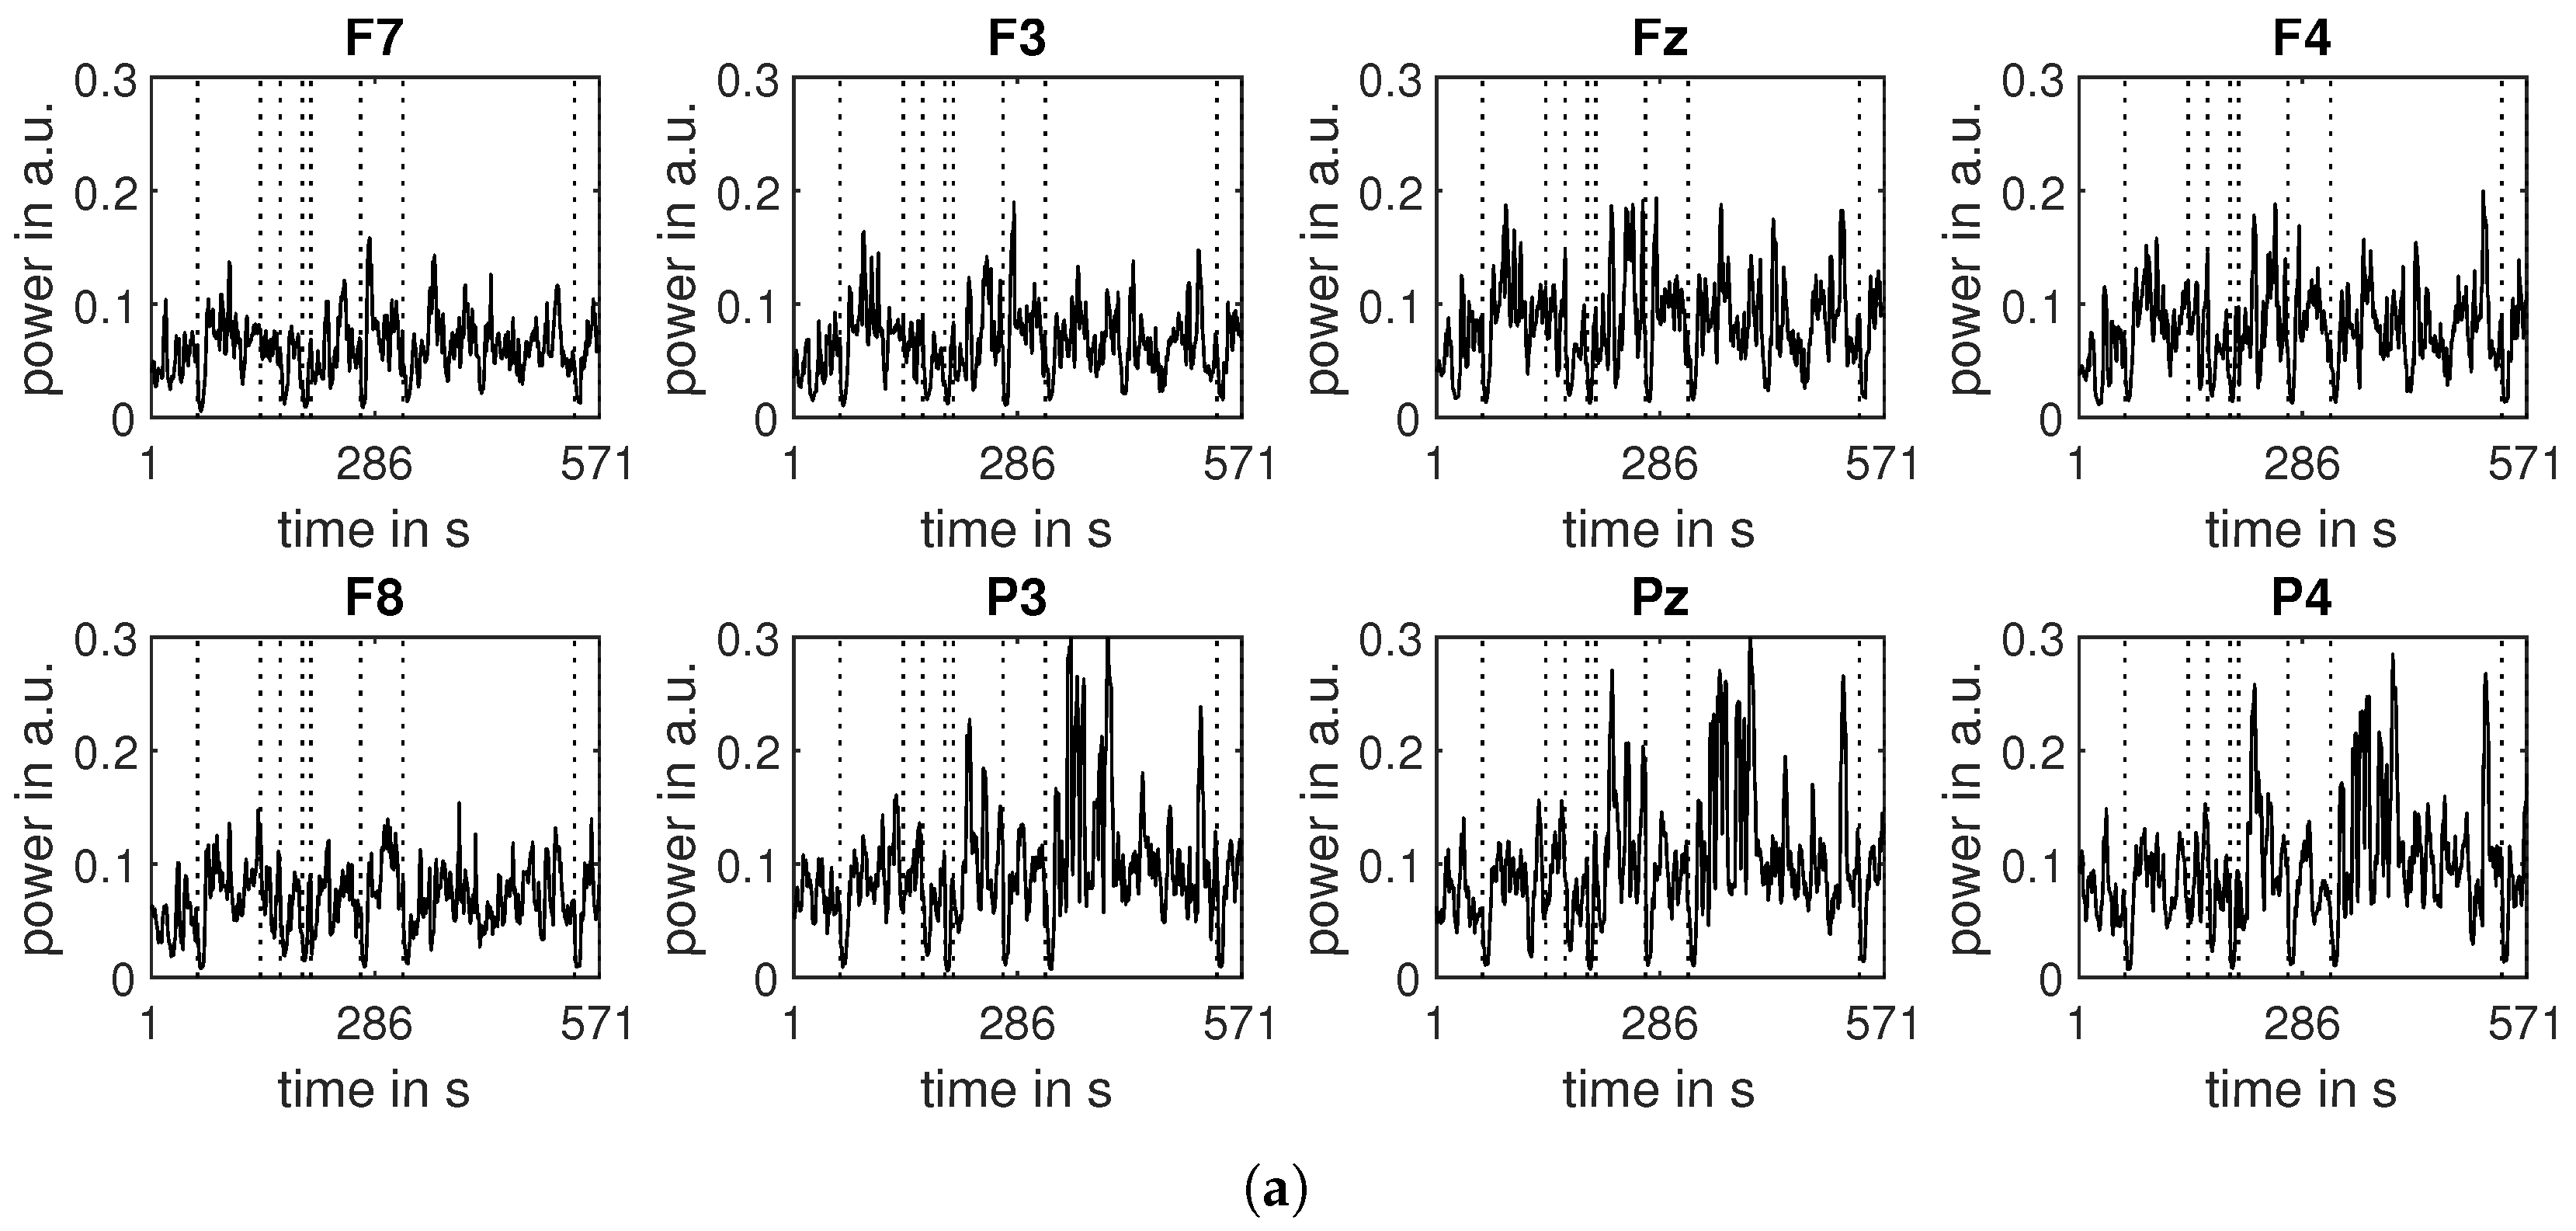
2.4. Engagement Index
- The relative band power features were used to calculate the engagement index:
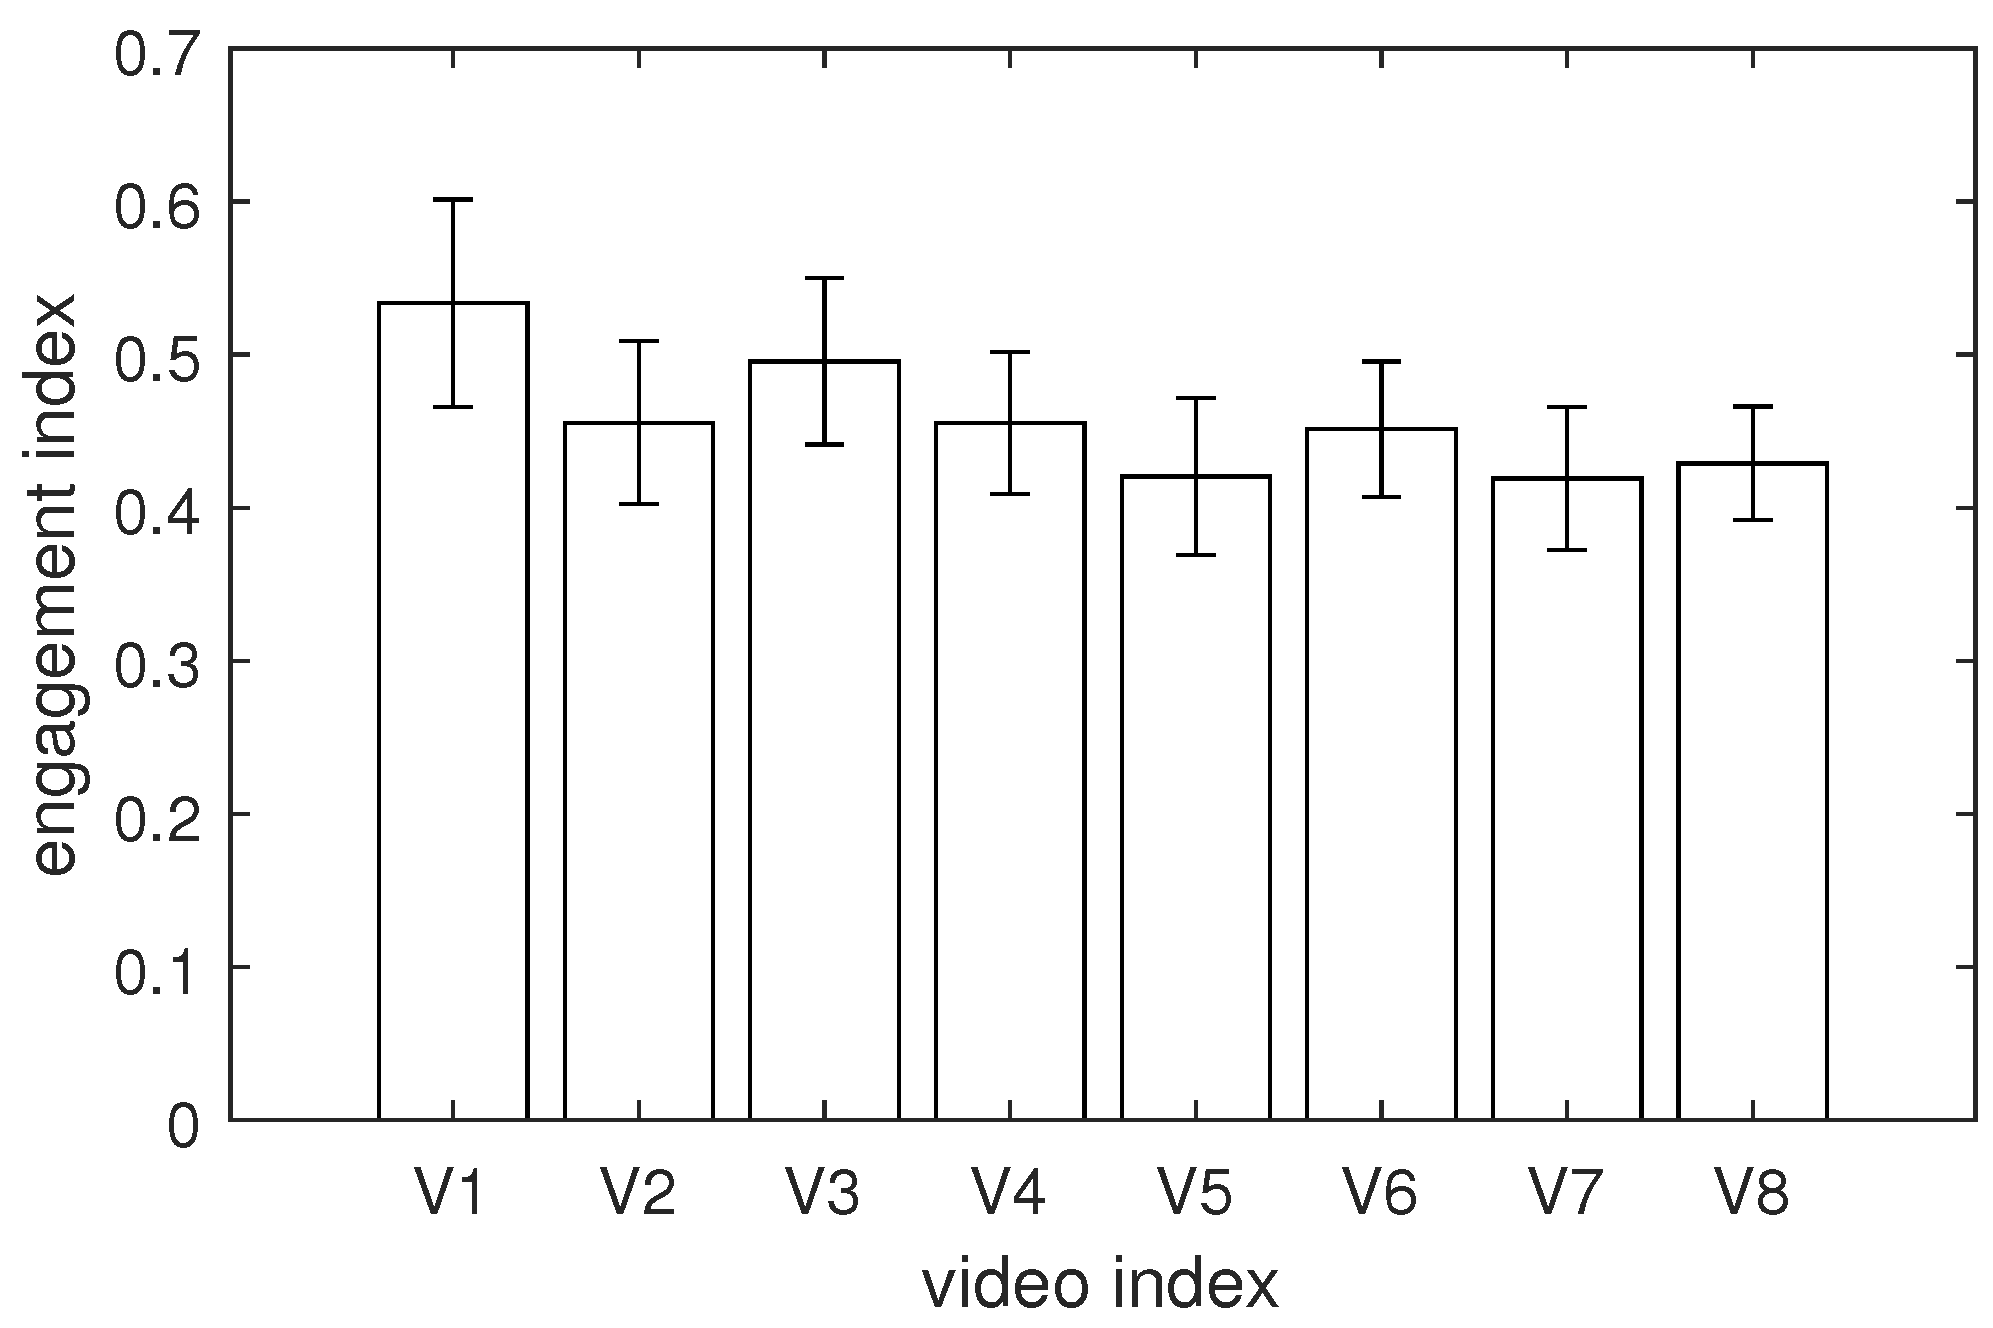
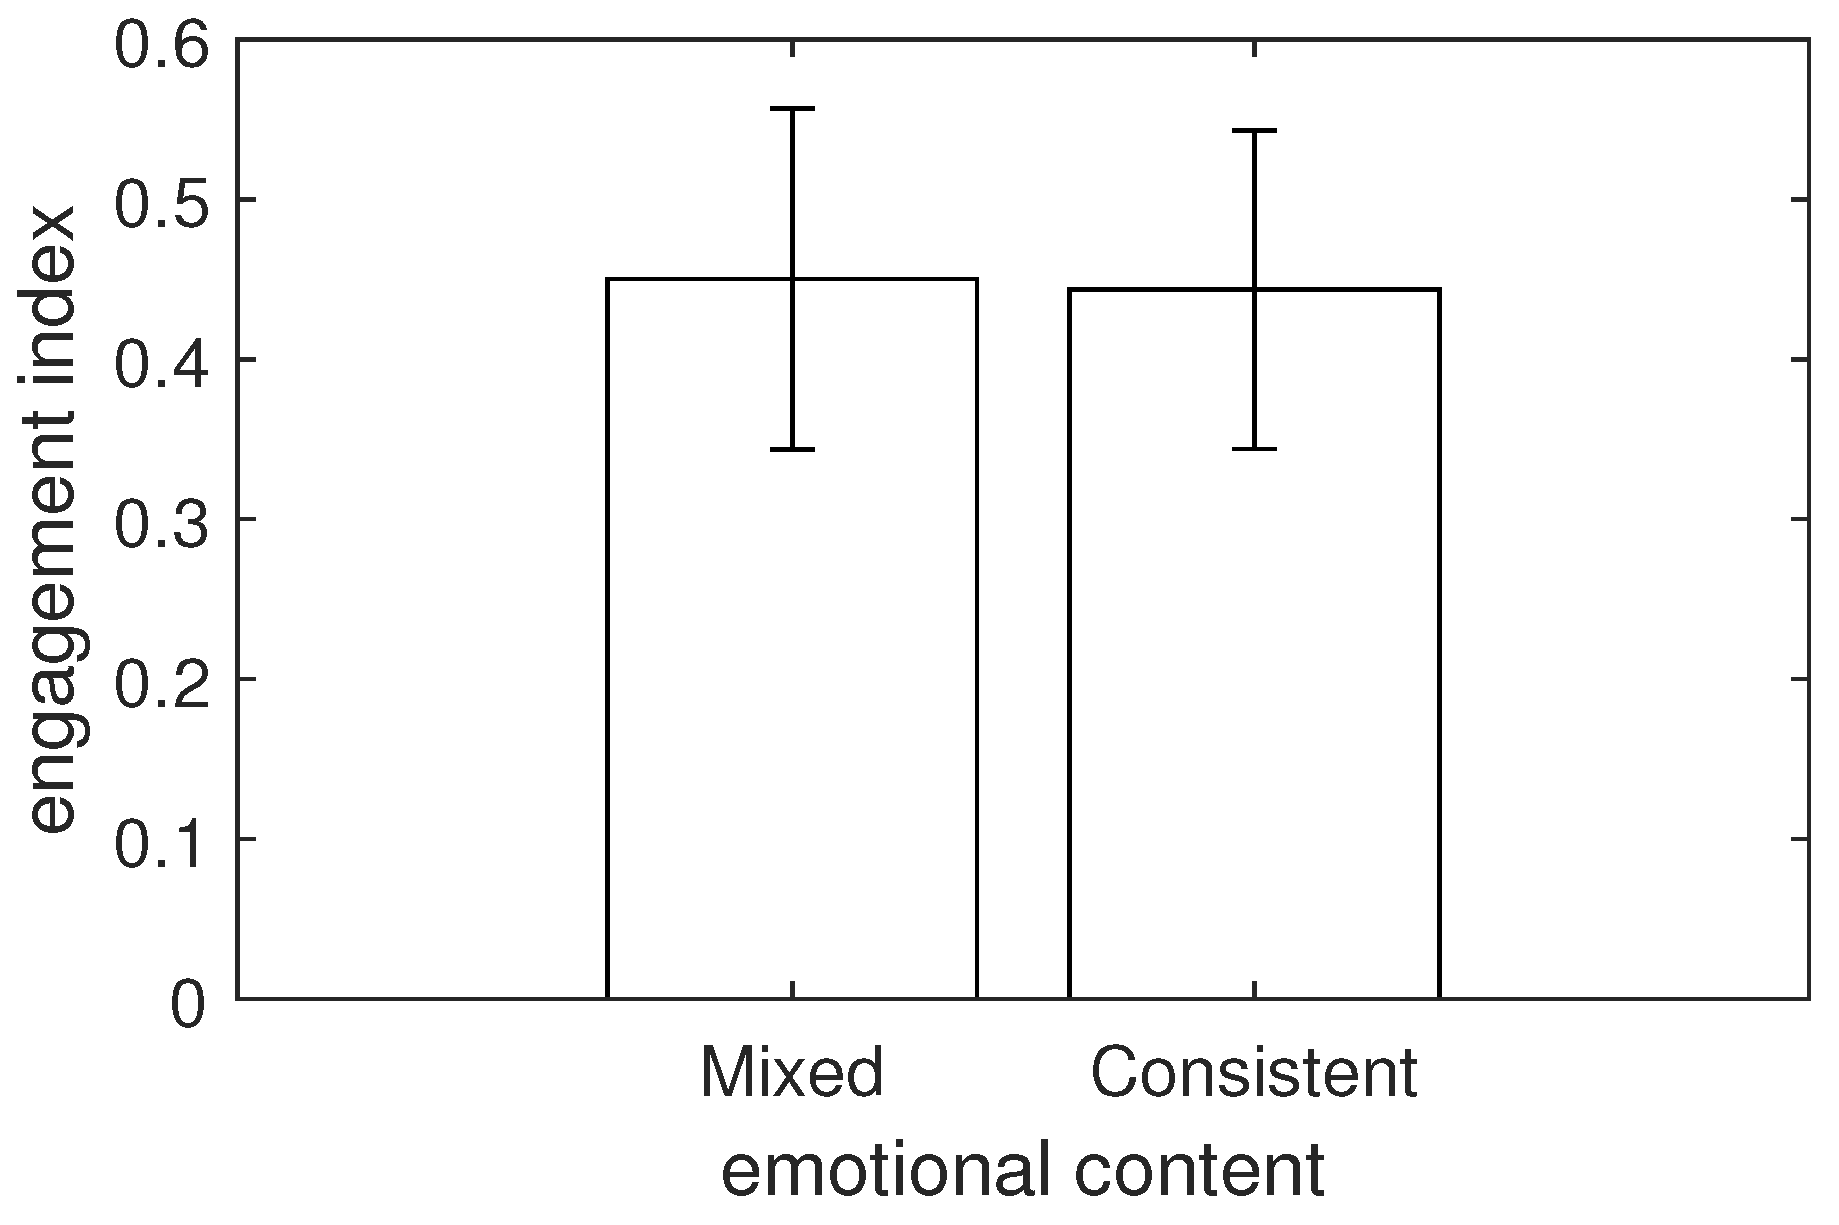
3. Results
4. Discussion
5. Conclusions
Author Contributions
Funding
Institutional Review Board Statement
Informed Consent Statement
Data Availability Statement
Conflicts of Interest
References
- Frade, J.L.H.; de Oliveira, J.H.C.; Giraldi, J.d.M.E. Advertising in streaming video: An integrative literature review and research agenda. Telecommun. Policy 2021, 45, 102186. [Google Scholar] [CrossRef]
- Semerádová, T.; Weinlich, P. The (In) Effectiveness of In-Stream Video Ads: Comparison of Facebook and YouTube. In Research Anthology on Strategies for Using Social Media as a Service and Tool in Business; IGI Global: Hershey, PA, USA, 2021; pp. 668–687. [Google Scholar]
- Chaturvedi, I.; Thapa, K.; Cavallari, S.; Cambria, E.; Welsch, R.E. Predicting video engagement using heterogeneous DeepWalk. Neurocomputing 2021, 465, 228–237. [Google Scholar] [CrossRef]
- Jeon, Y.A. Skip or Not to Skip: Impact of Empathy and Ad Length on Viewers’ Ad-Skipping Behaviors on the Internet. In International Conference on Human–Computer Interaction; Springer: Berlin/Heidelberg, Germany, 2018; pp. 261–265. [Google Scholar]
- Belanche, D.; Flavián, C.; Pérez-Rueda, A. Understanding interactive online advertising: Congruence and product involvement in highly and lowly arousing, skippable video ads. J. Interact. Mark. 2017, 37, 75–88. [Google Scholar] [CrossRef]
- Belanche, D.; Flavián, C.; Pérez-Rueda, A. User adaptation to interactive advertising formats: The effect of previous exposure, habit and time urgency on ad skipping behaviors. Telemat. Inform. 2017, 34, 961–972. [Google Scholar] [CrossRef]
- Raditya, D.; Gunadi, W.; Setiono, D.; Rawung, J. The Effect of Ad Content and Ad Length on Consumer Response towards Online Video Advertisement. Winners 2020, 21, 119–128. [Google Scholar] [CrossRef]
- Li, H.; Lo, H.Y. Do you recognize its brand? The effectiveness of online in-stream video advertisements. J. Advert. 2015, 44, 208–218. [Google Scholar] [CrossRef]
- Hegner, S.M.; Kusse, D.C.; Pruyn, A.T. Watch it! The influence of forced pre-roll video ads on consumer perceptions. In Advances in Advertising Research; Springer: Berlin/Heidelberg, Germany, 2016; Volume VI, pp. 63–73. [Google Scholar]
- Campbell, C.; Mattison Thompson, F.; Grimm, P.E.; Robson, K. Understanding why consumers do not skip pre-roll video ads. J. Advert. 2017, 46, 411–423. [Google Scholar] [CrossRef]
- Goodrich, K.; Schiller, S.; Galletta, D. Intrusiveness of online video advertising and its effects on marketing outcomes. In Proceedings of the Thirty Second International Conference on Information Systems, Shanghai, China, 4–7 December 2011. [Google Scholar]
- Schreiner, M.; Fischer, T.; Riedl, R. Impact of content characteristics and emotion on behavioral engagement in social media: Literature review and research agenda. Electron. Commer. Res. 2021, 21, 329–345. [Google Scholar] [CrossRef]
- Botha, E.; Reyneke, M. To share or not to share: The role of content and emotion in viral marketing. J. Public Aff. 2013, 13, 160–171. [Google Scholar] [CrossRef]
- Hamelin, N.; El Moujahid, O.; Thaichon, P. Emotion and advertising effectiveness: A novel facial expression analysis approach. J. Retail. Consum. Serv. 2017, 36, 103–111. [Google Scholar] [CrossRef]
- Teixeira, T.; Wedel, M.; Pieters, R. Emotion-induced engagement in internet video advertisements. J. Mark. Res. 2012, 49, 144–159. [Google Scholar] [CrossRef]
- Munaro, A.C.; Hübner Barcelos, R.; Francisco Maffezzolli, E.C.; Santos Rodrigues, J.P.; Cabrera Paraiso, E. To engage or not engage? The features of video content on YouTube affecting digital consumer engagement. J. Consum. Behav. 2021, 20, 1336–1352. [Google Scholar] [CrossRef]
- Carretié, L.; Hinojosa, J.A.; Mercado, F. Cerebral patterns of attentional habituation to emotional visual stimuli. Psychophysiology 2003, 40, 381–388. [Google Scholar] [CrossRef] [PubMed]
- Codispoti, M.; De Cesarei, A.; Biondi, S.; Ferrari, V. The fate of unattended stimuli and emotional habituation: Behavioral interference and cortical changes. Cogn. Affect. Behav. Neurosci. 2016, 16, 1063–1073. [Google Scholar] [CrossRef]
- Dijksterhuis, A.; Smith, P.K. Affective habituation: Subliminal exposure to extreme stimuli decreases their extremity. Emotion 2002, 2, 203. [Google Scholar] [CrossRef]
- Wright, C.I.; Fischer, H.; Whalen, P.J.; McInerney, S.C.; Shin, L.M.; Rauch, S.L. Differential prefrontal cortex and amygdala habituation to repeatedly presented emotional stimuli. Neuroreport 2001, 12, 379–383. [Google Scholar] [CrossRef]
- Pace-Schott, E.F.; Shepherd, E.; Spencer, R.M.; Marcello, M.; Tucker, M.; Propper, R.E.; Stickgold, R. Napping promotes inter-session habituation to emotional stimuli. Neurobiol. Learn. Mem. 2011, 95, 24–36. [Google Scholar] [CrossRef]
- Escalas, J.E.; Stern, B.B. Sympathy and empathy: Emotional responses to advertising dramas. J. Consum. Res. 2003, 29, 566–578. [Google Scholar] [CrossRef]
- Aaker, J.; Drolet, A.; Griffin, D. Recalling mixed emotions. J. Consum. Res. 2008, 35, 268–278. [Google Scholar] [CrossRef]
- Eckler, P.; Bolls, P. Spreading the virus: Emotional tone of viral advertising and its effect on forwarding intentions and attitudes. J. Interact. Advert. 2011, 11, 1–11. [Google Scholar] [CrossRef]
- Quach, S.; Septianto, F.; Thaichon, P.; Chiew, T.M. Mixed emotional appeal enhances positive word-of-mouth: The moderating role of narrative person. J. Retail. Consum. Serv. 2021, 62, 102618. [Google Scholar] [CrossRef]
- Mukherjee, A.; Dubé, L. Mixing emotions: The use of humor in fear advertising. J. Consum. Behav. 2012, 11, 147–161. [Google Scholar] [CrossRef]
- Williams, P.; Aaker, J.L. Can mixed emotions peacefully coexist? J. Consum. Res. 2002, 28, 636–649. [Google Scholar] [CrossRef]
- Nallaperuma, K.; Septianto, F.; Bandyopadhyay, A. Mixed emotional appeal enhances advertising effectiveness of pro-environmental luxury brands: The mediating role of cognitive flexibility. Asia Pac. J. Mark. Logist. 2021, 34, 175–189. [Google Scholar] [CrossRef]
- Myrick, J.G.; Oliver, M.B. Laughing and crying: Mixed emotions, compassion, and the effectiveness of a YouTube PSA about skin cancer. Health Commun. 2015, 30, 820–829. [Google Scholar] [CrossRef] [PubMed]
- Zennifa, F.; Ageno, S.; Hatano, S.; Iramina, K. Hybrid system for engagement recognition during cognitive tasks using a CFS+ KNN algorithm. Sensors 2018, 18, 3691. [Google Scholar] [CrossRef]
- Aghajani, H.; Garbey, M.; Omurtag, A. Measuring mental workload with EEG+ fNIRS. Front. Hum. Neurosci. 2017, 11, 359. [Google Scholar] [CrossRef]
- Prieto-Pinto, L.; Lara-Díaz, M.F.; Garzón-Orjuela, N.; Herrera, D.; Páez-Canro, C.; Reyes, J.H.; González-Gordon, L.; Jiménez-Murcia, V.; Eslava-Schmalbach, J. Effectiveness assessment of maternal and neonatal health video clips in knowledge transfer using neuromarketing tools: A randomized crossover trial. PLoS ONE 2019, 14, e0215561. [Google Scholar] [CrossRef]
- Camarrone, F.; Van Hulle, M.M. Measuring brand association strength with EEG: A single-trial N400 ERP study. PLoS ONE 2019, 14, e0217125. [Google Scholar] [CrossRef]
- Berka, C.; Levendowski, D.J.; Lumicao, M.N.; Yau, A.; Davis, G.; Zivkovic, V.T.; Olmstead, R.E.; Tremoulet, P.D.; Craven, P.L. EEG correlates of task engagement and mental workload in vigilance, learning, and memory tasks. Aviat. Space Environ. Med. 2007, 78, B231–B244. [Google Scholar]
- Nuamah, J.K.; Seong, Y.; Yi, S. Electroencephalography (EEG) classification of cognitive tasks based on task engagement index. In Proceedings of the 2017 IEEE Conference on Cognitive and Computational Aspects of Situation Management (CogSIMA), New York, NY, USA, 27–31 March 2017; pp. 1–6. [Google Scholar]
- Cirett Galán, F.; Beal, C.R. EEG estimates of engagement and cognitive workload predict math problem solving outcomes. In International Conference on User Modeling, Adaptation, and Personalization; Springer: Berlin/Heidelberg, Germany, 2012; pp. 51–62. [Google Scholar]
- Dehais, F.; Dupres, A.; Di Flumeri, G.; Verdiere, K.; Borghini, G.; Babiloni, F.; Roy, R. Monitoring pilot’s cognitive fatigue with engagement features in simulated and actual flight conditions using an hybrid fNIRS-EEG passive BCI. In Proceedings of the 2018 IEEE International Conference on Systems, Man, and Cybernetics (SMC), Miyazaki, Japan, 7–10 October 2018; pp. 544–549. [Google Scholar]
- McMahan, T.; Parberry, I.; Parsons, T.D. Evaluating player task engagement and arousal using electroencephalography. Procedia Manuf. 2015, 3, 2303–2310. [Google Scholar] [CrossRef]
- Rogers, J.M.; Jensen, J.; Valderrama, J.T.; Johnstone, S.J.; Wilson, P.H. Single-channel EEG measurement of engagement in virtual rehabilitation: A validation study. Virtual Real. 2021, 25, 357–366. [Google Scholar] [CrossRef]
- Lubar, J.F. Discourse on the development of EEG diagnostics and biofeedback for attention-deficit/hyperactivity disorders. Biofeedback Self-Regul. 1991, 16, 201–225. [Google Scholar] [CrossRef]
- Freeman, F.G.; Mikulka, P.J.; Prinzel, L.J.; Scerbo, M.W. Evaluation of an adaptive automation system using three EEG indices with a visual tracking task. Biol. Psychol. 1999, 50, 61–76. [Google Scholar] [CrossRef] [PubMed]
- Pope, A.T.; Bogart, E.H.; Bartolome, D.S. Biocybernetic system evaluates indices of operator engagement in automated task. Biol. Psychol. 1995, 40, 187–195. [Google Scholar] [CrossRef] [PubMed]
- Freeman, F.G.; Mikulka, P.J.; Scerbo, M.W.; Prinzel, L.J.; Clouatre, K. Evaluation of a psychophysiologically controlled adaptive automation system, using performance on a tracking task. Appl. Psychophysiol. Biofeedback 2000, 25, 103–115. [Google Scholar] [CrossRef] [PubMed]
- Coelli, S.; Sclocco, R.; Barbieri, R.; Reni, G.; Zucca, C.; Bianchi, A. EEG-based index for engagement level monitoring during sustained attention. In Proceedings of the 37th Annual International Conference of the IEEE Engineering in Medicine and Biology Society (EMBC), Milan, Italy, 25–29 August 2015; pp. 1512–1515. [Google Scholar] [CrossRef]
- Prinzel, L.J.; Freeman, F.G.; Scerbo, M.W.; Mikulka, P.J.; Pope, A.T. A closed-loop system for examining psychophysiological measures for adaptive task allocation. Int. J. Aviat. Psychol. 2000, 10, 393–410. [Google Scholar] [CrossRef]
- Mikulka, P.J.; Scerbo, M.W.; Freeman, F.G. Effects of a biocybernetic system on vigilance performance. Hum. Factors 2002, 44, 654–664. [Google Scholar] [CrossRef]
- Video1—What Are You Looking for in Your Dreams? 2022. Available online: https://www.youtube.com/watch?v=uN-Pv2bwhfI&ab_channel=Allegro (accessed on 28 December 2023).
- Video2—UNICEF Africa, Help Children in Mali. 2022. Available online: https://www.youtube.com/watch?v=Sf492wWLEvQ&ab_channel=UNICEFPOLSKA (accessed on 28 December 2023).
- Video3—Unlocked in MYCALVINS. 2022. Available online: https://www.youtube.com/watch?v=l3kzdeAq8ds&ab_channel=CalvinKlein (accessed on 28 December 2023).
- Video4—H2Owoc. Without Sugar. Without Comparison. 2022. Available online: https://www.youtube.com/watch?v=bbscyWwkW5k&ab_channel=TymbarkTV (accessed on 28 December 2023).
- Video5—DKMS Foundation—Leukaemia. 2022. Available online: https://www.youtube.com/watch?v=QGga3ly9THk&ab_channel=FundacjaDKMS (accessed on 28 December 2023).
- Video6—A Dog Is Not a Toy. 2022. Available online: https://www.youtube.com/watch?v=zMnvGmcig8U&ab_channel=GrupaFilmowaSzybkaAkcja (accessed on 28 December 2023).
- Video7—STOP Femicide. 2022. Available online: https://www.youtube.com/watch?v=ZhBasKpnNTw&ab_channel=CPKCentrumPrawKobiet (accessed on 28 December 2023).
- Video8—Keep Summer in Your Heart. 2022. Available online: https://www.youtube.com/watch?v=mqPVkRrCUsM&ab_channel=LodyKoral (accessed on 28 December 2023).
- Jasper Herbert, H. The ten-twenty electrode system of the International Federation. Electroencephalogr. Clin. Neurophysiol. 1958, 10, 370–375. [Google Scholar]
- Oja, E.; Hyvarinen, A. Independent component analysis: Algorithms and applications. Neural Netw. 2000, 13, 411–430. [Google Scholar] [CrossRef]
- Aaker, J.L.; Williams, P. Empathy versus pride: The influence of emotional appeals across cultures. J. Consum. Res. 1998, 25, 241–261. [Google Scholar] [CrossRef]


| Subject | Age | Gender | Position | Nationality |
|---|---|---|---|---|
| S1 | 22 | Male | Student | Polish |
| S2 | 24 | Male | Student | Ukrainian |
| S3 | 24 | Female | Student | Ukrainian |
| S4 | 24 | Female | Student | Polish |
| S5 | 33 | Male | Academic | Polish |
| S6 | 57 | Male | Academic | Polish |
| S7 | 22 | Female | Student | Ukrainian |
| S8 | 45 | Male | Academic | Polish |
| S9 | 23 | Male | Student | Polish |
| S10 | 42 | Male | Academic | Polish |
| S11 | 23 | Female | Student | Polish |
| S12 | 38 | Female | Academic | Polish |
| S13 | 21 | Male | Student | Ukrainian |
| Id | Description |
|---|---|
| V1 | V1 promotes an internet auction platform. The narrative commences on a rainy day when a man and their young daughter come across a little puppy drenched in water. Subsequently, the video depicts the impact of the dog’s growth on the man’s life, presenting a series of scenes displaying the damage caused by the puppy. The video ends when the father, moved by the close bond between the dog and their daughter, decides to give a home to the dog. The emotional tone of the video changes twice; the opening and ending are sad, while the middle section comprises a blend of surprise and anger. |
| V2 | V2 is a part of a social campaign that sheds light on the deplorable conditions in which African mothers give birth to their children. Although the subject of the video is sad, the message is conveyed mainly through narration, which diminishes its impact. The video is promoted as a part of a charity campaign. |
| V3 | V3 promotes bags from a renowned fashion brand. The black and white video, with subtle red accents, presents a scantily clad woman posing sensually on a chair with a different bag in each scene. While the advertisement is sensual, it lacks excitement. |
| V4 | V4 promotes fruit drinks. The ad shows colorful, flawless fruits and happy people, conveying a clear emotional message—pure joy. |
| V5 | V5 conveys a social message, urging support for a foundation fighting leukemia. The video features a young boy narrating their struggle with the disease for the majority of the video (3/4), while the final part displays information on the disease and support options. Although the video is sad, it is also slightly dull. |
| V6 | V6 is a part of a social campaign. The story takes place on Christmas Eve when a young boy unwraps his gifts. The atmosphere is joyful and loving; the parents chat cheerfully, and everyone is smiling. Among the presents is a cute puppy, which is shot with a gun by the father at the end of the video. |
| V7 | V7 is a part of a social campaign against femicide. It depicts a woman regularly being beaten by her husband and seeking help from various institutions, including the police, church, and family. The emotional tone conveyed by the video is relatively uniform—fear, sadness, and anger—but the intensity of each emotion varies significantly throughout the video. |
| V8 | V8 promotes ice creams. The video comprises several scenes displaying young people happily dancing with ice creams in their hands, creating a positive atmosphere throughout the entire ad. |
| Id | Name | Length (s) | Expected Emotions | Type of Emotional Content |
|---|---|---|---|---|
| V1 | What are you looking for in your dreams? [47] | 84 (−5) | Sadness, surprise, anger | Mixed |
| V2 | UNICEF Africa, help children in Mali [48] | 28 | Sadness | Consistent |
| V3 | Unlocked in MYCALVINS [49] | 31 | Calmness | Consistent |
| V4 | H2Owoc. Without sugar. Without comparison [50] | 15 | Happiness | Consistent |
| V5 | DKMS Foundation; Leukaemia [51] | 78 (−15) | Sadness | Consistent |
| V6 | A dog is not a toy [52] | 60 (−5) | Happiness, calmness, fear, anger | Mixed |
| V7 | STOP femicide [53] | 231 (−25) | Fear, sadness, anger | Mixed |
| V8 | Keep Summer in Your Heart [54] | 34 | Happiness | Consistent |
| Calm | Happy | Surprised | Excited | Sad | Fear | Angry | Disgust | Total | |
|---|---|---|---|---|---|---|---|---|---|
| V1 | 0 | 7 | 7 | 0 | 8 | 0 | 0 | 0 | 22 |
| V2 | 3 | 0 | 0 | 0 | 11 | 0 | 2 | 0 | 16 |
| V3 | 10 | 0 | 2 | 3 | 0 | 0 | 0 | 1 | 16 |
| V4 | 7 | 7 | 0 | 0 | 0 | 0 | 0 | 0 | 14 |
| V5 | 2 | 4 | 2 | 0 | 10 | 0 | 0 | 0 | 18 |
| V6 | 0 | 3 | 10 | 0 | 9 | 3 | 7 | 1 | 33 |
| V7 | 0 | 0 | 3 | 0 | 11 | 7 | 10 | 9 | 40 |
| V8 | 7 | 6 | 0 | 0 | 0 | 0 | 0 | 0 | 13 |
| V1 | V2 | V3 | V4 | V5 | V6 | V7 | V8 | |
|---|---|---|---|---|---|---|---|---|
| V1 | * | * | * | * | * | |||
| V2 | * | |||||||
| V3 | * | * | ||||||
| V4 | ||||||||
| V5 | * | * | * | |||||
| V6 | * | * | * | |||||
| V7 | * | * | * | |||||
| V8 | * |
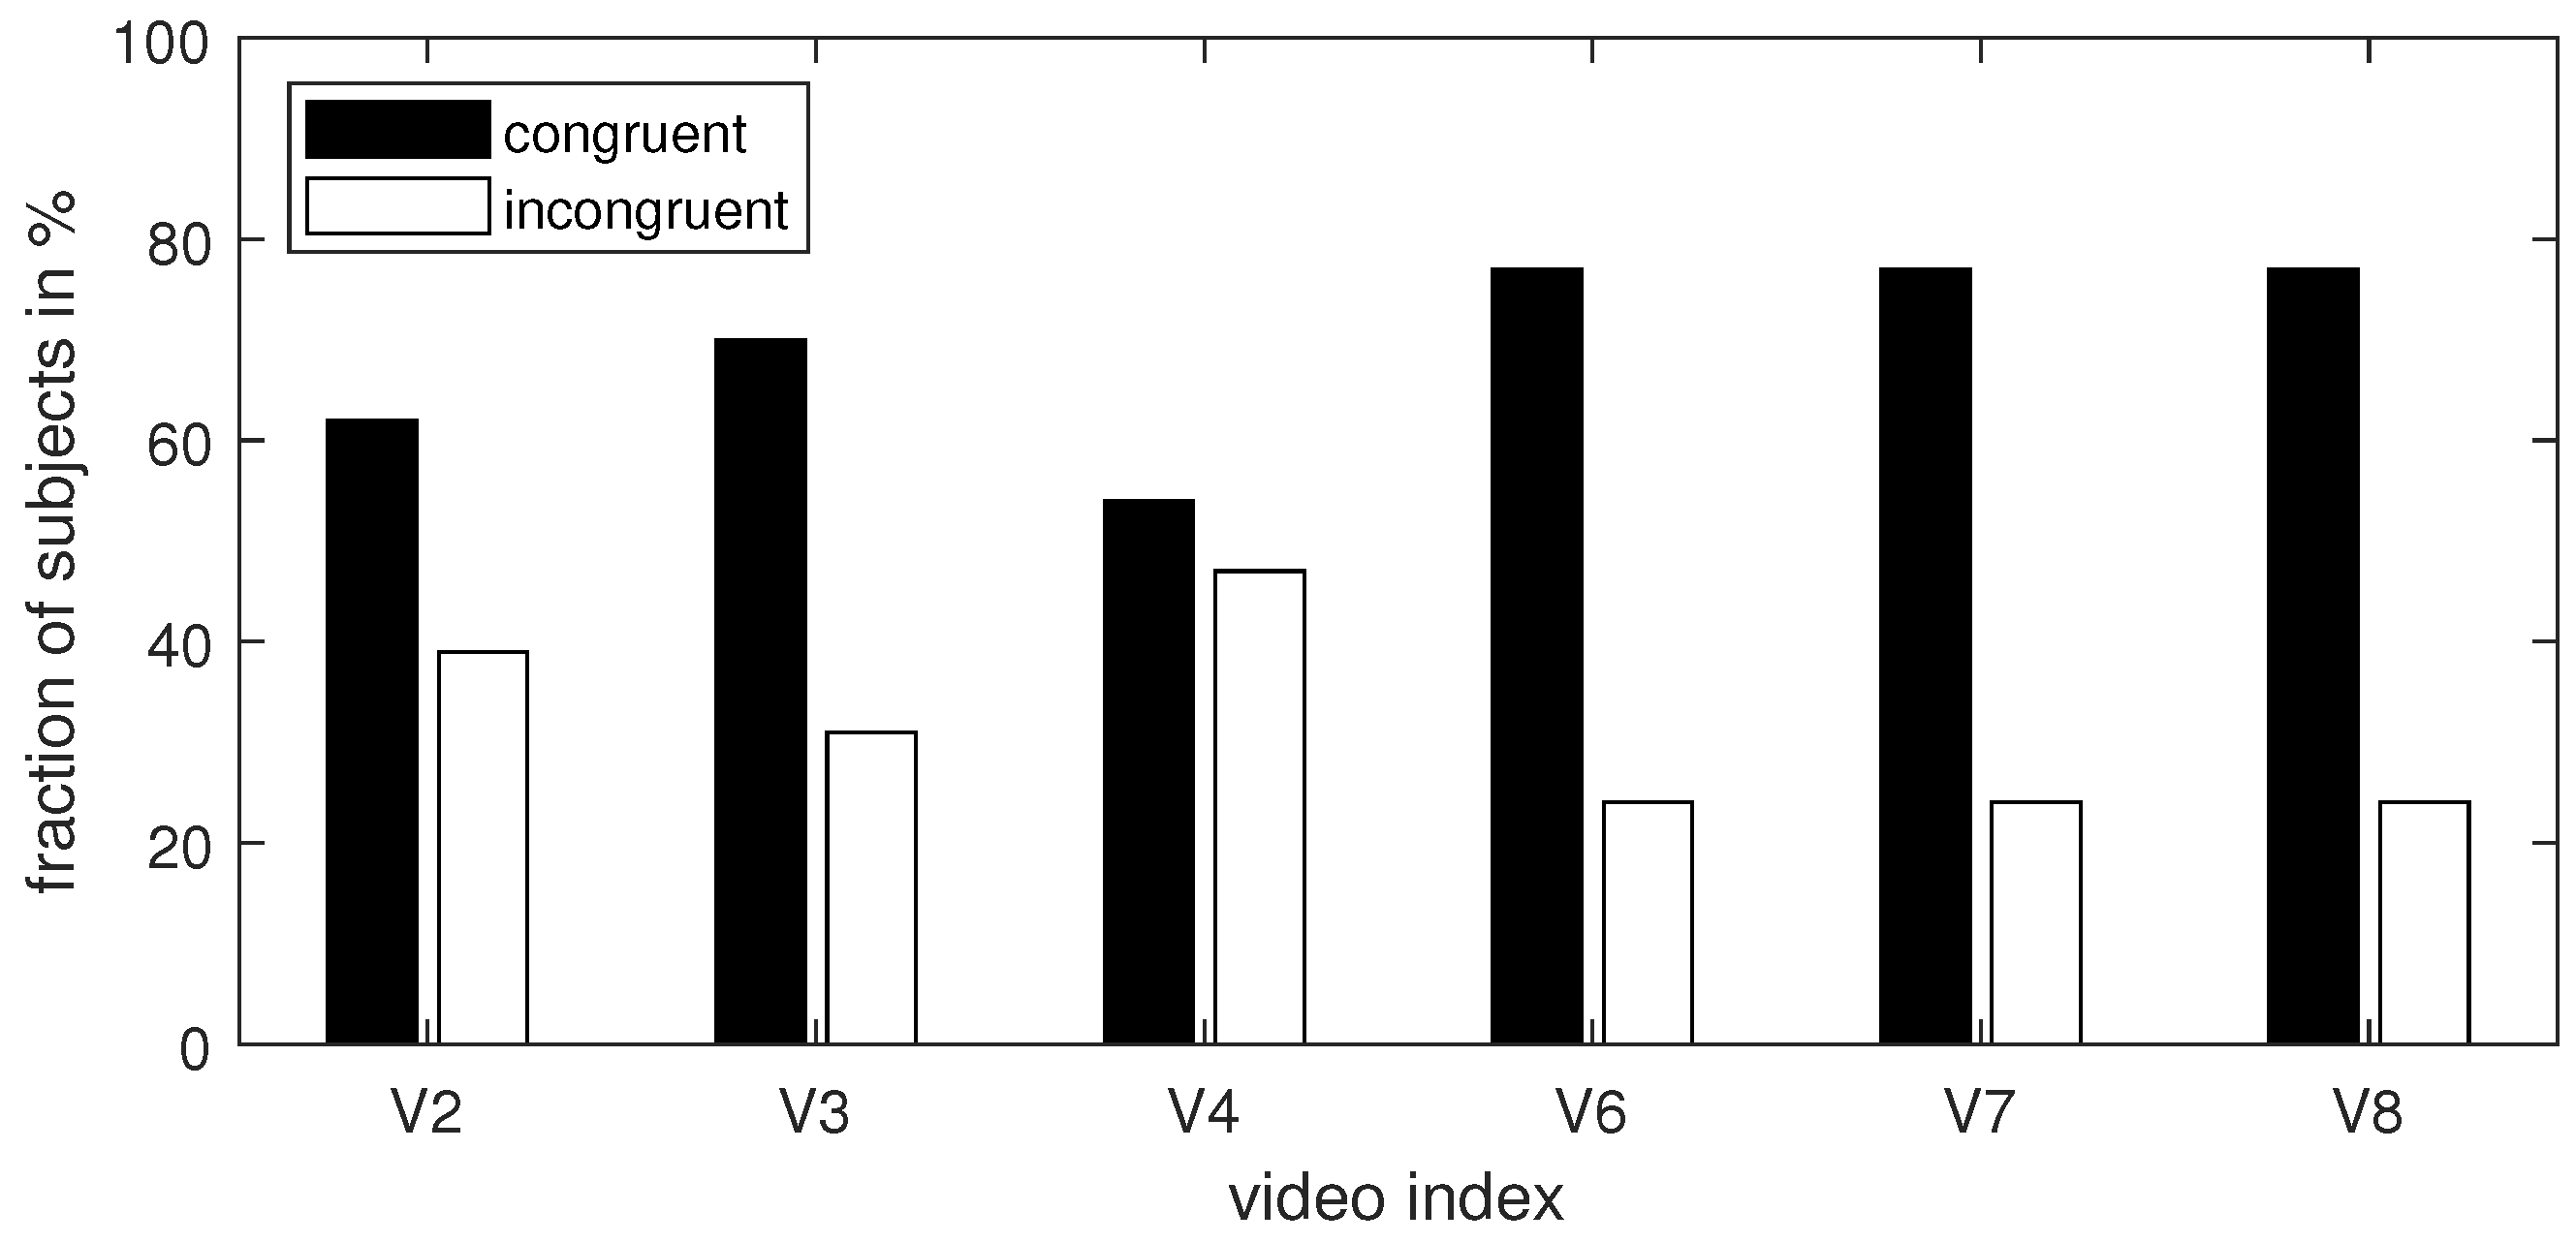
| V2 | V3 | V4 | V6 | V7 | V8 | |
|---|---|---|---|---|---|---|
| pos | neg | neg | pos | pos | neg | |
| No. of subjects with a congruent trend direction | 8 | 9 | 7 | 10 | 10 | 10 |
| No. of subjects with an incongruent trend direction | 5 | 4 | 6 | 3 | 3 | 3 |
Disclaimer/Publisher’s Note: The statements, opinions and data contained in all publications are solely those of the individual author(s) and contributor(s) and not of MDPI and/or the editor(s). MDPI and/or the editor(s) disclaim responsibility for any injury to people or property resulting from any ideas, methods, instructions or products referred to in the content. |
© 2024 by the authors. Licensee MDPI, Basel, Switzerland. This article is an open access article distributed under the terms and conditions of the Creative Commons Attribution (CC BY) license (https://creativecommons.org/licenses/by/4.0/).
Share and Cite
Rejer, I.; Jankowski, J.; Dreger, J.; Lorenz, K. Viewer Engagement in Response to Mixed and Uniform Emotional Content in Marketing Videos—An Electroencephalographic Study. Sensors 2024, 24, 517. https://doi.org/10.3390/s24020517
Rejer I, Jankowski J, Dreger J, Lorenz K. Viewer Engagement in Response to Mixed and Uniform Emotional Content in Marketing Videos—An Electroencephalographic Study. Sensors. 2024; 24(2):517. https://doi.org/10.3390/s24020517
Chicago/Turabian StyleRejer, Izabela, Jarosław Jankowski, Justyna Dreger, and Krzysztof Lorenz. 2024. "Viewer Engagement in Response to Mixed and Uniform Emotional Content in Marketing Videos—An Electroencephalographic Study" Sensors 24, no. 2: 517. https://doi.org/10.3390/s24020517
APA StyleRejer, I., Jankowski, J., Dreger, J., & Lorenz, K. (2024). Viewer Engagement in Response to Mixed and Uniform Emotional Content in Marketing Videos—An Electroencephalographic Study. Sensors, 24(2), 517. https://doi.org/10.3390/s24020517