
Experimental Study on LTE Mobile Network Performance Parameters for Controlled Drone Flights

 ,
,  , , ,
, , ,
Abstract
1. Introduction
2. Overview of Drone Realization for LTE Mobile Network Parameter Measurements
3. Analysis of the Mobile Network Performance Parameters for UAV Application
- Telemetry of the aircraft systems—day-to-day or daily measurements received from aircraft-related subsystems (battery status, speed, heading, location/GPS), which are tiny 30 kbps messages that are sent at around 1 Hz;
- Sensor commands, messages and telemetry, where sensor command and configuration messages may follow the command protocol, requiring acknowledgment messaging and retransmitting commands multiple times before failure. Examples of this data type are ground control stations (GCS) to UAV on-board sensors supporting payload functions such as cameras for query and configuration, messages from UAV with sensor-status reports, the heartbeat of on-board sensors, and identification of individual sensors and capabilities, and commands to the UAV for image capture and confirmation of image capture from the UAV;
- Parameters/configuration messages, which are carried out periodically and as needed and consist of small data messages on GCS requesting parameter reads from UAV, GCS issues of new parameter commands, UAV broadcast parameters;
- Weather-related information, access to the airspace field, and operational volumes are some of the scenarios in non-critical communications regarding UTM messaging.
- Telemetry, commands for certain missions and vehicles, and also messaging-based applications where GCS to UAV commands might consist of information regarding changes in the initial flight plans, changes in navigation settings and movement of the device, some speed related changes or other types of commands related to the fundamental operation; the category of messages concerning autopilot settings can be configured to ensure the delivery conditions (corresponding to the acknowledgments). If such a factor is not present, retransmission of the previous command communication can be executed until a new acknowledgment is approved. Such a procedure can be used to compensate for a lossy connection link.
- Heartbeat—a broadcast message received from the UAV to approve that the aircraft has stated and approved connectivity. Beyond visual-line-of-sight (BVLOS) that is LTE-connected can require a heartbeat confirmation to understand whether the UAV has the necessary connection prior to the BVLOS flight stage.
- UTM messaging, which in critical data type cases might incorporate remote ID, geofencing, and flight authorization.
4. Development of the Setup for Experimental Measurements
- -
- Automatic mode: where the measuring device switches to the most appropriate frequency decided by mobile network algorithms.
- -
- Band 20 (800 MHz): this is the frequency band with the best areal coverage and is very widely used.
5. Evaluation and Analysis of Measured Results
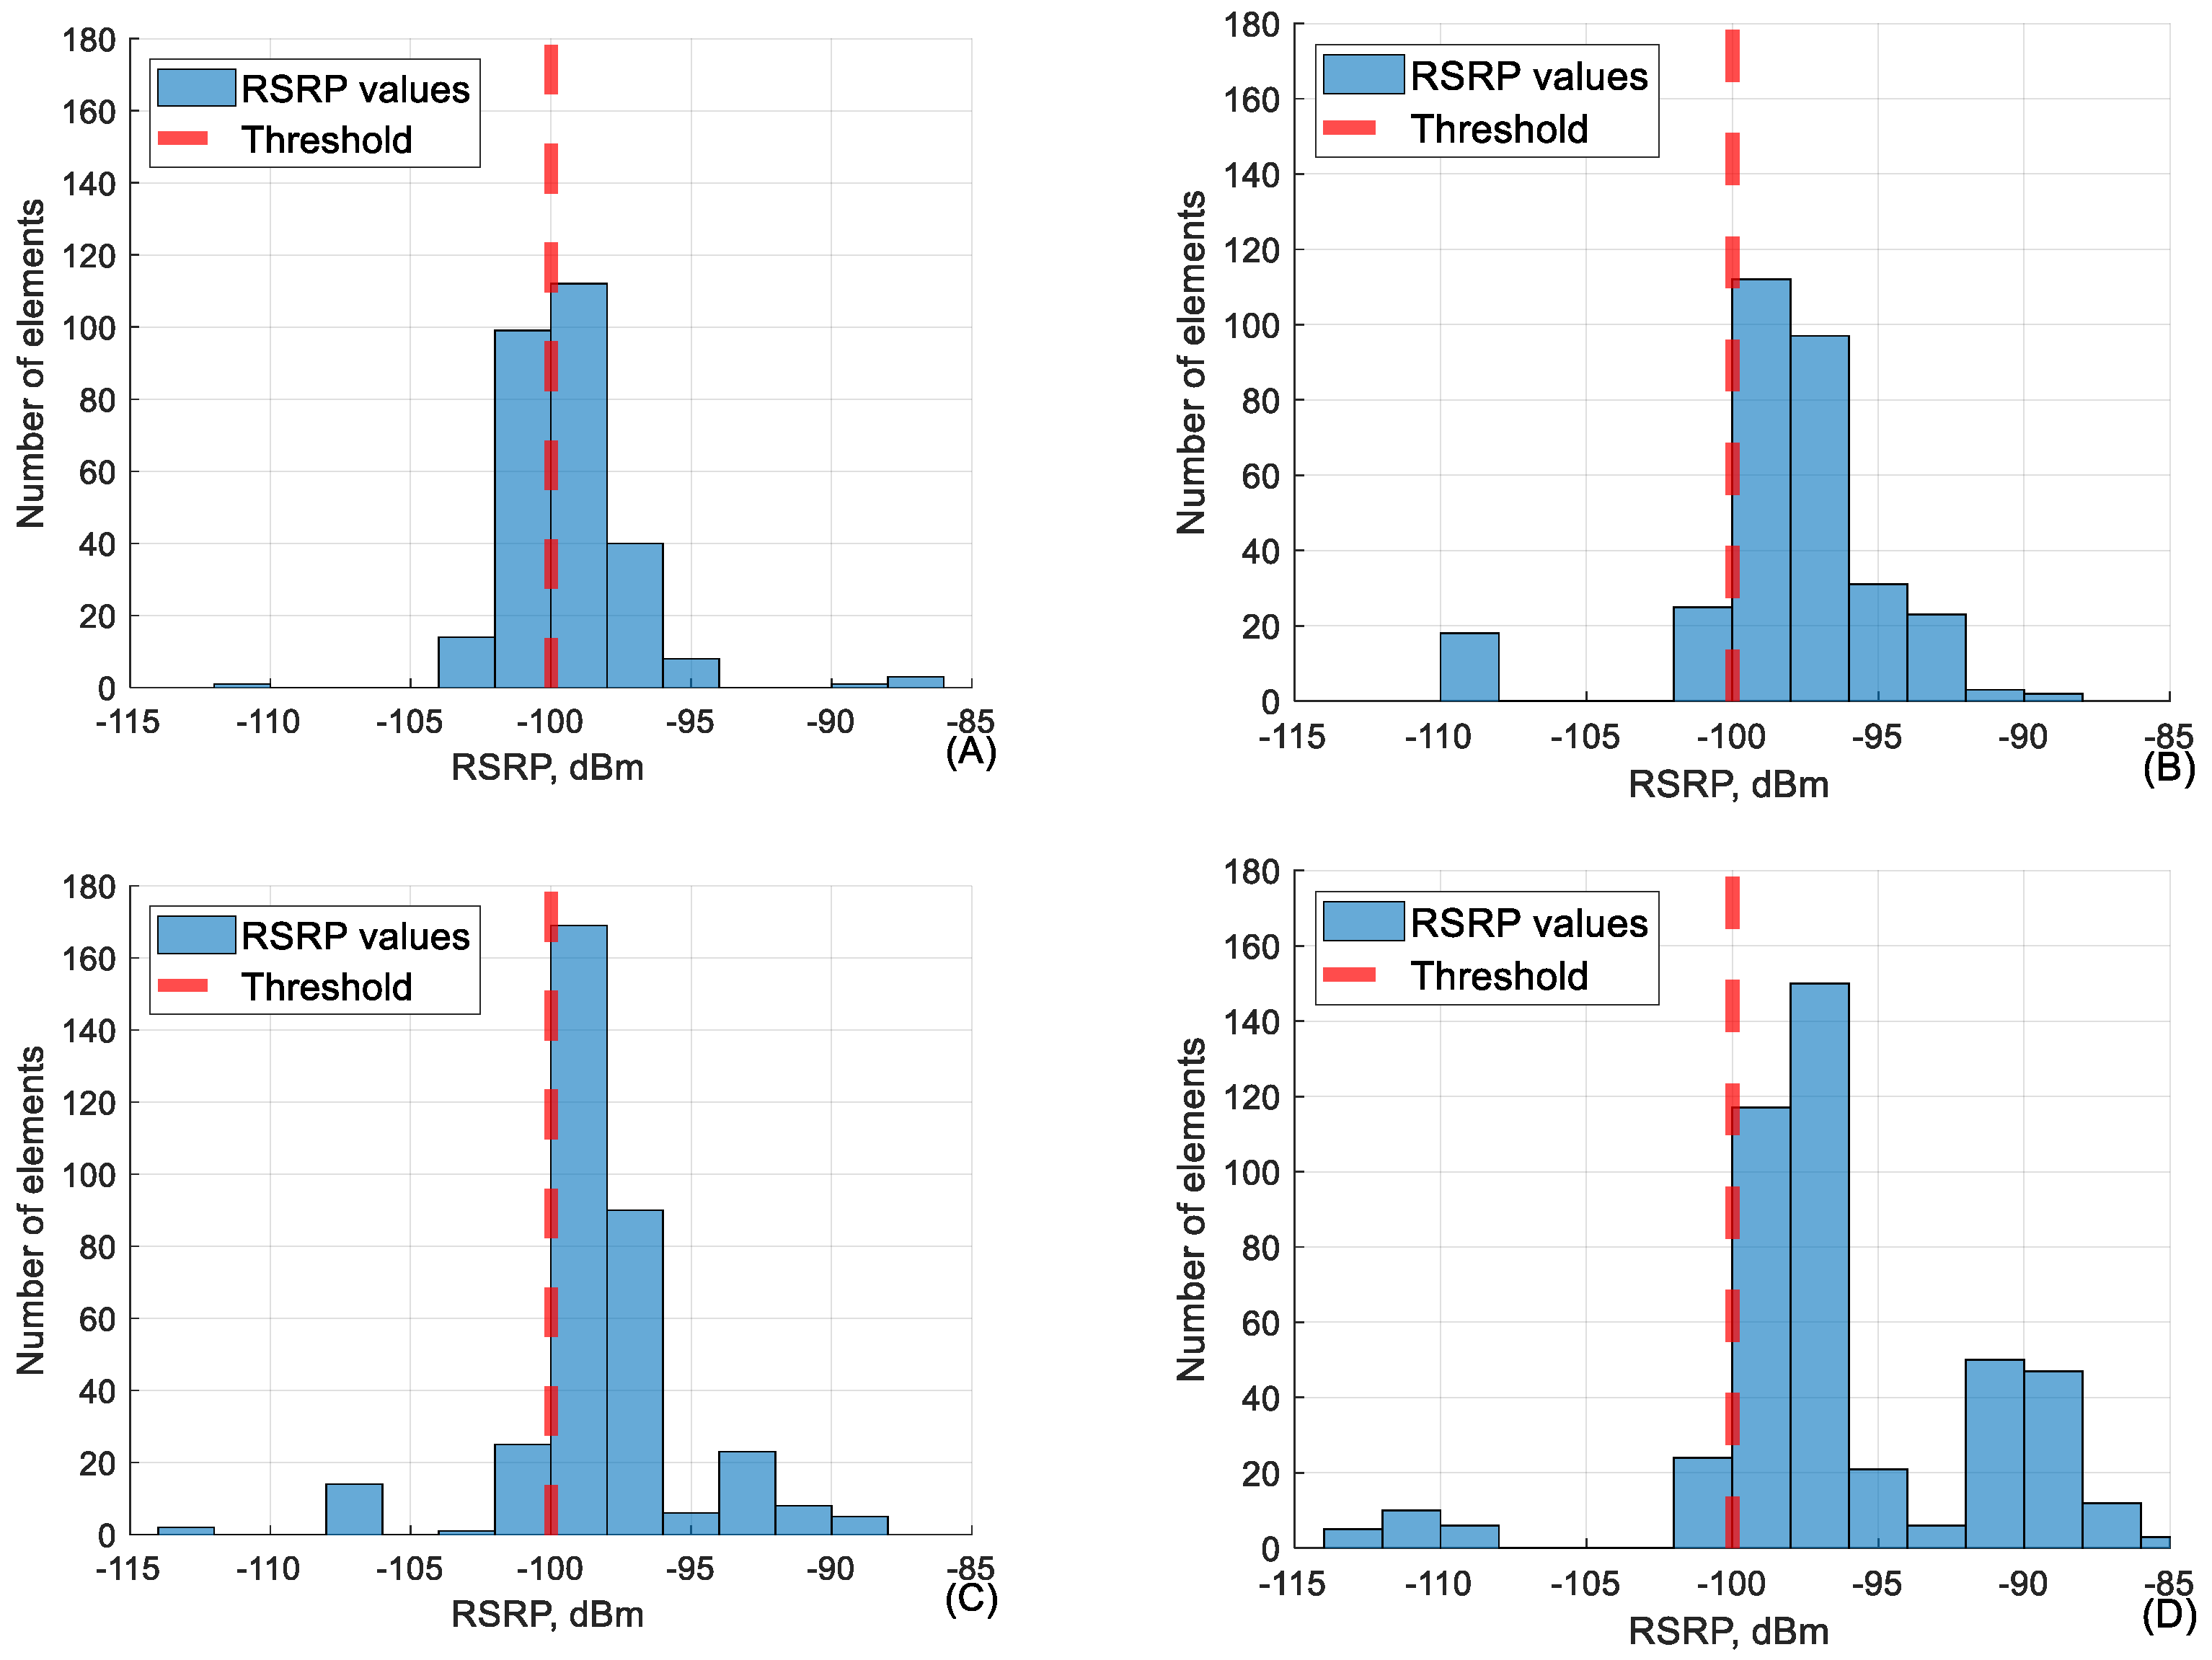
5.1. RSRP
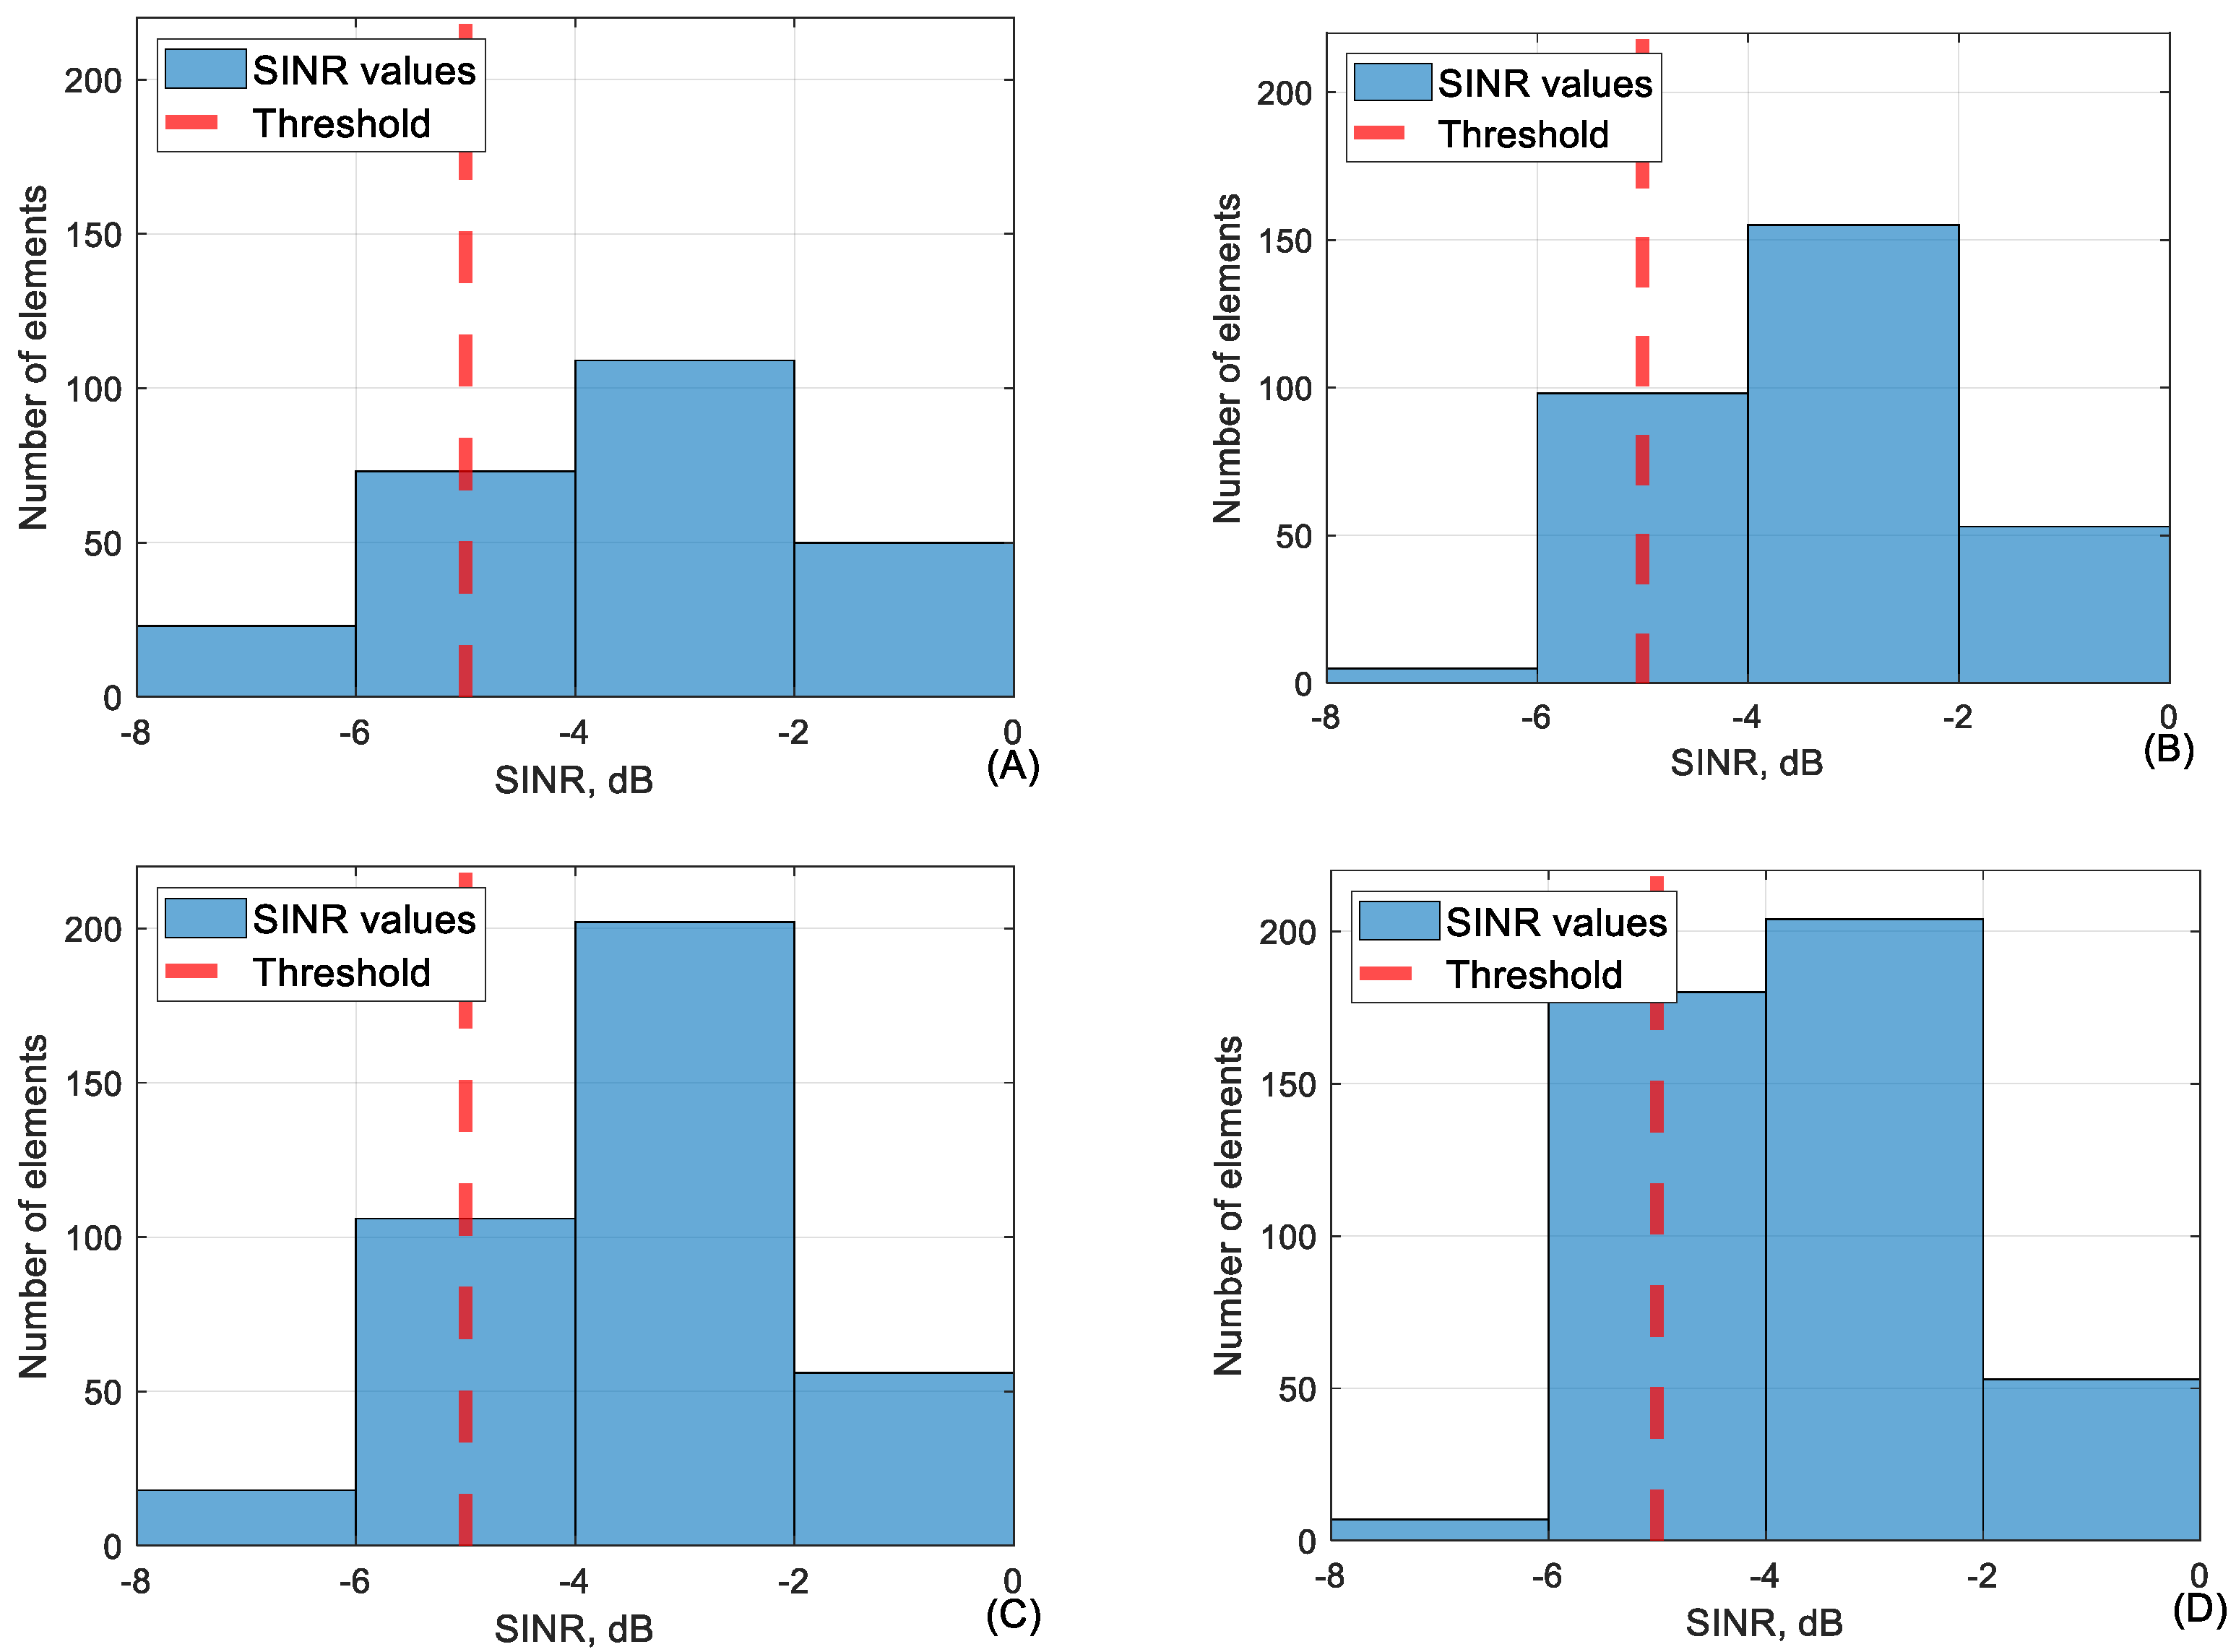
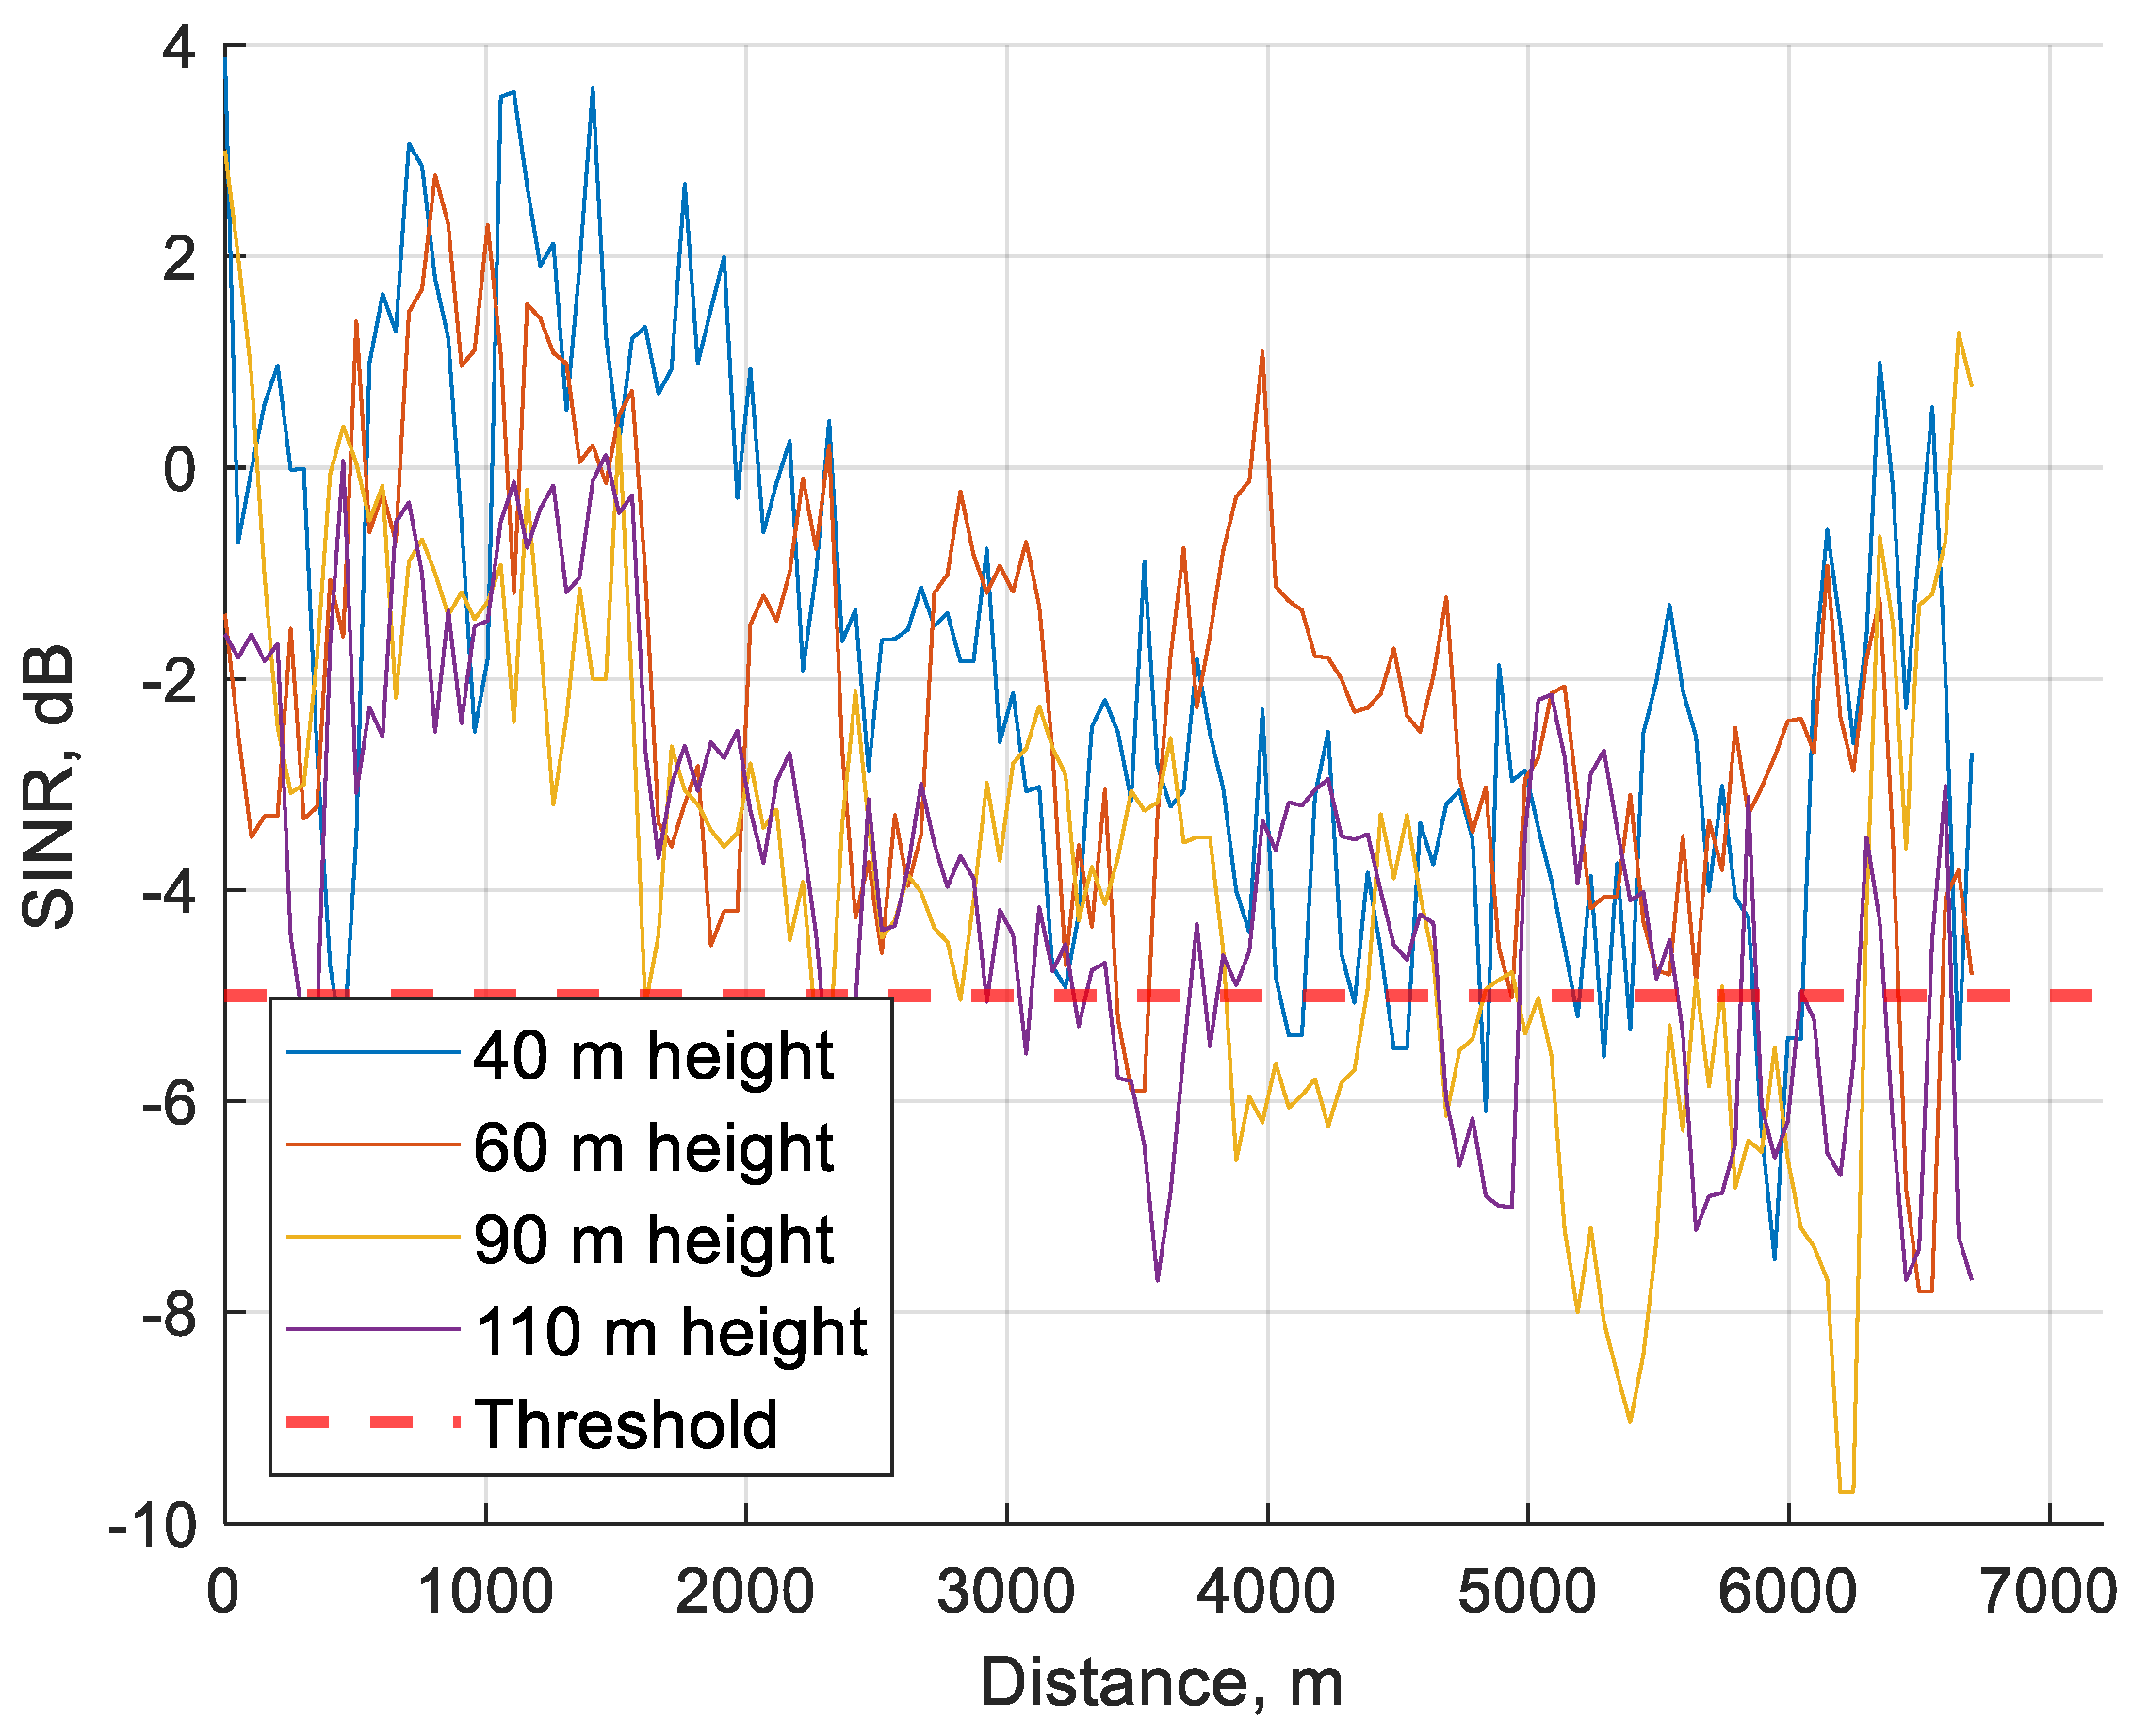
5.2. SINR
5.3. Recommendation
6. Conclusions
Author Contributions
Funding
Institutional Review Board Statement
Informed Consent Statement
Data Availability Statement
Conflicts of Interest
References
- Sachs, G. Drones Reporting for Work. Available online: https://www.goldmansachs.com/insights/technology-driving-innovation/drones/ (accessed on 2 April 2024).
- Park, H.C.; Rachmawati, T.S.N.; Kim, S. UAV-Based High-Rise Buildings Earthwork Monitoring—A Case Study. Sustainability 2022, 14, 10179. [Google Scholar] [CrossRef]
- Magsino, E.R.; Chua, J.R.B.; Chua, L.S.; De Guzman, C.M.; Gepaya, J.V.L. A rapid screening algorithm using a quadrotor for crack detection on bridges. In Proceedings of the 2016 IEEE Region 10 Conference (TENCON), Singapore, 22–25 November 2016; pp. 1829–1833. [Google Scholar] [CrossRef]
- Abdallah, A.; Ali, M.Z.; Mišić, J.; Mišić, V.B. Efficient security scheme for disaster surveillance UAV communication networks. Information 2019, 10, 43. [Google Scholar] [CrossRef]
- Li, L.; Zhang, R.; Li, Q.; Zhang, K.; Liu, Z.; Ren, Z. Multidimensional Spatial Monitoring of Open Pit Mine Dust Dispersion by Unmanned Aerial Vehicle. Sci. Rep. 2023, 13, 6815. [Google Scholar] [CrossRef] [PubMed]
- Guo, M.; Sun, M.; Pan, D.; Wang, G.; Zhou, Y.; Yan, B.; Fu, Z. High-Precision Deformation Analysis of Yingxian Wooden Pagoda Based on UAV Image and Terrestrial LiDAR Point Cloud. Herit. Sci. 2023, 11, 1. [Google Scholar] [CrossRef]
- Saleem, M.R.; Mayne, R.; Napolitano, R. Analysis of Gaze Patterns during Facade Inspection to Understand Inspector Sense-Making Processes. Sci. Rep. 2023, 13, 2929. [Google Scholar] [CrossRef] [PubMed]
- Vrabel, J.; Stopka, O.; Palo, J.; Stopkova, M.; Droździel, P.; Michalsky, M. Research Regarding Different Types of Headlights on Selected Passenger Vehicles When Using Sensor-Related Equipment. Sensors 2023, 23, 1978. [Google Scholar] [CrossRef] [PubMed]
- Tombari Sibe, R.; Bekom, D. Digital Forensic Investigation of an Unmanned Aerial Vehicle (UAV): A Technical Case Study of a DJI Phantom III Professional Drone. J. Cybersecur. Inf. Manag. 2025, 15, 197–210. [Google Scholar] [CrossRef]
- Ameslek, O.; Zahir, H.; Latifi, H.; Bachaoui, E.M. Combining OBIA, CNN, and UAV imagery for automated detection and mapping of individual olive trees. Smart Agric. Technol. 2024, 9, 100546. [Google Scholar] [CrossRef]
- Barrile, V.; Simonetti, S.; Citroni, R.; Fotia, A.; Bilotta, G. Experimenting Agriculture 4.0 with Sensors: A Data Fusion Approach between Remote Sensing, UAVs and Self-Driving Tractors. Sensors 2022, 22, 7910. [Google Scholar] [CrossRef]
- Ivancic, W.D.; Kerczewski, R.J.; Murawski, R.W.; Matheou, K.; Downey, A.N. Flying Drones Beyond Visual Line of Sight Using 4g LTE: Issues and Concerns. In Proceedings of the 2019 Integrated Communications, Navigation and Surveillance Conference (ICNS), Herndon, VA, USA, 9–11 April 2019; IEEE: Piscataway, NJ, USA, 2019; pp. 1–13. [Google Scholar] [CrossRef]
- Almakayeel, N. Flying foxes optimization with reinforcement learning for vehicle detection in UAV imagery. Sci. Rep. 2024, 14, 20616. [Google Scholar] [CrossRef]
- Huang, H.; Savkin, A.V. Optimal Deployment of Charging Stations for Aerial Surveillance by UAVs with the Assistance of Public Transportation Vehicles. Sensors 2021, 21, 5320. [Google Scholar] [CrossRef] [PubMed]
- Ezaki, T.; Fujitsuka, K.; Imura, N.; Nishinari, K. Drone-based vertical delivery system for high-rise buildings: Multiple drones vs. a single elevator. Commun. Transp. Res. 2024, 4, 100130. [Google Scholar] [CrossRef]
- Zhai, D.; Wang, C.; Cao, H.; Garg, S.; Hassan, M.M.; AlQahtani, S.A. Deep Neural Network Based UAV Deployment and Dynamic Power Control for 6G-Envisioned Intelligent Warehouse Logistics System. Future Gener. Comput. Syst. 2022, 137, 164–172. [Google Scholar] [CrossRef]
- Huang, H.; Savkin, A.V.; Huang, C. Reliable Path Planning for Drone Delivery Using a Stochastic Time-Dependent Public Transportation Network. IEEE Trans. Intell. Transp. Syst. 2020, 22, 4941–4950. [Google Scholar] [CrossRef]
- Liu, H.; Yu, Y.; Liu, S.; Wang, W. A Military Object Detection Model of UAV Reconnaissance Image and Feature Visualization. Appl. Sci. 2022, 12, 12236. [Google Scholar] [CrossRef]
- Mochurad, L.; Alsayaydeh JA, J.; Yusof, M.F. An autopilot-based method for unmanned aerial vehicles trajectories control and adjustment. Int. J. Electr. Comput. Eng. 2024, 14, 4154–4166. [Google Scholar] [CrossRef]
- Arif, M.; Hasna, M.O. Analysis of Fluctuations of Antenna Pattern in U-V2X Communications. Phys. Commun. 2023, 58, 102066. [Google Scholar] [CrossRef]
- Du, P.; He, X.; Cao, H.; Garg, S.; Kaddoum, G.; Hassan, M.M. AI-Based Energy-Efficient Path Planning of Multiple Logistics UAVs in Intelligent Transportation Systems. Comput. Commun. 2023, 207, 46–55. [Google Scholar] [CrossRef]
- Salama, M.R.; Srinivas, S. Collaborative truck multi-drone routing and scheduling problem: Package delivery with flexible launch and recovery sites. Transp. Res. Part E Logist. Transp. Rev. 2022, 164, 102788. [Google Scholar] [CrossRef]
- Sung, I.; Nielsen, P. Zoning a Service Area of Unmanned Aerial Vehicles for Package Delivery Services. J. Intell. Robot. Syst. Theory Appl. 2020, 97, 719–731. [Google Scholar] [CrossRef]
- Ahn, T.; Seok, J.; Lee, I.; Han, J. Reliable Flying IoT Networks for UAV Disaster Rescue Operations. Mob. Inf. Syst. 2018, 2018, 2572460. [Google Scholar] [CrossRef]
- Wang, A.; Ji, X.; Wu, D.; Bai, X.; Ding, N.; Pang, J.; Chen, S.; Chen, X.; Fang, D. GuideLoc: UAV-Assisted Multitarget Localization System for Disaster Rescue. Mob. Inf. Syst. 2017, 2017, 1267608. [Google Scholar] [CrossRef]
- Mayor, V.; Estepa, R.; Estepa, A.; Madinabeitia, G. Deploying a Reliable UAV-Aided Communication Service in Disaster Areas. Wirel. Commun. Mob. Comput. 2019, 2019, 7521513. [Google Scholar] [CrossRef]
- Erdelj, M.; Natalizio, E.; Chowdhury, K.R.; Akyildiz, I.F. Help from the Sky: Leveraging UAVs for Disaster Management. IEEE Pervasive Comput. 2017, 16, 24–32. [Google Scholar] [CrossRef]
- Sae, J.; Wiren, R.; Kauppi, J.; Maattanen, H.-L.; Torsner, J.; Valkama, M. Public LTE Network Measurements with Drones in Rural Environment. In Proceedings of the 2019 IEEE 89th Vehicular Technology Conference (VTC2019-Spring), Kuala Lumpur, Malaysia, 28 April–1 May 2019; IEEE: Piscataway, NJ, USA, 2019; pp. 1–5. [Google Scholar] [CrossRef]
- Alam, S.S.; Chakma, A.; Rahman, M.H.; Bin Mofidul, R.; Alam, M.M.; Utama, I.B.K.Y.; Jang, Y.M. RF-Enabled Deep-Learning-Assisted Drone Detection and Identification: An End-to-End Approach. Sensors 2023, 23, 4202. [Google Scholar] [CrossRef] [PubMed]
- Militaru, L.G.; Popescu, D.; Ichim, L. 4G/LTE Issues of Low Altitude UAV Flying Systems. In Proceedings of the 2020 24th International Conference on System Theory, Control and Computing (ICSTCC), Sinaia, Romania, 8–10 October 2020; IEEE: Piscataway, NJ, USA, 2020; pp. 874–879. [Google Scholar] [CrossRef]
- Kovacs, I.; Amorim, R.; Nguyen, H.C.; Wigard, J.; Mogensen, P. Interference Analysis for UAV Connectivity over LTE Using Aerial Radio Measurements. In Proceedings of the 2017 IEEE 86th Vehicular Technology Conference (VTC-Fall), Toronto, ON, Canada, 24–27 September 2017; IEEE: Piscataway, NJ, USA, 2017; pp. 1–6. [Google Scholar] [CrossRef]
- Bor-Yaliniz, I.; Salem, M.; Senerath, G.; Yanikomeroglu, H. Is 5G Ready for Drones: A Look into Contemporary and Prospective Wireless Networks from a Standardization Perspective. IEEE Wirel. Commun. 2019, 26, 18–27. [Google Scholar] [CrossRef]
- Izydorczyk, T.; Bucur, M.; Tavares, F.M.L.; Berardinelli, G.; Mogensen, P. Experimental Evaluation of Multi-Antenna Receivers for UAV Communication in Live LTE Networks. In Proceedings of the 2018 IEEE Globecom Workshops (GC Wkshps), Abu Dhabi, United Arab Emirates, 9–13 December 2018; IEEE: Piscataway, NJ, USA, 2018; pp. 1–6. [Google Scholar] [CrossRef]
- Wigard, J.; Amorim, R.; Nguyen, H.C.; Kovacs, I.Z.; Mogensen, P. Method for Detection of Airborne UEs Based on LTE Radio Measurements. In Proceedings of the 2017 IEEE 28th Annual International Symposium on Personal, Indoor, and Mobile Radio Communications (PIMRC), Montreal, QC, Canada, 8–13 October 2017; IEEE: Piscataway, NJ, USA, 2017; pp. 1–6. [Google Scholar] [CrossRef]
- Chen, L.; Huang, Z.; Liu, Z.; Liu, D.; Huang, X. 4G Network for Air-Ground Data Transmission: A Drone Based Experiment. In Proceedings of the 2018 IEEE International Conference on Industrial Internet (ICII), Seattle, WA, USA, 21–23 October 2018; IEEE: Piscataway, NJ, USA, 2018; pp. 167–168. [Google Scholar] [CrossRef]
- Burke, P.J. 4G Coverage Mapping with an Ultra-Micro Drone. In Proceedings of the 2019 IEEE Radio and Antenna Days of the Indian Ocean (RADIO), Reunion, France, 23–26 September 2019; IEEE: Piscataway, NJ, USA, 2019; pp. 1–2. [Google Scholar] [CrossRef]
- Gharib, M.; Nandadapu, S.; Afghah, F. An Exhaustive Study of Using Commercial LTE Network for UAV Communication in Rural Areas. In Proceedings of the 2021 IEEE International Conference on Communications Workshops (ICC Workshops), Montreal, QC, Canada, 14–23 June 2021; IEEE: Piscataway, NJ, USA, 2021; pp. 1–6. [Google Scholar] [CrossRef]
- Singh, R.; Jepsen, J.H.; Ballal, K.D.; Nwabuona, S.; Berger, M.; Dittmann, L. An Investigation of 5G, LTE, LTE-M and NB-IoT Coverage for Drone Communication above 450 Feet. In Proceedings of the 2023 IEEE 24th International Symposium on a World of Wireless, Mobile and Multimedia Networks (WoWMoM), Boston, MA, USA, 12–15 June 2023; IEEE: Piscataway, NJ, USA, 2023; pp. 370–375. [Google Scholar] [CrossRef]
- Luo, J.; Zhao, P.; Zheng, F.-C.; Li, L. Delay Evaluation for Cellular-Connected Drones: Experiments and Analysis. In Proceedings of the 2022 IEEE 96th Vehicular Technology Conference (VTC2022-Fall), London, UK, 26–29 September 2022; IEEE: Piscataway, NJ, USA, 2022; pp. 1–5. [Google Scholar] [CrossRef]
- Maeng, S.J.; Kwon, H.; Ozdemir, O.; Güvenç, İ. Impact of 3-D Antenna Radiation Pattern in UAV Air-to-Ground Path Loss Modeling and RSRP-Based Localization in Rural Area. IEEE Open J. Antennas Propag. 2023, 4, 1029–1043. [Google Scholar] [CrossRef]
- Jepsen, J.H.; Mader, A.R.; Andreasen, T.D.; Singh, R.; Jensen, K. Investigating the Applicability of LTE-M for Network Identification of Unmanned Aerial Systems in U-Space. In Proceedings of the 2023 International Conference on Unmanned Aircraft Systems (ICUAS), Warsaw, Poland, 6–9 June 2023; IEEE: Piscataway, NJ, USA, 2023; pp. 616–625. [Google Scholar] [CrossRef]
- Behjati, M.; Zulkifley, M.A.; Alobaidy, H.A.H.; Nordin, R.; Abdullah, N.F. Reliable Aerial Mobile Communications with RSRP & RSRQ Prediction Models for the Internet of Drones: A Machine Learning Approach. Sensors 2022, 22, 5522. [Google Scholar] [CrossRef] [PubMed]
- 3rd Generation Partnership Project. Technical Specification Group Radio Access Network; Study on Enhanced LTE Support for Aerial Vehicles (3GPP TR 36.777); 3GPP: Valbonne, France, 2017; p. 89. [Google Scholar]
- Lin, X.; Wiren, R.; Euler, S.; Sadam, A.; Maattanen, H.-L.; Muruganathan, S.D.; Gao, S.; Wang, Y.-P.E.; Kauppi, J.; Zou, Z.; et al. Mobile-Network Connected Drones: Field Trials, Simulations, and Design Insights. IEEE Veh. Technol. Mag. 2018, 14, 115–125. [Google Scholar] [CrossRef]
- ACJA; GSMA; GUTMA. LTE Aerial Profile v1.00 (ACJA, GSMA and GUTMA Approved Version). Available online: https://www.gsma.com/solutions-and-impact/technologies/internet-of-things/wp-content/uploads/2020/11/ACJA-WT3-LTE-Aerial-Profile_v1.00-2.pdf (accessed on 11 October 2024).
- CAAC. Low-Altitude Connected Drone Flight Safety Test Report; CAAC: Beijing, China, 2018; p. 24.
- Wigard, J.; Amorim, R.; Kovács, I.Z. Controlling Drones over Cellular Networks: LTE and 5G Are Enabling Secure and Reliable Drone Control in Parallel to High Throughput Applications [White Paper]; NOKIA: Espoo, Finland, 2021; p. 9. [Google Scholar]
- Enhancell, Echo-One. Available online: https://enhancell.com/enhancell/products/echo-one/ (accessed on 2 April 2024).
- Souanef, T.; Al-Rubaye, S.; Tsourdos, A.; Ayo, S.; Panagiotakopoulos, D. Digital Twin Development for the Airspace of the Future. Drones 2023, 7, 484. [Google Scholar] [CrossRef]
- AirborneRF. Available online: https://airbornerf.com/ (accessed on 2 April 2024).
- Grieves, M. Origins of the Digital Twin: Mitigating Unpredictable, Undesirable Emergent Behavior in Complex Systems; Springer: Cham, Switzerland, 2017; p. 6. [Google Scholar] [CrossRef]
- ITU-T Recommendation Y.3090; Digital Twin Network—Requirements and Architecture. International Telecommunication Union: Geneva, Switzerland, 2022.


| Ref. | Year | Drone/Measurement Device | Geographical Location | Environment | Application Scenario | Altitude (Meters) | Measurement |
|---|---|---|---|---|---|---|---|
| [33] | 2018 | Crane with multi-antenna receiver setup. | Aalborg, Denmark | City, suburbs, rural area | Multi-antenna receiver techniques for UAV communications. | 0, 5, 10, 15, 20, 25, 30, 35, 40 | RSP, RSRP, RSRQ, SINR |
| [31] | 2017 | Rohde & Schwarz mobile network scanner mounted underneath a commercial hexacopter drone. | Denmark | Rural area | Analysis of the radio interference for UAV connectivity over LTE. | 15, 30, 60, 120 | RSRP; DL SIR0 and DIR; DL time traces; ECCR; UL RSP; DL and UL IRC 3 dB SIR gain |
| [34] | 2017 | Portable radio network scanner (R&S TSMA0), attached underneath a commercial UAV. | Denmark | Rural area | Detection of airborne UEs based on LTE radio measurements. | 1.5, 15, 30, 60, 120 | RSSI, ΔRSRP, RSRP, RSRQ |
| [35] | 2018 | Quad-rotor drone with an open-source autopilot platform ArduPilo and 4G-only mobile phone for measuring latitudes, longitudes, heights, and the RSRP of 4G network. | Suzhou, China | Urban environment | 4G network for air–ground data transmission: a drone-based experiment. | 0–500 | RSRP, packet loss rate, |
| [28] | 2019 | Drones, smart phones and Keysight Nemo Outdoor, Rohde & Schwarz QualiPoc. | Jorvas, Finland | Rural environment | Public LTE network measurements with drones in rural environments. | 50, 100 | UL PRBs, UL MCS class, UL data rate, UL TX power. |
| [36] | 2019 | Ultra-micro drone with Novatel 4G modem (model # USB Universal Serial Bus 720L) interfaces with the companion computer. | Irvine, USA | No information provided | Drone mapping of 4G cellular network coverage is presented using an ultra-micro drone. | 30, 60, 90, 120 | RSSI |
| [37] | 2021 | Commercial drone (DJI Matrice 200) and TEMS pocket application version 22.1.2 installed on the smartphone. | Flagstaff, Arizona, USA | Urban area with the highest building height of 15 m | Commercial LTE network for UAV communication in rural areas. | 40, 80, 120 | RSRP, RSRQ, RSSI, SINR, DL throughput, and UL throughput |
| [38] | 2023 | To investigate the signal strength of 5G, LTE, LTE-M, and NB-IoT a radio frequency (RF) measurement device TSMA6B and Skyhawk. | Odense, Denmark | No information provided | Investigation of 5G, LTE, LTE-M, and NB-IoT coverage for drone communication above 450 Feet. | 137.16 m (450 feet) | RSRP, SINR |
| [39] | 2022 | Developed a cellular-connected UAV system, in which a drone is controlled by a smartphone via cellular networks. | China | Suburban environment and urban environment | Delay measurements of drones connecting to commercial LTE and 5G networks in real-world scenarios. | 10, 30, 50, 80 | SINR, delay |
| [40] | 2023 | SrsRAN open-source SDR software. A downward RX antenna is installed at the bottom of the UAV. | Raleigh NC, USA | Rural area | Impact of 3D antenna radiation pattern in UAV air-to-ground path loss modeling and RSRP-based localization in rural area. | 30, 50, 70, 90, 110 | RSRP |
| [41] | 2023 | Custom-made UAS with a DroneID5G integrated into it | Odense, Denmark | No information provided | Investigating the applicability of LTE-M for network identification of unmanned aerial systems in U-space. | 20, 40, 60, 80, 100 | RSSI, RSRP, RSRQ |
| [42] | 2022 | Developed multirotor drone with a smartphone and drive-test application | Selangor, Malaysia | Suburban environment | reliable aerial mobile communications with RSRP and RSRQ prediction models for the internet of drones: a machine learning approach. | 65, 85, 105, 125 | RSRP, RSRQ, |
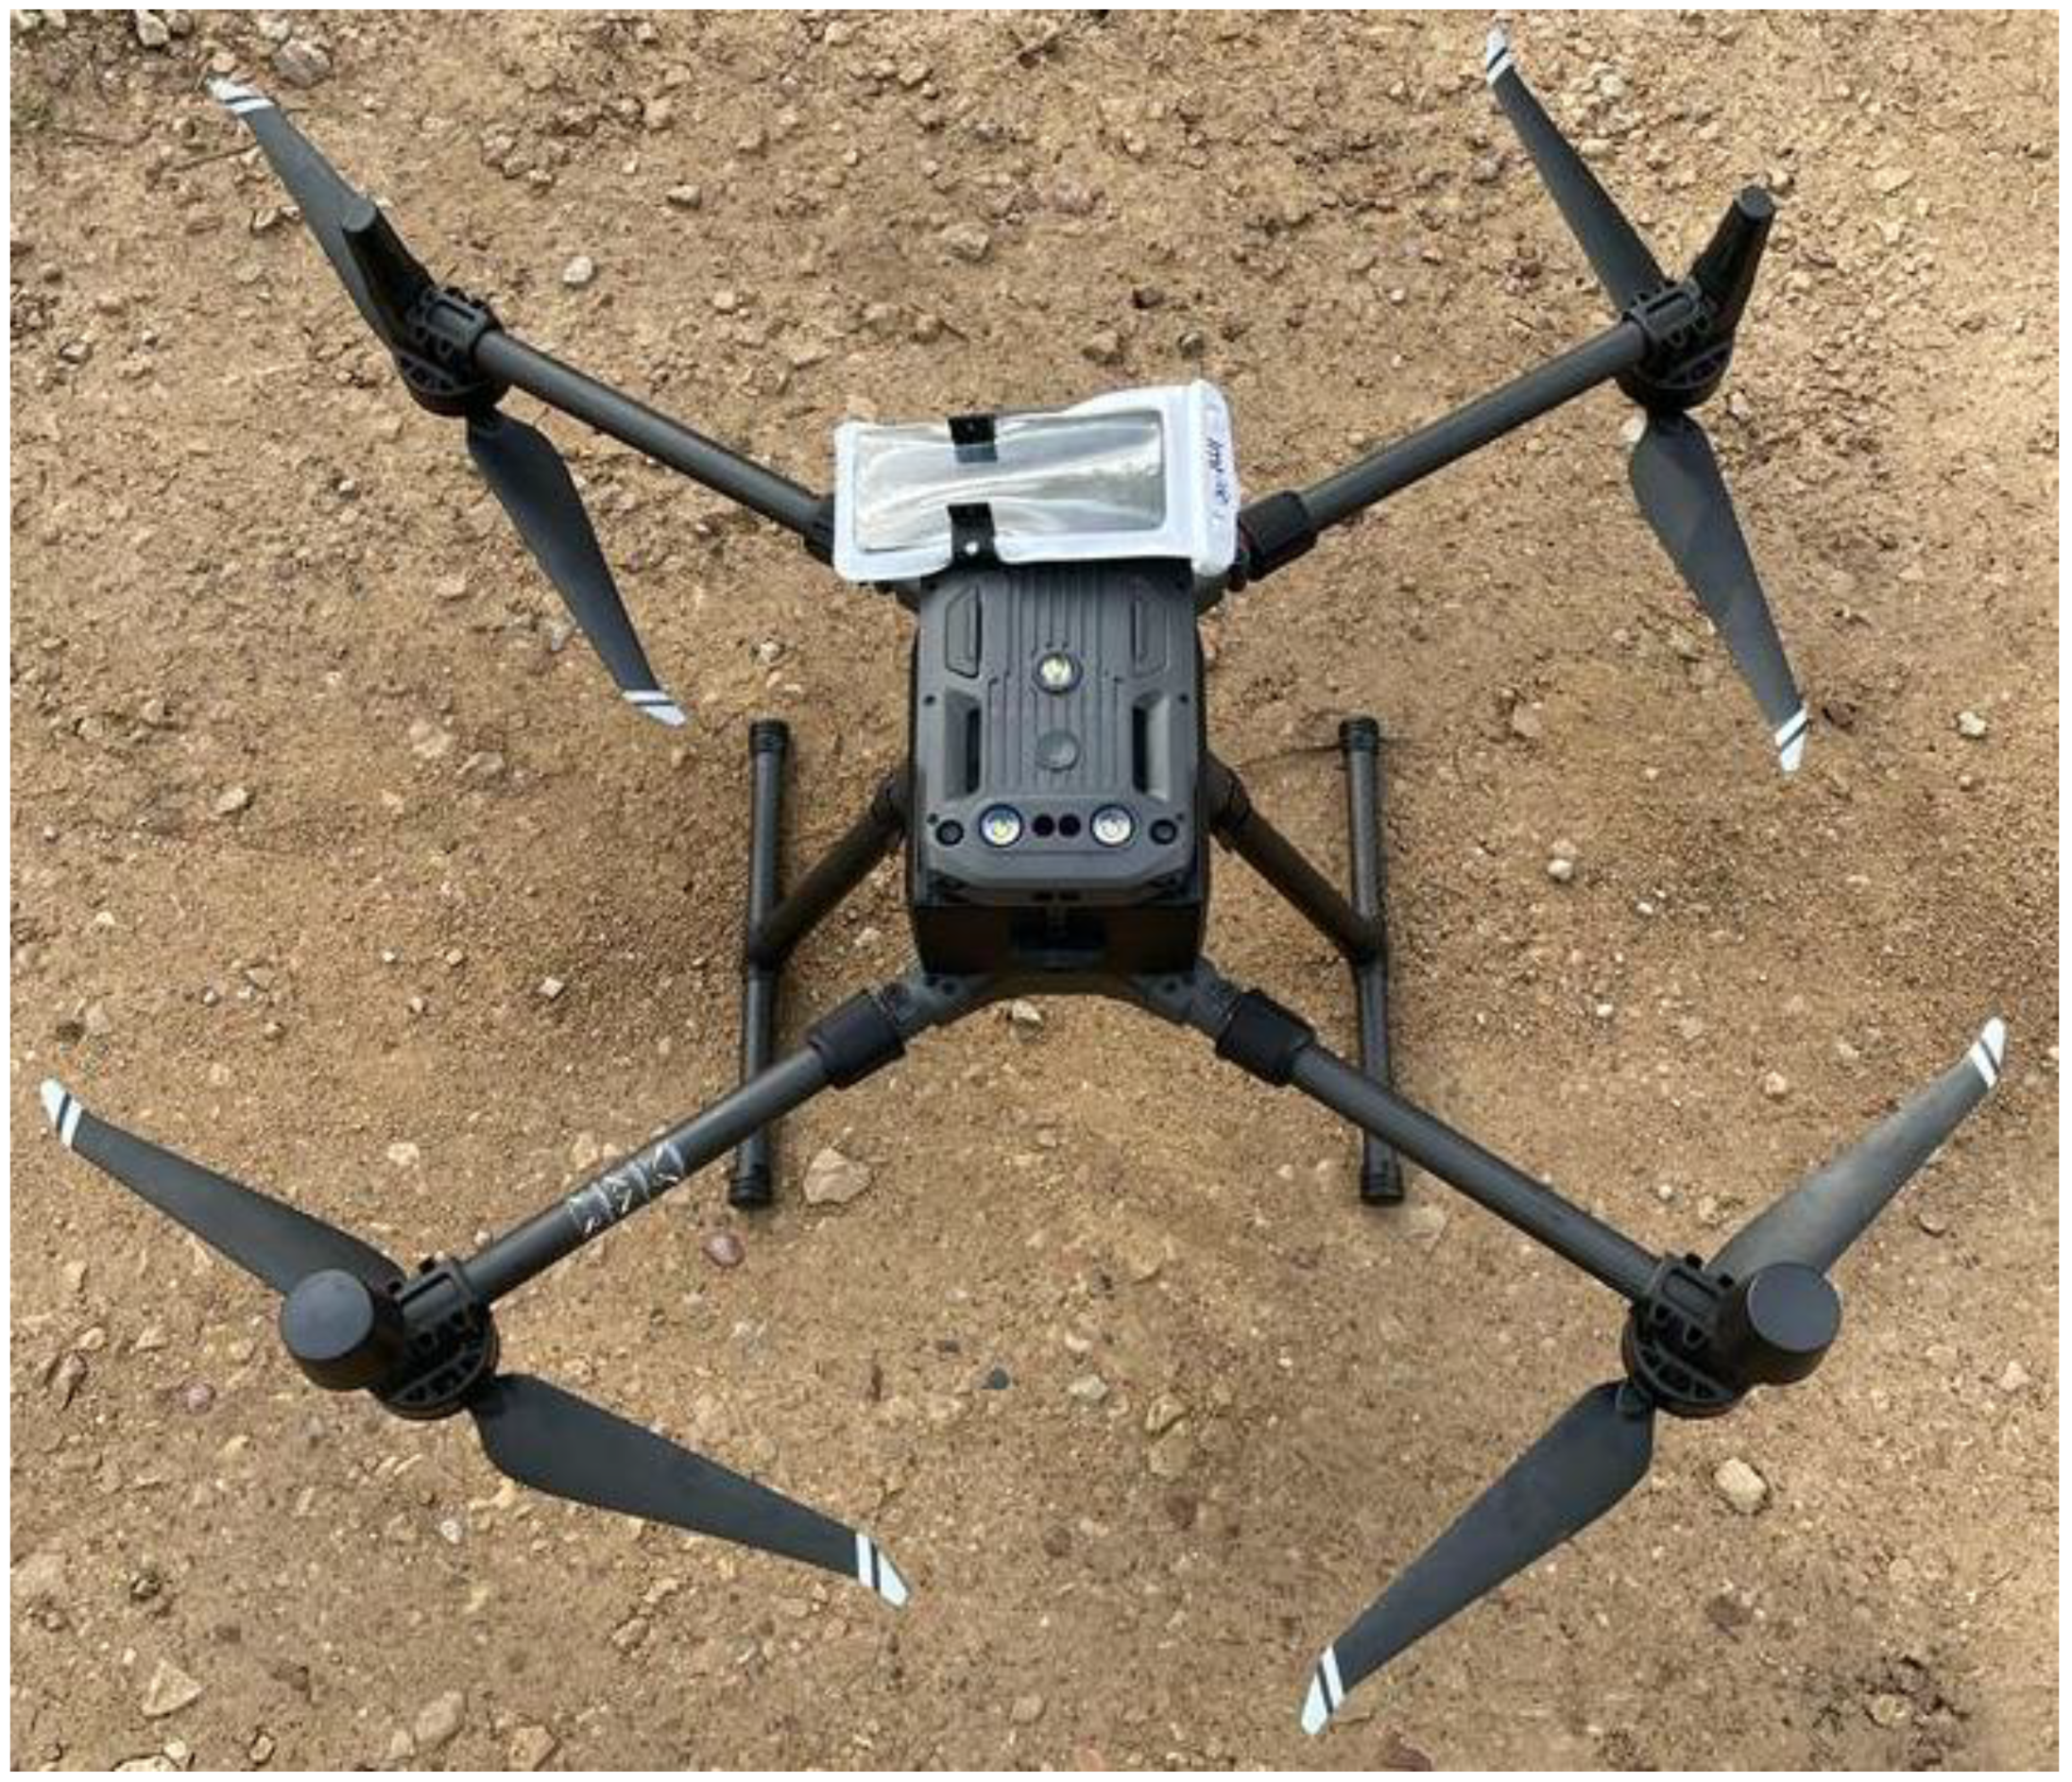
| This research | 2024 | Commercial DJI M30 drone and OnePlus NORD BE2029 mobile phone with Enhancell Echo One mobile network analyzer software | Lode, Latvia | Rural area | LTE mobile network performance parameters measurements and KPI for controlled drone flights. | 40,60, 90, 110 | RSRQ, RSRP, SINR, Ping, DL, and UL data rates |
| Parameter | Direction | Protocol | Bandwidth (kbps) | Round-Trip Time RTT (ms) | Reliability (PLER) | Priority |
|---|---|---|---|---|---|---|
| Non-critical communication | UL/DL | TCP | 35 | 500 | 10−3 | System design |
| Critical Communication | UL/DL | TCP | 35 | 500 | 10−5 | Very high |
| Video and image streaming | UL | UDP | 4096 | 500 | 10−3 | System design |
| Link Description | Rate [kbit/s] | Cellular Network Latency [ms] | End-to-End Latency [ms] | Reliability | Coverage Height [m] |
|---|---|---|---|---|---|
| UL status information | 30–50 | 50–100 | <1000 | 10−3 | 0–1000 |
| DL management instructions | 5–10 | 20–50 | <300 | 10−3–10−6 | 0–1000 |
| Parameter | RSRP (dBm) | RSRQ (dB) | SINR (dB) | Downlink (kbps) | Uplink (kbps) | Ping (ms) |
|---|---|---|---|---|---|---|
| KPI values | −100 | −16 | −5 | 4096 | 4096 | 50 |
| RSRQ Range, dB | RSRP, % | SINR, % | Downlink, % | Uplink, % | Ping, % | |||||||||||||||
|---|---|---|---|---|---|---|---|---|---|---|---|---|---|---|---|---|---|---|---|---|
| 40 | 60 | 90 | 110 | 40 | 60 | 90 | 110 | 40 | 60 | 90 | 110 | 40 | 60 | 90 | 110 | 40 | 60 | 90 | 110 | |
| (−14; −16) | 69 | 84 | 80 | 55 | 97 | 99 | 99 | 97 | 95 | 97 | 99 | 99 | 100 | 97 | 97 | 100 | 71 | 93 | 92 | 78 |
| (−16; −18) | 59 | 86 | 79 | 90 | 85 | 86 | 84 | 90 | 99 | 94 | 97 | 100 | 100 | 99 | 99 | 86 | 85 | 84 | 80 | |
| (−18; −20) | 22 | 37 | 50 | 76 | 34 | 40 | 34 | 34 | 100 | 100 | 99 | 98 | 97 | 100 | 99 | 100 | 97 | 100 | 61 | 80 |
| 95–100% | 94–85% | 84–75% | <74% | |||||||||||||||||
| RSRP Range, dBm | RSRQ, % | SINR, % | Downlink, % | Uplink, % | Ping, % | |||||||||||||||
|---|---|---|---|---|---|---|---|---|---|---|---|---|---|---|---|---|---|---|---|---|
| 40 | 60 | 90 | 110 | 40 | 60 | 90 | 110 | 40 | 60 | 90 | 110 | 40 | 60 | 90 | 110 | 40 | 60 | 90 | 110 | |
| −95; −100 | 66 | 65 | 42 | 33 | 95 | 95 | 80 | 73 | 91 | 97 | 96 | 90 | 99 | 99 | 99 | 99 | 90 | 84 | 94 | 89 |
| −100; −105 | 20 | 7 | 1 | 4 | 65 | 36 | 29 | 35 | 100 | 100 | 95 | 99 | 98 | 100 | 99 | 92 | 82 | 100 | 100 | 100 |
| −105; −110 | 29 | 63 | 30 | 97 | 29 | 100 | 100 | 100 | 100 | 100 | - | 100 | 100 | - | 100 | - | - | 100 | - | - |
| 95–100% | 94–85% | 84–75% | <74% | |||||||||||||||||
| SINR Range, dB | RSRP, % | RSRQ, % | Downlink, % | Uplink, % | Ping, % | |||||||||||||||
|---|---|---|---|---|---|---|---|---|---|---|---|---|---|---|---|---|---|---|---|---|
| 40 | 60 | 90 | 110 | 40 | 60 | 90 | 110 | 40 | 60 | 90 | 110 | 40 | 60 | 90 | 110 | 40 | 60 | 90 | 110 | |
| (−2.5; −5) | 67 | 89 | 82 | 89 | 39 | 40 | 23 | 23 | 98 | 99 | 95 | 99 | 100 | 98 | 97 | 98 | 83 | 86 | 77 | 85 |
| (−5; −7.5) | 29 | 53 | 55 | 83 | 9 | 7 | 2 | 5 | 72 | 100 | 99 | 80 | 100 | 100 | 94 | 100 | 92 | 92 | 91 | 68 |
| (−7.5; −10) | 7 | 30 | 59 | 31 | 7 | 0 | 0 | 0 | - | - | 100 | 100 | 100 | 100 | 100 | 100 | - | 100 | 22 | 100 |
| 95–100% | 94–85% | 84–75% | <74% | |||||||||||||||||
Disclaimer/Publisher’s Note: The statements, opinions and data contained in all publications are solely those of the individual author(s) and contributor(s) and not of MDPI and/or the editor(s). MDPI and/or the editor(s) disclaim responsibility for any injury to people or property resulting from any ideas, methods, instructions or products referred to in the content. |
© 2024 by the authors. Licensee MDPI, Basel, Switzerland. This article is an open access article distributed under the terms and conditions of the Creative Commons Attribution (CC BY) license (https://creativecommons.org/licenses/by/4.0/).
Share and Cite
Braunfelds, J.; Jakovels, G.; Murans, I.; Litvinenko, A.; Senkans, U.; Rumba, R.; Onzuls, A.; Valters, G.; Lidere, E.; Plone, E. Experimental Study on LTE Mobile Network Performance Parameters for Controlled Drone Flights. Sensors 2024, 24, 6615. https://doi.org/10.3390/s24206615
Braunfelds J, Jakovels G, Murans I, Litvinenko A, Senkans U, Rumba R, Onzuls A, Valters G, Lidere E, Plone E. Experimental Study on LTE Mobile Network Performance Parameters for Controlled Drone Flights. Sensors. 2024; 24(20):6615. https://doi.org/10.3390/s24206615
Chicago/Turabian StyleBraunfelds, Janis, Gints Jakovels, Ints Murans, Anna Litvinenko, Ugis Senkans, Rudolfs Rumba, Andis Onzuls, Guntis Valters, Elina Lidere, and Evija Plone. 2024. "Experimental Study on LTE Mobile Network Performance Parameters for Controlled Drone Flights" Sensors 24, no. 20: 6615. https://doi.org/10.3390/s24206615
APA StyleBraunfelds, J., Jakovels, G., Murans, I., Litvinenko, A., Senkans, U., Rumba, R., Onzuls, A., Valters, G., Lidere, E., & Plone, E. (2024). Experimental Study on LTE Mobile Network Performance Parameters for Controlled Drone Flights. Sensors, 24(20), 6615. https://doi.org/10.3390/s24206615