Implementation of Smart Farm Systems Based on Fog Computing in Artificial Intelligence of Things Environments


Abstract
1. Introduction
2. Background Theory
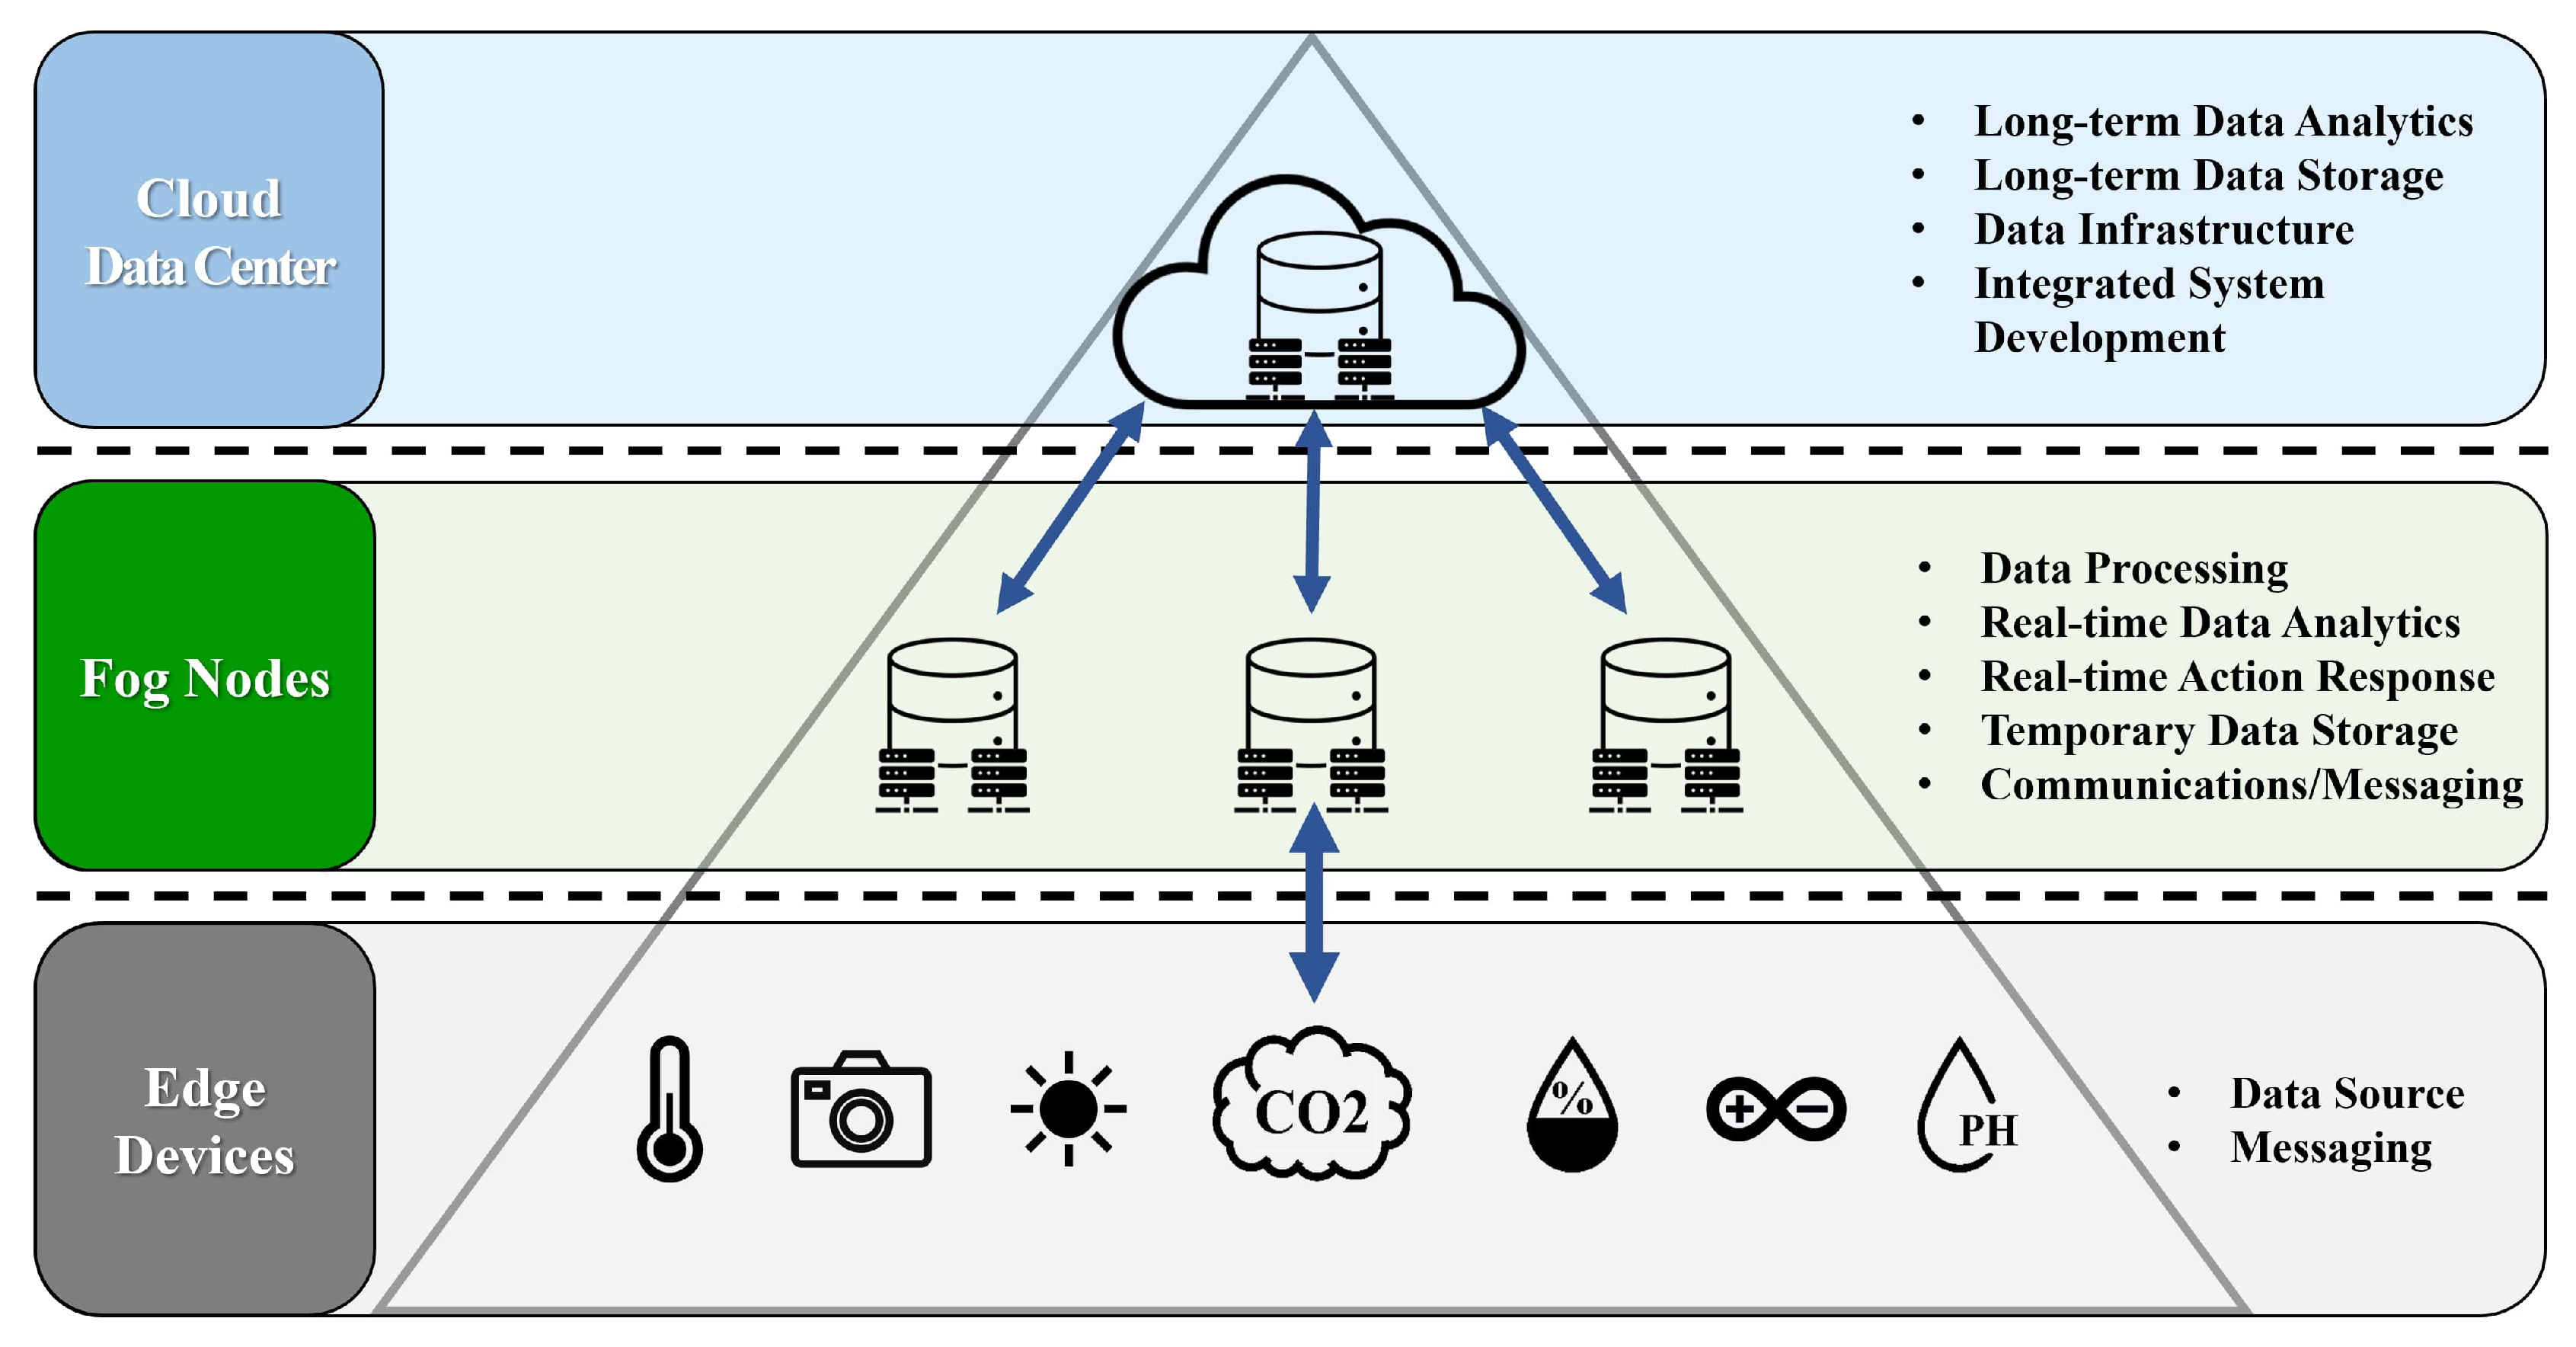
2.1. Fog Computing
2.2. AIoT

| Protocol | HTTP | MQTT | CoAP |
|---|---|---|---|
| Year | 1997 | 1999 | 2010 |
| Architecture | Client/Server | Client/Broker | Client/Server or Publish/Subscribe |
| Abstraction | Request/Response | Publish/Subscribe | Request/Response or Publish/Subscribe |
| Header Size | Undefined | 2 bytes | 4 bytes |
| Message Size | Large and undefined (depends on the web server orthe programming technology) | Small and undefined (up to 256 MB maximum size) | Small and undefined (normally small to fit insingle IP datagram) |
| Semantics/Method | Get, Post, Head, Put, Patch, Options, Connect, Delete | Connect, Disconnect, Publish, Subscribe, Unsubscribe, Close | Get, Post, Put, Delete |
| Cache and proxy support | Yes | Partial | Yes |
| Quality of Service (QoS/Reliability) | Limited (via transport protocols—TCP) | QoS 0—at most once (fire-and-forget), QoS 1—at least once, QoS 2—exactly once | Confirmable message (similar to at most once) ornon-confirmable message (similar to at least once) |
| Standards | IETF and W3C | OASIS, Eclipse Foundation | IETF, Eclipse Foundation |
| Transport Protocol | TCP | TCP/UDP (MQTT-SN) | UDP, SCTP |
| Security | TLS/SSL | TLS/SSL | DTLS |
| Default Port | 80/443 (TLS/SSL) | 1883/8883 (TLS/SSL) | 5683 (UDP)/5684 (DTLS) |
| Encoding Format | Text | Binary | Binary |
| Licensing Model | Free | Open Source | Open Source |
| Organizational Support | Global Web Protocol Standard [27] | IBM, Facebook, Cisco, Red hat, AWS | Large Web Community Support, Cisco, Contiki Erika, IoTivity |
2.3. Related Works
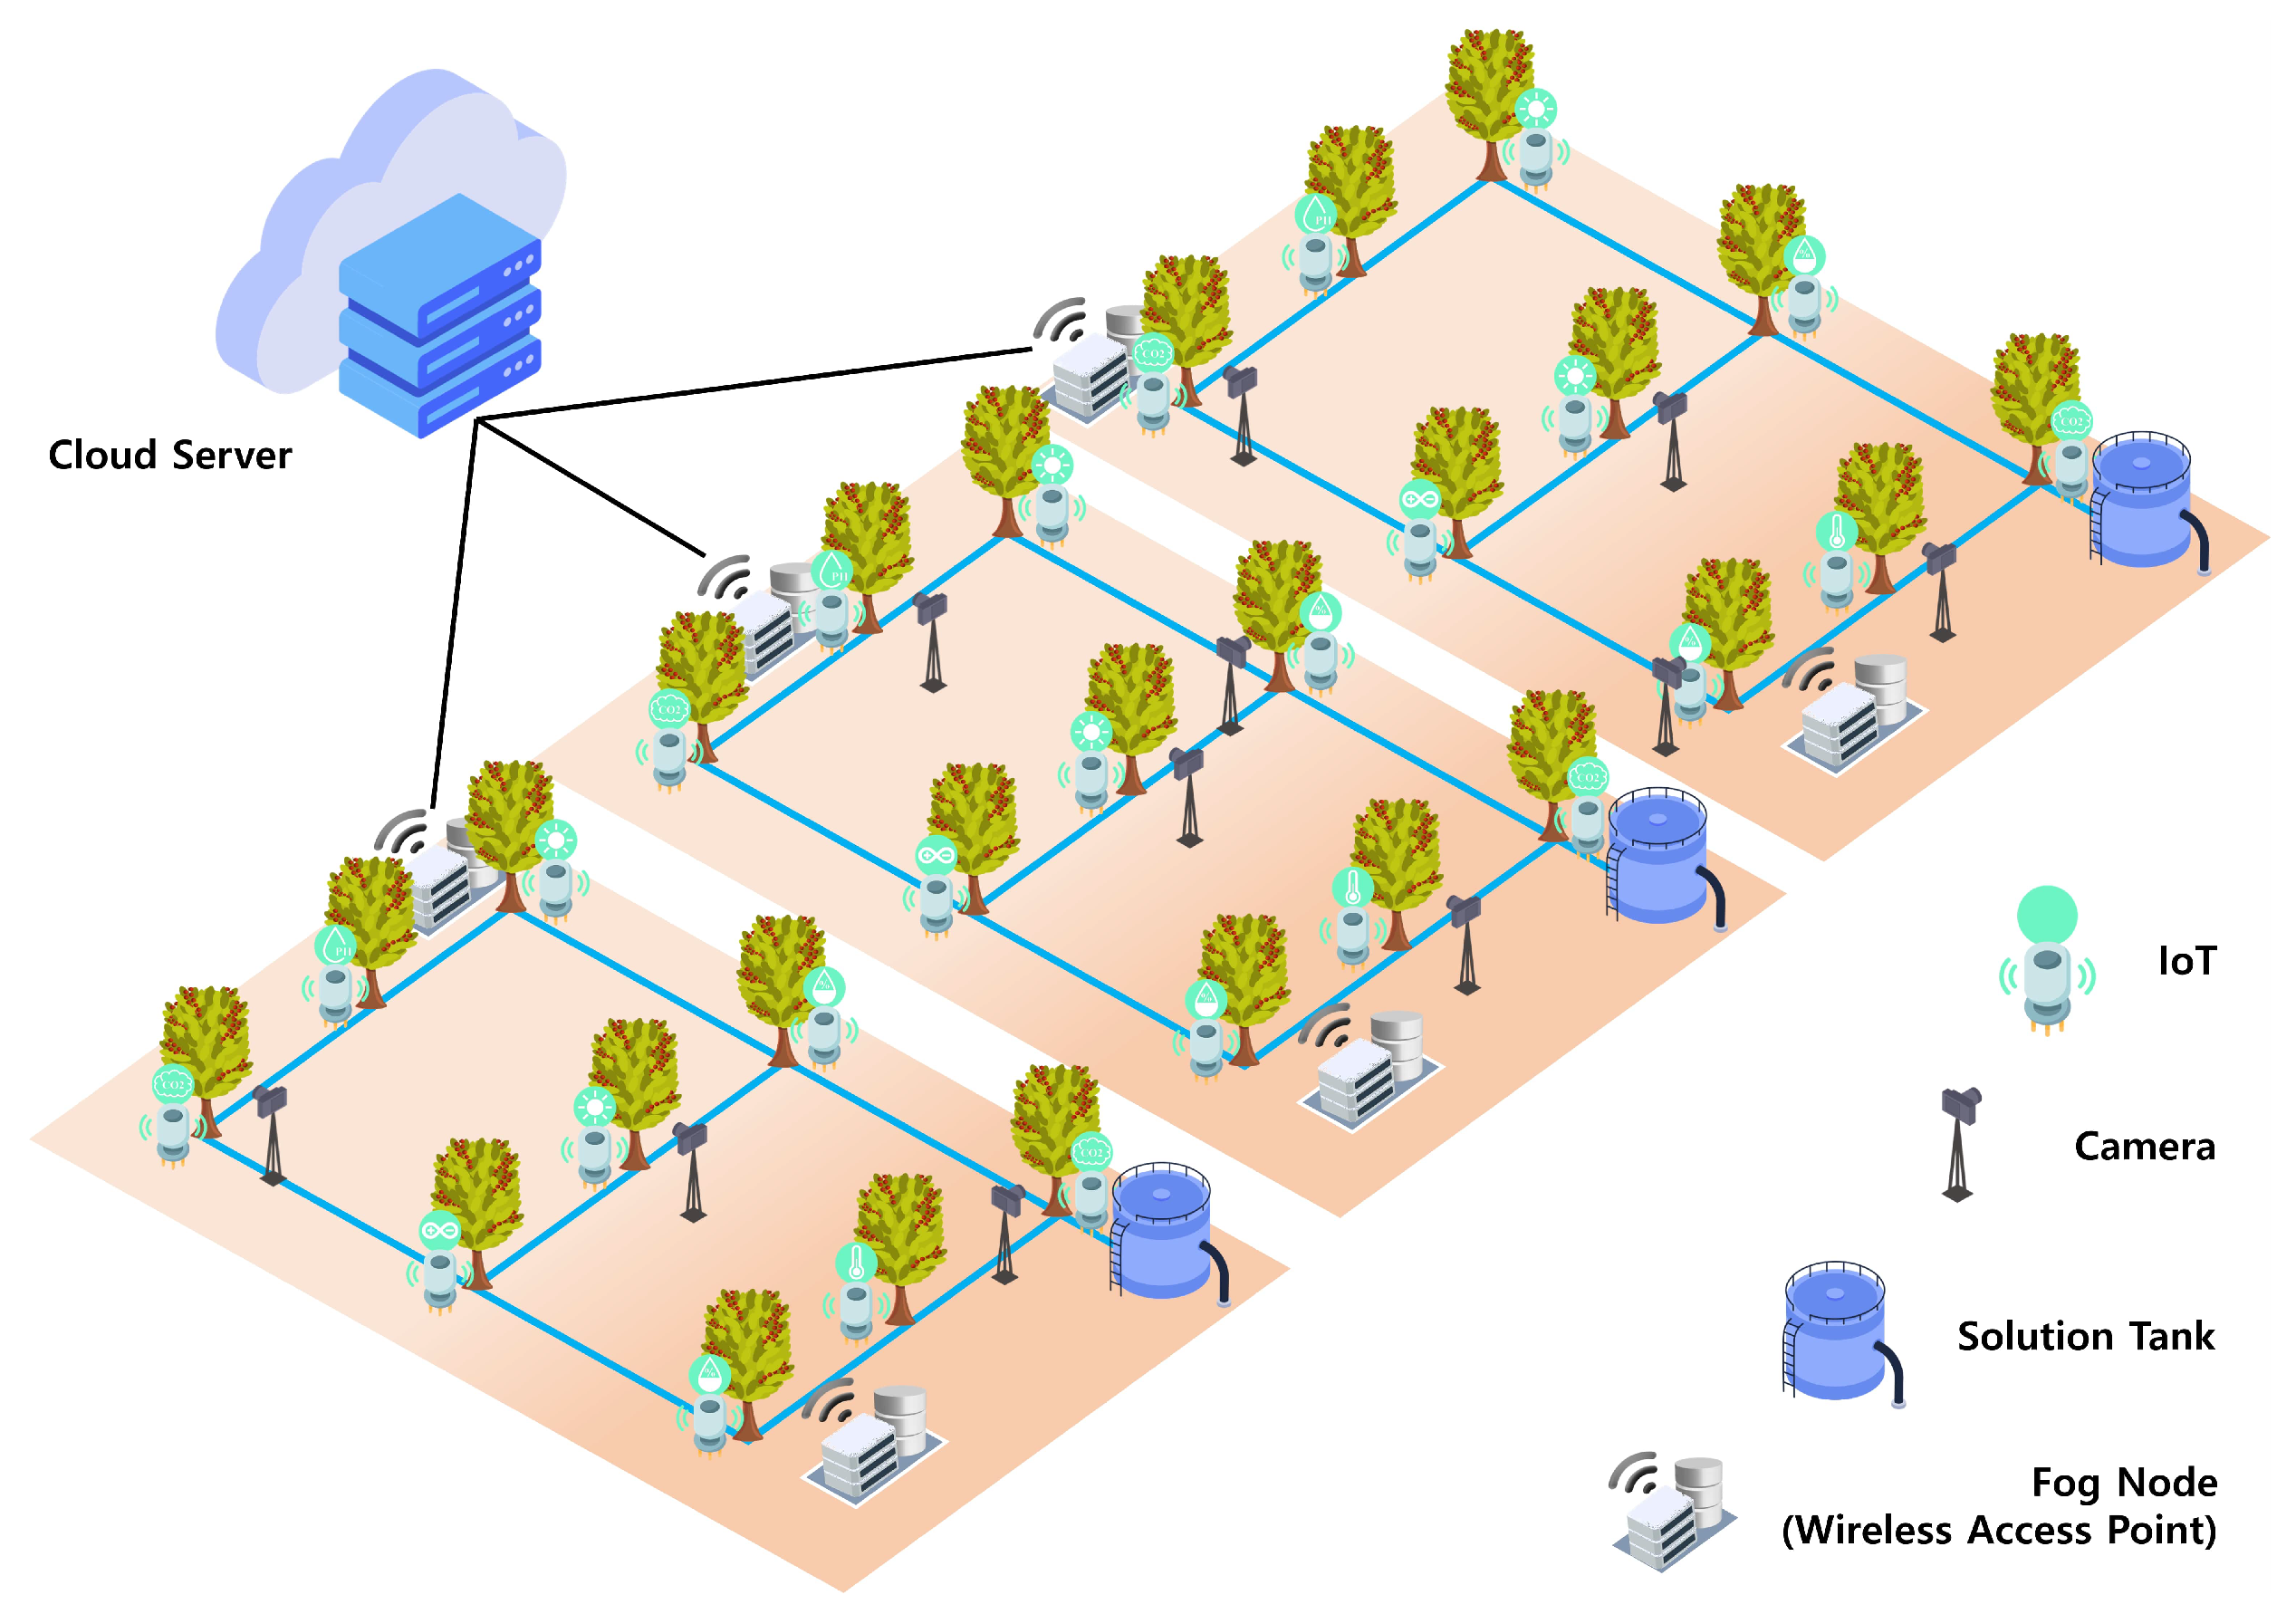
3. Proposed Method
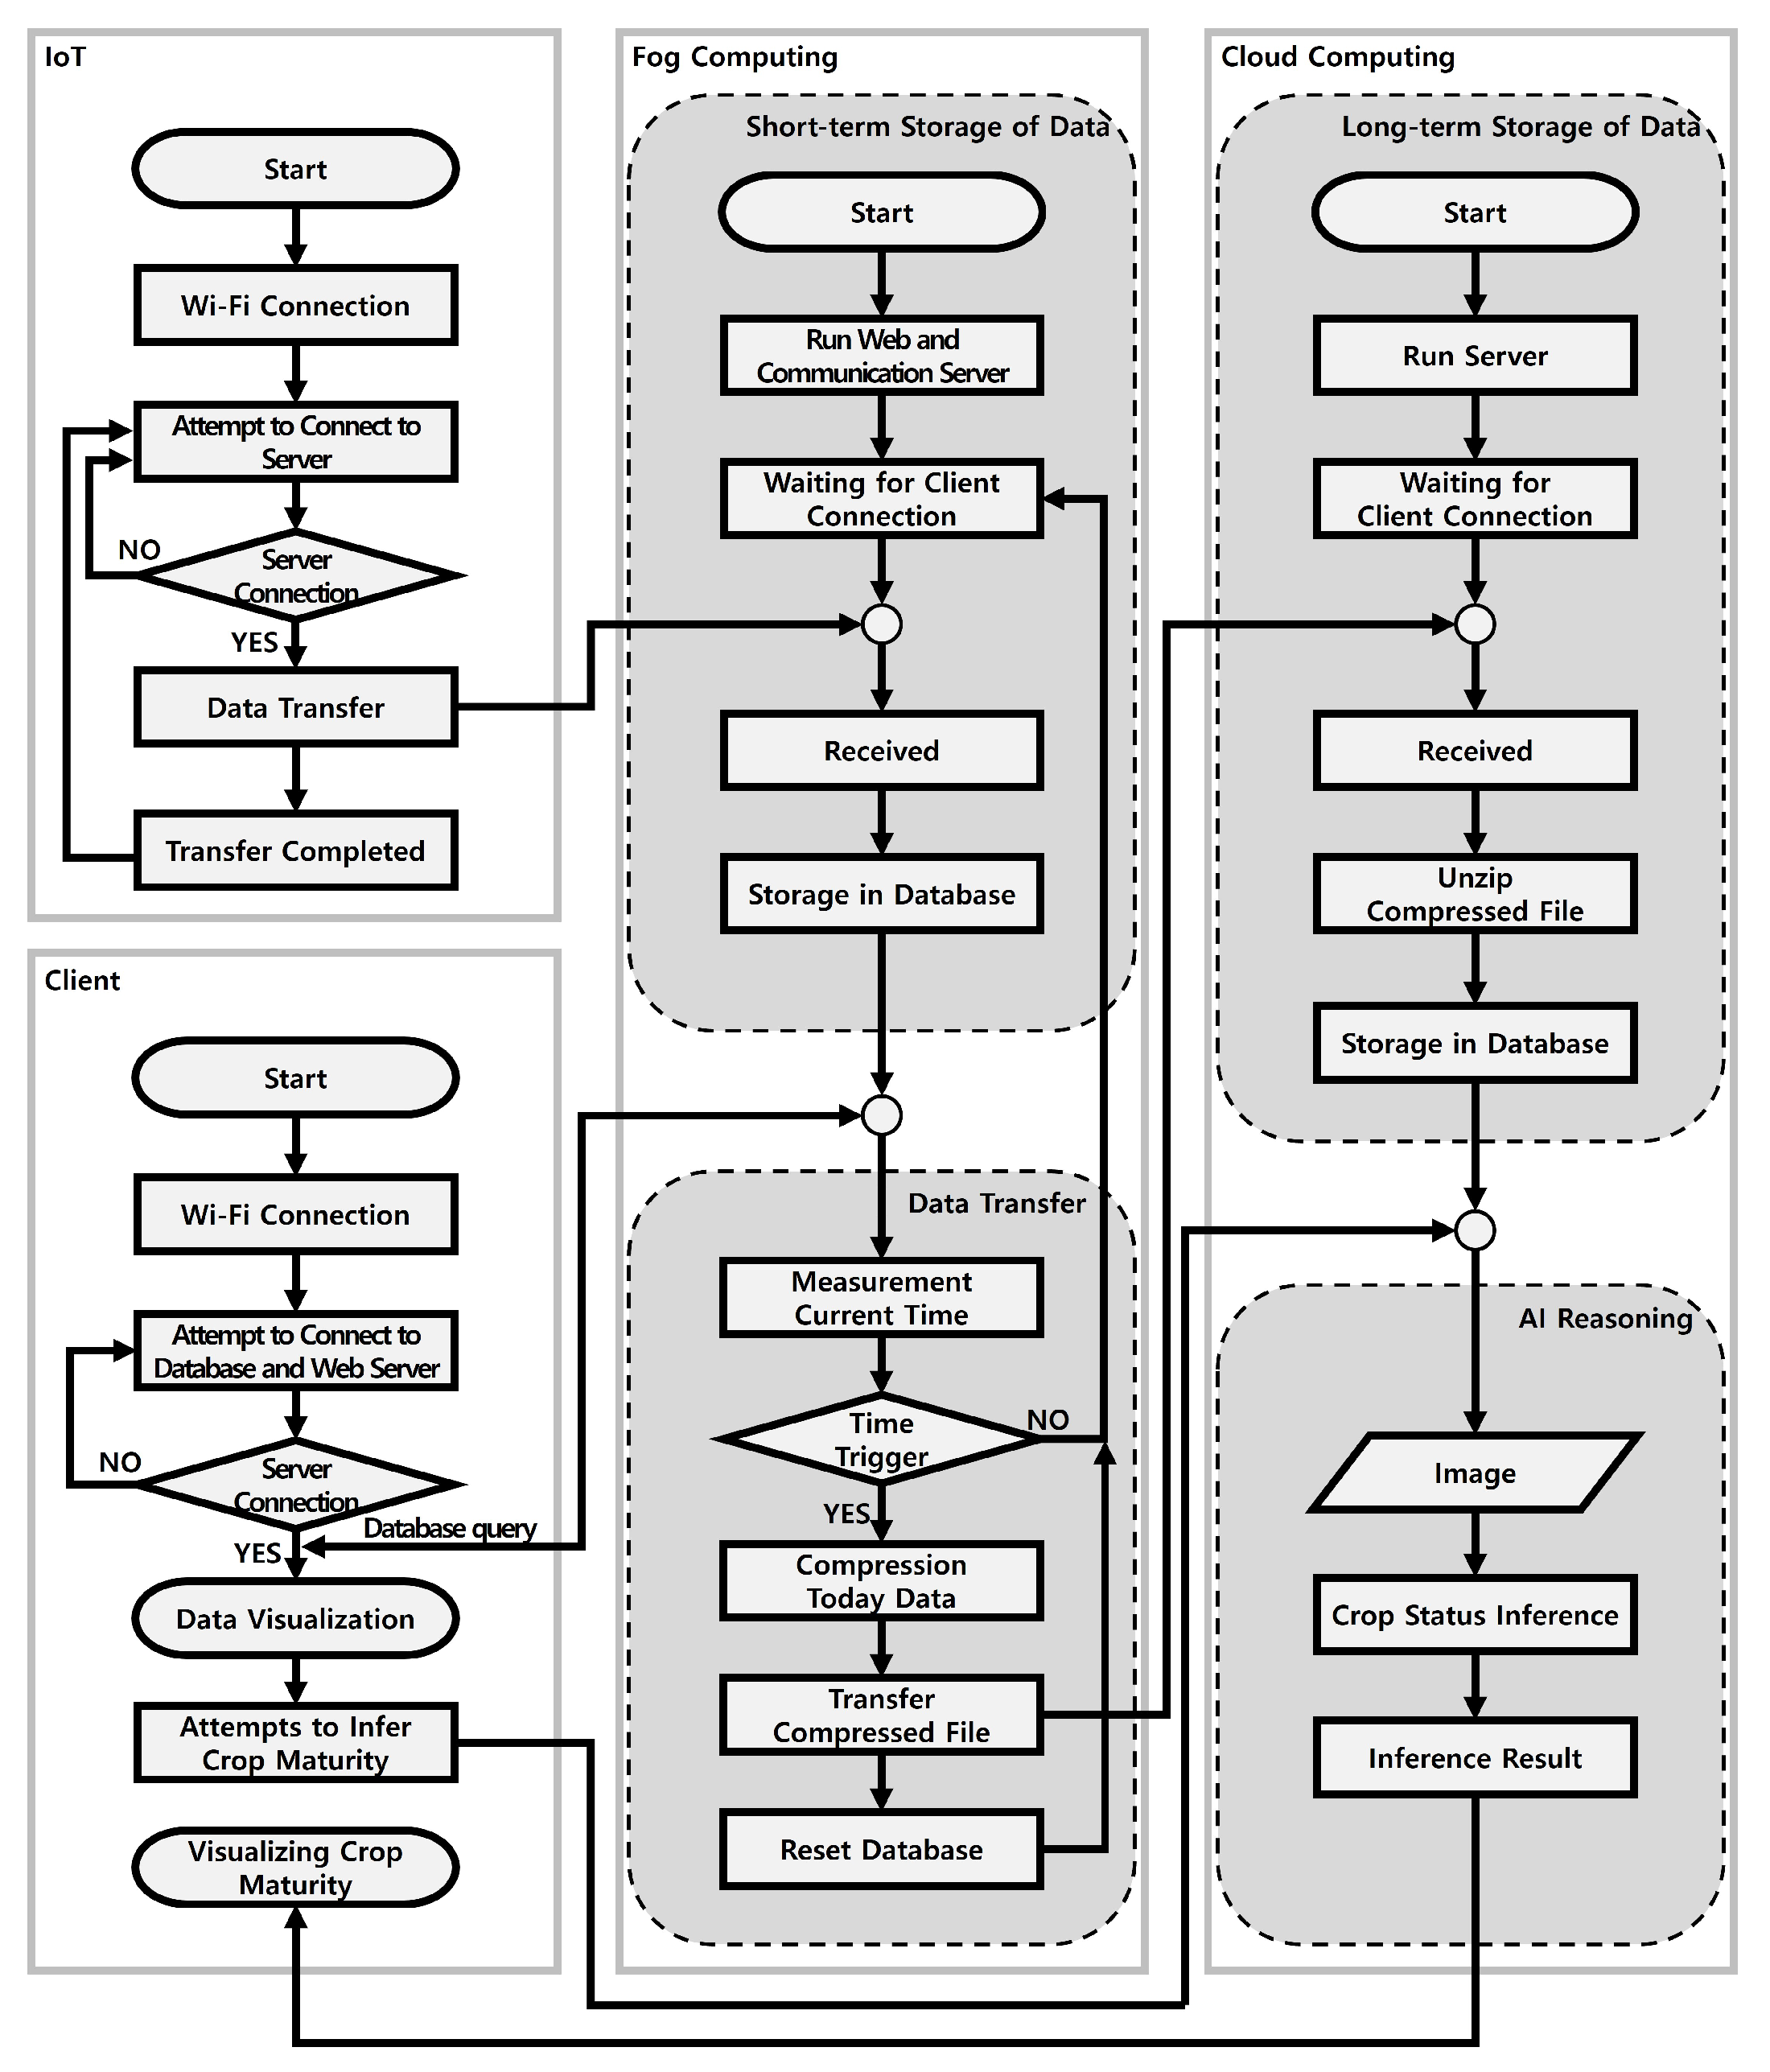
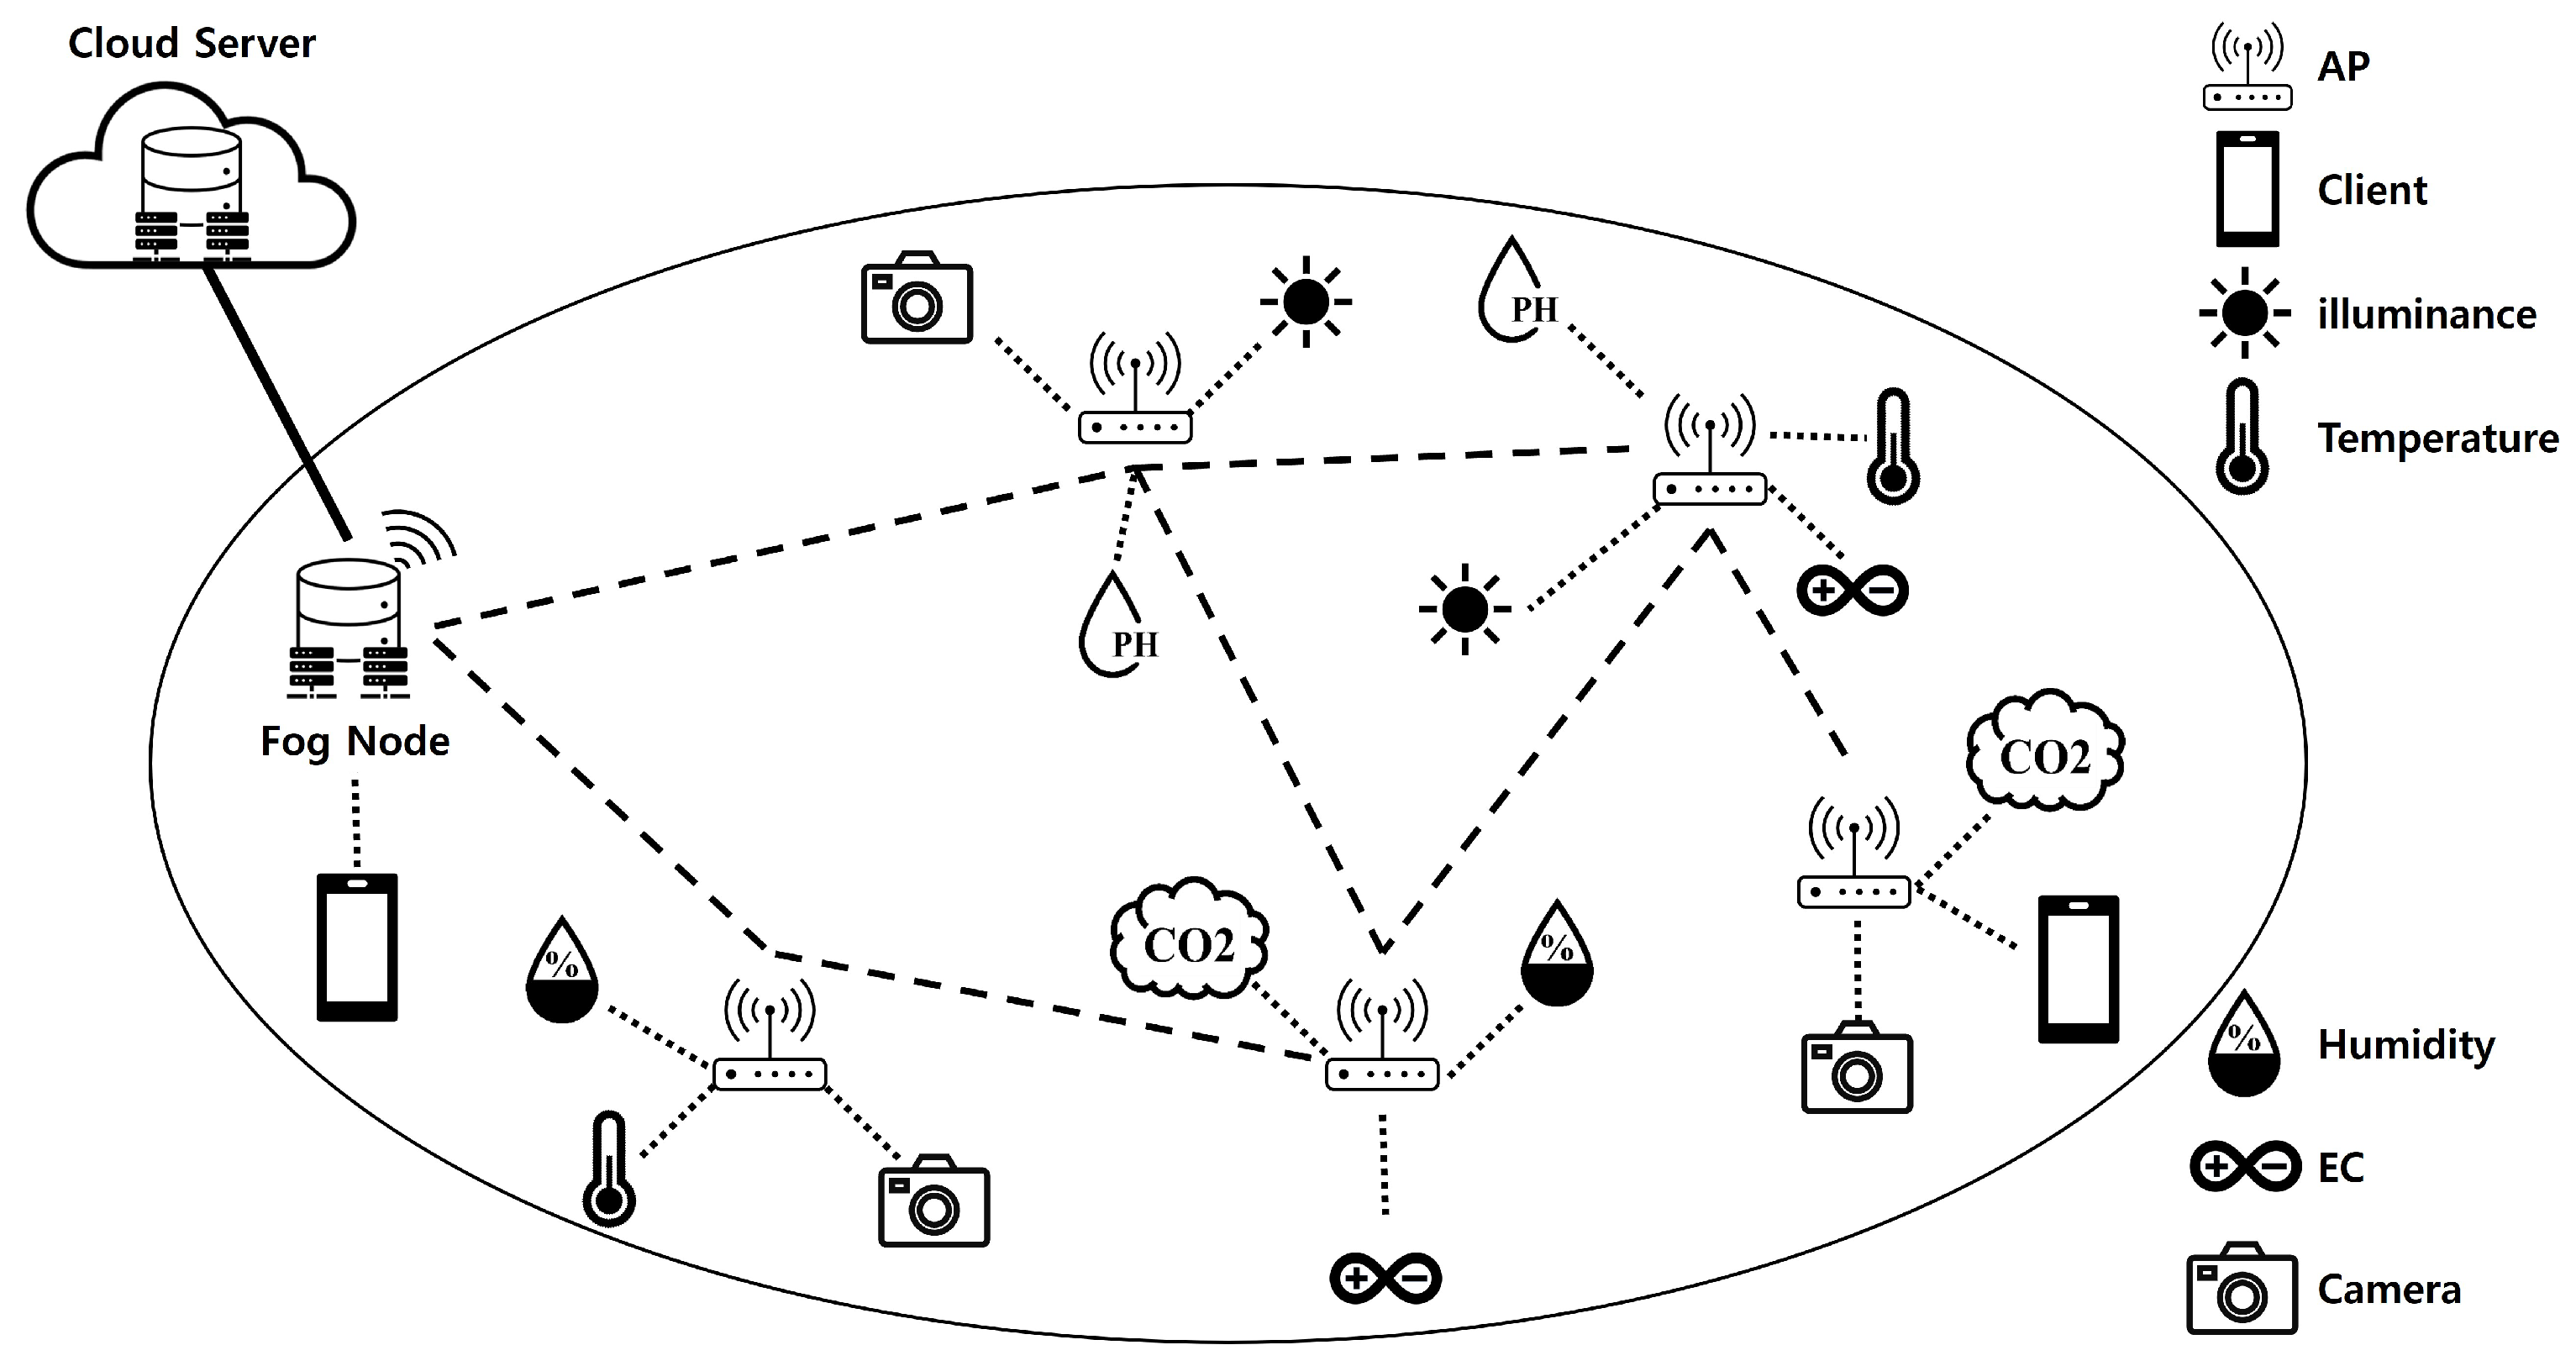
3.1. Internet of Things System
3.2. Fog Computing System
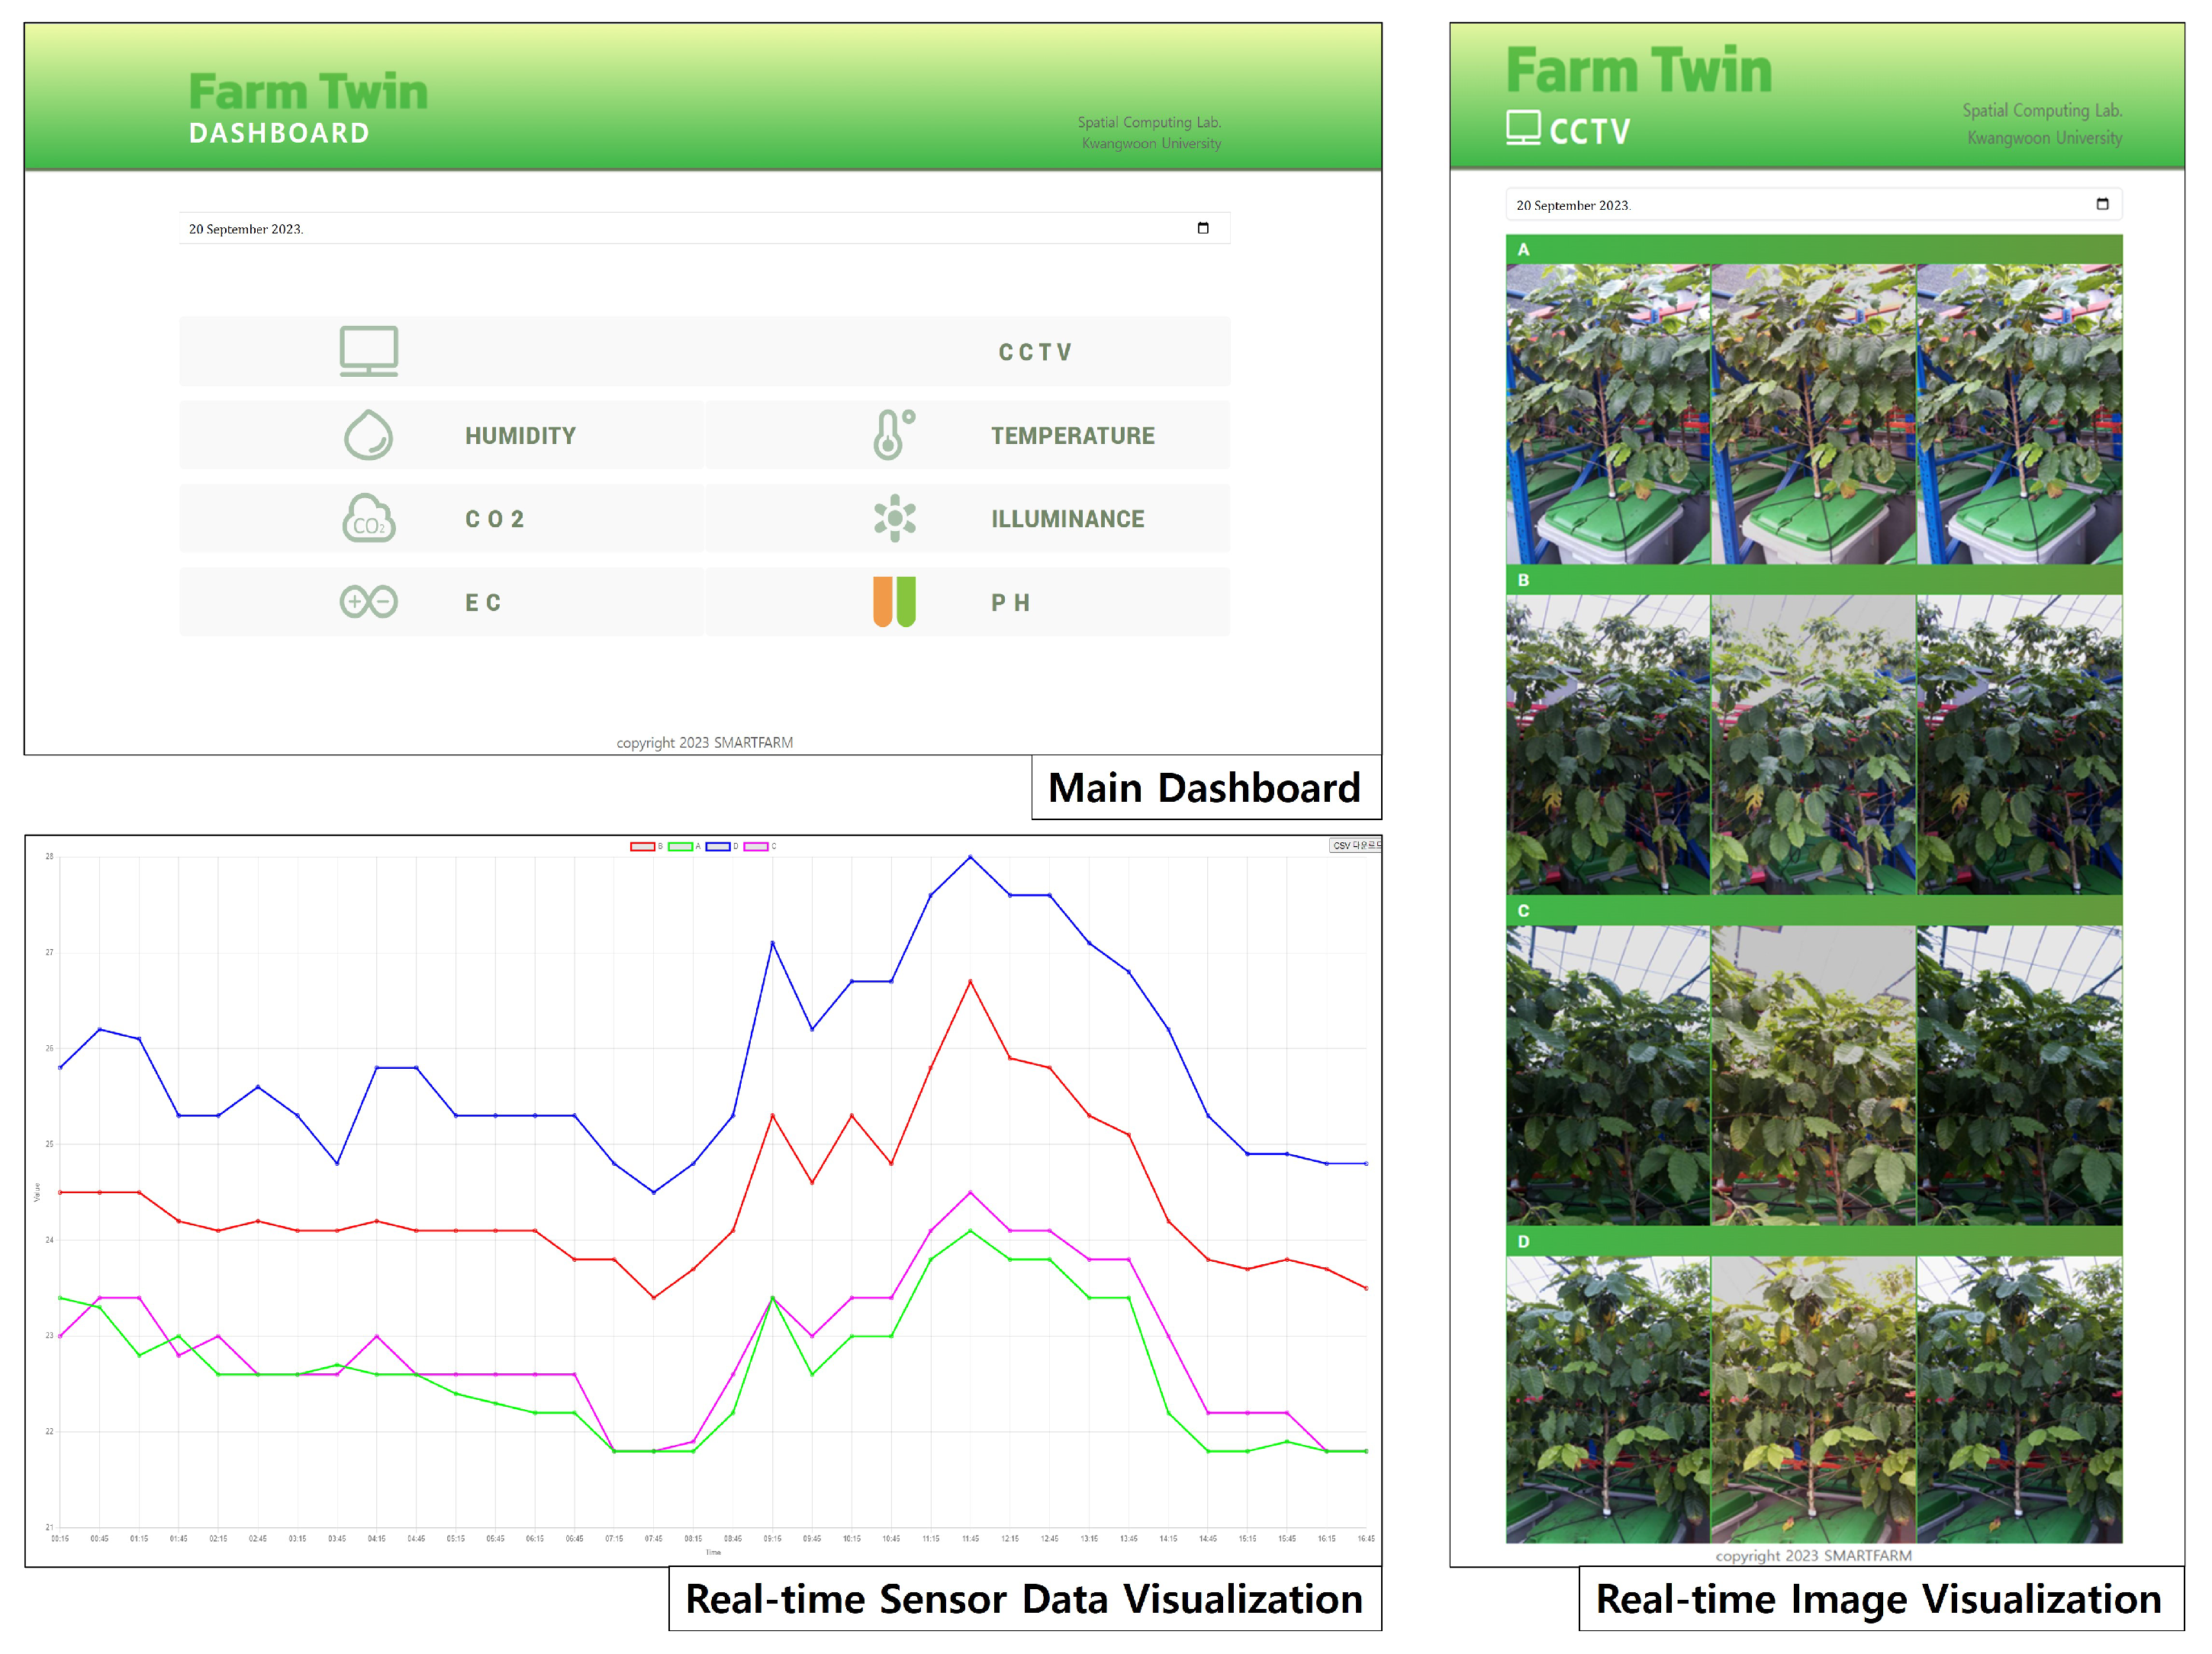
3.2.1. Recording and Visualization of Sensor Data
3.2.2. Image Recording and Visualization
3.2.3. Compression and Transmission
3.3. Cloud Computing System
3.3.1. Long-Term Storage and Visualization of Data
3.3.2. CNN-Based Maturity Level Classification
4. Experiment Environment
4.1. Fog/Cloud Computing Environment
4.2. AI Server Environment
4.3. Experimental Evaluation Method
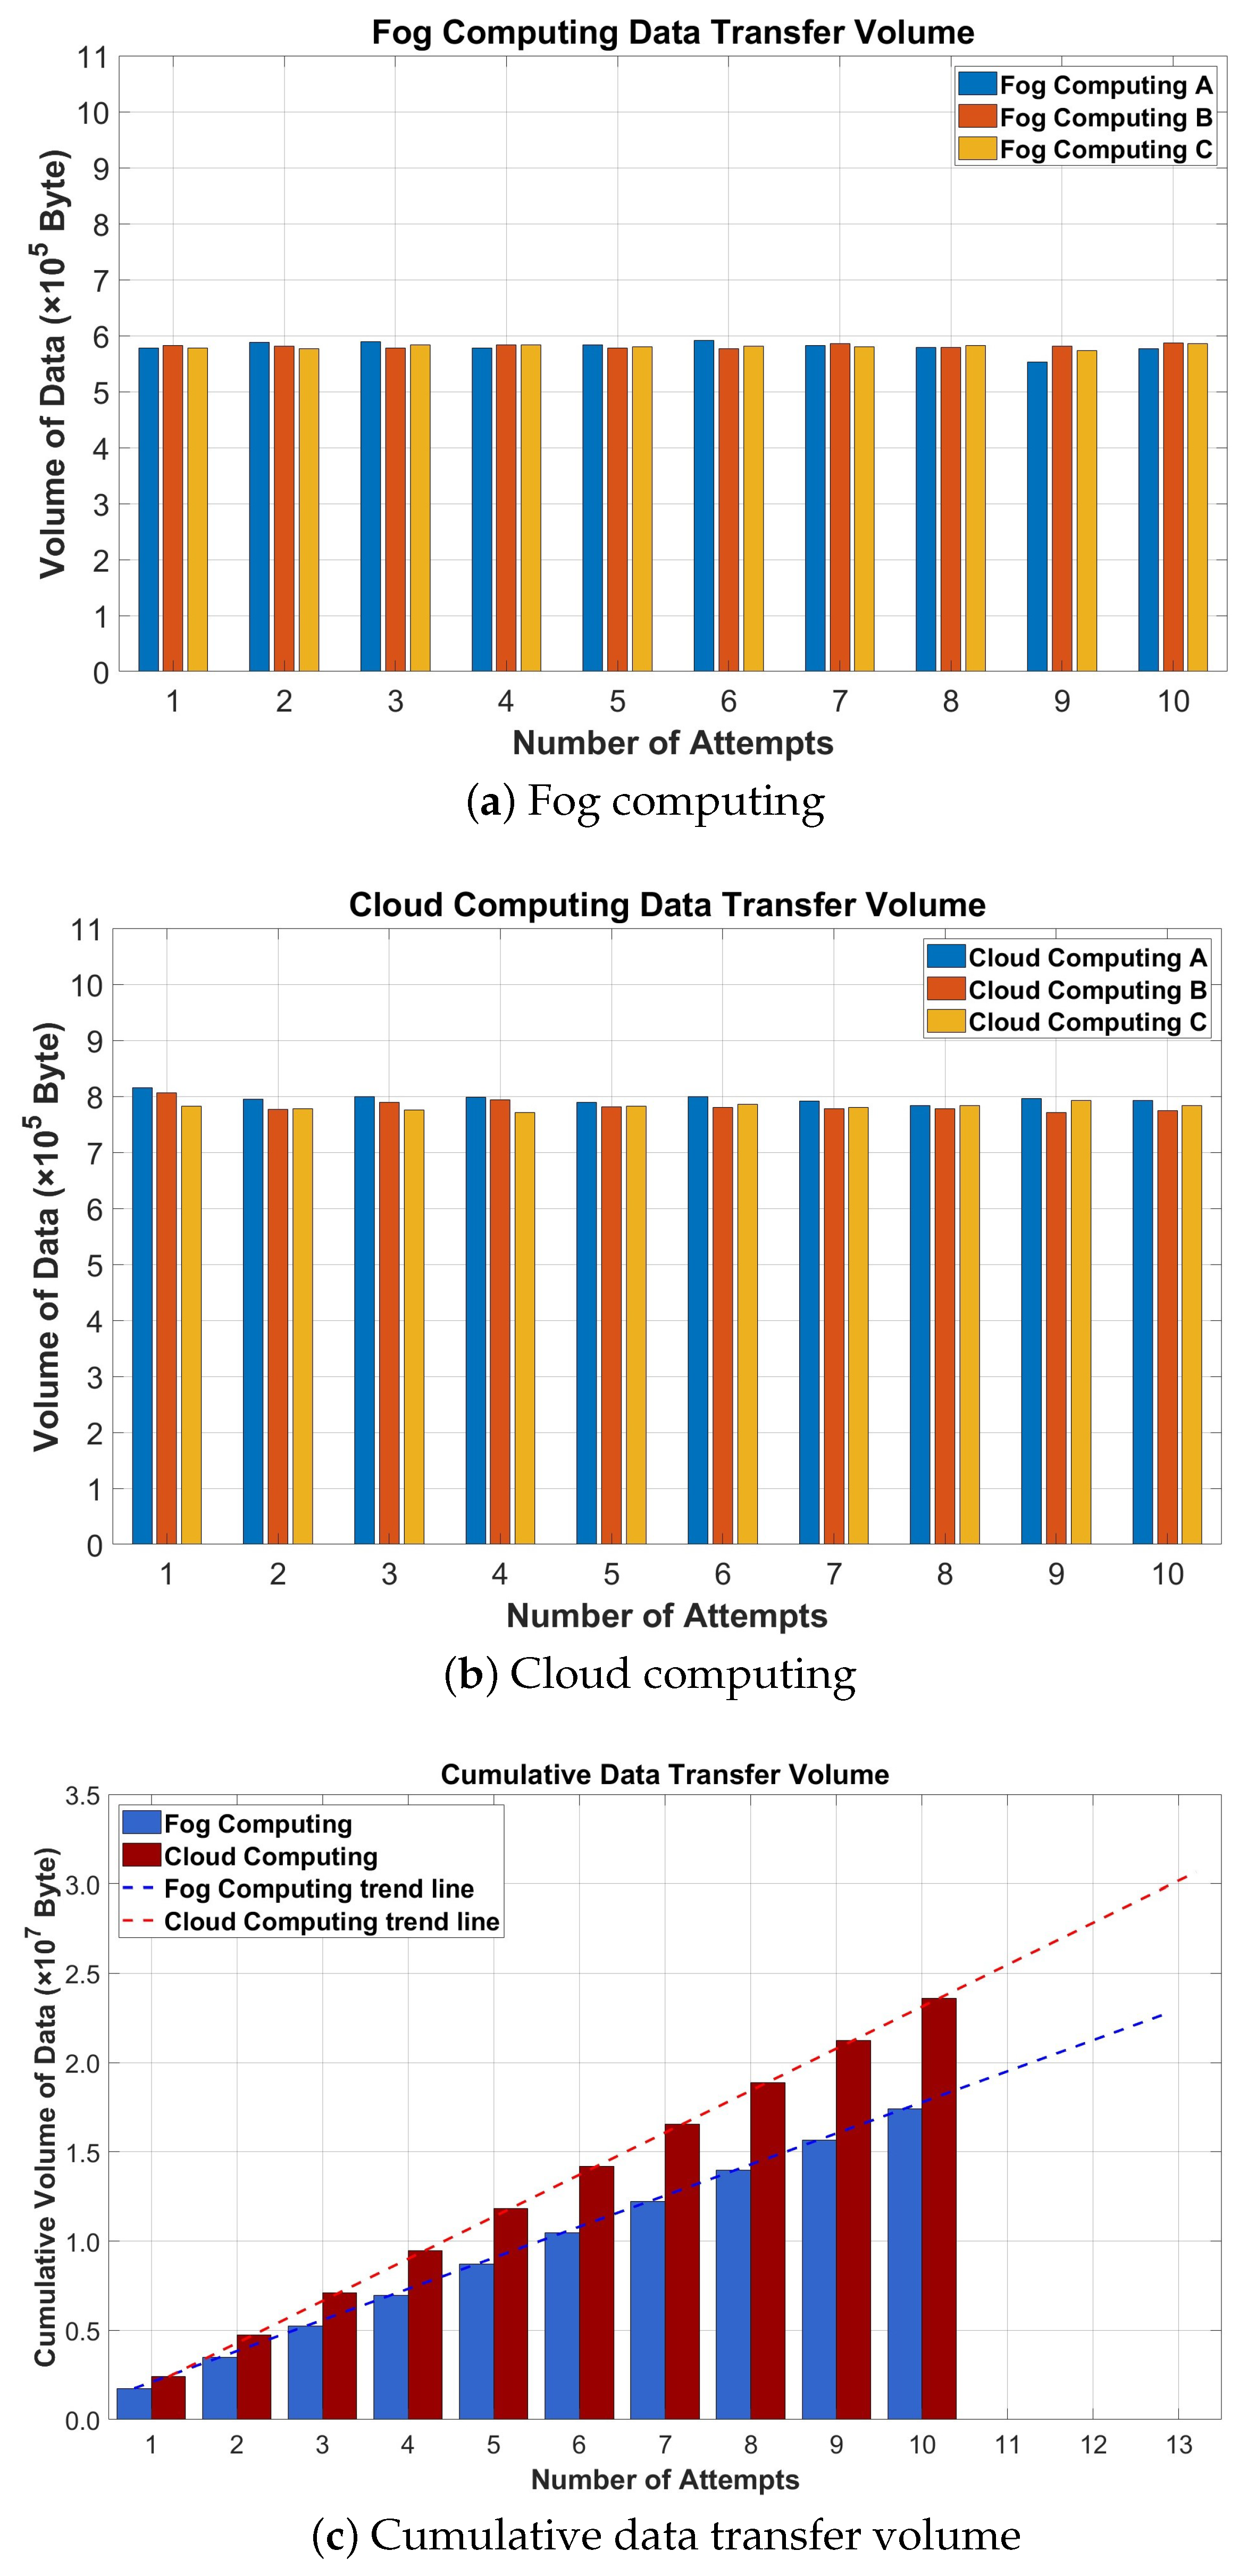
4.3.1. Comparison of Transmission Volume of Fog/Cloud Computing Data
4.3.2. Performance Comparison of IoT Protocols
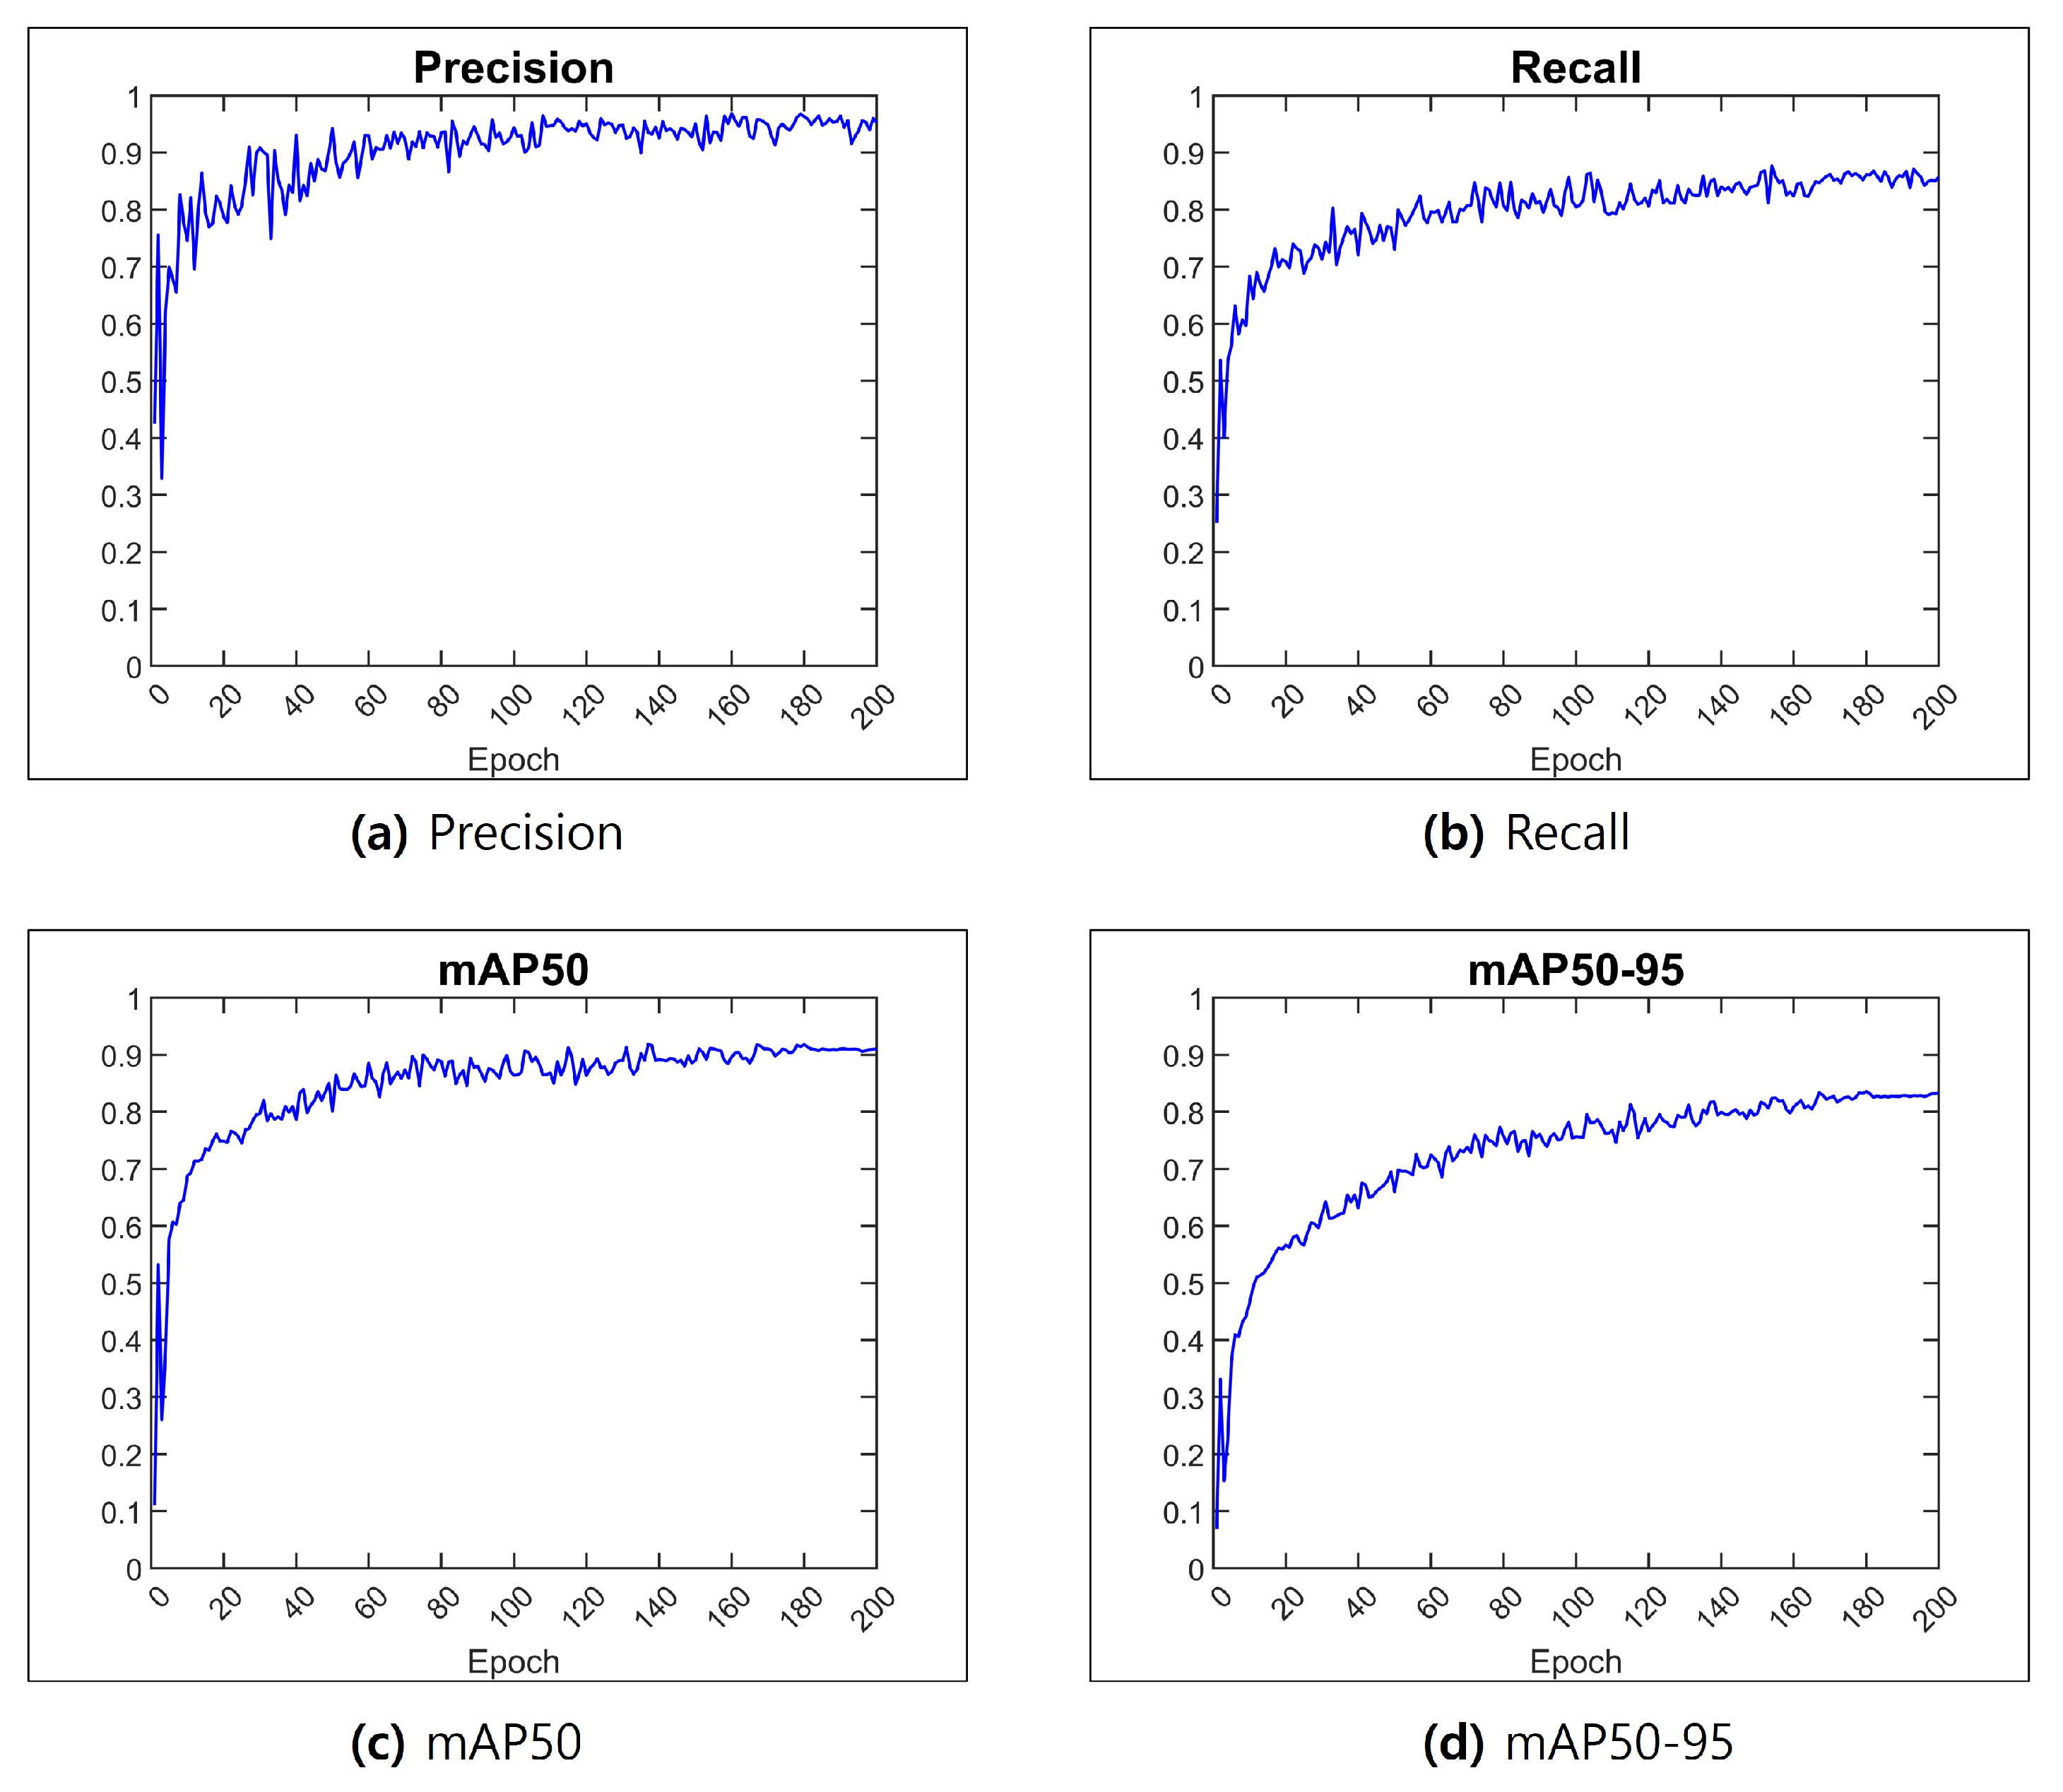
4.3.3. CNN-Based Maturity Level Classification
5. Experiment Results
5.1. Comparison of Transmitted Data Volume in Fog and Cloud Computing
5.2. IoT Protocol Comparison Results
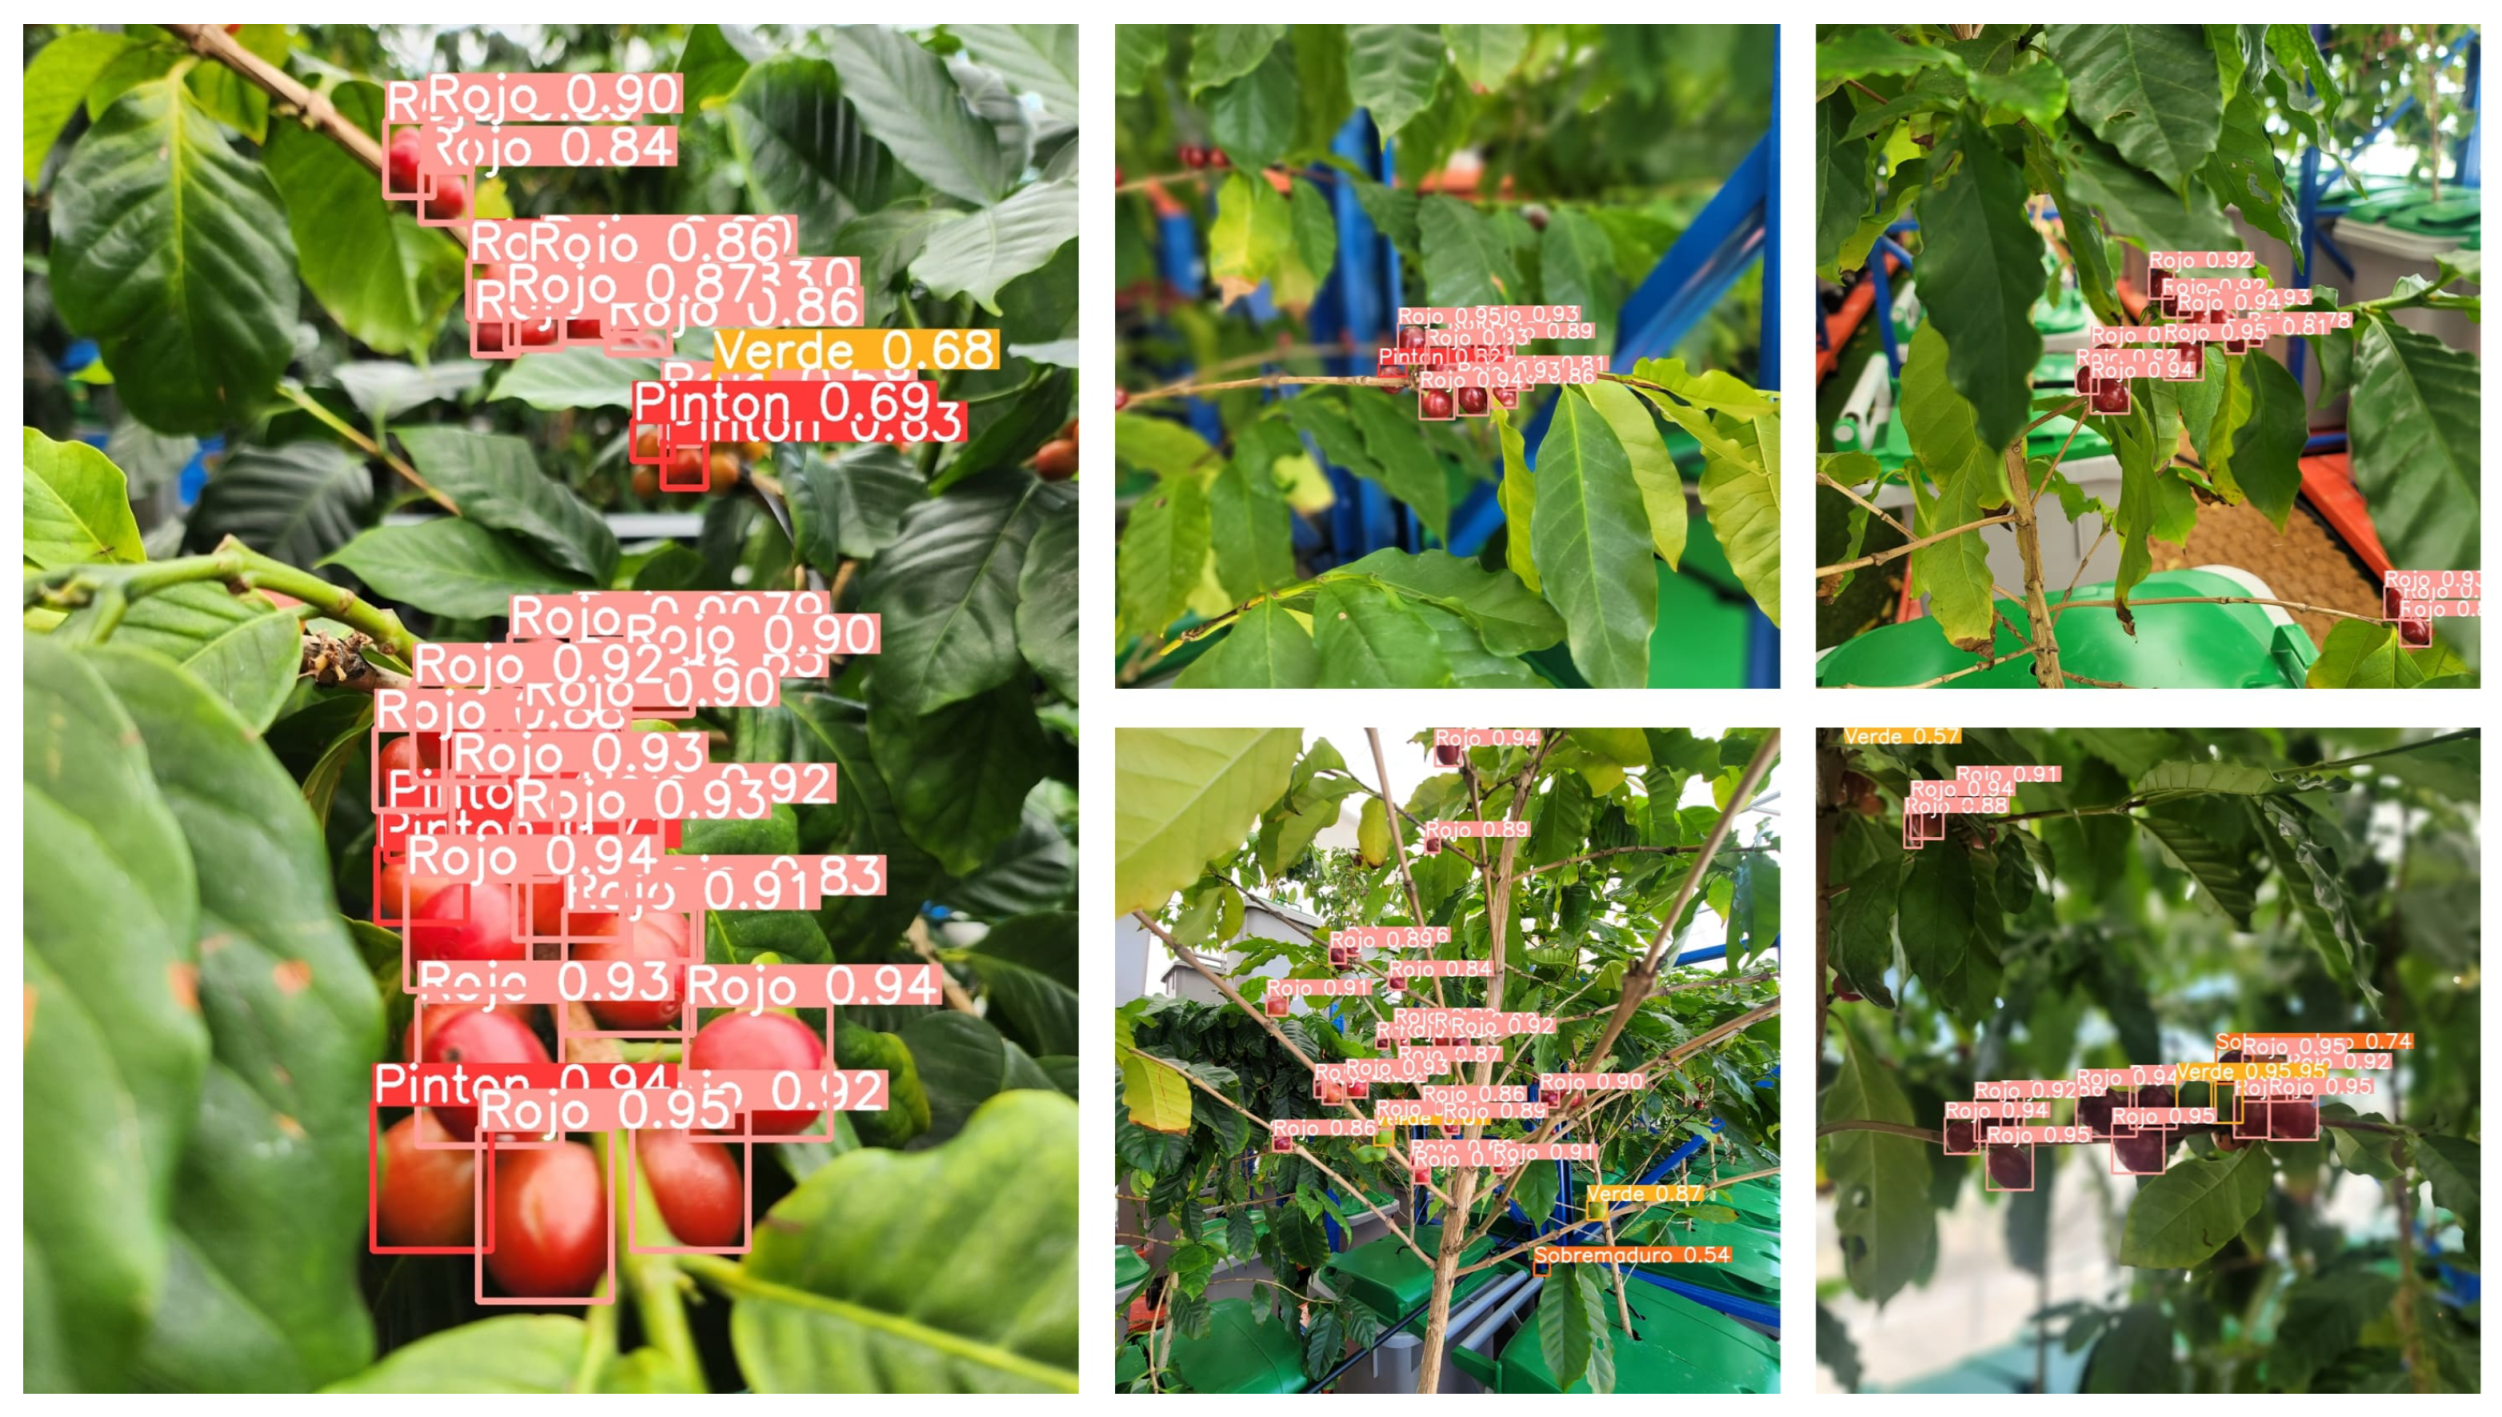
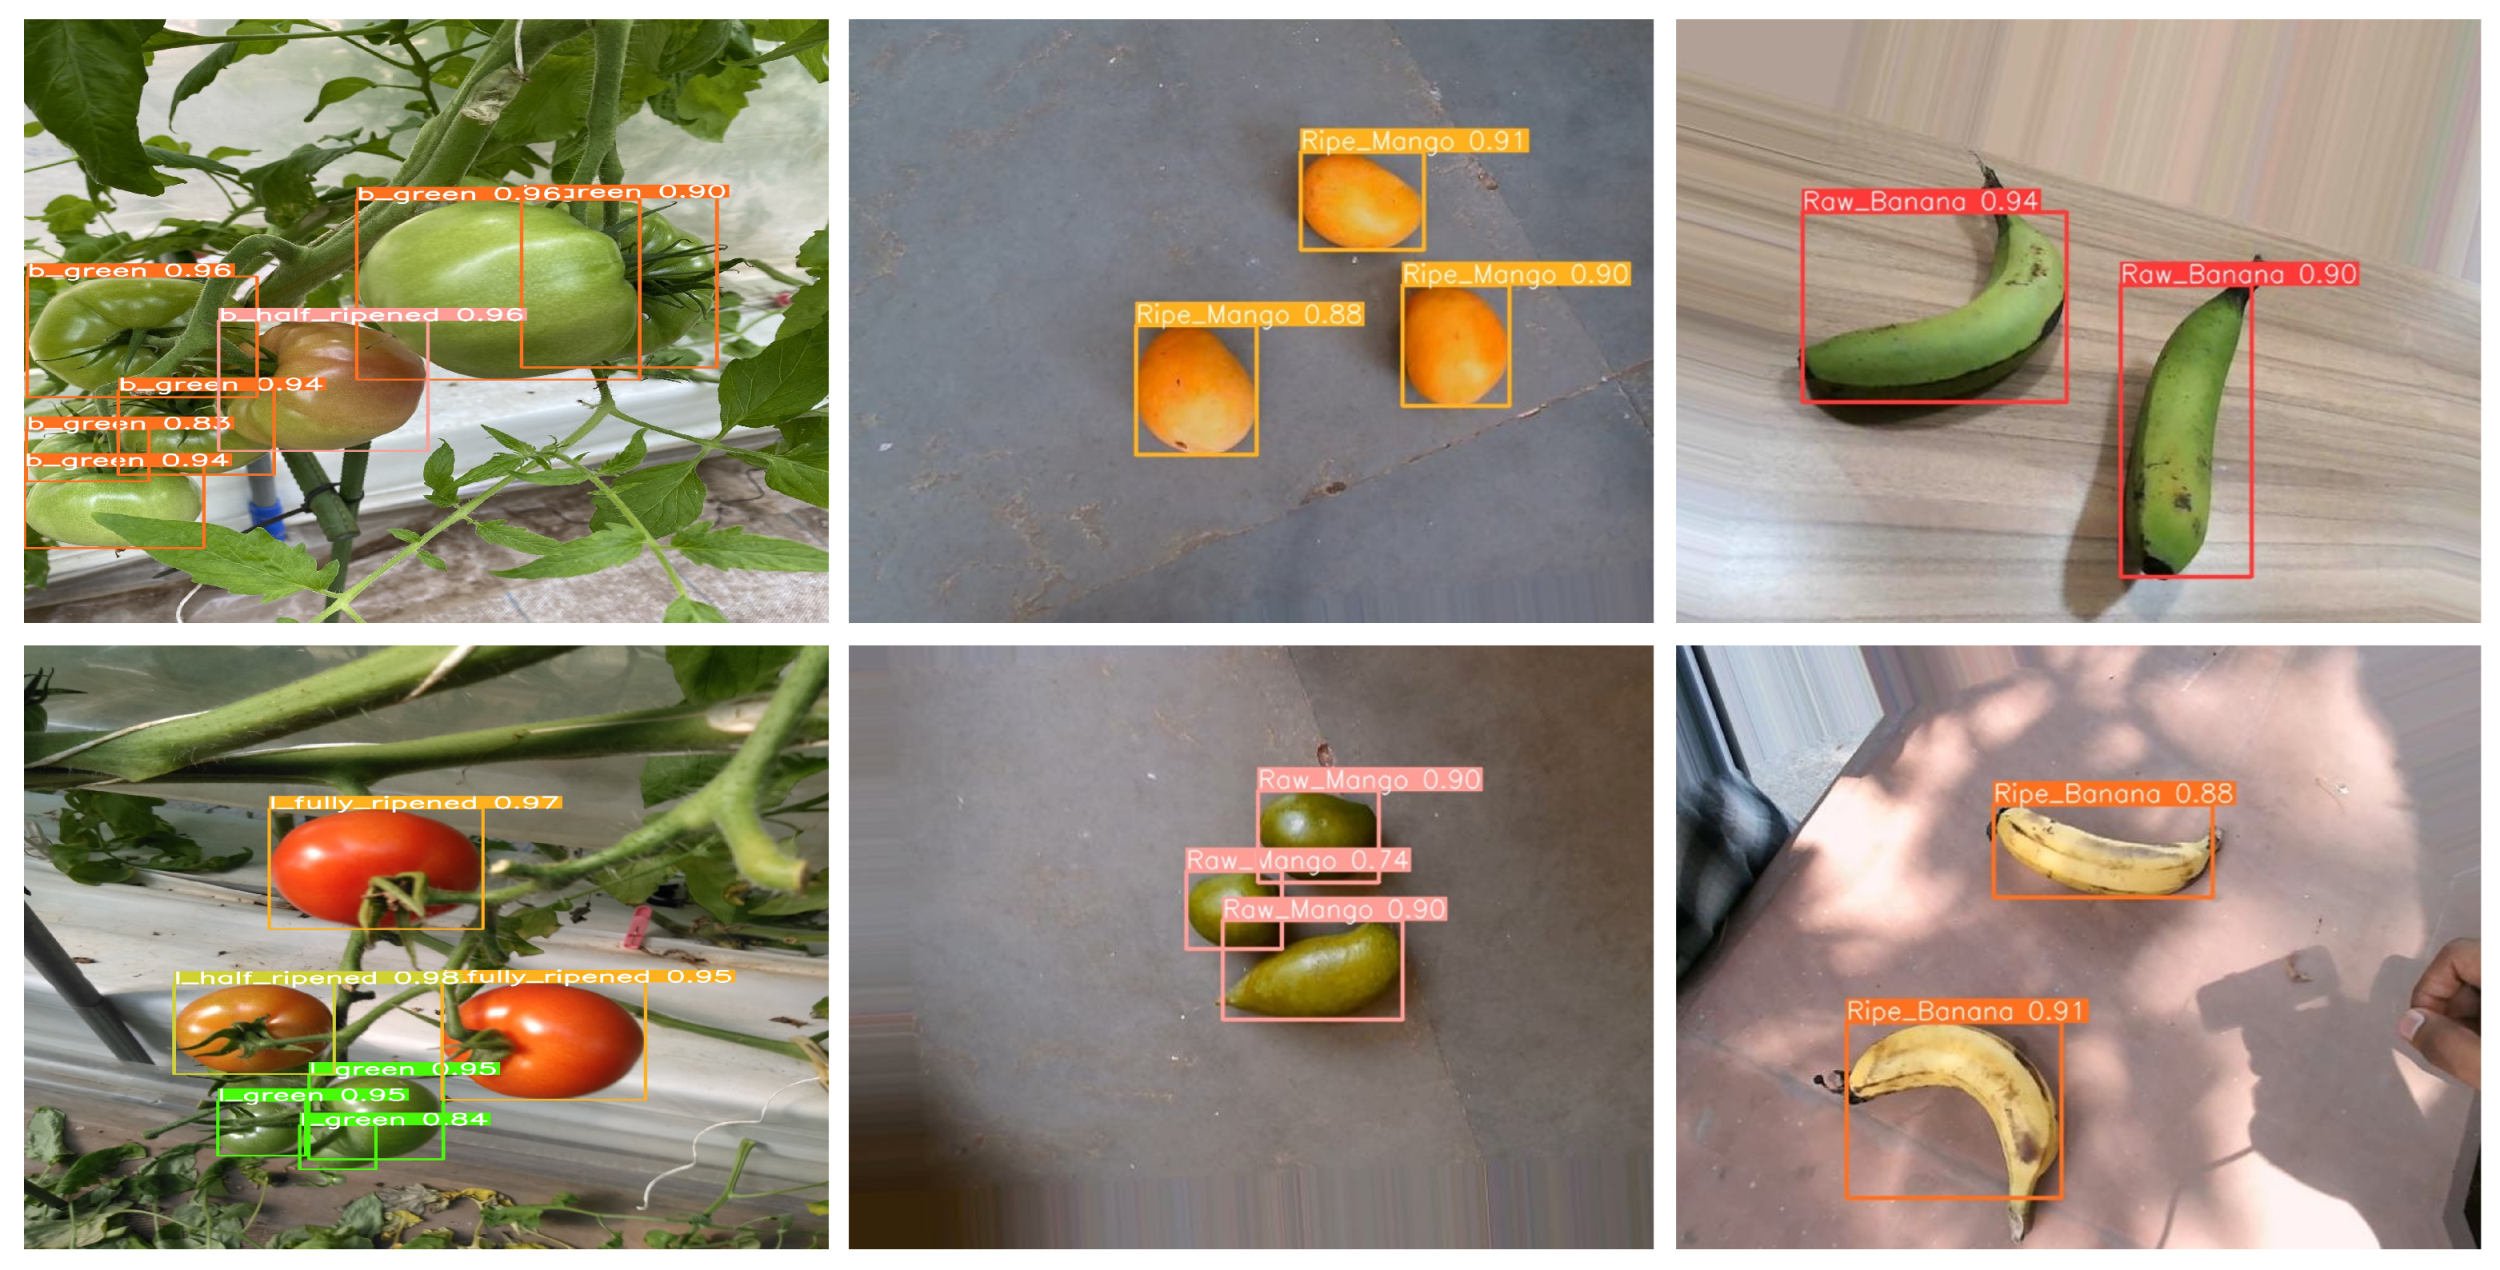
5.3. Results of CNN-Based Maturity Level Classification
6. Conclusions
Author Contributions
Funding
Institutional Review Board Statement
Informed Consent Statement
Data Availability Statement
Conflicts of Interest
References
- Othman, S.B.; Almalki, F.A.; Chakraborty, C.; Sakli, H. Privacy-preserving aware data aggregation for IoT-based healthcare with green computing technologies. Comput. Electr. Eng. 2022, 101, 108025. [Google Scholar] [CrossRef]
- Mahmood, A.; Ahmed, A.; Naeem, M.; Amirzada, M.R.; Al-Dweik, A. Weighted utility aware computational overhead minimization of wireless power mobile edge cloud. Comput. Commun. 2022, 190, 178–189. [Google Scholar] [CrossRef]
- Al Masarweh, M.; Alwada’n, T.; Afandi, W. Fog Computing, Cloud Computing and IoT Environment: Advanced Broker Management System. J. Sens. Actuator Netw. 2022, 11, 84. [Google Scholar] [CrossRef]
- Das, R.; Inuwa, M.M. A review on fog computing: Issues, characteristics, challenges, and potential applications. Telemat. Inform. Rep. 2023, 10, 100049. [Google Scholar] [CrossRef]
- Ometov, A.; Molua, O.; Komarov, M.; Nurmi, J. A Survey of Security in Cloud, Edge, and Fog Computing. Sensors 2022, 22, 927. [Google Scholar] [CrossRef]
- Choi, S.; Hong, S.; Kim, H.; Lee, S.; Kwon, S. Prefetching Method for Low-Latency Web AR in the WMN Edge Server. Appl. Sci. 2022, 13, 133. [Google Scholar] [CrossRef]
- Pierleoni, P.; Belli, A.; Palma, L.; Concetti, R.; Sabbatini, L.; Raggiunto, S. A complete architecture for Ambient Assisted Living scenarios using a cross protocol proxy. J. Ambient Intell. Humaniz. Comput. 2023, 15, 2757–2764. [Google Scholar] [CrossRef]
- Misirli, J.; Casalicchio, E. An Analysis of Methods and Metrics for Task Scheduling in Fog Computing. Future Internet 2023, 16, 16. [Google Scholar] [CrossRef]
- Kumar, V.; Laghari, A.A.; Karim, S.; Shakir, M.; Anwar Brohi, A. Comparison of Fog Computing & Cloud Computing. Int. J. Math. Sci. Comput. 2019, 5, 31–41. [Google Scholar] [CrossRef]
- V, S.; M, P.; P, M.K. Energy-Efficient Task Scheduling and Resource Allocation for Improving the Performance of a Cloud–Fog Environment. Symmetry 2022, 14, 2340. [Google Scholar] [CrossRef]
- La, Q.D.; Ngo, M.V.; Dinh, T.Q.; Quek, T.Q.S.; Shin, H. Enabling intelligence in fog computing to achieve energy and latency reduction. Digit. Commun. Netw. 2019, 5, 3–9. [Google Scholar] [CrossRef]
- Kraemer, F.A.; Braten, A.E.; Tamkittikhun, N.; Palma, D. Fog Computing in Healthcare–A Review and Discussion. IEEE Access 2017, 5, 9206–9222. [Google Scholar] [CrossRef]
- Bhatia, J.; Italiya, K.; Jadeja, K.; Kumhar, M.; Chauhan, U.; Tanwar, S.; Bhavsar, M.; Sharma, R.; Manea, D.L.; Verdes, M.; et al. An Overview of Fog Data Analytics for IoT Applications. Sensors 2022, 23, 199. [Google Scholar] [CrossRef] [PubMed]
- Bonomi, F.; Milito, R.; Zhu, J.; Addepalli, S. Fog computing and its role in the internet of things. In Proceedings of the First Edition of the MCC Workshop on Mobile Cloud Computing, Helsinki, Finland, 17 August 2012. [Google Scholar] [CrossRef]
- Shi, Q.; Zhang, Z.; Yang, Y.; Shan, X.; Salam, B.; Lee, C. Artificial Intelligence of Things (AIoT) Enabled Floor Monitoring System for Smart Home Applications. ACS Nano 2021, 15, 18312–18326. [Google Scholar] [CrossRef]
- Uy, N.Q.; Nam, V.H. A comparison of AMQP and MQTT protocols for Internet of Things. In Proceedings of the 2019 6th NAFOSTED Conference on Information and Computer Science (NICS), Hanoi, Vietnam, 12–13 December 2019. [Google Scholar] [CrossRef]
- Glaroudis, D.; Iossifides, A.; Chatzimisios, P. Survey, comparison and research challenges of IoT application protocols for smart farming. Comput. Netw. 2020, 168, 107037. [Google Scholar] [CrossRef]
- Sidna, J.; Amine, B.; Abdallah, N.; El Alami, H. Analysis and evaluation of communication Protocols for IoT Applications. In Proceedings of the 13th International Conference on Intelligent Systems: Theories and Applications, Rabat, Morocco, 23–24 September 2020. [Google Scholar] [CrossRef]
- Gemirter, C.B.; Senturca, C.; Baydere, S. A Comparative Evaluation of AMQP, MQTT and HTTP Protocols Using Real-Time Public Smart City Data. In Proceedings of the 2021 6th International Conference on Computer Science and Engineering (UBMK), Ankara, Turkey, 15–17 September 2021. [Google Scholar] [CrossRef]
- Dinculeană, D.; Cheng, X. Vulnerabilities and Limitations of MQTT Protocol Used between IoT Devices. Appl. Sci. 2019, 9, 848. [Google Scholar] [CrossRef]
- Hunkeler, U.; Truong, H.L.; Stanford-Clark, A. MQTT-S—A publish/subscribe protocol for Wireless Sensor Networks. In Proceedings of the 2008 3rd International Conference on Communication Systems Software and Middleware and Workshops (COMSWARE ’08), Bangalore, India, 6–10 January 2008. [Google Scholar] [CrossRef]
- Moraes, T.; Nogueira, B.; Lira, V.; Tavares, E. Performance Comparison of IoT Communication Protocols. In Proceedings of the 2019 IEEE International Conference on Systems, Man and Cybernetics (SMC), Bari, Italy, 6–9 October 2019. [Google Scholar] [CrossRef]
- Al-Fuqaha, A.; Guizani, M.; Mohammadi, M.; Aledhari, M.; Ayyash, M. Internet of Things: A Survey on Enabling Technologies, Protocols, and Applications. IEEE Commun. Surv. Tutor. 2015, 17, 2347–2376. [Google Scholar] [CrossRef]
- Liu, Y.; Liu, L.; Chen, W.-P. Intelligent traffic light control using distributed multi-agent Q learning. In Proceedings of the 2017 IEEE 20th International Conference on Intelligent Transportation Systems (ITSC), Yokohama, Japan, 16–19 October 2017. [Google Scholar] [CrossRef]
- Pise, A.; Yoon, B.; Singh, S. Enabling Ambient Intelligence of Things (AIoT) healthcare system architectures. Comput. Commun. 2023, 198, 186–194. [Google Scholar] [CrossRef]
- Lu, Z.; Qian, P.; Bi, D.; Ye, Z.; He, X.; Zhao, Y.; Su, L.; Li, S.; Zhu, Z. Application of AI and IoT in Clinical Medicine: Summary and Challenges. Curr. Med. Sci. 2021, 41, 1134–1150. [Google Scholar] [CrossRef]
- HTTPHypertext Transfer Protocol. Available online: https://www.w3.org/Protocols/ (accessed on 14 September 2024).
- Alamer, A. Security and privacy-awareness in a software-defined fog computing network for the Internet of Things. Opt. Switch. Netw. 2021, 41, 100616. [Google Scholar] [CrossRef]
- Alvi, A.N.; Javed, M.A.; Hasanat, M.H.A.; Khan, M.B.; Saudagar, A.K.J.; Alkhathami, M.; Farooq, U. Intelligent Task Offloading in Fog Computing Based Vehicular Networks. Appl. Sci. 2022, 12, 4521. [Google Scholar] [CrossRef]
- Zhang, C. Design and application of fog computing and Internet of Things service platform for smart city. Future Gener. Comput. Syst. 2020, 112, 630–640. [Google Scholar] [CrossRef]
- Sepasgozar, S.; Karimi, R.; Farahzadi, L.; Moezzi, F.; Shirowzhan, S.; Ebrahimzadeh, S.M.; Hui, F.; Aye, L. A Systematic Content Review of Artificial Intelligence and the Internet of Things Applications in Smart Home. Appl. Sci. 2020, 10, 3074. [Google Scholar] [CrossRef]
- Sun, Z.; Zhu, M.; Zhang, Z.; Chen, Z.; Shi, Q.; Shan, X.; Yeow, R.C.H.; Lee, C. Artificial Intelligence of Things (AIoT) Enabled Virtual Shop Applications Using Self-Powered Sensor Enhanced Soft Robotic Manipulator. Adv. Sci. 2021, 8, 2100230. [Google Scholar] [CrossRef]
- Pise, A.A.; Almuzaini, K.K.; Ahanger, T.A.; Farouk, A.; Pant, K.; Pareek, P.K.; Nuagah, S.J. Enabling Artificial Intelligence of Things (AIoT) Healthcare Architectures and Listing Security Issues. Comput. Intell. Neurosci. 2022, 2022, 8421434. [Google Scholar] [CrossRef]
- Yang, G.; Wang, J.; Nie, Z.; Yang, H.; Yu, S. A Lightweight YOLOv8 Tomato Detection Algorithm Combining Feature Enhancement and Attention. Agronomy 2023, 13, 1824. [Google Scholar] [CrossRef]
- Vasconez, J.P.; Delpiano, J.; Vougioukas, S.; Auat Cheein, F. Comparison of convolutional neural networks in fruit detection and counting: A comprehensive evaluation. Comput. Electron. Agric. 2020, 173, 105348. [Google Scholar] [CrossRef]
- Adhitya, Y.; Prakosa, S.W.; Köppen, M.; Leu, J.-S. Feature Extraction for Cocoa Bean Digital Image Classification Prediction for Smart Farming Application. Agronomy 2020, 10, 1642. [Google Scholar] [CrossRef]
- IEEE Std 802.11s-2011; IEEE Standard for Information Technology—Telecommunications and Information Exchange between Systems—Local and Metropolitan Area Networks—Specific Requirements Part 11: Wireless LAN Medium Access Control (MAC) and Physical Layer (PHY) Specifications Amendment 10: Mesh Networking. IEEE: Piscataway, NJ, USA, 2011; pp. 1–372. [CrossRef]
- IEEE Std 802.11r-2008; IEEE Standard for Information Technology—Local and Metropolitan Area Networks—Specific Requirements—Part 11: Wireless LAN Medium Access Control (MAC) and Physical Layer (PHY) Specifications Amendment 2: Fast Basic Service Set (BSS) Transition. IEEE: Piscataway, NJ, USA, 2008; pp. 1–126. [CrossRef]
- IEEE Std 802.11ac-2013; IEEE Standard for Information Technology—Telecommunications and Information Exchange between Systems—Local and Metropolitan Area Networks—Specific Requirements—Part 11: Wireless LAN Medium Access Control (MAC) and Physical Layer (PHY) Specifications—Amendment 4: Enhancements for Very High Throughput for Operation in Bands below 6 GHz. IEEE: Piscataway, NJ, USA, 2013; pp. 1–425. [CrossRef]
- Coffee Fruit Dataset. Available online: https://universe.roboflow.com/seongchan-park/coffee-fruit (accessed on 14 October 2024).
- NexusWho. Laboro Tomato Dataset. Kaggle. 2021. Available online: https://www.kaggle.com/datasets/nexuswho/laboro-tomato/data (accessed on 14 September 2024).
- Sutar, A.; Naikare, A.; Jadhav, P.; Kute, R. Mango and Banana Dataset. Mendeley Data, V3. 2023. Available online: https://data.mendeley.com/datasets/y3649cmgg6/3 (accessed on 14 September 2024).

| Field Name | Data Format | Key | Not Null |
|---|---|---|---|
| ID | Integer | P.K | O |
| Sensor Group | Text | - | O |
| Sensor Name | Text | - | O |
| Sensor Data | Text | - | O |
| Data Time | Text | - | X |
| Specification | Detail |
|---|---|
| Microcontroller | ESP-8266EX |
| Operating Voltage | 3.3 V |
| Digital I/O Pins | 11 |
| Analog Input Pins | 1 (Max input: 3.2 V) |
| Clock Speed | 80 MHz/160 MHz |
| Flash | 4 M bytes |
| Specification | Detail |
|---|---|
| Sensor Model | IMX219 |
| Resolution | 8 MP |
| Active Pixels | 3280 × 2464 |
| Frame Rate (video mode) | 1080p47, 1640 × 1232p41, 640 × 480p206 |
| Data Format | Raw Bayer 10 bit |
| Specification | PH Sensor | EC Sensor | Illuminance | Sensor |
|---|---|---|---|---|
| Sensor Model | SEN0161 | DJS-1 | HS-CDSM-ll | MH-Z19B |
| Operating Voltage | 5.0 V | 5.0 V | 3.3–5 V | 4.5–5 V |
| Measuring Range | pH 0–14 | 1–15 mS/cm | - | 0–2000 ppm |
| Measuring Temperature | 0–60 °C | 0–40 °C | - | −10~50 °C |
| Driving Ability | - | - | Over 15 mA | - |
| Output Type/Signal | AO | AO | DO (0 and 1), AO | UART, PWM, DAC |
| Specification | Fog Node Server (VEEA VHE10) | Cloud Server (AWS EC2) |
|---|---|---|
| Type | - | t2.micro |
| CPU | ARMv8 quad-core processor, 1.5 GHz | vCPUs, 2.5 GHz |
| RAM | 8 GB DRAM | 1 GB |
| Wi-Fi | Tri-band Wi-Fi5 | - |
| Network | 1 Gbps | 10 Gbps |
| OS | Ubuntu 20.04 | Ubuntu 20.04 |
| DB | SQLite 3.31.1 | SQLite 3.31.1 |
| Web Server | Apache 2.4.41 | Apache 2.4.41 |
| Web Framework | php 7.4.3 | php 7.4.3 |
| Specification | Detail |
|---|---|
| Type | c5d.large |
| CPU | vCPUs, 2 GHz |
| RAM | 4 GB |
| Network | 10 Gbps |
| OS | Deep learning AMI GPU Pytorch 2.0.1 (Ubuntu 20.04) |
| Python | 3.8.18 |
| Opencv-python | 4.8.0 |
| Numpy | 1.24.3 |
| Psutil | 5.9.5 |
| Pillow | 10.0.1 |
| Scipy | 1.10.1 |
| Jinja2 | 3.1.2 |
| Keras | 2.13.1 |
| Torch | 2.0.1 |
| Tensorflow | 2.13.0 |
| Ultralytics | 8.0.183 |
| Specification | Detail |
|---|---|
| Model | YOLOv8l |
| Parameters (M) | 43.7 |
| FLOPS (B) | 165.2 |
| Epochs | 200 |
| Batch | 32 |
| Img_size | 640, 640 |
| Optimizer | Adam |
| Learning_rate | 0.001 |
| Momentum | 0.937 |
| Protocol | Number of Sensors | 1 | 2 | 3 | 4 | 5 | 6 | 7 | 8 | 9 | 10 |
|---|---|---|---|---|---|---|---|---|---|---|---|
| CoAP | 10 50 100 | 704 2992 6248 | 880 2904 6600 | 880 3608 7128 | 880 3168 6512 | 792 3080 7040 | 792 2992 6512 | 880 3608 5808 | 880 2728 8096 | 704 3344 7040 | 880 3872 6600 |
| MQTT | 10 50 100 | 870 4006 7658 | 760 3262 5662 | 870 3608 11,602 | 924 3642 11,602 | 760 3716 7822 | 924 3262 13,588 | 870 3910 7820 | 706 3856 7822 | 1218 3856 7464 | 514 3230 7768 |
| HTTP | 10 50 100 | 3870 16,343 42,156 | 3924 19,711 45,611 | 3978 21,024 43,794 | 3924 20,538 42,807 | 3924 20,646 41,779 | 4140 21,078 42,213 | 4086 20,376 41,294 | 4140 20,376 39,834 | 4032 20,484 39,186 | 4140 20,862 41,294 |
| Protocol | Number of Sensors | 1 | 2 | 3 | 4 | 5 | 6 | 7 | 8 | 9 | 10 |
|---|---|---|---|---|---|---|---|---|---|---|---|
| CoAP | 10 50 100 | 60 32 30 | 10 34 25 | 0 18 20 | 0 28 27 | 10 30 20 | 20 36 26 | 0 26 34 | 0 40 8 | 20 26 20 | 0 12 15 |
| MQTT | 10 50 100 | 0 0 0 | 0 0 0 | 0 0 0 | 0 0 0 | 0 0 0 | 0 0 0 | 0 0 0 | 0 0 0 | 0 0 0 | 0 0 0 |
| HTTP | 10 50 100 | 0 0 0 | 0 0 0 | 0 0 0 | 0 0 0 | 0 0 2 | 0 0 1 | 0 0 0 | 0 0 0 | 0 0 0 | 0 0 0 |
| Class | Precision | Recall | F1 Score | mAP50 | mAP50-95 |
|---|---|---|---|---|---|
| Coffee | 0.952 | 0.858 | 0.902 | 0.910 | 0.832 |
| Tomato | 0.849 | 0.803 | 0.825 | 0.876 | 0.781 |
| Banana and Mango | 0.964 | 0.961 | 0.962 | 0.993 | 0.865 |
Disclaimer/Publisher’s Note: The statements, opinions and data contained in all publications are solely those of the individual author(s) and contributor(s) and not of MDPI and/or the editor(s). MDPI and/or the editor(s) disclaim responsibility for any injury to people or property resulting from any ideas, methods, instructions or products referred to in the content. |
© 2024 by the authors. Licensee MDPI, Basel, Switzerland. This article is an open access article distributed under the terms and conditions of the Creative Commons Attribution (CC BY) license (https://creativecommons.org/licenses/by/4.0/).
Share and Cite
Hong, S.; Park, S.; Youn, H.; Lee, J.; Kwon, S. Implementation of Smart Farm Systems Based on Fog Computing in Artificial Intelligence of Things Environments. Sensors 2024, 24, 6689. https://doi.org/10.3390/s24206689
Hong S, Park S, Youn H, Lee J, Kwon S. Implementation of Smart Farm Systems Based on Fog Computing in Artificial Intelligence of Things Environments. Sensors. 2024; 24(20):6689. https://doi.org/10.3390/s24206689
Chicago/Turabian StyleHong, Sukjun, Seongchan Park, Heejun Youn, Jongyong Lee, and Soonchul Kwon. 2024. "Implementation of Smart Farm Systems Based on Fog Computing in Artificial Intelligence of Things Environments" Sensors 24, no. 20: 6689. https://doi.org/10.3390/s24206689
APA StyleHong, S., Park, S., Youn, H., Lee, J., & Kwon, S. (2024). Implementation of Smart Farm Systems Based on Fog Computing in Artificial Intelligence of Things Environments. Sensors, 24(20), 6689. https://doi.org/10.3390/s24206689