
Deriving Accurate Nocturnal Heart Rate, rMSSD and Frequency HRV from the Oura Ring


Abstract
:1. Introduction
2. Materials and Methods
2.1. Participants and Protocol
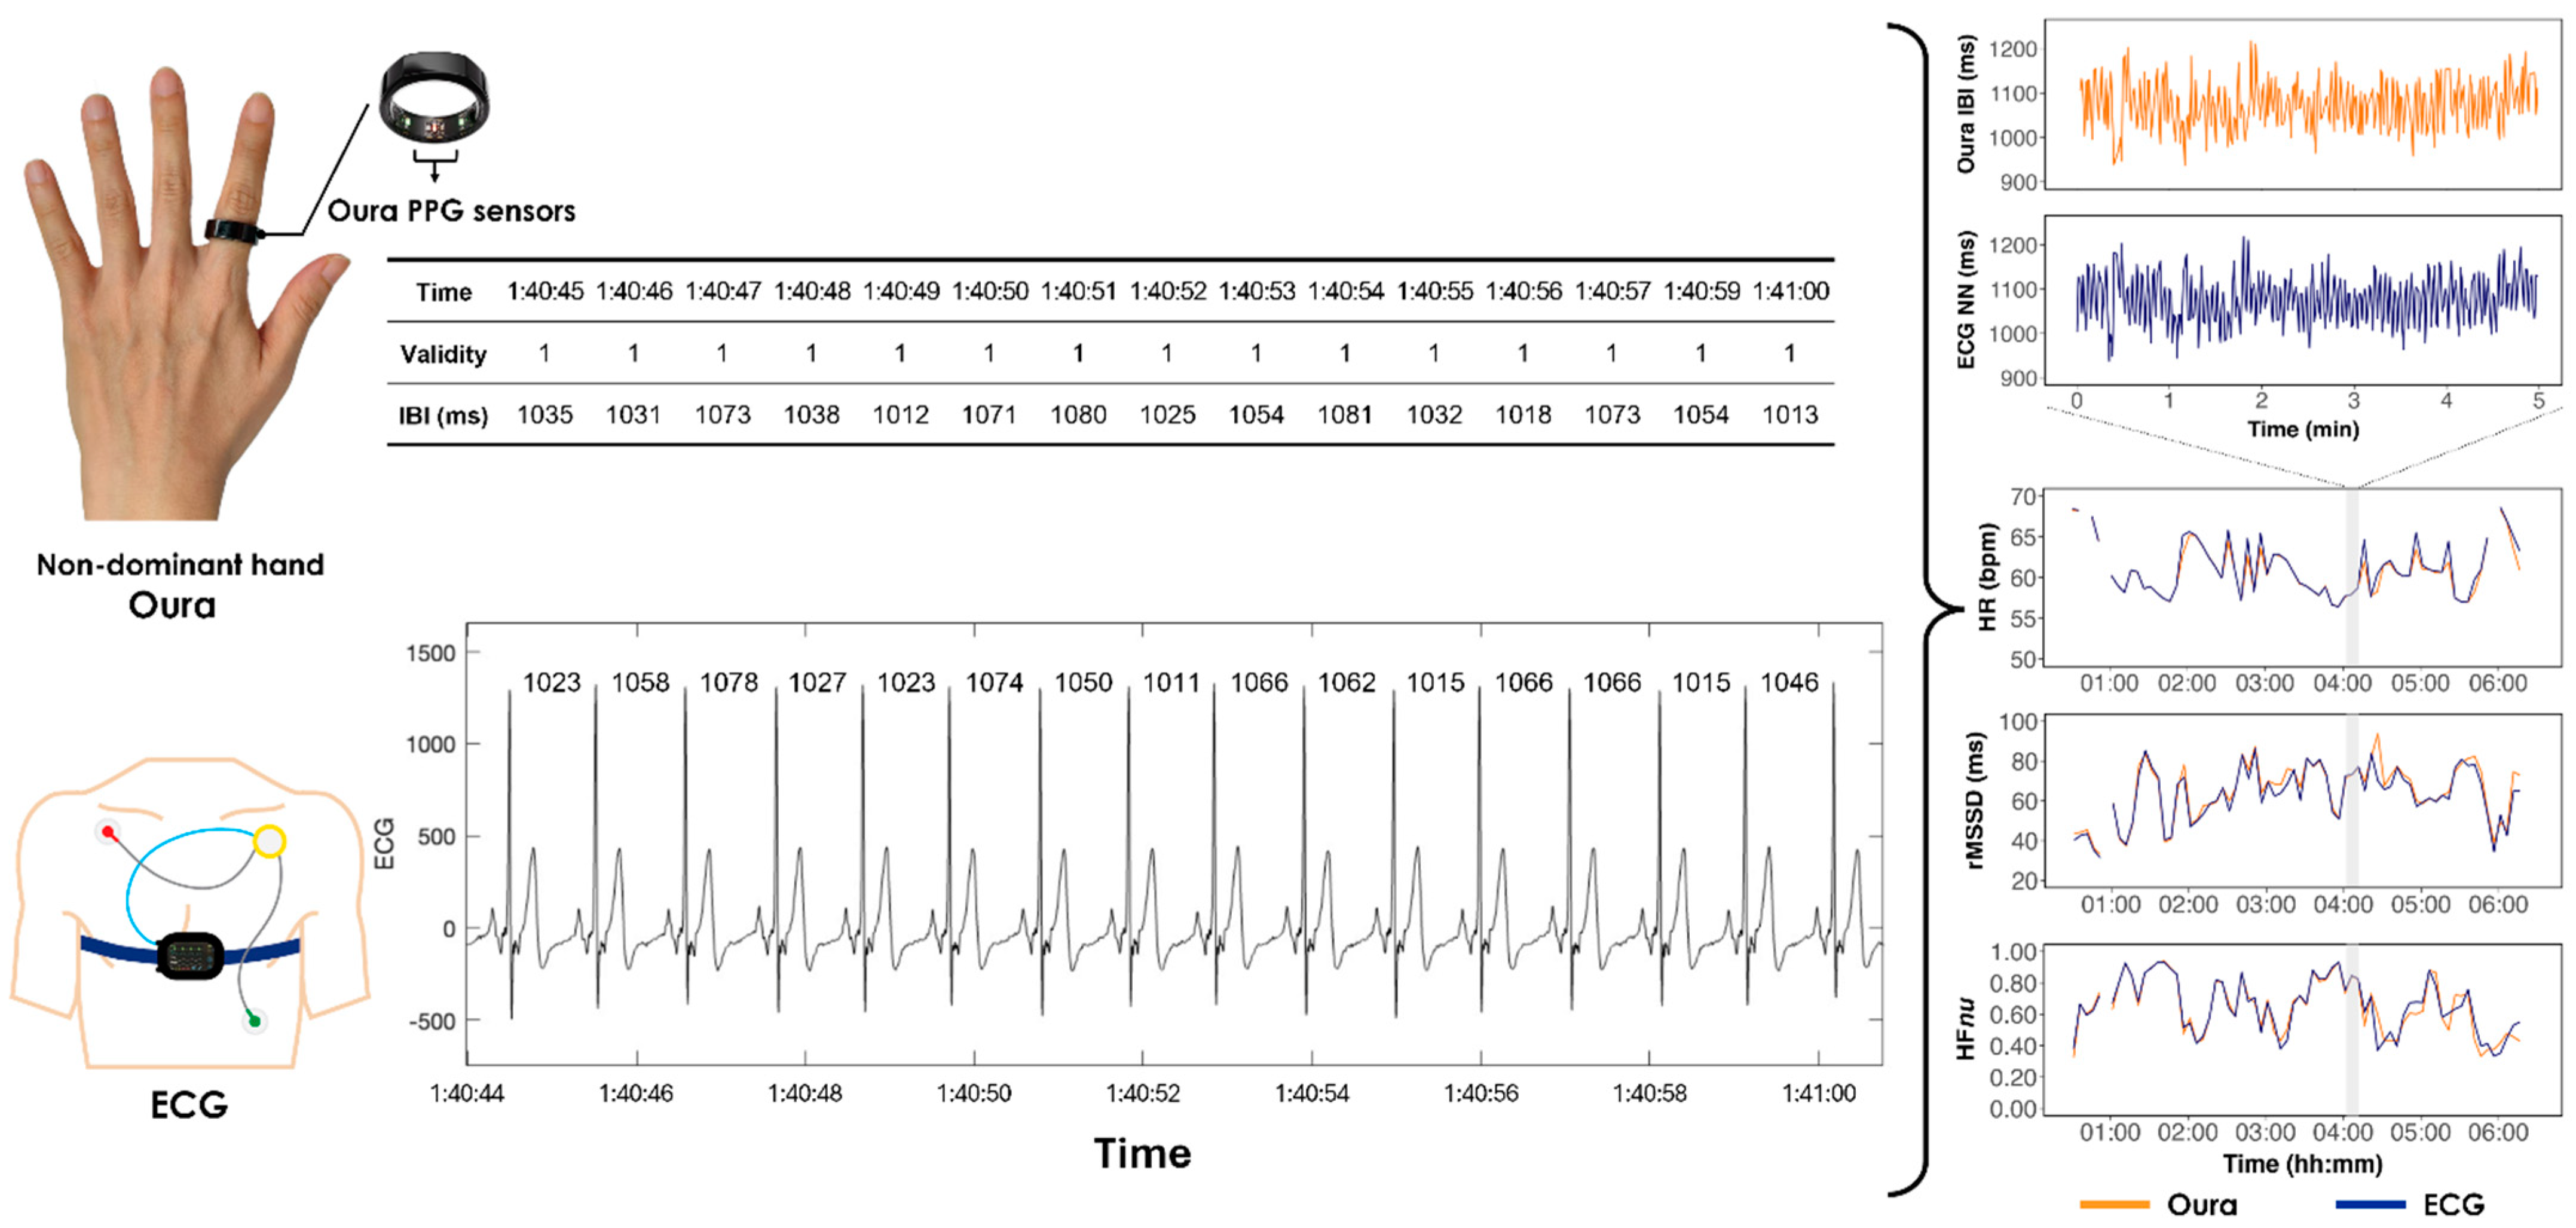
2.2. Devices
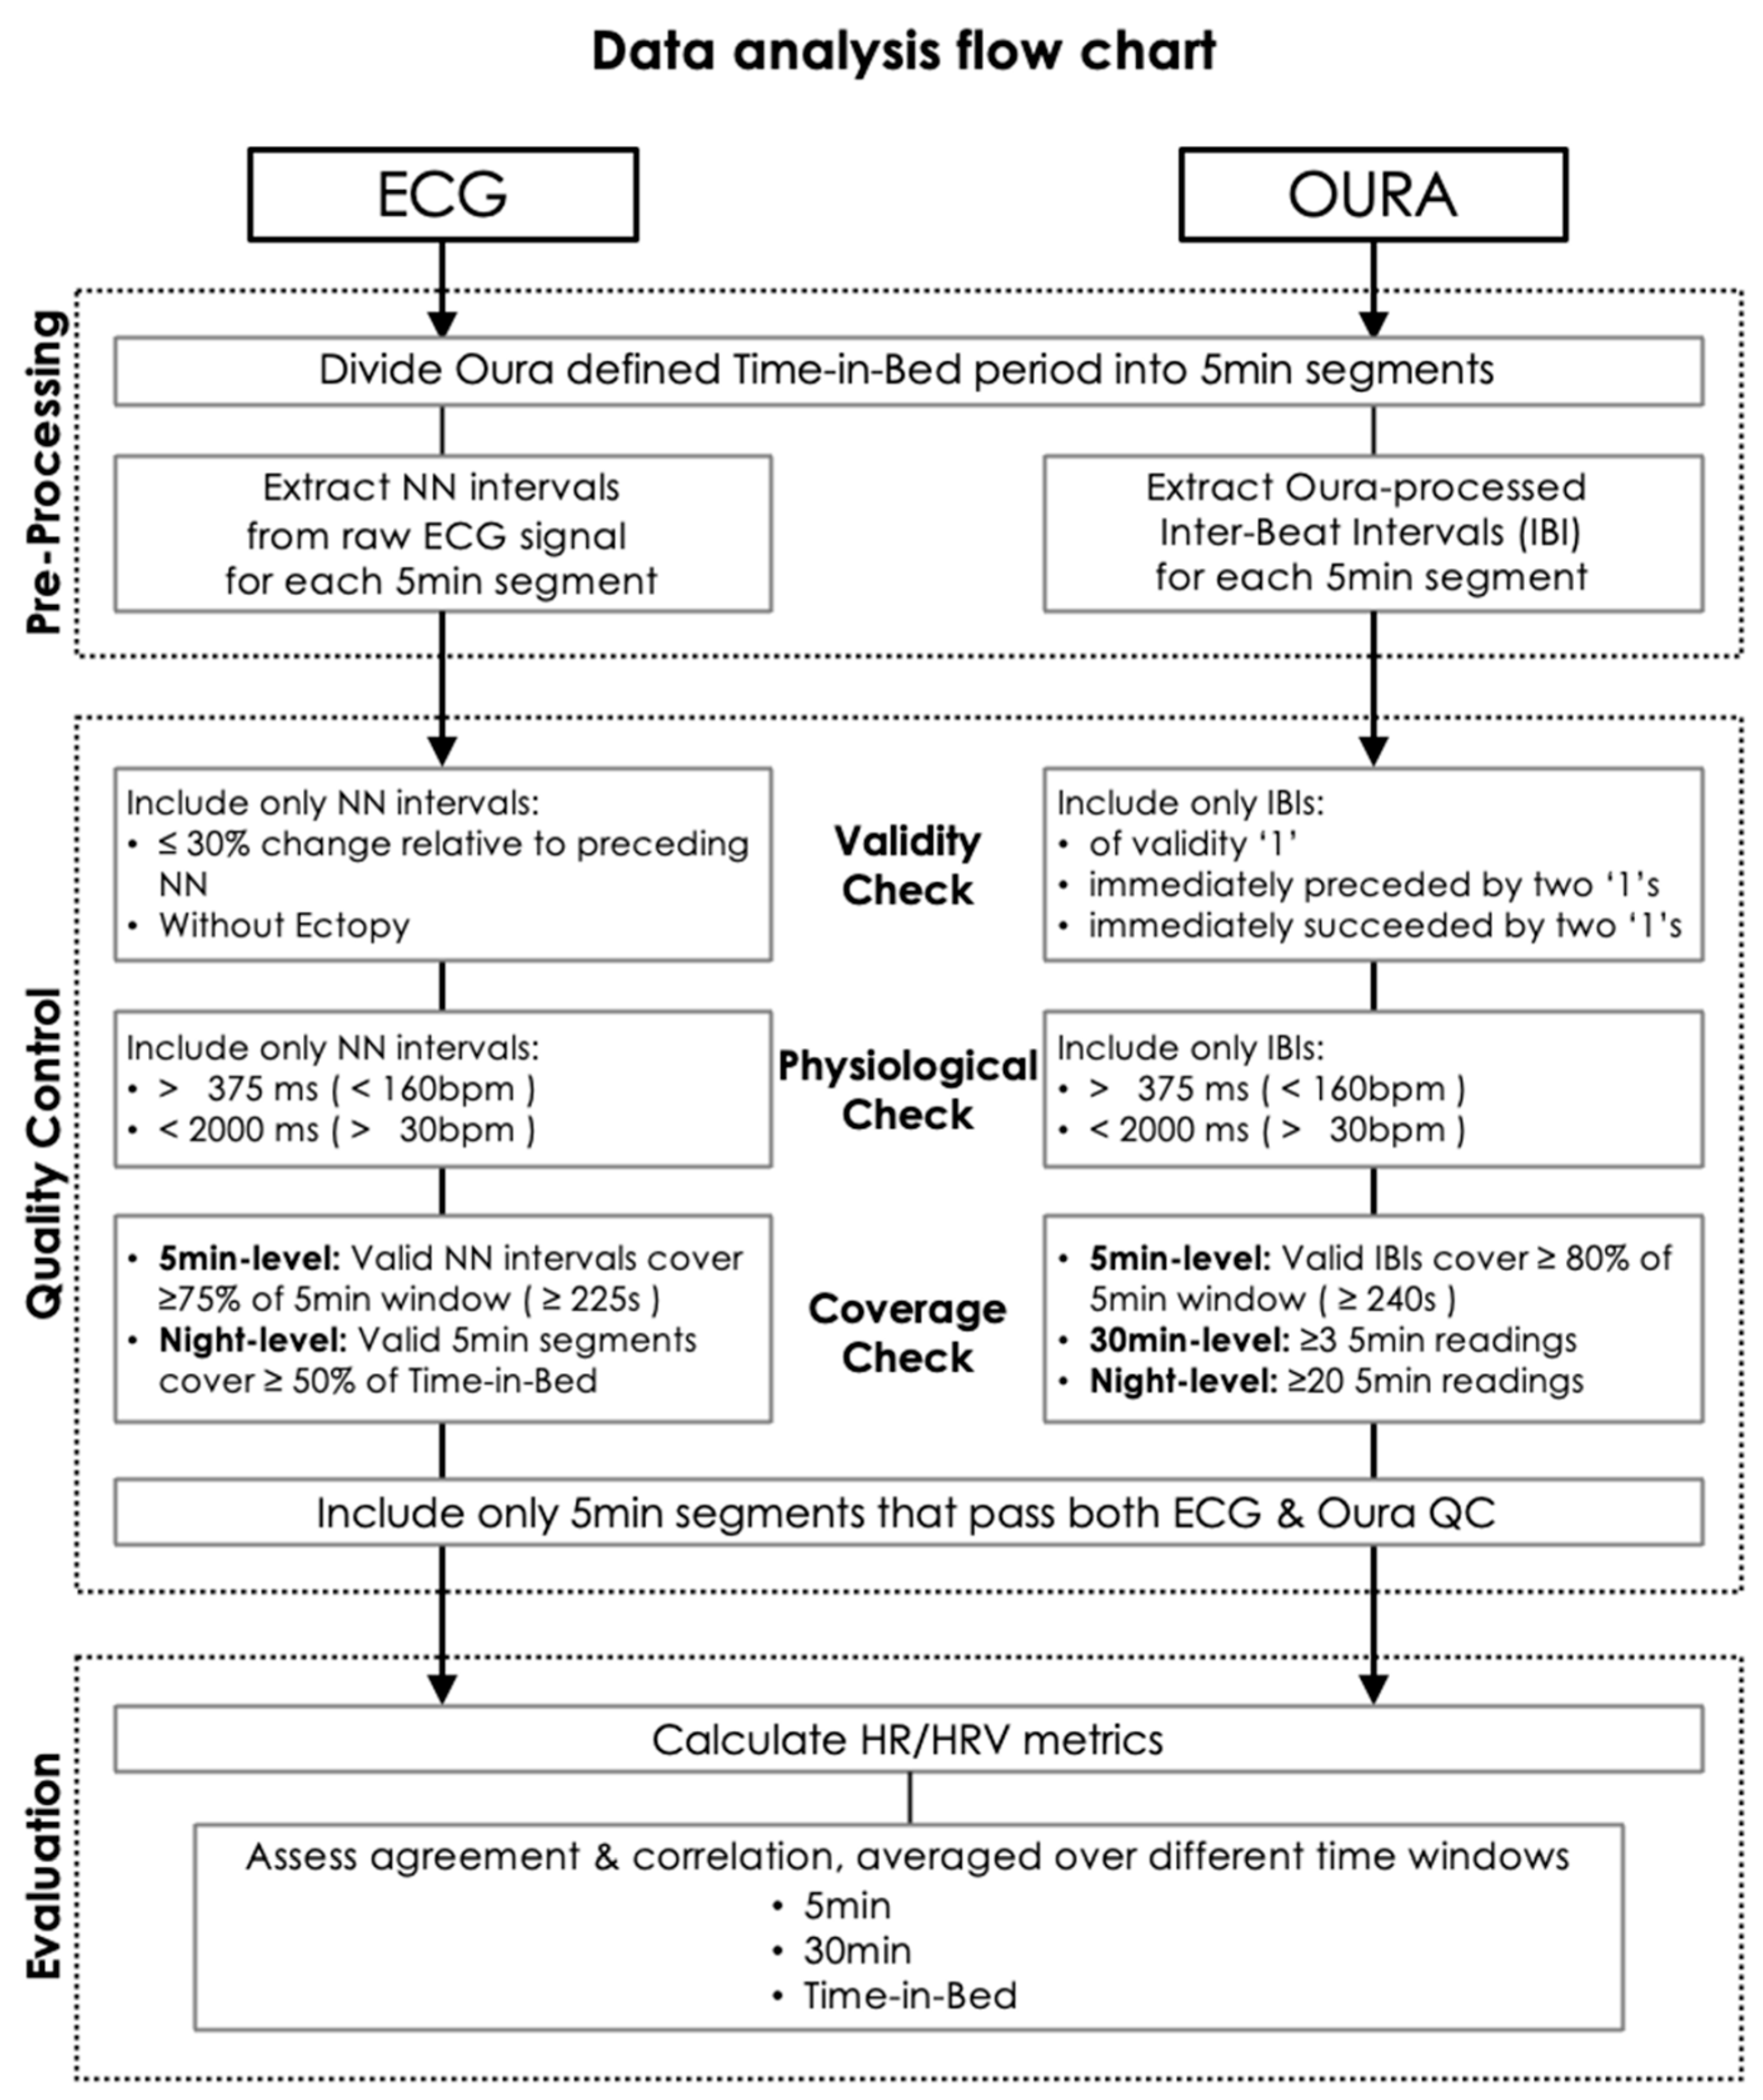
2.3. Data Analysis
2.3.1. Oura IBI
2.3.2. ECG NN
2.4. HR and HRV Metrics
2.5. Statistical Analyses
2.6. Data Retention Rates at Different Validity Proportion Thresholds
3. Results
3.1. Performance Evaluation
3.2. Lower Data Retention with Higher Validity Proportion Threshold
4. Discussion
4.1. High Correlation in HR/HRV Between Oura and ECG
4.2. Less Accurate 5 Min HRV Measures for Older Participants
4.3. Aggregate Oura HRV Measures over Longer Durations to Improve Accuracy
4.4. Data Rejection Costs of Further Increasing Validity Proportion Threshold
4.5. Limitations
5. Conclusions
Supplementary Materials
Author Contributions
Funding
Institutional Review Board Statement
Informed Consent Statement
Data Availability Statement
Acknowledgments
Conflicts of Interest
References
- Vaduganathan, M.; Mensah, G.A.; Turco, J.V.; Fuster, V.; Roth, G.A. The Global Burden of Cardiovascular Diseases and Risk. J. Am. Coll. Cardiol. 2022, 80, 2361–2371. [Google Scholar] [CrossRef] [PubMed]
- Johansen, C.D.; Olsen, R.H.; Pedersen, L.R.; Kumarathurai, P.; Mouridsen, M.R.; Binici, Z.; Intzilakis, T.; Køber, L.; Sajadieh, A. Resting, Night-Time, and 24 h Heart Rate as Markers of Cardiovascular Risk in Middle-Aged and Elderly Men and Women with No Apparent Heart Disease. Eur. Heart J. 2013, 34, 1732–1739. [Google Scholar] [CrossRef] [PubMed]
- Stauss, H.M. Heart Rate Variability. Am. J. Physiol.-Regul. Integr. Comp. Physiol. 2003, 285, R927–R931. [Google Scholar] [CrossRef] [PubMed]
- Nevels, T.L.; Wirth, M.D.; Ginsberg, J.P.; McLain, A.C.; Burch, J.B. The Role of Sleep and Heart Rate Variability in Metabolic Syndrome: Evidence from the Midlife in the United States Study. Sleep 2023, 46, zsad013. [Google Scholar] [CrossRef] [PubMed]
- Zhang, L.; Wu, H.; Zhang, X.; Wei, X.; Hou, F.; Ma, Y. Sleep Heart Rate Variability Assists the Automatic Prediction of Long-Term Cardiovascular Outcomes. Sleep Med. 2020, 67, 217–224. [Google Scholar] [CrossRef] [PubMed]
- Ghamari, M. A Review on Wearable Photoplethysmography Sensors and Their Potential Future Applications in Health Care. Int. J. Biosens. Bioelectron. 2018, 4, 195. [Google Scholar] [CrossRef]
- Lin, W.-H.; Wu, D.; Li, C.; Zhang, H.; Zhang, Y.-T. Comparison of Heart Rate Variability from PPG with That from ECG. In The International Conference on Health Informatics; Zhang, Y.-T., Ed.; Springer International Publishing: Cham, Switzerland, 2014; Volume 42, pp. 213–215. ISBN 978-3-319-03004-3. [Google Scholar]
- Ryals, S.; Chiang, A.; Schutte-Rodin, S.; Chandrakantan, A.; Verma, N.; Holfinger, S.; Abbasi-Feinberg, F.; Bandyopadhyay, A.; Baron, K.; Bhargava, S.; et al. Photoplethysmography—New Applications for an Old Technology: A Sleep Technology Review. J. Clin. Sleep Med. 2023, 19, 189–195. [Google Scholar] [CrossRef]
- Sviridova, N.; Sakai, K. Human Photoplethysmogram: New Insight into Chaotic Characteristics. Chaos Solitons Fractals 2015, 77, 53–63. [Google Scholar] [CrossRef]
- Kinnunen, H.; Rantanen, A.; Kenttä, T.; Koskimäki, H. Feasible Assessment of Recovery and Cardiovascular Health: Accuracy of Nocturnal HR and HRV Assessed via Ring PPG in Comparison to Medical Grade ECG. Physiol. Meas. 2020, 41, 04NT01. [Google Scholar] [CrossRef]
- Nelson, B.W.; Low, C.A.; Jacobson, N.; Arean, P.; Torous, J.; Allen, N.B. Guidelines for Wrist-Worn Consumer Wearable Assessment of Heart Rate in Biobehavioral Research. npj Digit. Med. 2020, 3, 90. [Google Scholar] [CrossRef]
- Theurl, F.; Schreinlechner, M.; Sappler, N.; Toifl, M.; Dolejsi, T.; Hofer, F.; Massmann, C.; Steinbring, C.; Komarek, S.; Mölgg, K.; et al. Smartwatch-Derived Heart Rate Variability: A Head-to-Head Comparison with the Gold Standard in Cardiovascular Disease. Eur. Heart J.-Digit. Health 2023, 4, 155–164. [Google Scholar] [CrossRef] [PubMed]
- Cao, R.; Azimi, I.; Sarhaddi, F.; Niela-Vilen, H.; Axelin, A.; Liljeberg, P.; Rahmani, A.M. Accuracy Assessment of Oura Ring Nocturnal Heart Rate and Heart Rate Variability in Comparison With Electrocardiography in Time and Frequency Domains: Comprehensive Analysis. J. Med. Internet Res. 2022, 24, e27487. [Google Scholar] [CrossRef] [PubMed]
- Miller, D.J.; Sargent, C.; Roach, G.D. A Validation of Six Wearable Devices for Estimating Sleep, Heart Rate and Heart Rate Variability in Healthy Adults. Sensor 2022, 22, 6317. [Google Scholar] [CrossRef]
- Stone, J.D.; Ulman, H.K.; Tran, K.; Thompson, A.G.; Halter, M.D.; Ramadan, J.H.; Stephenson, M.; Finomore, V.S.; Galster, S.M.; Rezai, A.R.; et al. Assessing the Accuracy of Popular Commercial Technologies That Measure Resting Heart Rate and Heart Rate Variability. Front. Sports Act. Living 2021, 3, 585870. [Google Scholar] [CrossRef] [PubMed]
- Li, K.; Cardoso, C.; Moctezuma-Ramirez, A.; Elgalad, A.; Perin, E. Heart Rate Variability Measurement through a Smart Wearable Device: Another Breakthrough for Personal Health Monitoring? Int. J. Environ. Res. Public Health 2023, 20, 7146. [Google Scholar] [CrossRef]
- Bourdillon, N.; Jeanneret, F.; Nilchian, M.; Albertoni, P.; Ha, P.; Millet, G.P. Sleep Deprivation Deteriorates Heart Rate Variability and Photoplethysmography. Front. Neurosci. 2021, 15, 642548. [Google Scholar] [CrossRef]
- Dettoni, J.L.; Consolim-Colombo, F.M.; Drager, L.F.; Rubira, M.C.; Cavasin De Souza, S.B.P.; Irigoyen, M.C.; Mostarda, C.; Borile, S.; Krieger, E.M.; Moreno, H.; et al. Cardiovascular Effects of Partial Sleep Deprivation in Healthy Volunteers. J. Appl. Physiol. 2012, 113, 232–236. [Google Scholar] [CrossRef] [PubMed]
- Zhong, X.; Hilton, H.J.; Gates, G.J.; Jelic, S.; Stern, Y.; Bartels, M.N.; DeMeersman, R.E.; Basner, R.C. Increased Sympathetic and Decreased Parasympathetic Cardiovascular Modulation in Normal Humans with Acute Sleep Deprivation. J. Appl. Physiol. 2005, 98, 2024–2032. [Google Scholar] [CrossRef]
- Ernst, G. Heart-Rate Variability—More than Heart Beats? Front. Public Health 2017, 5, 240. [Google Scholar] [CrossRef]
- Covassin, N.; Singh, P. Sleep Duration and Cardiovascular Disease Risk. Sleep Med. Clin. 2016, 11, 81–89. [Google Scholar] [CrossRef]
- Kim, K.K.; Lim, Y.G.; Kim, J.S.; Park, K.S. Effect of Missing RR-Interval Data on Heart Rate Variability Analysis in the Time Domain. Physiol. Meas. 2007, 28, 1485–1494. [Google Scholar] [CrossRef] [PubMed]
- Peltola, M.A. Role of Editing of R–R Intervals in the Analysis of Heart Rate Variability. Front. Physiol. 2012, 3, 148. [Google Scholar] [CrossRef] [PubMed]
- Cajal, D.; Hernando, D.; Lázaro, J.; Laguna, P.; Gil, E.; Bailón, R. Effects of Missing Data on Heart Rate Variability Metrics. Sensors 2022, 22, 5774. [Google Scholar] [CrossRef] [PubMed]
- Kim, K.K.; Kim, J.S.; Lim, Y.G.; Park, K.S. The Effect of Missing RR-Interval Data on Heart Rate Variability Analysis in the Frequency Domain. Physiol. Meas. 2009, 30, 1039–1050. [Google Scholar] [CrossRef]
- Aygun, A.; Jafari, R. Robust Heart Rate Variability and Interbeat Interval Detection Algorithm in the Presence of Motion Artifacts. In Proceedings of the 2019 IEEE EMBS International Conference on Biomedical & Health Informatics (BHI), Chicago, IL, USA, 19–22 May 2019; pp. 1–5. [Google Scholar]
- Ong, J.L.; Golkashani, H.A.; Ghorbani, S.; Wong, K.F.; Chee, N.I.Y.N.; Willoughby, A.R.; Chee, M.W.L. Selecting a Sleep Tracker from EEG-Based, Iteratively Improved, Low-Cost Multisensor, and Actigraphy-Only Devices. Sleep Health 2023, 10, 9–23. [Google Scholar] [CrossRef]
- Yilmaz, G.; Ong, J.L.; Ling, L.-H.; Chee, M.W.L. Insights into Vascular Physiology from Sleep Photoplethysmography. Sleep 2023, 46, zsad172. [Google Scholar] [CrossRef]
- Johns, M.W. A New Method for Measuring Daytime Sleepiness: The Epworth Sleepiness Scale. Sleep 1991, 14, 540–545. [Google Scholar] [CrossRef]
- Trinder, J.; Allen, N.B.; Kleiman, J.; Kralevski, V.; Taylor, D.H.; Anson, K.; Kim, Y. On the Nature of Cardiovascular Activation at an Arousal from Sleep. Sleep 2003, 26, 543–551. [Google Scholar] [CrossRef]
- Chow, H.-W.; Yang, C.-C. Accuracy of Optical Heart Rate Sensing Technology in Wearable Fitness Trackers for Young and Older Adults: Validation and Comparison Study. JMIR Mhealth Uhealth 2020, 8, e14707. [Google Scholar] [CrossRef]
- Altini, M.; Kinnunen, H. The Promise of Sleep: A Multi-Sensor Approach for Accurate Sleep Stage Detection Using the Oura Ring. Sensors 2021, 21, 4302. [Google Scholar] [CrossRef]
- Chee, N.I.; Ghorbani, S.; Golkashani, H.A.; Leong, R.L.; Ong, J.L.; Chee, M.W. Multi-Night Validation of a Sleep Tracking Ring in Adolescents Compared with a Research Actigraph and Polysomnography. Nat. Sci. Sleep 2021, 13, 177–190. [Google Scholar] [CrossRef] [PubMed]
- Ghorbani, S.; Golkashani, H.A.; Chee, N.I.; Teo, T.B.; Dicom, A.R.; Yilmaz, G.; Leong, R.L.; Ong, J.L.; Chee, M.W. Multi-Night at-Home Evaluation of Improved Sleep Detection and Classification with a Memory-Enhanced Consumer Sleep Tracker. Nat. Sci. Sleep 2022, 14, 645–660. [Google Scholar] [CrossRef] [PubMed]
- Roberts, D.M.; Schade, M.M.; Mathew, G.M.; Gartenberg, D.; Buxton, O.M. Detecting Sleep Using Heart Rate and Motion Data from Multisensor Consumer-Grade Wearables, Relative to Wrist Actigraphy and Polysomnography. Sleep 2020, 43, zsaa045. [Google Scholar] [CrossRef] [PubMed]
- Vest, A.N.; Da Poian, G.; Li, Q.; Liu, C.; Nemati, S.; Shah, A.J.; Clifford, G.D. An Open Source Benchmarked Toolbox for Cardiovascular Waveform and Interval Analysis. Physiol. Meas. 2018, 39, 105004. [Google Scholar] [CrossRef] [PubMed]
- Lucreziotti, S.; Gavazzi, A.; Scelsi, L.; Inserra, C.; Klersy, C.; Campana, C.; Ghio, S.; Vanoli, E.; Tavazzi, L. Five-Minute Recording of Heart Rate Variability in Severe Chronic Heart Failure: Correlates with Right Ventricular Function and Prognostic Implications. Am. Heart J. 2000, 139, 1088–1095. [Google Scholar] [CrossRef]
- Malik, M. Heart Rate Variability: Standards of Measurement, Physiological Interpretation, and Clinical Use: Task Force of The European Society of Cardiology and the North American Society for Pacing and Electrophysiology. Noninvasive Electrocardiol. 1996, 1, 151–181. [Google Scholar] [CrossRef]
- Lomb, N.R. Least-Squares Frequency Analysis of Unequally Spaced Data. Astrophys. Space Sci. 1976, 39, 447–462. [Google Scholar] [CrossRef]
- Scargle, J.D. Studies in Astronomical Time Series Analysis. II—Statistical Aspects of Spectral Analysis of Unevenly Spaced Data. Astrophys. J. 1982, 263, 835. [Google Scholar] [CrossRef]
- Ruf, T. Lsp: Lomb-Scargle Periodogram in Lomb: Lomb-Scargle Periodogram. Available online: https://rdrr.io/cran/lomb/man/lsp.html (accessed on 23 January 2024).
- Burr, R.L. Interpretation of Normalized Spectral Heart Rate Variability Indices In Sleep Research: A Critical Review. Sleep 2007, 30, 913–919. [Google Scholar] [CrossRef]
- Lin, L.I.-K. A Concordance Correlation Coefficient to Evaluate Reproducibility. Biometrics 1989, 45, 255. [Google Scholar] [CrossRef]
- Menghini, L.; Cellini, N.; Goldstone, A.; Baker, F.C.; De Zambotti, M. A Standardized Framework for Testing the Performance of Sleep-Tracking Technology: Step-by-Step Guidelines and Open-Source Code. Sleep 2021, 44, zsaa170. [Google Scholar] [CrossRef] [PubMed]
- Charlton, P.H.; Kotzen, K.; Mejía-Mejía, E.; Aston, P.J.; Budidha, K.; Mant, J.; Pettit, C.; Behar, J.A.; Kyriacou, P.A. Detecting Beats in the Photoplethysmogram: Benchmarking Open-Source Algorithms. Physiol. Meas. 2022, 43, 085007. [Google Scholar] [CrossRef] [PubMed]
- Benedetti, D.; Olcese, U.; Frumento, P.; Bazzani, A.; Bruno, S.; d’Ascanio, P.; Maestri, M.; Bonanni, E.; Faraguna, U. Heart Rate Detection by Fitbit ChargeHRTM: A Validation Study versus Portable Polysomnography. J. Sleep Res. 2021, 30, e13346. [Google Scholar] [CrossRef]
- Nuuttila, O.-P.; Korhonen, E.; Laukkanen, J.; Kyröläinen, H. Validity of the Wrist-Worn Polar Vantage V2 to Measure Heart Rate and Heart Rate Variability at Rest. Sensors 2021, 22, 137. [Google Scholar] [CrossRef]
- Henriksen, A.; Svartdal, F.; Grimsgaard, S.; Hartvigsen, G.; Hopstock, L.A. Polar Vantage and Oura Physical Activity and Sleep Trackers: Validation and Comparison Study. JMIR Form. Res. 2022, 6, e27248. [Google Scholar] [CrossRef]
- Kinnunen, H.O.; Koskimäki, H. 0312 The HRV Of The Ring—Comparison Of Nocturnal HR And HRV Between A Commercially Available Wearable Ring And ECG. Sleep 2018, 41, A120. [Google Scholar] [CrossRef]
- Allen, J.; Murray, A. Age-Related Changes in Peripheral Pulse Timing Characteristics at the Ears, Fingers and Toes. J. Hum. Hypertens. 2002, 16, 711–717. [Google Scholar] [CrossRef]
- Allen, J.; Murray, A. Age-Related Changes in the Characteristics of the Photoplethysmographic Pulse Shape at Various Body Sites. Physiol. Meas. 2003, 24, 297–307. [Google Scholar] [CrossRef]
- Lin, W.-H.; Zheng, D.; Li, G.; Chen, F. Age-Related Changes in Blood Volume Pulse Wave at Fingers and Ears. IEEE J. Biomed. Health Inform. 2023, 28, 5070–5080. [Google Scholar] [CrossRef]
- Charlton, P.H.; Paliakaitė, B.; Pilt, K.; Bachler, M.; Zanelli, S.; Kulin, D.; Allen, J.; Hallab, M.; Bianchini, E.; Mayer, C.C.; et al. Assessing Hemodynamics from the Photoplethysmogram to Gain Insights into Vascular Age: A Review from VascAgeNet. Am. J. Physiol.-Heart Circ. Physiol. 2022, 322, H493–H522. [Google Scholar] [CrossRef]
- Tsuchida, Y. The Effect of Aging and Arteriosclerosis on Human Skin Blood Flow. J. Dermatol. Sci. 1993, 5, 175–181. [Google Scholar] [CrossRef] [PubMed]
- Allen, J.; O’Sullivan, J.; Stansby, G.; Murray, A. Age-Related Changes in Pulse Risetime Measured by Multi-Site Photoplethysmography. Physiol. Meas. 2020, 41, 074001. [Google Scholar] [CrossRef] [PubMed]
- Li, K.; Rüdiger, H.; Ziemssen, T. Spectral Analysis of Heart Rate Variability: Time Window Matters. Front. Neurol. 2019, 10, 545. [Google Scholar] [CrossRef] [PubMed]
- Binici, Z.; Mouridsen, M.R.; Køber, L.; Sajadieh, A. Decreased Nighttime Heart Rate Variability Is Associated With Increased Stroke Risk. Stroke 2011, 42, 3196–3201. [Google Scholar] [CrossRef] [PubMed]
- Lagi, A.; Tamburini, C.; Fattorini, L.; Cencetti, S. Autonomic Control of Heart Rate Variability in Vasovagal Syncope: A Study of the Nighttime Period in 24-Hour Recordings. Clin. Auton. Res. 1999, 9, 179–183. [Google Scholar] [CrossRef] [PubMed]
- McNames, J.; Aboy, M. Reliability and Accuracy of Heart Rate Variability Metrics versus ECG Segment Duration. Med. Bio Eng. Comput. 2006, 44, 747–756. [Google Scholar] [CrossRef]
- Mejía-Mejía, E.; Kyriacou, P.A. Duration of Photoplethysmographic Signals for the Extraction of Pulse Rate Variability Indices. Biomed. Signal Process. Control 2023, 80, 104214. [Google Scholar] [CrossRef]


| Units | Younger (<45 Years) | Older (≥45 Years Old) | Mann-Whitney U Test p-Value | |||
|---|---|---|---|---|---|---|
| Demographics | ||||||
| Number of participants | 92 | [42 males] | 22 | [8 males] | ||
| Age | years | 25.0 | (10.3) | 56.5 | (12.0) | p < 0.001 |
| BMI | kg/m² | 22.1 | (3.2) | 24.3 | (3.0) | p = 0.019 |
| Office SBP | mmHg | 110.0 | (16.0) | 117.0 | (19.5) | p = 0.059 |
| Office DBP | mmHg | 70.0 | (9.0) | 75.0 | (17.0) | p = 0.169 |
| Sleep Characteristics (Oura) | ||||||
| Time-in-Bed | hours | 7.52 | (1.10) | 7.38 | (0.73) | p = 0.980 |
| Bed-time | hh:mm | 00:45 | (1.57 h) | 23:55 | (1.46 h) | p = 0.005 |
| Wake-time | hh:mm | 08:18 | (1.96 h) | 07:02 | (1.56 h) | p = 0.009 |
| Sleep Efficiency | % | 90.0 | (7.0) | 87.0 | (9.0) | p = 0.089 |
| Validity Proportion Threshold | Retention Rate (%) | |
|---|---|---|
| Younger | Older | |
| Initial 5 min segment count | 14,073 | 3485 |
| 30% | 93.3 | 95.2 |
| 50% | 87.0 | 89.4 |
| 80% | 66.7 | 72.3 |
| 95% | 32.8 | 44.7 |
| Publication | Devices | Setting | Window Size | Study Sample (Age ± SD) | * Correlations (r) | * Mean Bias |
|---|---|---|---|---|---|---|
| Kinnunen et al., 2020 [10] | Oura Ring Gen 2 (PPG, finger) Somnologica/Faros 90/Faros 180 (ECG, Reference) | Free living, S | 5 min * | N = 49 (31.6 ± 11.8) | HR = 0.996 rMSSD = 0.980 | HR = −0.63 bpm rMSSD = −1.20 ms |
| Benedetti et al., 2021 [46] | FitBit ChargeHR (PPG, wrist) Morpheus Home Portable PSG (ECG, Reference) | Free living, S | 1 min * | N = 25 (22.4 ± 3.0) | HR < 100 bpm HR = 0.84 HR > 100 bpm HR = 0.35 | HR = −0.66 bpm |
| Nuuttila et al., 2021 [47] | Polar Vantage V2 (PPG, wrist) Polar H10 (ECG, Reference) | Free living, S | 5 min * | N = 29 (36.0 ± 7.0) | HR = 0.998 ln(rMSSD) = 0.963 | HR = 0.70 bpm ln(rMSSD) = 0.17 ms |
| Cao et al., 2022 [13] | Oura Ring Gen 3 (PPG, finger) Shimmer 3 (ECG, Reference) | Free living, S | 5 min * Night | N = 46 (32.3 ± 6.4) | HR = 0.993 rMSSD = 0.915 SDNN = 0.518 AVNN = 0.825 LF (absolute) = 0.424 HF (absolute) = 0.627 LF/HF ratio = 0.354 | HR = −0.44 bpm rMSSD = −14.97 ms SDNN = −0.96 ms AVNN = −13.39 ms LF (absolute) = 23.61 ms² HF (absolute) = 30.23 ms² LF/HF ratio = −0.11 |
| Henriksen et al., 2022 [48] | Oura Ring Gen 2 (PPG, finger) Actiheart 4 (ECG, Reference) | Free living, S | Night * | N = 21 (33.0 ± 14.0) | RHR = 0.900 | RHR = −1.00 bpm |
| Current paper | Oura Ring Gen 3 (PPG, finger) SOMNOtouch (ECG, Reference) | In-lab, S | 5 min * 30 min Night | Younger N = 92 (27.4 ± 6.5) Older N = 22 (58.0 ± 6.9) | Younger HR = 0.992 rMSSD = 0.979 HFnu = 0.931 Older HR = 0.994 rMSSD = 0.937 HFnu = 0.902 | Younger HR = −0.64 bpm rMSSD = 2.50 ms HFnu = 0.03 Older HR = −0.42 bpm rMSSD = 3.79 ms HFnu = 0.03 |
Disclaimer/Publisher’s Note: The statements, opinions and data contained in all publications are solely those of the individual author(s) and contributor(s) and not of MDPI and/or the editor(s). MDPI and/or the editor(s) disclaim responsibility for any injury to people or property resulting from any ideas, methods, instructions or products referred to in the content. |
© 2024 by the authors. Licensee MDPI, Basel, Switzerland. This article is an open access article distributed under the terms and conditions of the Creative Commons Attribution (CC BY) license (https://creativecommons.org/licenses/by/4.0/).
Share and Cite
Liang, T.; Yilmaz, G.; Soon, C.-S. Deriving Accurate Nocturnal Heart Rate, rMSSD and Frequency HRV from the Oura Ring. Sensors 2024, 24, 7475. https://doi.org/10.3390/s24237475
Liang T, Yilmaz G, Soon C-S. Deriving Accurate Nocturnal Heart Rate, rMSSD and Frequency HRV from the Oura Ring. Sensors. 2024; 24(23):7475. https://doi.org/10.3390/s24237475
Chicago/Turabian StyleLiang, Tian, Gizem Yilmaz, and Chun-Siong Soon. 2024. "Deriving Accurate Nocturnal Heart Rate, rMSSD and Frequency HRV from the Oura Ring" Sensors 24, no. 23: 7475. https://doi.org/10.3390/s24237475
APA StyleLiang, T., Yilmaz, G., & Soon, C.-S. (2024). Deriving Accurate Nocturnal Heart Rate, rMSSD and Frequency HRV from the Oura Ring. Sensors, 24(23), 7475. https://doi.org/10.3390/s24237475