Abstract
Truck hoisting detection constitutes a key focus in port security, for which no optimal resolution has been identified. To address the issues of high costs, susceptibility to weather conditions, and low accuracy in conventional methods for truck hoisting detection, a non-intrusive detection approach is proposed in this paper. The proposed approach utilizes a mathematical model and an extreme gradient boosting (XGBoost) model. Electrical signals, including voltage and current, collected by Hall sensors are processed by the mathematical model, which augments their physical information. Subsequently, the dataset filtered by the mathematical model is used to train the XGBoost model, enabling the XGBoost model to effectively identify abnormal hoists. Improvements were observed in the performance of the XGBoost model as utilized in this paper. Finally, experiments were conducted at several stations. The overall false positive rate did not exceed 0.7% and no false negatives occurred in the experiments. The experimental results demonstrated the excellent performance of the proposed approach, which can reduce the costs and improve the accuracy of detection in container hoisting.
1. Introduction
With the rapid growth of international and domestic trade volume, the loading and unloading operations of containers have become increasingly busy [1,2], emphasizing the importance of safety in port operations [3]. One typical issue in these operations is mistakenly hoisting trucks when unloading containers with cranes. The detection of truck hoisting can effectively minimize economic losses in port operations and guarantee operation safety [4], thus improving the efficiency of normal operations. Since trucks for the transportation of containers are mostly equipped with multiple pairs of locks, containers can be fixed to trucks securely by locking four corresponding locks during transportation, preventing the risk of containers tipping over or slipping. The failure to unlock all locks when unloading containers can result in the hoisting of trucks, which can cause economic losses. Moreover, human safety deserves more concern; therefore, many researchers have devoted time to the detection of truck hoisting.
One method for truck hoisting detection utilizes cameras to ascertain separation statuses between containers and trucks. The manual monitoring method requires the gradual elevation of containers, halting at a specific height, which limits the efficiency of unloading. An alternative method (named PSLS) utilizes photoelectric sensors [5,6] and laser scanners [7,8,9]. PSLS identifies abnormal hoists by assessing the presence of obstacles under containers and monitoring dynamic positional changes. Compared to manual monitoring, PSLS presents superior efficiency. However, photoelectric sensors require frequent manual calibrations and testing, while laser scanners involve substantial initial costs and need regular maintenance and testing. Additionally, the effectiveness of PSLS relies on the accuracy of elevation and the detection precision of the sensors [10,11]. Some studies [12,13] have introduced methodologies for the acquisition of on-site images and videos through the use of cameras, followed by the application of algorithms for target detection [14,15] and feature point matching [16,17] to determine the positional changes of trucks. Nevertheless, adverse weather conditions significantly impact the image and video capture capability of cameras, making it challenging to ensure accuracy [18].
In summary, the above-mentioned methods for hoisting detection in trucks mainly depend on laser detectors, position sensors, and cameras [19]. Instruments such as lasers and infrared detectors require frequent manual calibration, resulting in high maintenance costs and being difficult to popularize. Present methods for truck hoisting detection necessitate a period of hovering after containers are hoisted, constraining the efficiency of unloading processes and increasing power consumption. Moreover, some detection systems are relatively expensive, providing minimal benefits to ports and hindering widespread adoption. Devices used in conventional methods, such as lasers and cameras, are also susceptible to on-site disturbances, such as vibrations, fog, and intense light, imposing stringent demands on sensor stability and precision.
To address the above-mentioned issues, an indirect detection approach is proposed in this paper. The proposed approach involves the collection of electrical signals, including voltage and current, and the employment of mathematical and XGBoost models [20,21] to discern instances when trucks are hoisted by cranes. XGBoost models have been widely adopted in the industry due to their exceptional reliability, precision, and portability [22,23]. Additionally, the modest requirements of XGBoost in terms of hardware resources serve to mitigate the costs of deployment, which would facilitate the widespread adoption of the proposed approach [24,25]. When trucks are hoisted, anomalies in the forces applied to the suspension systems arise, thereby inducing fluctuations in load weight. Furthermore, these fluctuations cause abnormal changes in both voltage and current within the drive motors of cranes. To identify these subtle anomalies, a mathematical model was established for drive motors [26,27] and suspension systems [28,29]. Employing captured electrical signals, the model calculates various physical parameters pertaining to the operational statuses of cranes. Subsequently, these derived physical parameters serve as training sets for the XGBoost model.
In the course of training the XGBoost model, the mathematical model augments datasets with more comprehensive representations of the physical information and selectively filters training sets in accordance with distinct hoists. We conducted experiments to verify that the filtered datasets markedly augment the performance of the XGBoost model. In the detection of truck hoisting, an initial analysis of input data is performed using the mathematical model, after which the filtered data are subjected to further assessment using the XGBoost model. The combined model demonstrates a substantial enhancement in performance relative to the individual XGBoost model.
Compared to other existing methods for truck hoisting detection, the advantages of the approach in this paper are reflected in the following aspects:
- The proposed approach collects the electrical signals of motors using Hall sensors, and all devices utilized in the proposed approach can be deployed within the electrical control zones of cranes, ensuring the normal operation of the approach even in extreme weather conditions;
- Hall sensors are more cost effective compared to both cameras and laser scanners, and can work stably for extended periods without calibration or frequent manual maintenance, contributing to relatively low operational times and costs;
- The proposed approach can detect continuously during the spreader hoisting process without requiring containers to stop in mid-air, thereby improving unloading efficiency;
- By constructing training sets using the mathematical model and combining that model with the XGBoost model, the proposed approach has high detection accuracy and low time complexity and responds quickly to abnormal situations.
2. Mathematical Model of Hoist Process
Driven by induction motors, spreaders elevate targeted containers for unloading. Through interactions between containers and trucks, suspension systems affect the elevation process upon contact. To characterize the ascent dynamics of trucks, a mathematical model for drive motors and suspension systems was built. The model inputs consist of voltage and current signals applied to drive motors, acquired using Hall sensors, which are subsequently transmitted for processing by microcomputers. The motor model enables the calculation of physical quantities that Hall sensors cannot measure directly, thereby enhancing the acquired physical information.
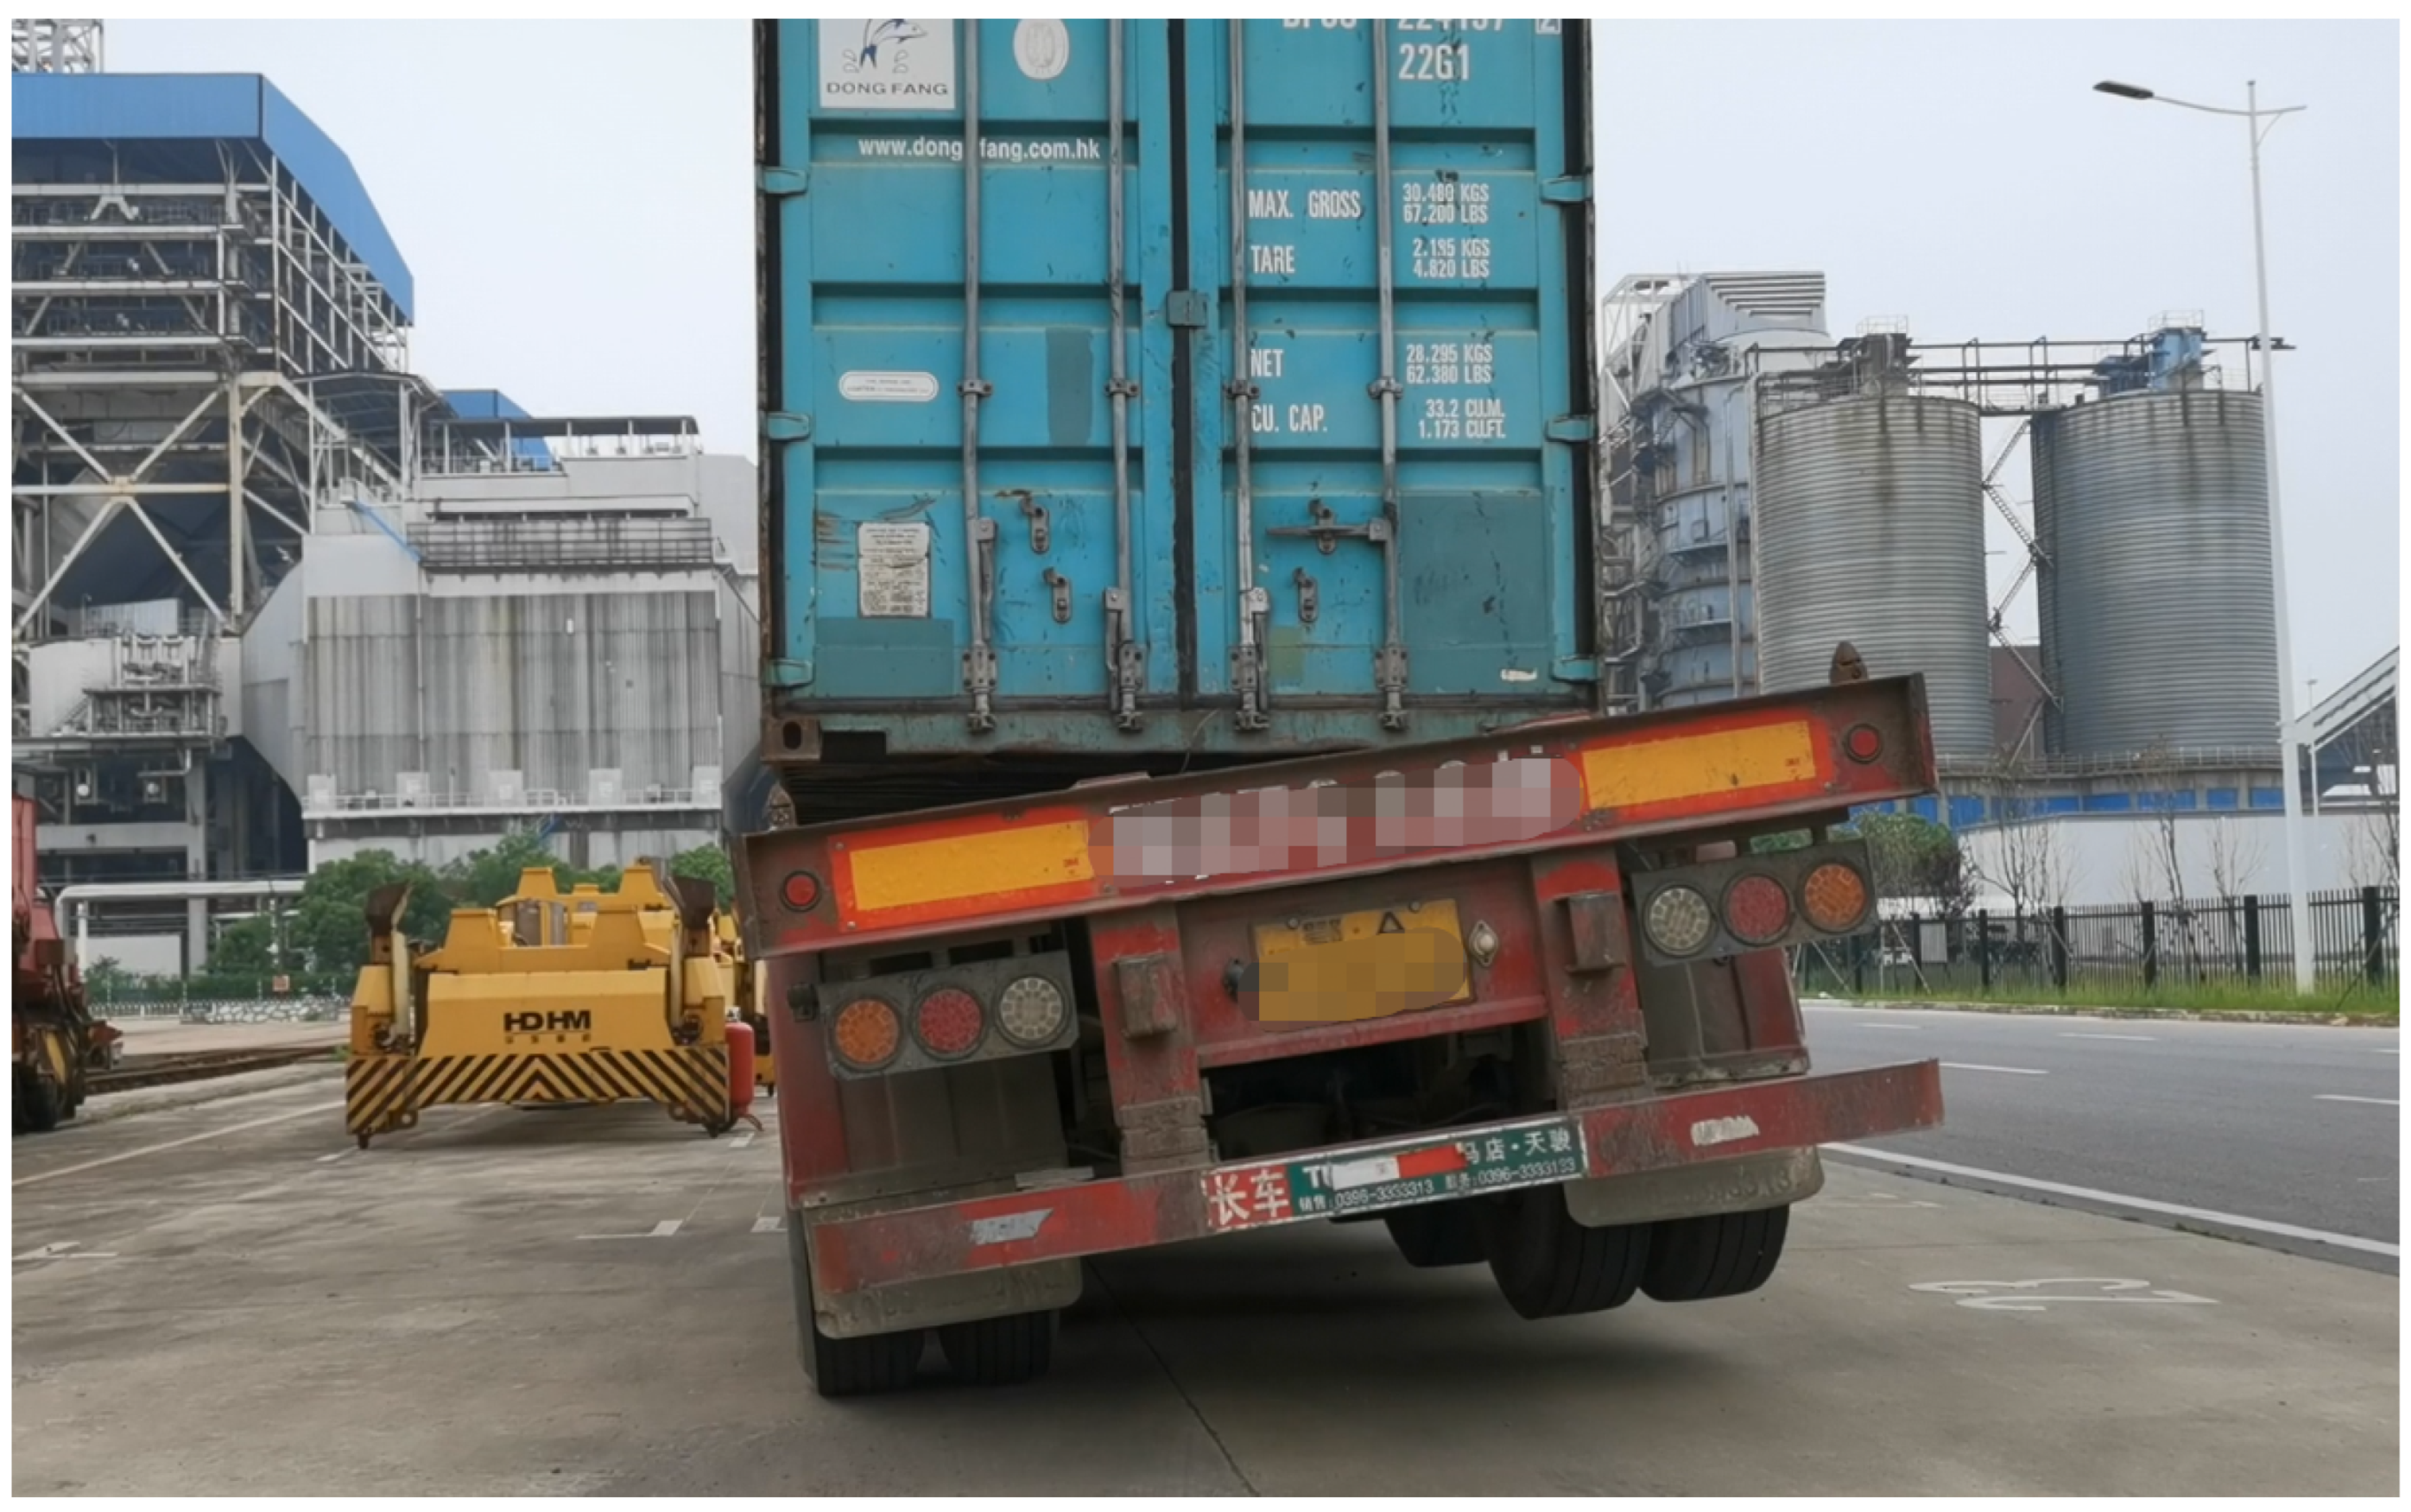
As illustrated in Figure 1, the locks between the truck and the container are incompletely disengaged. Consequently, during the unloading of the container, the underlying chassis is hoisted, causing an untoward incident.

Figure 1.
A truck being hoisted.
2.1. Drive Motor Model and Parameters
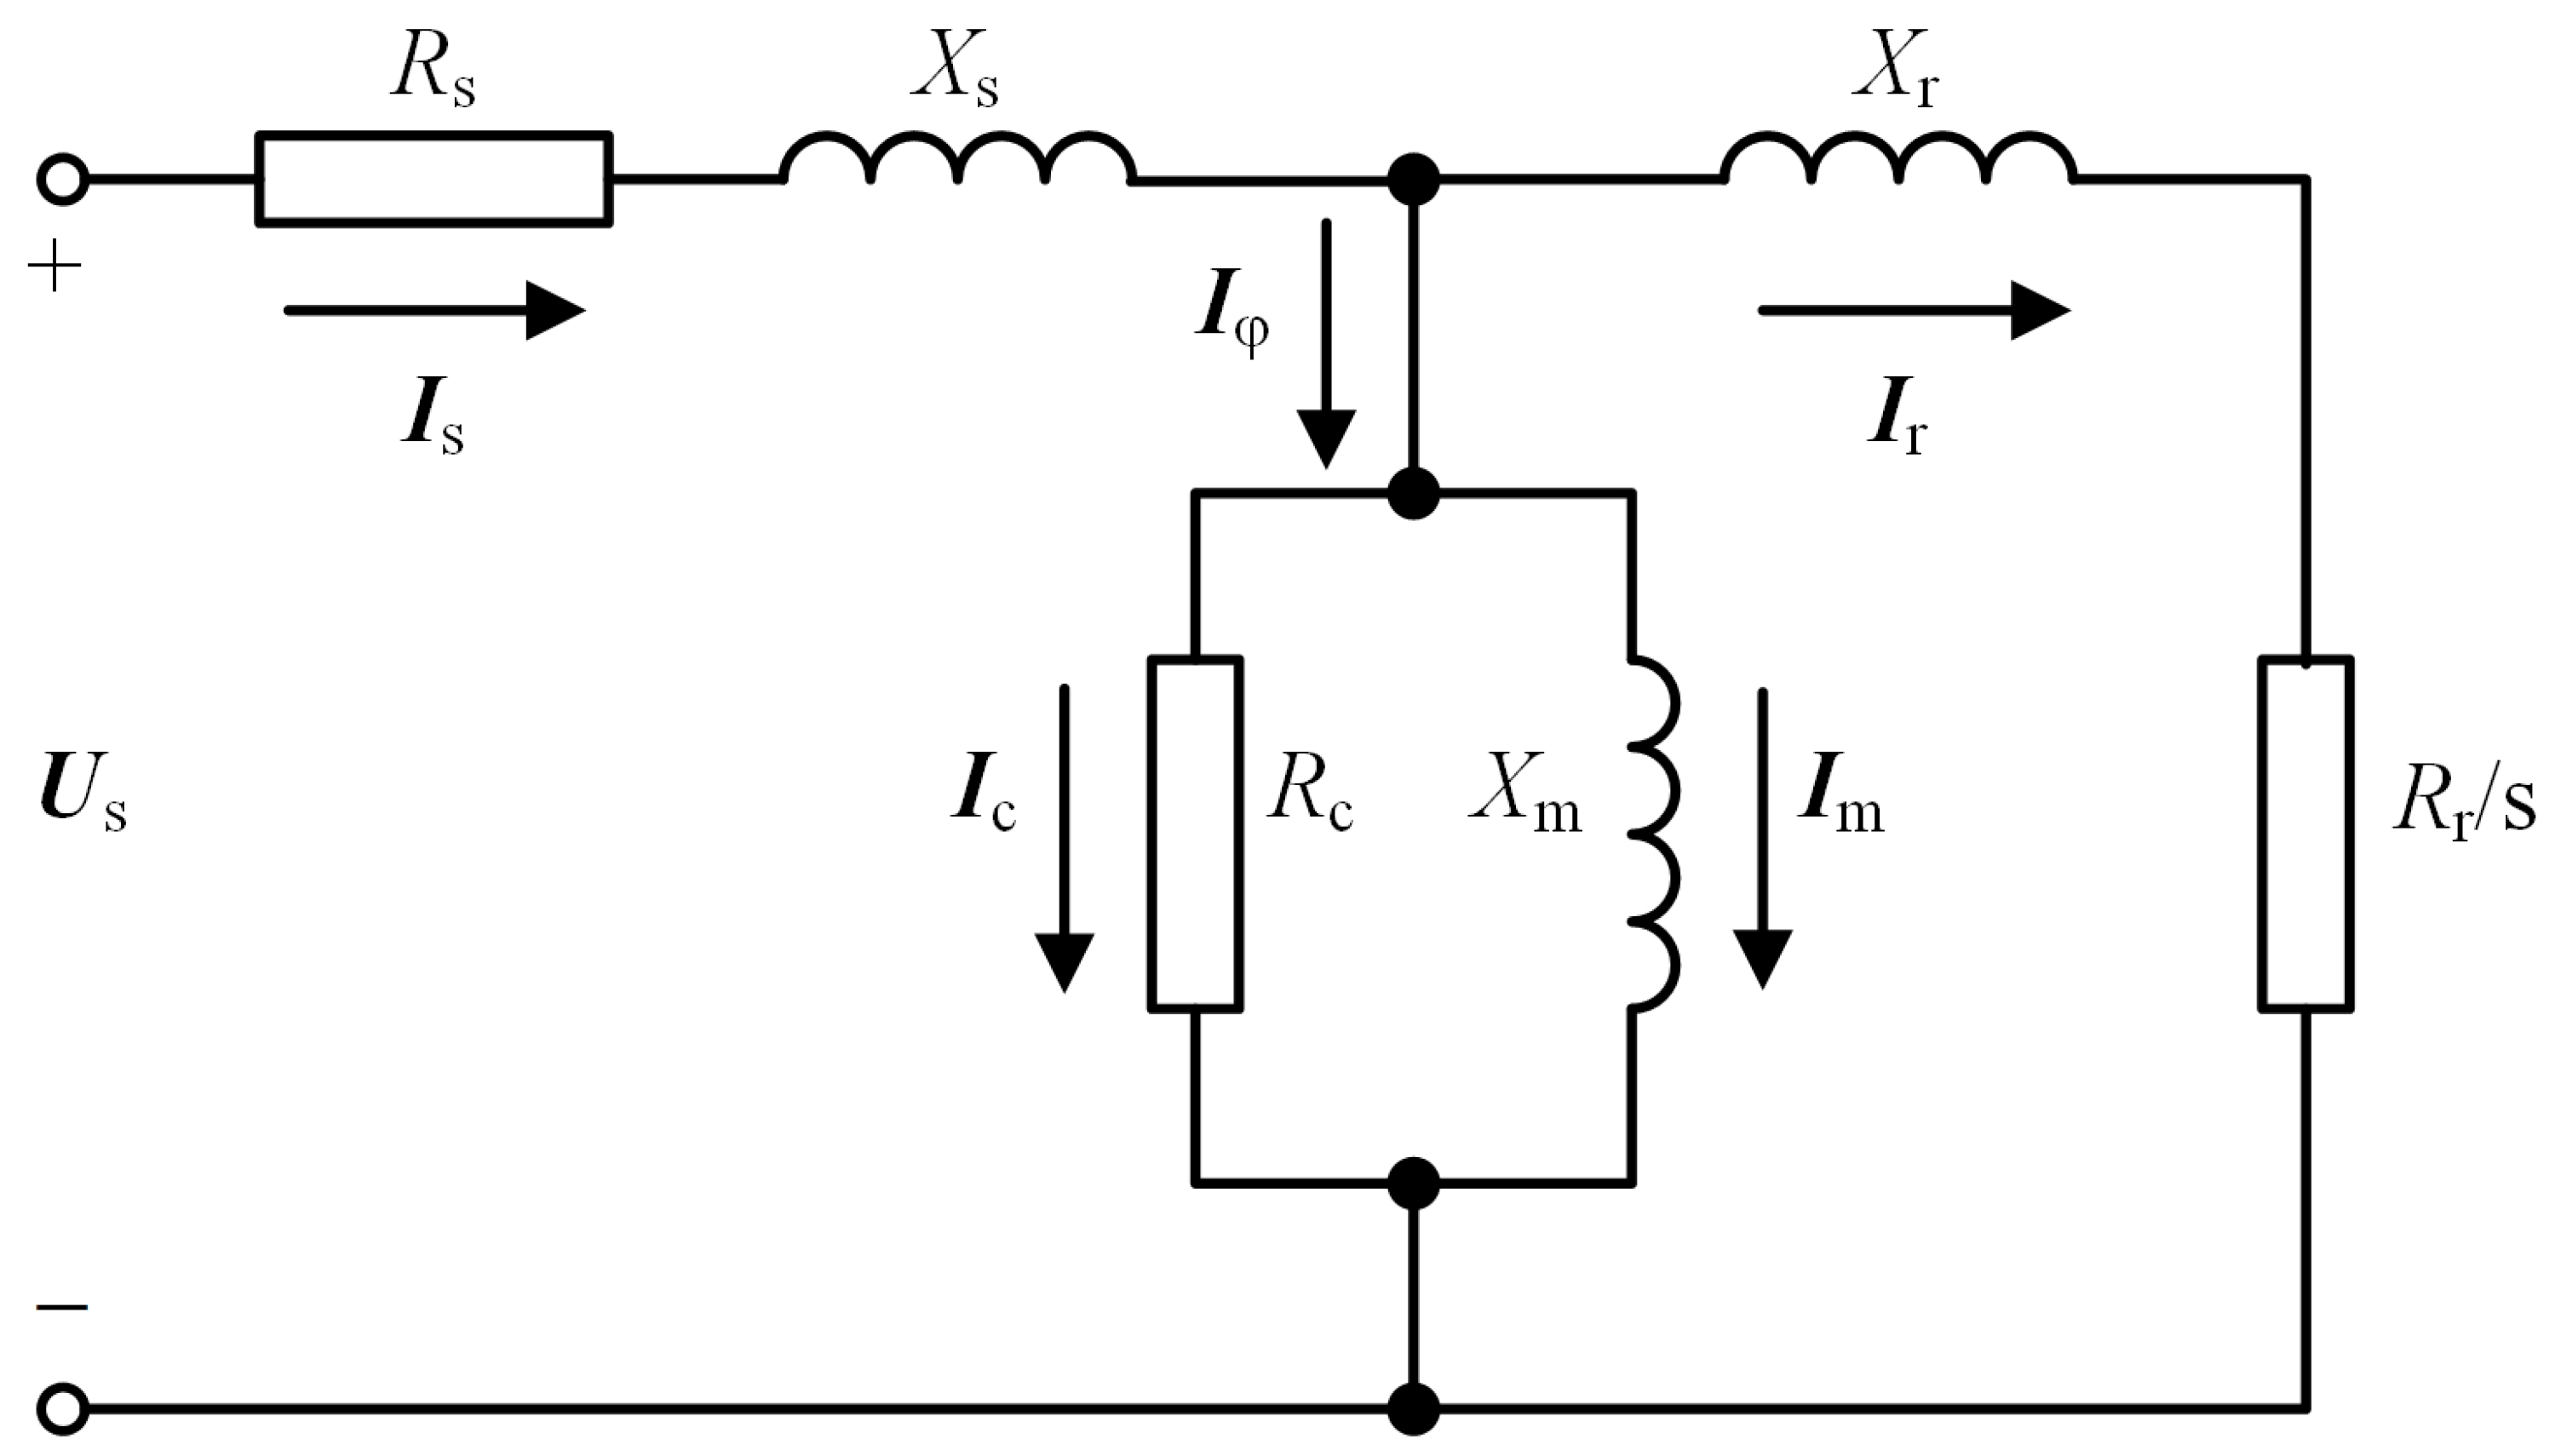
An equivalent circuit model of an induction motor [30] is employed in this paper, as shown in Figure 2, where denotes stator line-to-neutral terminal voltage, is stator current, represents exciting current, is the rotor current, and and are the magnetizing and core-loss components of , respectively.

Figure 2.
Equivalent circuit model of an induction motor.
The model presented in Figure 2 represents a single-phase equivalent circuit model of an induction motor, using parameters set to fixed values. In actual systems, the motor parameters are not constant due to factors such as temperature and humidity. However, these variations only have slight impacts on our study and can be disregarded. Additionally, stators and rotors are not electrically connected in actual systems, but are instead influenced by electromagnetic fields. To facilitate analysis, the model depicted in Figure 2 equates the relationship between the stator and rotor to an electrical circuit.
The model parameters were estimated from nameplate data and performance characteristics, including stator resistance , rotor resistance , core-loss resistance , stator inductance , rotor inductance , and excitation inductance . In Figure 2, and correspond to the leakage reactance associated with and , respectively, while denotes the excitation reactance of . Through the utilization of the motor model, additional physical information can be obtained, expanding the dimensions of input features in detection processes.
For drive motors employed in large-scale cranes, is relatively small and is conventionally treated as a constant. Within the confines of this paper, it is assumed that equates to . The computed outcomes of the model parameters are listed in Table 1, with all parameters normalized.

Table 1.
Normalized parameters of the motor model.
2.2. Calculation of Physical Characteristics
In the preliminary stage, the root mean square (RMS) values of voltage , current , active power , and frequency f are calculated based on the transient values gathered by Hall sensors. Subsequently, by incorporating the above-mentioned information into the motor model, the output power , electromagnetic torque , fractional slip s, motor speed n, and height h can be calculated.
In order to calculate frequency f, three-phase currents are transformed into and using Clark conversion. The vector sum of and forms an angle with the -axis. The rotational angular velocity of the sum vector is equal to the synchronous angular velocity and can be calculated using Equation (1).
The differential component within Equation (1) introduces a notable degree of noise. Subsequent to calculation, a depolarized mean filtration process is imperative to eliminate obvious pulse interference, thereby making the calculation result closer to the actual value.
In the model depicted in Figure 2, the input voltage is denoted as , which is calculated by subtracting the voltage drop across from . Applying Thevenin’s theorem on the stator side, the port-equivalent voltage is , alongside the equivalent reactance of . Given the motor model parameters, wherein markedly dwarfs , approximations render nearly equivalent to and approximately equal to .
The electromagnetic torque can be calculated by
where q is the number of stator phases, s is the fractional slip, represents the air-gap power, and denotes the value of input active power.
In accordance with the parameters of the motor model, it can be deduced that the coefficient associated with the quadratic term in (3) is significantly smaller than those of the linear and constant terms. Consequently, the quadratic terms within (3) can be omitted. The computations for output power and motor speed can be calculated using and , respectively.
The linear ascending velocity can be determined precisely via the application of coefficient , which delineates the relationship between the motor speed and operational velocity. Consequently, this facilitates the computation of the relative elevation h of containers.
2.3. Weight Calculation Algorithm
The proposed approach calculates the load weight of cranes using steady-state electrical parameters, which was introduced in [31] (crane load weight detection method, CLWD). The functional relationship established by CLWD can be described as
According to the mapping , the load weight m can be calculated using the output power and motor speed n.
2.4. Truck Suspension Model
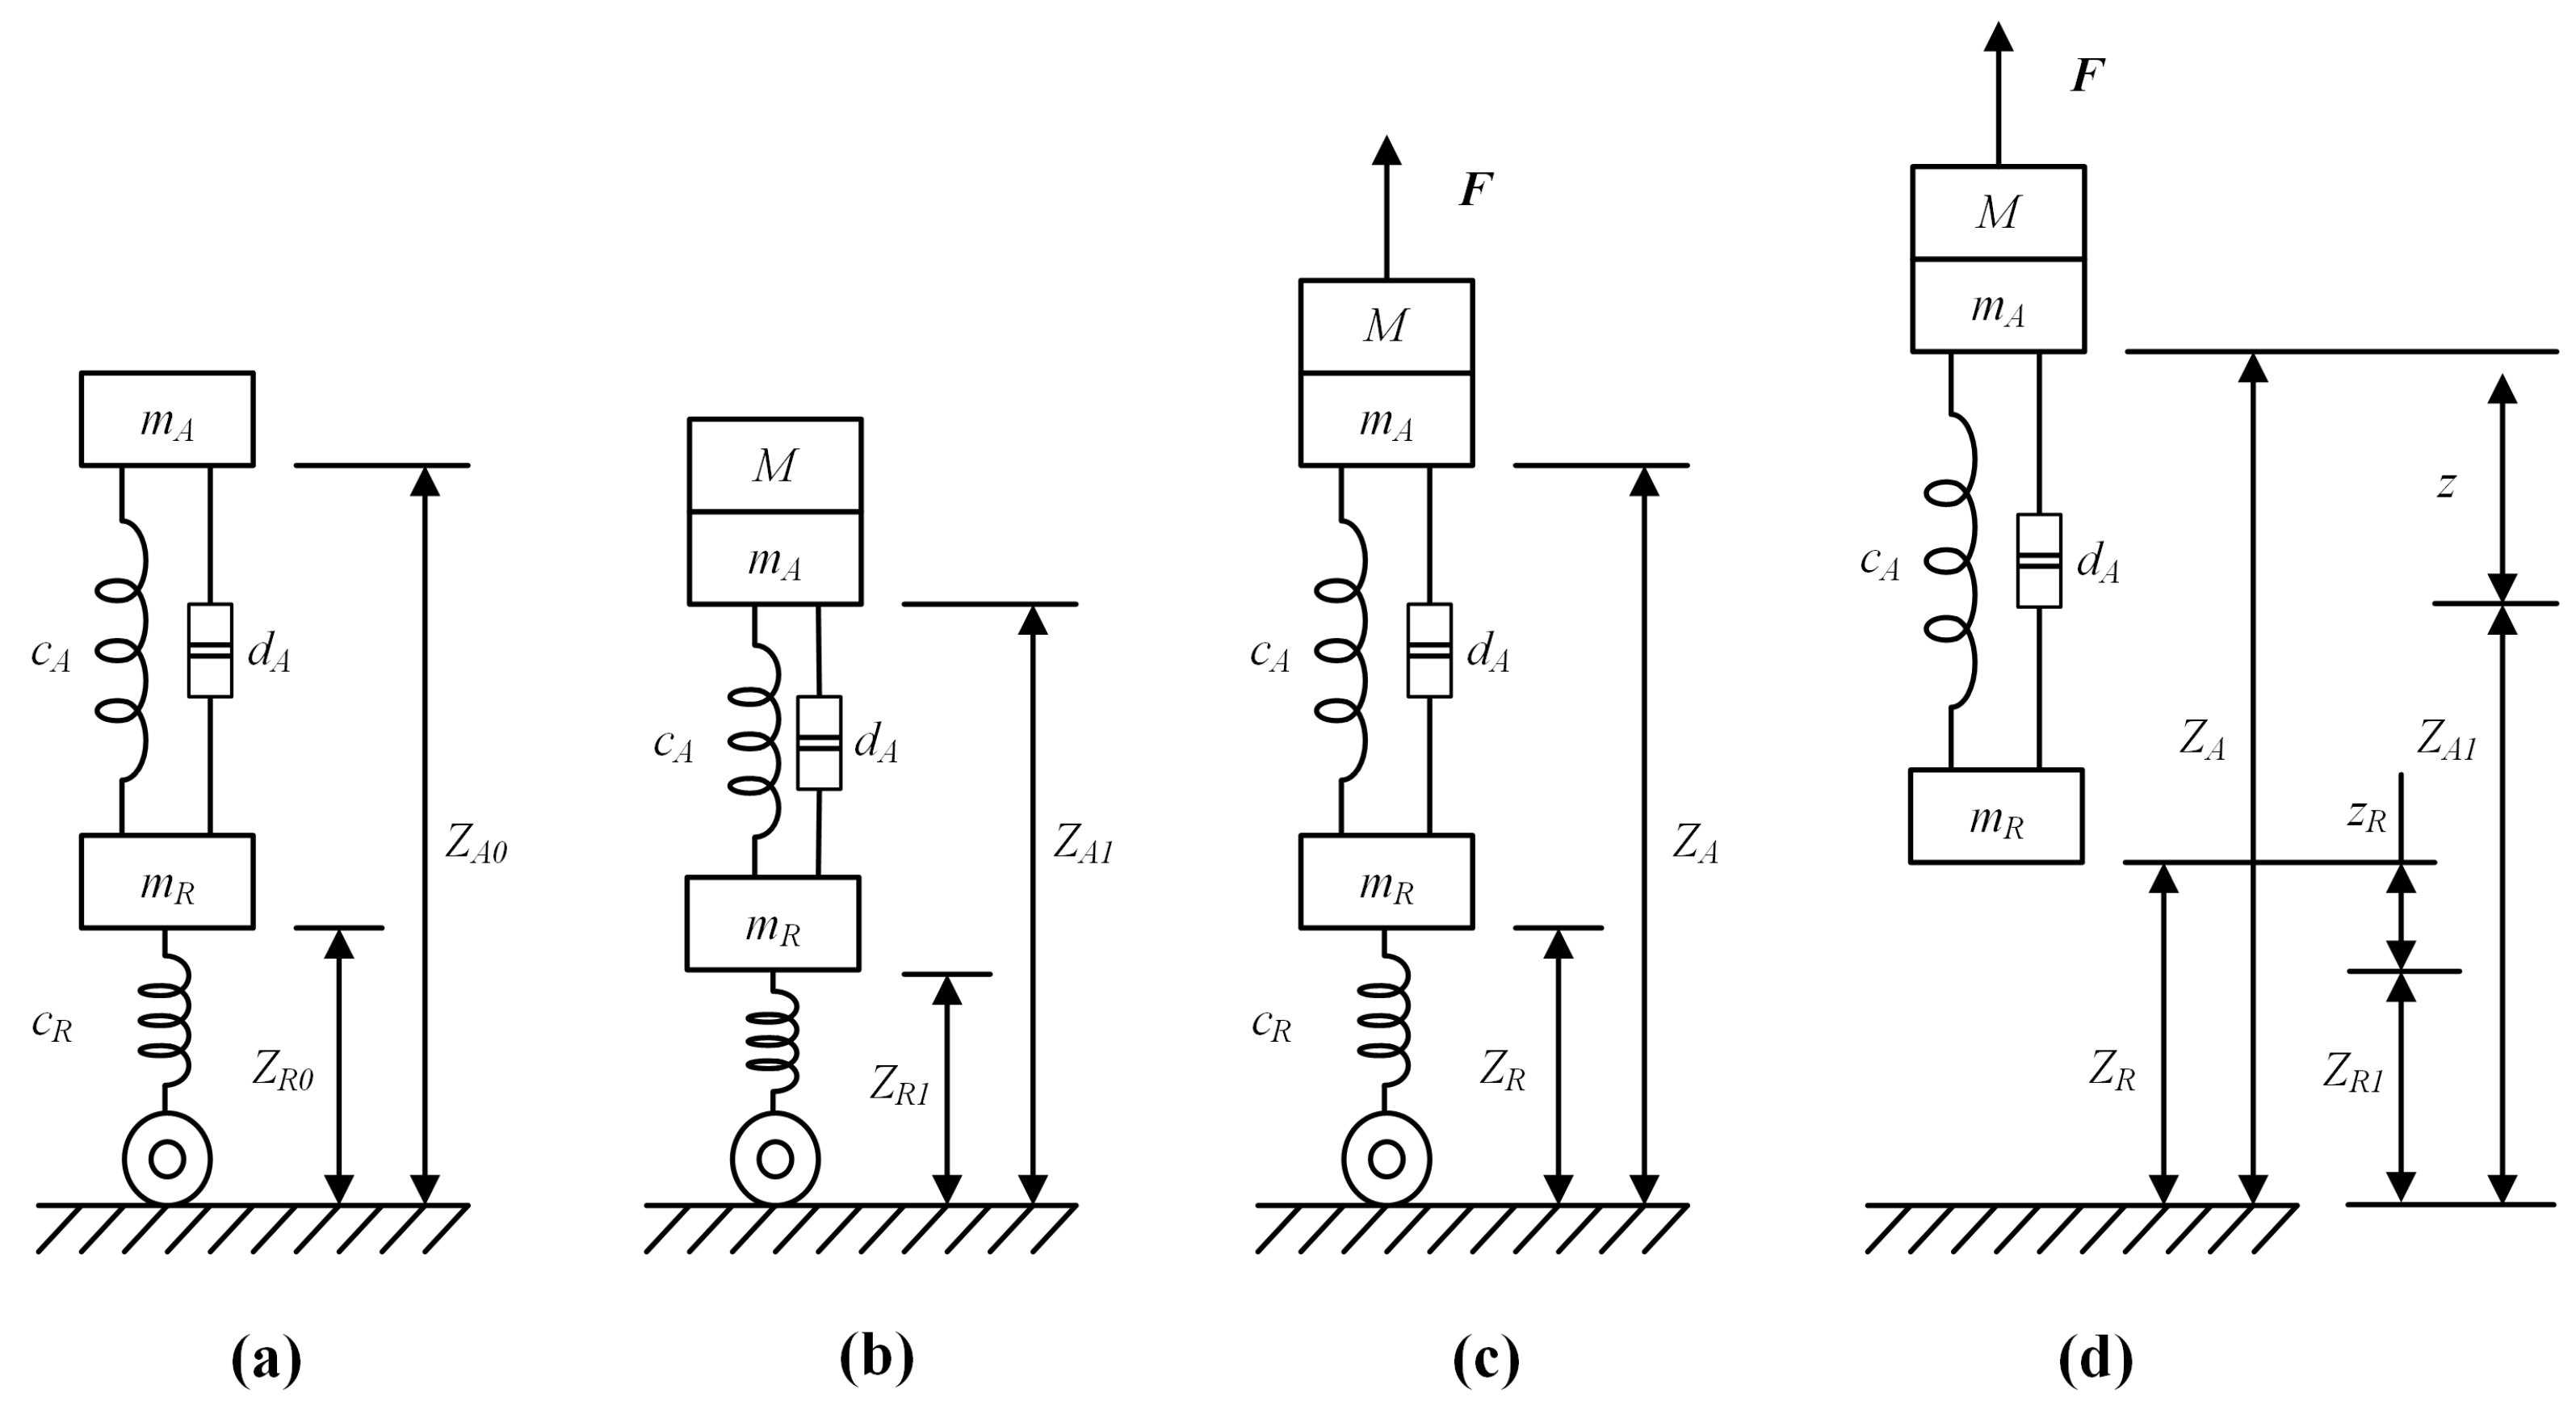
Suspension systems comprise various components, such as guiding mechanisms, elastic elements, trapezoidal structures, damping elements, stabilizing devices, and limiting rubber blocks. In the context of truck hoisting detection, the focus is on the longitudinal displacement. Consequently, a suspension system model was developed, considering elastic elements, damping elements, and wheels. Suspension is simplified into a spring-damping system, as depicted in Figure 3, where denotes the stiffness coefficient of the truck damper, represents the stiffness of the truck’s steel plate spring, is the stiffness of the tires, , , and are the heights of the tire center from the ground, , , and are the heights of the chassis plane from the ground, and , , and M represent the weights of the tires, truck, and container, respectively.
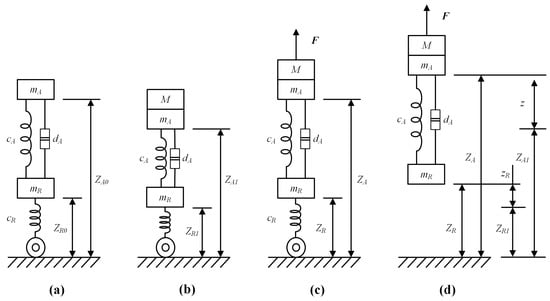
Figure 3.
Simplified models of truck suspension in four states: (a) a motionless truck without a container; (b) a motionless truck with a container; (c) a spreader hoisting a container; (d) a truck being hoisted.
The parameters of the suspension model utilized in this paper are presented in Table 2, with normalization applied to the parameters.
Table 2.
Normalized parameters of the suspension model.
Considering a container that is pulled upward by a spreader with a force of , the simplified suspension model can be described as follows:
where z is the height of the container, is the displacement of the tire center, and and denote the first and second derivatives of z, respectively.
Moreover, the relationship between z and can be represented as in Equation (6) if the truck is off the ground.
where g is the gravitational acceleration, which has a value of 9.8 m/s2 in this study.
Physical characteristics change in different statuses of hoists. By analyzing these distinctions, the range of physical quantities under different statuses can be constrained. In this paper, hoists are divided into two statuses: normal and abnormal. The experimental data for container hoists in different statuses were collected separately. The variations in tension F with height h under different statuses can be calculated using (5) and (6). Let and , where M includes the weight of the spreader. The calculation results are shown in Figure 4.
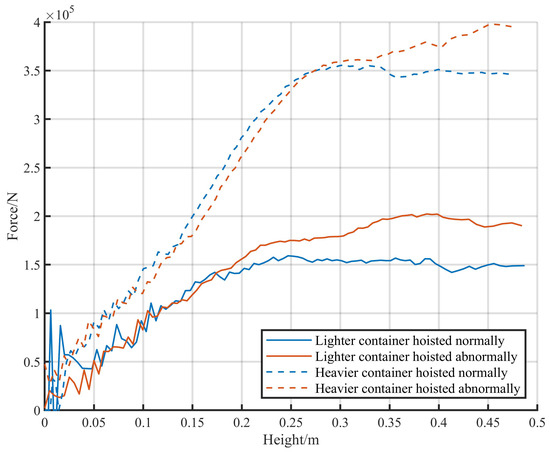
Figure 4.
Calculation results for different cases.
The calculation results indicate that the heavier the container, the higher the corresponding height when the pulling force is stable. During abnormal hoists, the suspension spring undergoes reverse deformation, leading to different characteristics compared to normal hoists. The corresponding height in abnormal hoists is higher than that of normal hoists.
Based on the characteristics of unloading, the suspension model imposes physical restrictions on normal hoists, such as weight and height. On the other hand, abnormal situations can be identified by the suspension model based on the characteristics of calculated load weight and other physical quantities. However, due to the complexity of on-site conditions, similarities in many features between normal and abnormal hoists can result in false positives. To improve the accuracy of detection, a more precise XGBoost model [32] is employed due to its high reliability, low computational time complexity, and high accuracy [33].
3. Detection Algorithm for Abnormal Hoists
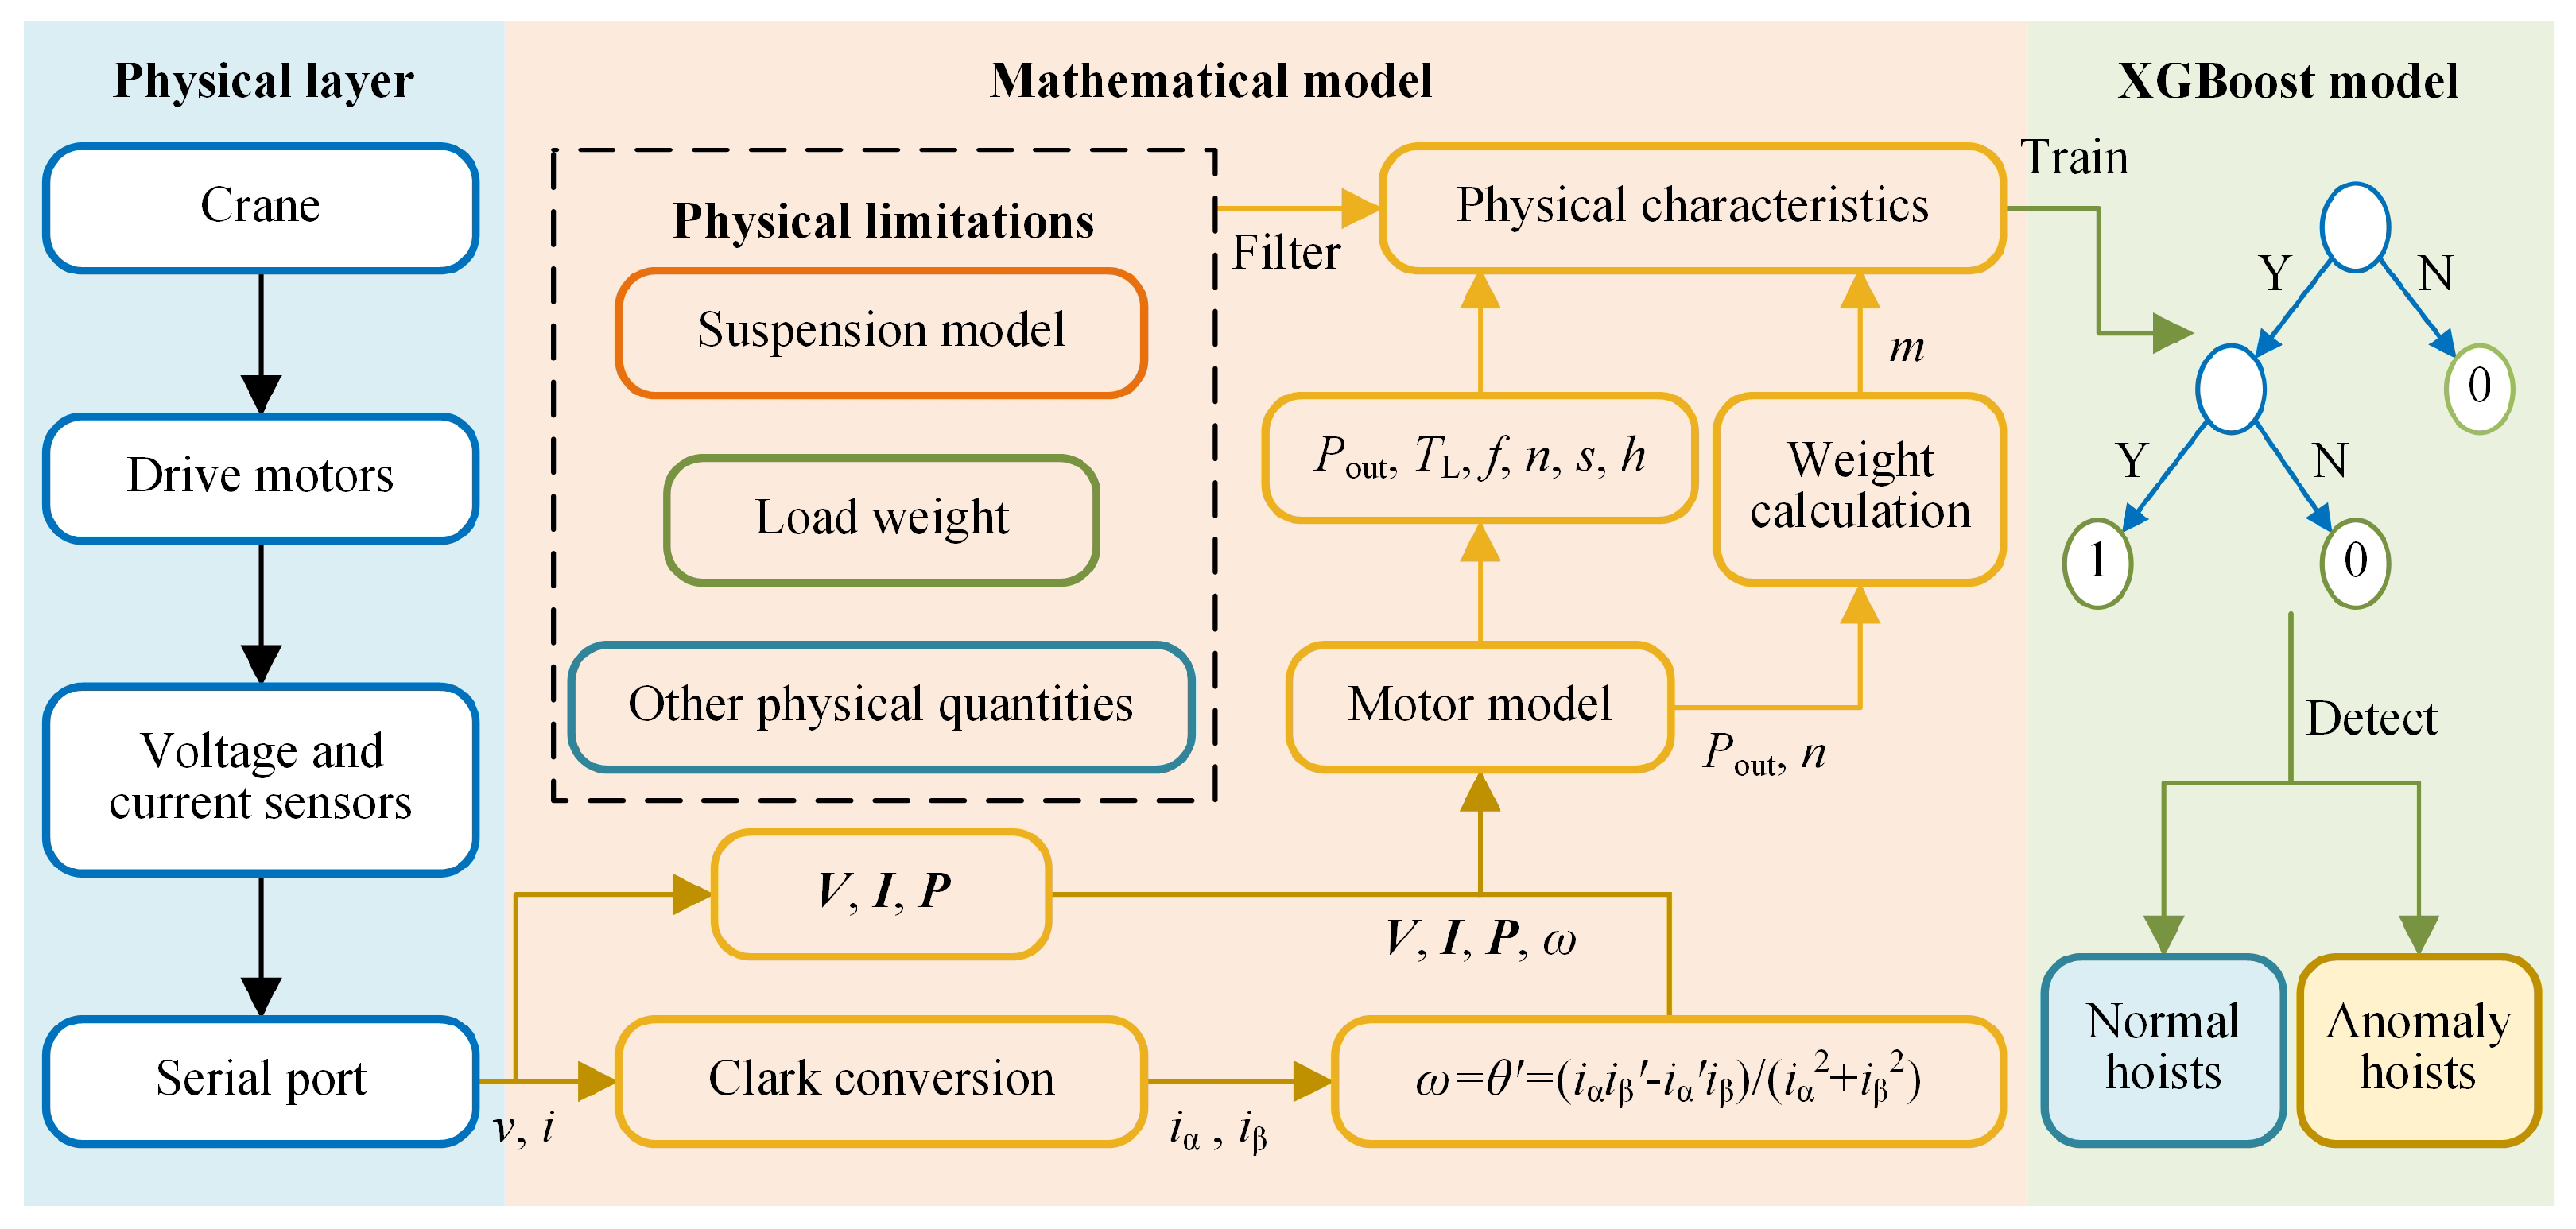
In this paper, cranes are driven by induction motors. The voltage and current signals of these motors are gathered using Hall sensors and transmitted via serial ports to microcomputers. Their physical characteristics are calculated by the motor model and the weight calculation algorithm. Furthermore, the characteristics are then filtered by physical limitations using the suspension model, load weight, and other physical quantities. To identify abnormal hoists, the XGBoost model is trained using the filtered characteristics. The structure of the proposed algorithm is depicted in Figure 5. The proposed approach recognizes abnormal hoists by using both the mathematical model and the XGBoost model. For hoists identified as normal by the mathematical model, the XGBoost model ceases further computations. Alerts are sent to the control systems of cranes and unloading operations are shut down in a timely manner when exceptions are identified. During detection, the mathematical model processes datasets and improves the physical information, thereby enhancing the training datasets for the XGBoost model.

Figure 5.
Structure of the algorithm proposed in this paper.
3.1. Events and Samples
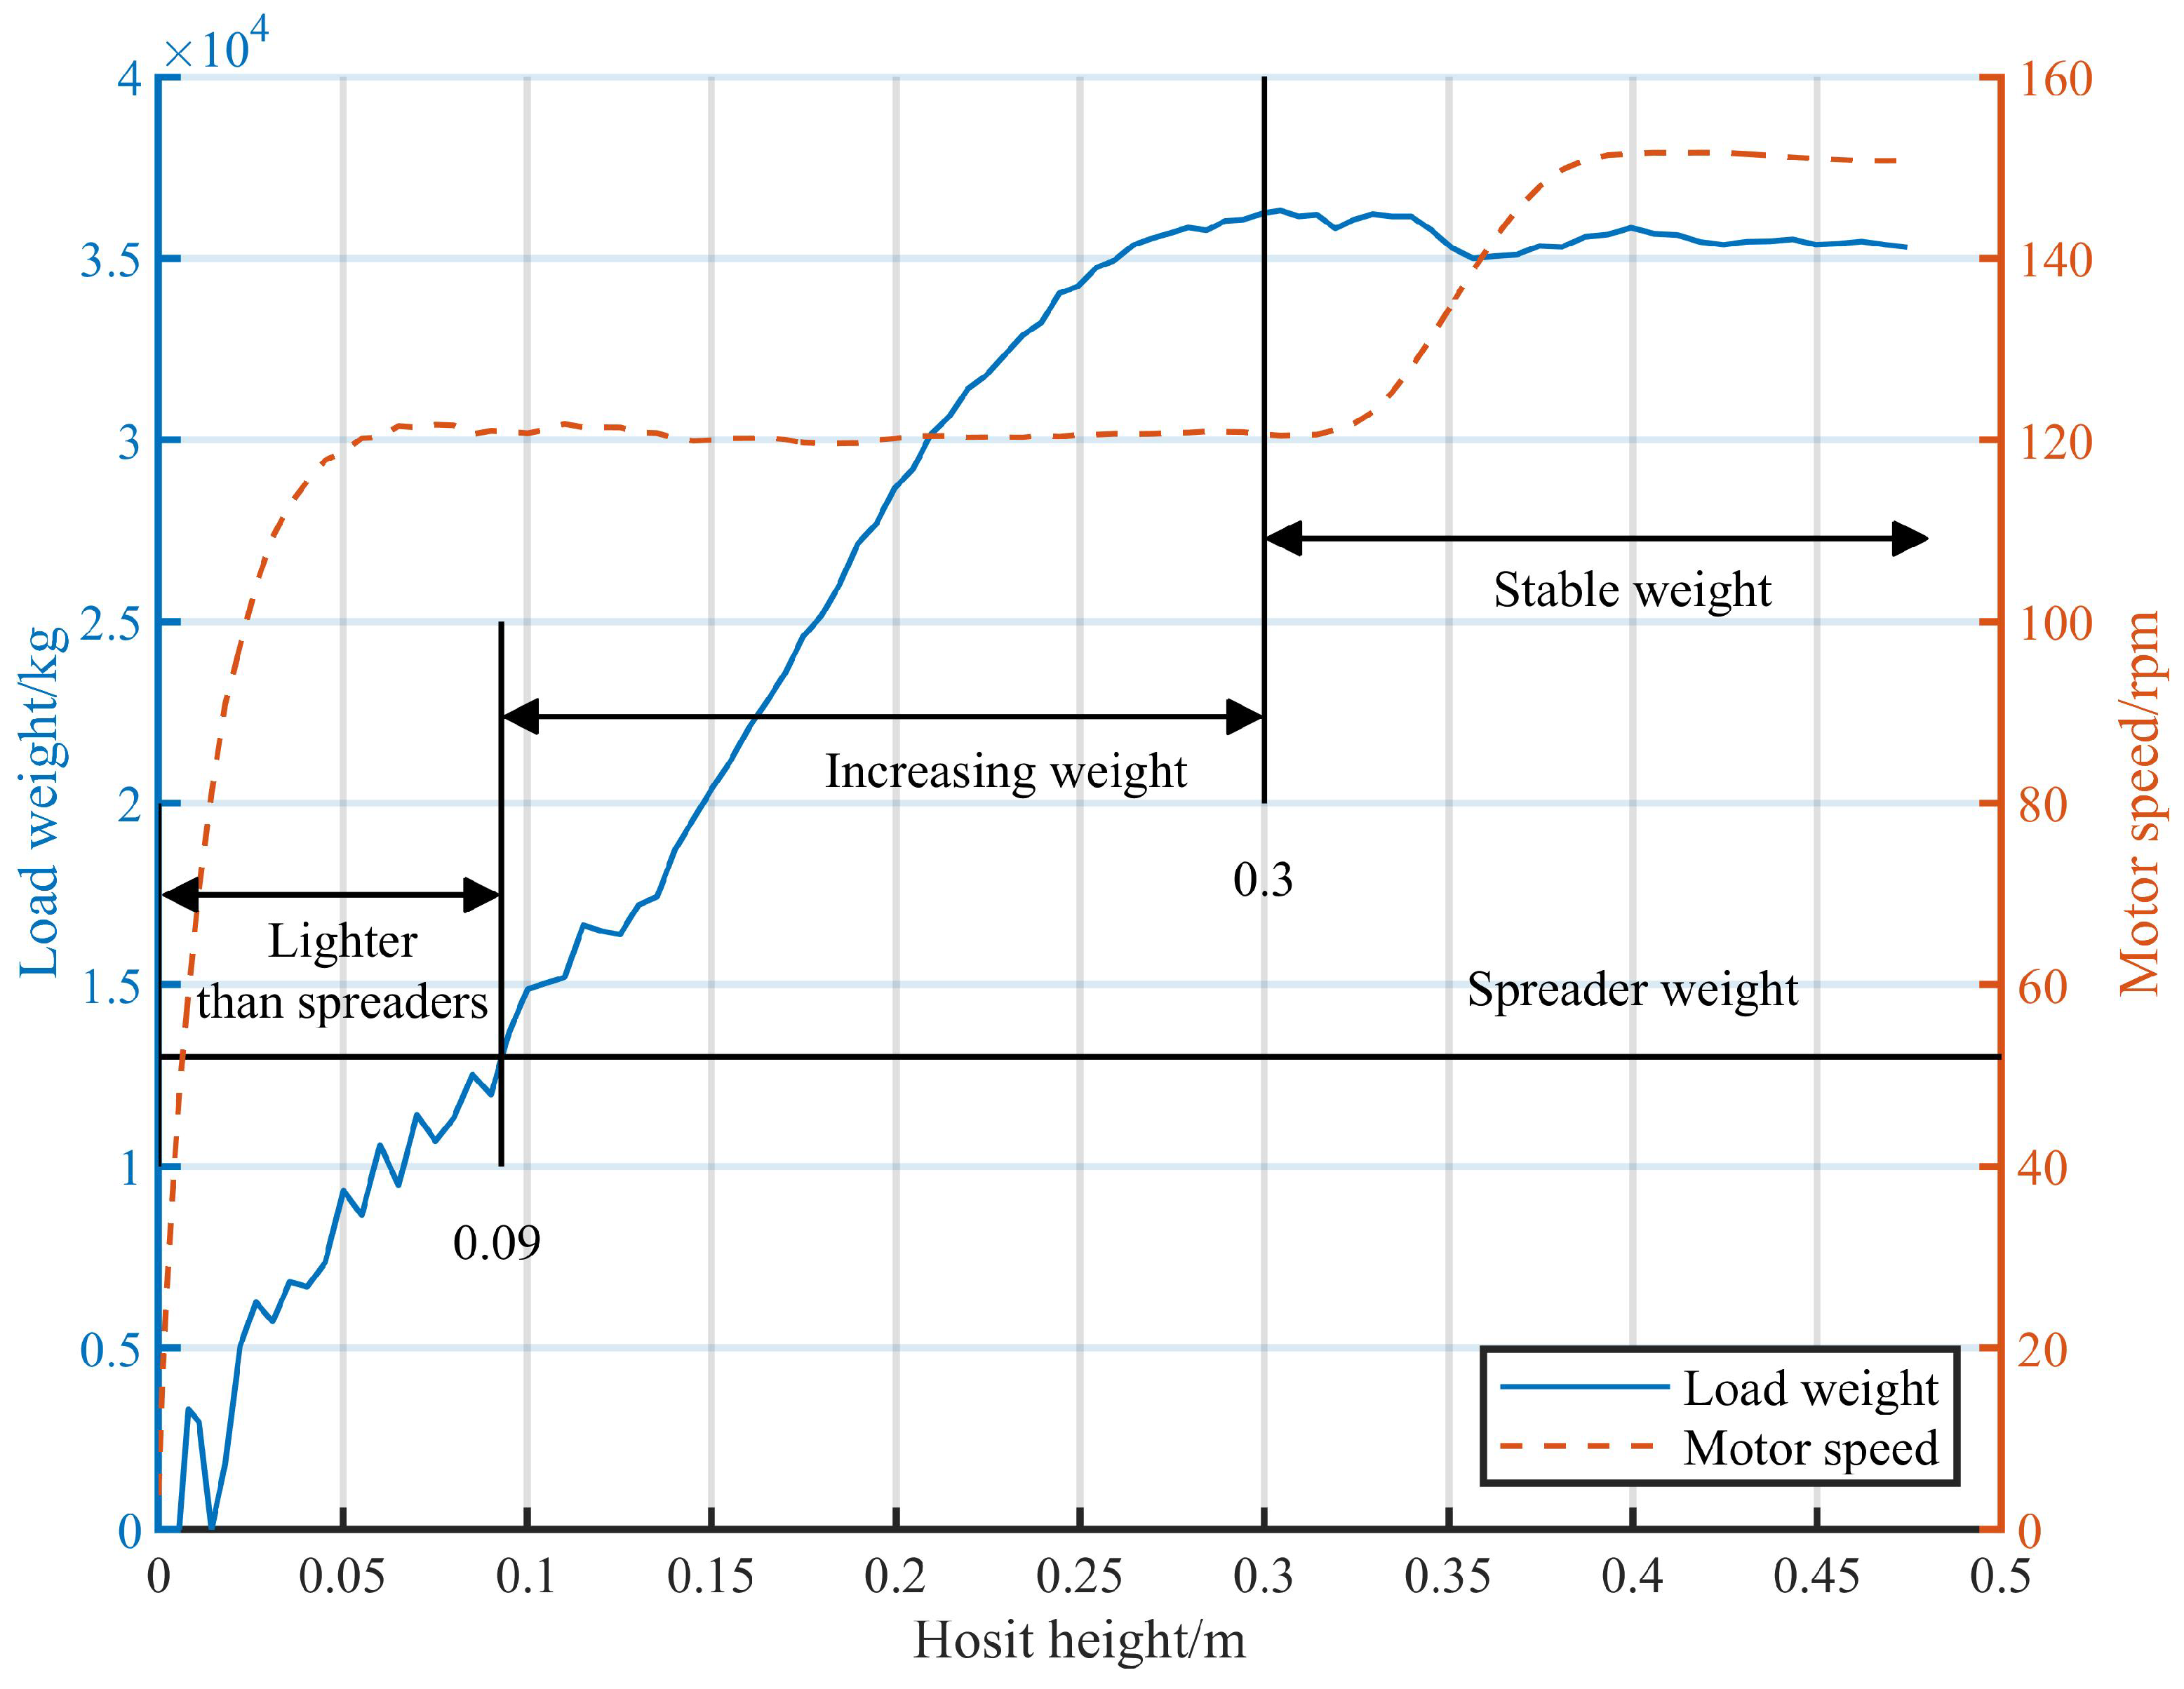
The continuous monitoring of the electrical signals in the motors is conducted via Hall sensors. Since signals only contain slight noise during the idle state of cranes, hoists can be discernible by analyzing variations in voltage and current. In order to improve the reliability of detection results, this study carries out periodic detections at 0.05-s intervals during the entire hoisting process. Detections persist until the given termination conditions have been satisfied. For the identification of initiation and conclusion timings, a single hoist can be divided into three stages, as shown in Figure 6.

Figure 6.
Schematic diagram of the three hoisting stages.
The three hoisting stages can be defined as follows:
- Lighter than spreaders: A wire rope is straightened gradually, during which the load weight m is less than the spreader weight, which occurs within the range of the x-axis, from 0 to 0.09, as depicted in Figure 6;
- Increasing weight: The container ascends slowly until lifted off the ground or the truck completely, throughout which the load weight m gradually increases within the range of the x-axis, from 0.09 to 0.3, as shown in Figure 6;
- Stable weight: Entire load is off the ground and m is relatively stable within the range beyond 0.3 on the x-axis, as shown in Figure 6.
It can be inferred that the hoisting statuses of trucks are indicated during the increasing weight stage, in which detection data are gathered. Each detection collects 3 s of data and terminates upon the satisfaction of the given load weight conditions. In this paper, the term “sample” denotes the data utilized in each individual detection, whereas an “event” is defined as the aggregate of samples from a single hoisting instance. In addition, positive and negative denote normal and abnormal events, respectively.
Detection samples are represented by matrices in this paper. These matrices are the fundamental units for detection analysis and consist of physical time series data (, , , , , f, n, s, h, and m). To standardize the length of detection data, a sliding window method is employed to gather the sample data.
3.2. Mathematical Model Detection
The mathematical model extends the physical information of raw data and improves the training datasets for the XGBoost model. Moreover, the mathematical model provides a coefficient matrix and a detection threshold vector for detection, where c is the number of constraints and d is the length of the input vector.
For a vector extracted from a sample , the detection result given by the mathematical model is
where , , , denotes the ith element of vector , and indicates the satisfaction of the jth condition, , , , and .
To minimize false positives (FPs) and false negatives (FNs), outcome averaging is employed across multiple samples to obtain the detection result of an event. Additionally, a relatively strict threshold is set to prevent FNs as much as possible. The overall abnormality degree for an event can be represented by in the mathematical model, where N is the number of samples in an event.
Due to the difficulty in collecting abnormal samples, a significant imbalance can be observed between normal and abnormal samples. Moreover, the quality of normal samples varies widely. The primary function of the mathematical model lies in the exclusion of low-quality normal samples from training sets and preliminary detections during runtime.
3.3. Mathematically Enhanced XGBoost Algorithm for Truck Hoisting Detection
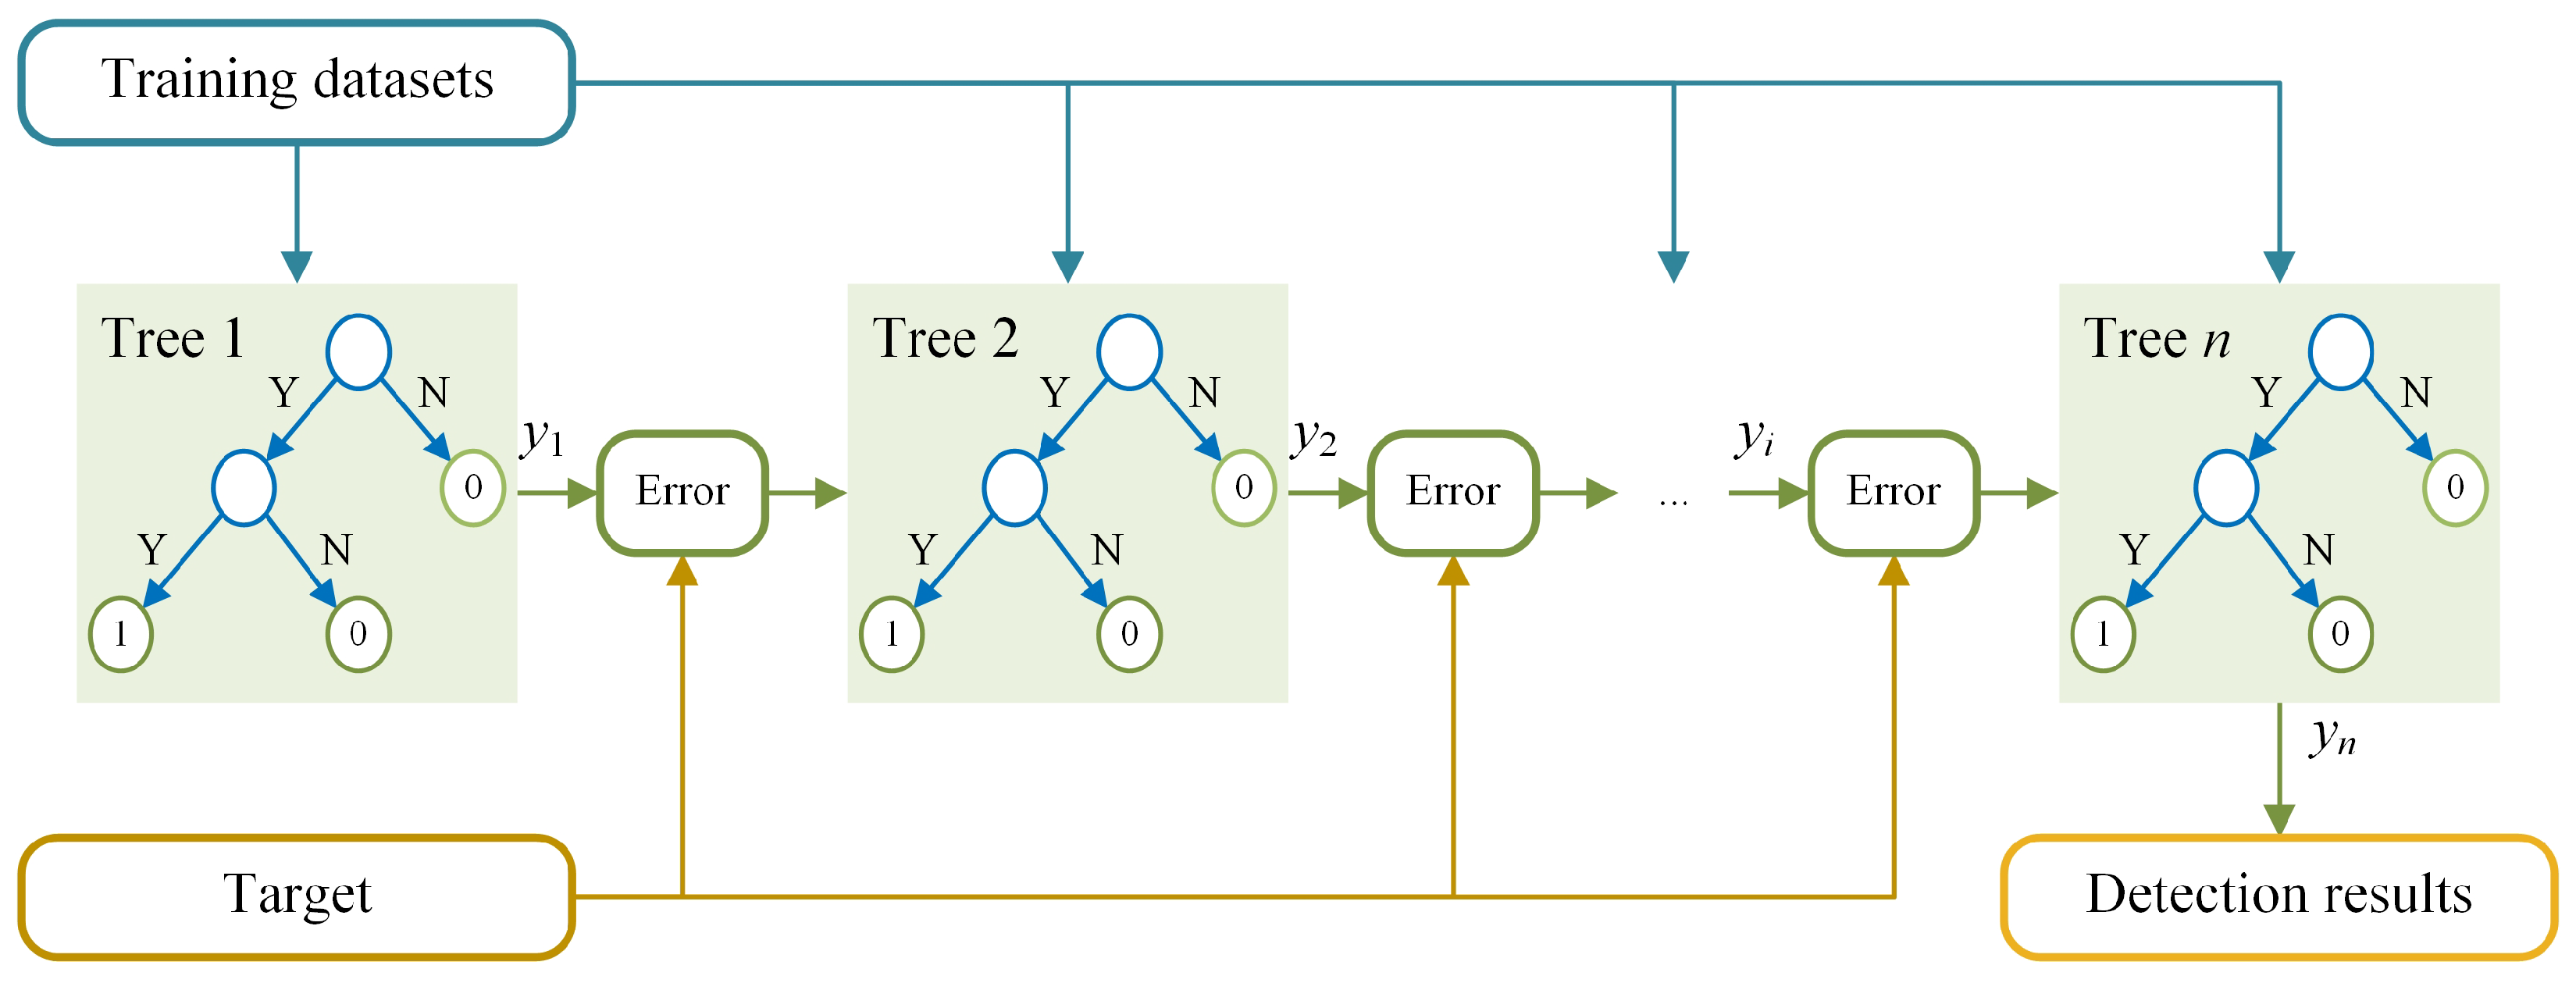
The mathematical model can identify most normal events, while for complex examples, it can yield false results. In order to reduce FPs and FNs, the XGBoost model is trained based on improved datasets. In this paper, Optuna [34,35] is used to run hyperparameter optimization and search for the optimal hyperparameters of the XGBoost model via cross-validation. The XGBoost model consists of a series of CART decision trees, as shown in Figure 7.
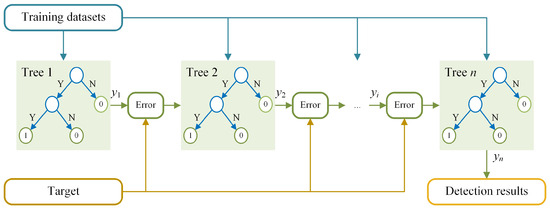
Figure 7.
Structure of XGBoost model.
Utilizing training datasets , new trees are generated based on errors between previous results and the target. Furthermore, the XGBoost model aggregates the results of each tree to obtain an overall prediction.
For a given input vector , the detection result produced by XGBoost can be described by
where represents the jth decision tree and denotes the parameters of the decision tree.
Similar to the results of mathematical model, the XGBoost model uses the average abnormality degree and abnormality threshold for the entire hoisting event.
Since the training datasets for the XGBoost model are constructed using the mathematical model, the detection order of the two models cannot be swapped during actual testing. The detection result for a hoisting event can be expressed as
4. Experiments
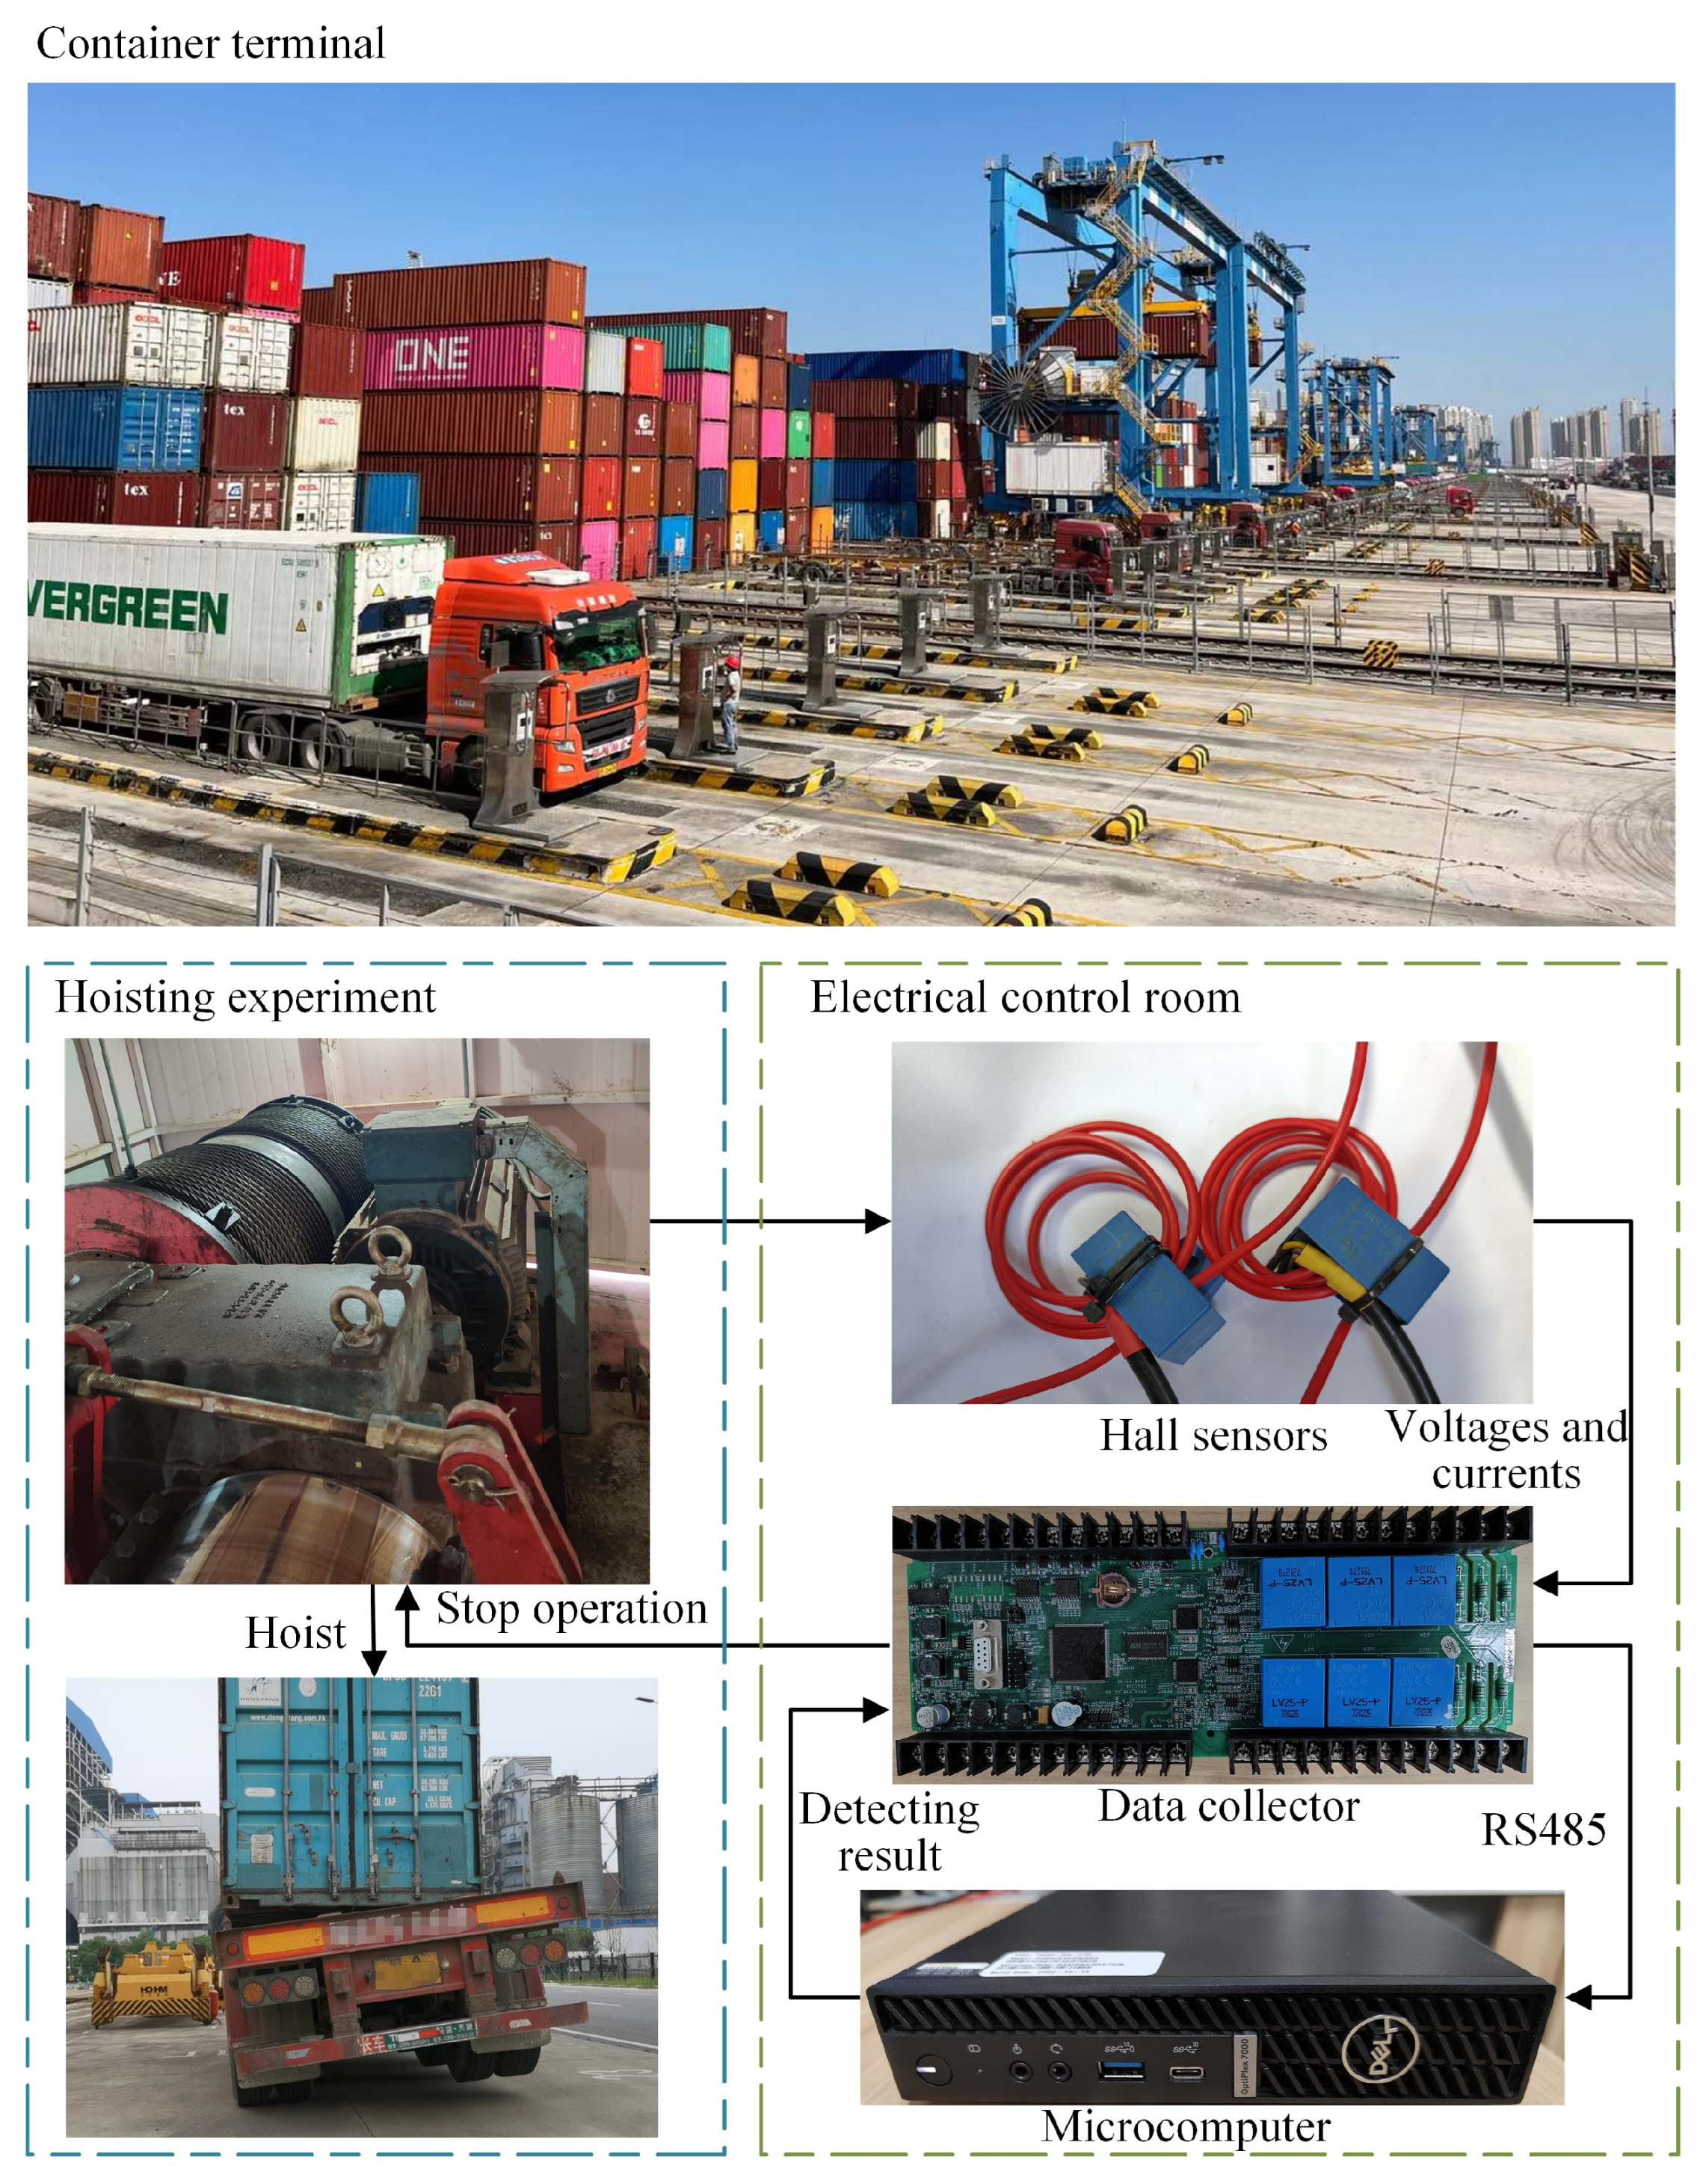
The detection algorithm was deployed in a number of container terminals to verify its accuracy through experiments. A schematic diagram of the field experiments is shown in Figure 8.

Figure 8.
Schematic diagram of the field experiments.
4.1. Assessment Metrics
The false positive rate (FPR) and false negative rate (FNR) of all events were used as direct indicators for evaluating model effectiveness. FPR represents the probability of incorrectly predicting a sample or an event as positive among all negative instances. FPR and FNR can be calculated using and , where true negatives (TNs) denote correctly predicted negative instances and true positives (TPs) are correctly predicted positive instances.
Considering that an event comprises multiple samples, the FPRs and FNRs for samples were also calculated. Due to the substantial imbalance between normal and abnormal datasets in this study, both the FPRs and FNRs were significantly influenced by the chosen threshold. Consequently, this study employed the area under the receiver operating characteristic curve (AUROC) [36,37] as it is an evaluative measure that is unaffected by threshold values.
In a receiver operating characteristic (ROC) curve [38,39], the horizontal and vertical axes represent FPR and true positive rate (TPR) at different thresholds, respectively, where FPR and TPR pertain to samples. TPR can be calculated using .
4.2. Collection of Datasets
Raw data were collected via the monitoring of standard operations and truck hoisting experiments under different conditions. Since numerous factors can affect the characteristics of operations, this study obtained more comprehensive datasets by altering containers, hoisting speeds, and twist locks.
Among the three considered factors, the differences in twist locks could be divided into six cases, as shown in Figure 9.
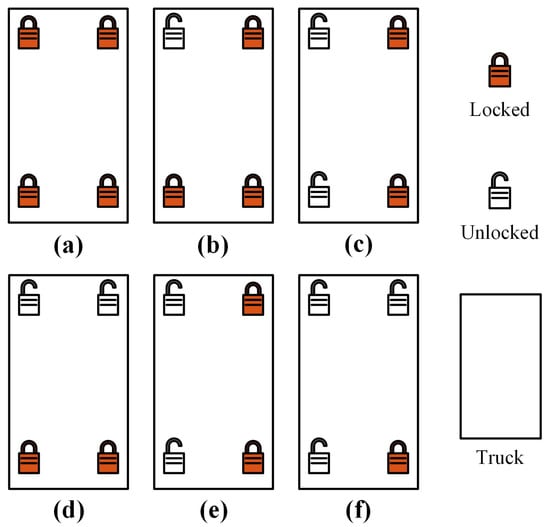
Figure 9.
Top-down views of the six cases of twist locks: (a) all four twist locks are locked; (b) three twist locks are locked; (c) two diagonal twist locks are locked; (d) two twist locks on the short side of the container are locked; (e) two twist locks on the long side of the container are locked; (f) one twist lock is locked.
This study conducted a series of experiments by modifying containers, hoisting speeds, and twist locks. The detailed experimental procedures was as follows:
- Equipment preparation: The experimental equipment encompassed a truck and a container. It was imperative to ensure that the twist locks were functional and have replacement locks readily available. Subsequent to the preparation of the experimental equipment, a crane operator positioned a container on a truck smoothly and awaited the ground operator to fasten the twist locks.
- Hoisting simulation: The crane operator hoisted the container from the truck, ensuring that the hoisting time exceeded 3 s while maintaining safety precautions. The detection system activated an alarm and restricted the ascent of the spreader when anomalies were identified. Subsequently, the crane operator lowered the container slowly in response to the alarm. When the truck was about to exceed the maximum safe height without triggering an alarm, the lifting operation was promptly terminated.
- Experiment repetition: Steps 1 and 2 were repeated, varying the twist locks and hoisting speeds.
Following the completion of experiments on one current container, it was replaced with another container and the aforementioned steps were repeated.
4.3. Ablation Experiments
This study conducted six experiments using data from the Wuhan region. Improvements in the mathematical model were assessed by comparing the AUROCs of different models. Experiments 1, 2, and 3 were conducted without applying the mathematical model in the detection process, while experiments 4, 5, and 6 employed the mathematical model. The detailed results for each experiment are presented in Table 3.
Table 3.
Results of the ablation experiments.
Experiments 1, 2, and 3 demonstrated significant improvements in model performance through the utilization of the PQ training datasets. This conclusion was further reinforced by the comparative analysis of experiments 5 and 6 against experiment 4, where the former models demonstrated superior efficacy. Both sets of experiments underscored that the employment of the mathematical model could highlight data characteristics effectively. This enhancement facilitated the differentiation between normal and abnormal samples, resulting in models with improved performance.
Datasets are characterized by a significant imbalance between normal and abnormal events in this paper. The positive cooperation of both port personnel and truck drivers was essential for the collection of experimental data. The elevated hazard factor further intensified the challenges associated with collecting a substantial volume of abnormal data. Moreover, the instances of unloading containers from container trucks were relatively scarce within normal events, resulting in an uneven distribution of normal training data. The initial normal datasets comprised operations involving the unloading of containers from trucks, hoisting containers from the yard, and the hoisting of spreaders. The low quality of these datasets constrained the performance of the models.
In comparison to the models employed in experiments 1, 2, and 3, each model in experiments 4, 5, and 6 demonstrated distinct improvements in performance. The models employed in experiments 4, 5, and 6 utilized datasets filtered by the mathematical model, with preliminary predictions applied to samples during the detection process. Conversely, the models for experiments 1, 2, and 3 utilized datasets without prior filtering. The mathematical model could effectively address the issues of data imbalance and low quality by filtering the normal datasets. The quality of the filtered datasets was enhanced, better reflecting the distinction between normal and abnormal events, consequently leading to improved model performance. This enhancement is illustrated in the ROC curves presented in Figure 10. The ROC curves in Figure 10 illustrate the relationships between the true positive rates and false positive rates in the six experiments. The false positive rate is related to the setting of an abnormality threshold, where a higher abnormality threshold leads to a lower false positive rate. However, a larger abnormality threshold also results in a lower true positive rate, indicating a higher false negative rate. The ROC curve for experiment 6 reaches above the other curves over much of the x-axis range, which indicates that the model in experiment 6 had better results across a wide range of abnormality thresholds.
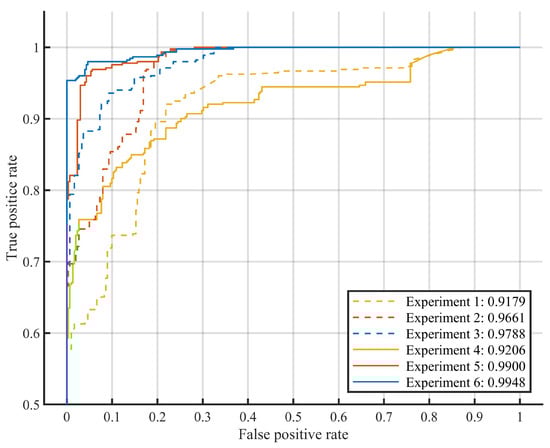
Figure 10.
ROC curves of the models.
4.4. Assessments
The proposed approach in this study was implemented on cranes across several cities (Ningbo, Qingdao, Wuhan, and Qinzhou) to continuously monitor the routine operations of cranes. Across these cities, the variables under measurement included containers, hoisting speeds, and the positions and quantities of twist locks. The same truck was employed in each city for abnormal data collection and various other data were collected by altering the measured variables. During the collection of normal data, no interventions were made to the cranes, allowing them to maintain regular operation. Detailed information about the cranes and motors was collected at each station to calculate the corresponding parameters for the mathematical model. A set of data was collected for the purpose of training the XGBoost model. In addition, adjustments were made to parameters like hoisting speed and the weight of the spreader, ensuring the adaptability of the proposed approach for various stations.
Throughout the monitoring period, no incidents of truck hoisting occurred. Therefore, we conducted experiments on trucks hoisting following the steps detailed in Section 4.1 to evaluate the FNRs of the models across different regions. The results of these regional experiments are presented in Table 4 and Table 5.
Table 4.
Results of regional assessments for events.
Table 5.
Results of regional assessments for samples.
Regarding the detection of events, the approach demonstrated an FPR below 0.7% across all regions and a zero FNR, as shown in Table 4. While sample detection encountered occasional false negatives, as shown in Table 5, the aggregate processing of multiple samples effectively mitigated the oversight of abnormal events. In order to decrease false negative instances, further analysis will be conducted on the false negative samples and greater weight will be assigned to them in subsequent training phases. Consequently, the approach ensures consistently low FPRs in the routine operations of cranes while being responsive to the hoisting of trucks, thus offering a protective measure for port security.
5. Conclusions
This paper introduced a detection algorithm for the hoisting of trucks based on electrical signals. The approach utilizes sensors to collect input current and voltage data from drive motors, without relying on visual, rotational speed, position, tension, or pressure sensors. A mathematical model is employed to compute operational state information during the hoisting process. By expanding the data dimensions, additional pertinent physical information is extracted, thereby reducing the time costs of information acquisition. The approach combines this mathematical model with an XGBoost model, demonstrating low computational complexity and improved accuracy.
Microcomputers and data collectors were installed on several cranes in this study. The algorithm was deployed on microcomputers and the effectiveness and accuracy of the proposed method were experimentally validated. The experimental results demonstrated that the detection algorithm in this study had no false negative events. Furthermore, the detection algorithm exhibited an overall false positive rate of below 1% over a continuous operational period. The algorithm sends an alarm signal to the crane control system to stop the hoisting operation when an anomaly is detected. The identification and alarm processes operate expeditiously, thereby ensuring the height of the truck stays within a safe threshold.
In summary, the proposed approach employs maintenance-free sensors and possesses multiple advantages, including convenient deployment, negligible interference from device operation, computational simplicity, and high accuracy. Moreover, the approach could be employed to ensure the safety and loading efficiency of hoisting processes, which holds significant economic and social value. Future research will focus on how to improve the portability of the proposed approach, so that the approach can be deployed and used directly in new stations with a few or even no experiments. Considering the distinctions between the drive motors of different cranes, we intend to map these motors to the same standard based on the rated parameters of the motors. As accuracy requirements continue to increase, we will also use different noise reduction methods and more accurate sensors. In addition, accuracy needs to be further improved and we hope to explore the applicability of the proposed method in different scenarios, such as unloading containers from trains, ships, etc.
Author Contributions
Conceptualization, G.-P.L., W.H. and Z.L.; methodology, N.W.; software, N.W.; validation, N.W. and Z.L.; formal analysis, G.-P.L. and W.H.; resources, G.-P.L. and W.H.; data curation, N.W.; writing—original draft preparation, N.W.; writing—review and editing, N.W., W.H., G.-P.L. and Z.L.; visualization, N.W.; supervision, Z.L.; project administration, W.H. All authors have read and agreed to the published version of the manuscript.
Funding
This research was funded by the Natural Science Foundation of China (Nos. 62073247, 62103308, 62173255, and 62188101).
Institutional Review Board Statement
Not applicable.
Informed Consent Statement
Not applicable.
Data Availability Statement
Embargo on data due to commercial restrictions.
Acknowledgments
We would like to thank Shenzhen Celijia Control Technology Co., Ltd. for their help with data collection and equipment in this research. In addition, Jiajie Liu, Liwei Xue, Shengwang Ye, Weijun Yin, and Xiaoran Dai provided valuable suggestions on the structure and language of this paper, for which we are sincerely grateful.
Conflicts of Interest
The authors declare no conflicts of interest.
Abbreviations
The following abbreviations are used in this manuscript:
| XGBoost | Extreme gradient boosting |
| PSLS | Method utilizing photoelectric sensors and laser scanners |
| RMS | Root mean square |
| CLWD | Crane load weight detection method |
| TP | True positive |
| FP | False positive |
| TN | True negative |
| FN | False negative |
| FPR | False positive rate |
| FNR | False negative rate |
| TPR | True positive rate |
| ROC | Receiver operating characteristic |
| AUROC | Area under ROC curve |
| EQ | Electrical quantities (, , and ) |
| MM | Mathematical model |
| PQ | Physical quantities calculated by MM (, , f, n, s, h, and m) |
References
- Zhang, Y.; Huang, Y.; Zhang, Z.; Postolache, O.; Mi, C. A vision-based container position measuring system for ARMG. Meas. Control. 2023, 56, 596–605. [Google Scholar] [CrossRef]
- Wang, Q.; Zheng, J.; Lu, B. Liner shipping hub location and empty container repositioning: Use of foldable containers and container leasing. Expert Syst. Appl. 2024, 237, 121592. [Google Scholar] [CrossRef]
- Yao, L.; Zheng, H.; Liu, Y.; Li, D.; Zhao, Y. Yard Crane Rescheduling under the Influence of Random Fault. Machines 2023, 11, 580. [Google Scholar] [CrossRef]
- Budiyanto, M.A.; Fernanda, H. Risk assessment of work accident in container terminals using the fault tree analysis method. J. Mar. Sci. Eng. 2020, 8, 466. [Google Scholar] [CrossRef]
- Li, H.; Zhang, X.; Gao, J. A Design Method of Active Photoelectric Detection Sensor Based on 1-D Multiunit pin Detector and Its Detection Model. IEEE Sens. J. 2022, 22, 21600–21612. [Google Scholar] [CrossRef]
- Fan, J.; Wei, J.; Huang, H.; Zhang, D.; Chen, C. IRSDT: A Framework for Infrared Small Target Tracking with Enhanced Detection. Sensors 2023, 23, 4240. [Google Scholar] [CrossRef]
- Chen, Y.; Lin, J.; Liao, X. Early detection of tree encroachment in high voltage powerline corridor using growth model and UAV-borne LiDAR. Int. J. Appl. Earth Obs. Geoinf. 2022, 108, 102740. [Google Scholar] [CrossRef]
- An, J. Traversable Region Detection and Tracking for a Sparse 3D Laser Scanner for Off-Road Environments Using Range Images. Sensors 2023, 23, 5898. [Google Scholar] [CrossRef]
- Stillinger, T.; Rittger, K.; Raleigh, M.S.; Michell, A.; Davis, R.E.; Bair, E.H. Landsat, MODIS, and VIIRS snow cover mapping algorithm performance as validated by airborne lidar datasets. Cryosphere 2023, 17, 567–590. [Google Scholar] [CrossRef]
- Yang, C.; Xia, Y. Interval Pareto front-based multi-objective robust optimization for sensor placement in structural modal identification. Reliab. Eng. Syst. Saf. 2024, 242, 109703. [Google Scholar] [CrossRef]
- Yang, C. Interval strategy-based regularization approach for force reconstruction with multi-source uncertainties. Comput. Methods Appl. Mech. Eng. 2024, 419, 116679. [Google Scholar] [CrossRef]
- Huang, Q.; Huang, Y.; Zhang, Z.; Zhang, Y.; Mi, W.; Mi, C. Truck-Lifting Prevention System Based on Vision Tracking for Container-Lifting Operation. J. Adv. Transp. 2021, 2021, 9612480. [Google Scholar] [CrossRef]
- Bautista, N.; Gutierrez, H.; Inness, J.; Rakoczy, J. Precision Landing of a Quadcopter Drone by Smartphone Video Guidance Sensor in a GPS-Denied Environment. Sensors 2023, 23, 1934. [Google Scholar] [CrossRef]
- Zhao, M.; Li, W.; Li, L.; Hu, J.; Ma, P.; Tao, R. Single-frame infrared small-target detection: A survey. IEEE Geosci. Remote. Sens. Mag. 2022, 10, 87–119. [Google Scholar] [CrossRef]
- Lin, S.; Zhang, M.; Cheng, X.; Zhou, K.; Zhao, S.; Wang, H. Hyperspectral Anomaly Detection via Sparse Representation and Collaborative Representation. IEEE J. Sel. Top. Appl. Earth Obs. Remote Sens. 2023, 16, 946–961. [Google Scholar] [CrossRef]
- Zuo, Y.; Guan, H.; Duan, F.; Wu, T. A Light Field Full-Focus Image Feature Point Matching Method with an Improved ORB Algorithm. Sensors 2022, 23, 123. [Google Scholar] [CrossRef] [PubMed]
- Li, L.; Han, L.; Ding, M.; Cao, H. Multimodal image fusion framework for end-to-end remote sensing image registration. IEEE Trans. Geosci. Remote Sens. 2023, 61, 5607214. [Google Scholar] [CrossRef]
- Gallego, G.; Delbrück, T.; Orchard, G.; Bartolozzi, C.; Taba, B.; Censi, A.; Leutenegger, S.; Davison, A.J.; Conradt, J.; Daniilidis, K.; et al. Event-based vision: A survey. IEEE Trans. Pattern Anal. Mach. Intell. 2020, 44, 154–180. [Google Scholar] [CrossRef] [PubMed]
- Li, X.; Li, C.; Rahaman, M.M.; Sun, H.; Li, X.; Wu, J.; Yao, Y.; Grzegorzek, M. A comprehensive review of computer-aided whole-slide image analysis: From datasets to feature extraction, segmentation, classification and detection approaches. Artif. Intell. Rev. 2022, 55, 4809–4878. [Google Scholar] [CrossRef]
- Chen, T.; Guestrin, C. Xgboost: A scalable tree boosting system. In Proceedings of the 22nd ACM SIGKDD International Conference on Knowledge Discovery and Data Mining, San Francisco, CA, USA, 13–17 August 2016; pp. 785–794. [Google Scholar]
- Parsa, M. A data augmentation approach to XGboost-based mineral potential mapping: An example of carbonate-hosted ZnPb mineral systems of Western Iran. J. Geochem. Explor. 2021, 228, 106811. [Google Scholar] [CrossRef]
- Zhang, J.; Ma, X.; Zhang, J.; Sun, D.; Zhou, X.; Mi, C.; Wen, H. Insights into geospatial heterogeneity of landslide susceptibility based on the SHAP-XGBoost model. J. Environ. Manag. 2023, 332, 117357. [Google Scholar] [CrossRef]
- Yu, H.; Qin, C.; Tao, J.; Liu, C.; Liu, Q. A multi-channel decoupled deep neural network for tunnel boring machine torque and thrust prediction. Tunn. Undergr. Space Technol. 2023, 133, 104949. [Google Scholar] [CrossRef]
- Van, N.; Van Thanh, P.; Tran, D.; Tran, D.T. A new model of air quality prediction using lightweight machine learning. Int. J. Environ. Sci. Technol. 2023, 20, 2983–2994. [Google Scholar] [CrossRef]
- Goswamy, A.; Abdel-Aty, M.; Islam, Z. Factors affecting injury severity at pedestrian crossing locations with Rectangular RAPID Flashing Beacons (RRFB) using XGBoost and random parameters discrete outcome models. Accid. Anal. Prev. 2023, 181, 106937. [Google Scholar] [CrossRef] [PubMed]
- Yakhni, M.F.; Cauet, S.; Sakout, A.; Assoum, H.; Etien, E.; Rambault, L.; El-Gohary, M. Variable speed induction motors’ fault detection based on transient motor current signatures analysis: A review. Mech. Syst. Signal Process. 2023, 184, 109737. [Google Scholar] [CrossRef]
- Sun, X.; Xu, N.; Yao, M. Sequential subspace optimization design of a dual three-phase permanent magnet synchronous hub motor based on NSGA III. IEEE Trans. Transp. Electrif. 2022, 9, 622–630. [Google Scholar] [CrossRef]
- Kou, F.; Wu, J.; Gao, J.; Wu, D.; Chen, R. Active Fault-Tolerant Control Based on the Fault of Electromagnetic Hybrid Active Suspension. Shock Vib. 2021, 2021, 1–16. [Google Scholar] [CrossRef]
- Yang, L.; Wang, R.; Ding, R.; Liu, W.; Zhu, Z. Investigation on the dynamic performance of a new semi-active hydro-pneumatic inerter-based suspension system with MPC control strategy. Mech. Syst. Signal Process. 2021, 154, 107569. [Google Scholar] [CrossRef]
- Fitzgerald, A.E.; Kingsley, C.; Umans, S.D. Fitzgerald & Kingsley’s Electric Machinery; McGraw Hill: New York, NY, USA, 2013. [Google Scholar]
- Wu, B.; Wei, Y.; Zhou, H.; Wei, Y.; Li, S. Crane Load Weight Detection Method, Device, Computer Equipment and Storage Medium. U.S. Patent 795,053,9B2, 31 May 2022. [Google Scholar]
- Ye, F.; Huang, C.; Cao, J.; Li, M.; Zhang, Y.; Lu, C. Attribute restoration framework for anomaly detection. IEEE Trans. Multimed. 2020, 24, 116–127. [Google Scholar] [CrossRef]
- Zeng, T.; Wu, L.; Peduto, D.; Glade, T.; Hayakawa, Y.S.; Yin, K. Ensemble learning framework for landslide susceptibility mapping: Different basic classifier and ensemble strategy. Geosci. Front. 2023, 14, 101645. [Google Scholar] [CrossRef]
- Akiba, T.; Sano, S.; Yanase, T.; Ohta, T.; Koyama, M. Optuna: A next-generation hyperparameter optimization framework. In Proceedings of the 25th ACM SIGKDD International Conference on Knowledge Discovery & Data Mining, Anchorage, AK, USA, 4–8 August 2019; pp. 2623–2631. [Google Scholar]
- Klaar, A.C.R.; Stefenon, S.F.; Seman, L.O.; Mariani, V.C.; Coelho, L.d.S. Optimized EWT-Seq2Seq-LSTM with attention mechanism to insulators fault prediction. Sensors 2023, 23, 3202. [Google Scholar] [CrossRef] [PubMed]
- Bentéjac, C.; Csörgo, A.; Martínez-Muñoz, G. A comparative analysis of gradient boosting algorithms. Artif. Intell. Rev. 2021, 54, 1937–1967. [Google Scholar] [CrossRef]
- Ferdowsi, S.; Knafou, J.; Borissov, N.; Alvarez, D.V.; Mishra, R.; Amini, P.; Teodoro, D. Deep learning-based risk prediction for interventional clinical trials based on protocol design: A retrospective study. Patterns 2023, 4, 100689. [Google Scholar] [CrossRef] [PubMed]
- Carrington, A.M.; Manuel, D.G.; Fieguth, P.W.; Ramsay, T.; Osmani, V.; Wernly, B.; Bennett, C.; Hawken, S.; Magwood, O.; Sheikh, Y.; et al. Deep ROC analysis and AUC as balanced average accuracy, for improved classifier selection, audit and explanation. IEEE Trans. Pattern Anal. Mach. Intell. 2022, 45, 329–341. [Google Scholar] [CrossRef]
- Min, H.; Fang, Y.; Wu, X.; Lei, X.; Chen, S.; Teixeira, R.; Zhu, B.; Zhao, X.; Xu, Z. A fault diagnosis framework for autonomous vehicles with sensor self-diagnosis. Expert Syst. Appl. 2023, 224, 120002. [Google Scholar] [CrossRef]

Disclaimer/Publisher’s Note: The statements, opinions and data contained in all publications are solely those of the individual author(s) and contributor(s) and not of MDPI and/or the editor(s). MDPI and/or the editor(s) disclaim responsibility for any injury to people or property resulting from any ideas, methods, instructions or products referred to in the content. |
© 2024 by the authors. Licensee MDPI, Basel, Switzerland. This article is an open access article distributed under the terms and conditions of the Creative Commons Attribution (CC BY) license (https://creativecommons.org/licenses/by/4.0/).