Article

Analytical Analysis of Factors Affecting the Accuracy of a Dual-Heat Flux Core Body Temperature Sensor

1
Institute of Metrology and Biomedical Engineering, Faculty of Mechatronics, Warsaw University of Technology, 02-525 Warsaw, Poland
2
Healthwear Sp. z o.o., 31-539 Cracow, Poland
*
Author to whom correspondence should be addressed.
Sensors 2024, 24(6), 1887; https://doi.org/10.3390/s24061887
Submission received: 23 February 2024 / Revised: 12 March 2024 / Accepted: 13 March 2024 / Published: 15 March 2024
(This article belongs to the Section Biomedical Sensors)

Abstract

:
Non-invasive core body temperature (CBT) measurements using temperature and heat-flux have become popular in health, sports, work safety, and general well-being applications. This research aimed to evaluate two commonly used sensor designs: those that combine heat flux and temperature sensors, and those with four temperature sensors. We used analytical methods, particularly uncertainty analysis calculus and Monte Carlo simulations, to analyse measurement accuracy, which depends on the accuracy of the temperature and flux sensors, mechanical construction parameters (such as heat transfer coefficient), ambient air temperature, and CBT values. The results show the relationship between the accuracy of each measurement method variant and various sensor parameters, indicating their suitability for different scenarios. All measurement variants showed unstable behaviour around the point where ambient temperature equals CBT. The ratio of the heat transfer coefficients of the dual-heat flux (DHF) sensor’s channels impacts the CBT estimation uncertainty. An analysis of the individual components of uncertainty in CBT estimates reveals that the accuracy of temperature sensors significantly impacts the overall uncertainty of the CBT measurement. We also calculated the theoretical limits of measurement uncertainty, which varied depending on the method variant and could be as low as 0.05 °C.

1. Introduction

Non-invasive continuous measurement of core body temperature (CBT) is used in a variety of applications, including control of body stress caused by exercise and weather, medical diagnostics, or assessment of thermal comfort.
The first area includes applications related to health protection against dangerous work conditions and work intensity. The significant burden placed on the body by effort and thermal conditions can be dangerous to health and life. Quantitatively measuring and rating this load is essential for people who work physically in hard conditions (such as high humidity and temperature), for example firefighters, soldiers, miners, and professional athletes. The quantitative assessment of thermal and physical exertion enables an objective rating of workload, while also reducing the risk of life-threatening situations. CBT increase is one of the symptoms of a heat-related illness [1]. Physiological load is related to many parameters, such as surface body temperature (SBT) and CBT, intensity of sweating, and heart rate. In the last few decades, many quantitative methods of assessing physiological load have been proposed. Among these methods, one should distinguish the Physiological Strain Index (PSI) proposed by Moran in 1998, which, despite a simple formula based only on CBT and heart rate, has shown its usefulness [2,3]. The method’s sensitivity to weather conditions, clothing (e.g., personal protective equipment), dehydration, and sex has been demonstrated. An update to the PSI to also consider skin temperature, proposed by Buller in 2016, showed strong sensitivity to clothing [4]. Despite all its advantages, a major problem in the common use of the PSI is the difficulty in measuring CBT while ensuring comfort and without interfering with the subject’s daily life. In sports medicine, the measurement of CBT is essential for assessing the risk of exercise-induced heat stroke, which can lead to an athlete’s death [5]. It is estimated that 1 in 1000 athletes exercising at high ambient temperatures will experience exercise-induced heat stroke. It is assumed that athletes whose internal body temperature exceeds 40 °C, and who exhibit symptoms of central nervous system disorders, should receive immediate medical care.
The second area includes medical applications. Continuous monitoring of CBT is not only useful in detecting and monitoring fever in infectious diseases but is also an important parameter in the evaluation of severe medical conditions such as sepsis [6]. The monitoring of daily temperature fluctuations has proved useful in assessing diurnal rhythm disturbances, which may cause mood swings, appetite disorders, affect work performance, and can be related to delayed phase syndrome, or be a symptom of mental or neurological conditions such as depression, bipolar affective disorder, or schizophrenia [7,8,9,10,11]. CBT may be useful in evaluating diets [12], assessing the menstrual cycle, predicting fertile days and timing of pregnancy, and detecting potentially threatened preterm labour [13,14]. It should be noted that the medical community has expressed a demand for new, more accurate solutions and standards in this area [15].
A literature review showed the existence of methods for contact CBT measurement using skin surface temperature sensors and heat flux through the surface of the body, which might be a solution for increasing the comfort of the measurement which is currently the main limitation to the wider application of the PSI [4,16,17,18,19,20]. The available results have shown that CBT measurement using such methods can provide accuracy as high as 0.09 ± 0.05 °C in laboratory conditions [21]. Accuracy achieved in clinical conditions is approximately ±0.3 °C [20,22]. The available data suggest that CBT can be measured using wrist-based sensors with an accuracy of <0.2 °C [23]. Importantly, several CBT sensors are commercially available, including Tcore (Dräger Medical GmbH, Lübeck, Germany), CORE (Greenteg, Rümlang, Switzerland), ScanWatch 2 (Withings, Issy-les-Moulineaux, France), Temple Touch Pro™ (Medisim, Beit-Shemesh, Israel), and BairHugger™ (3M™, Maplewood, MN, USA), of which the first three are wearable devices and last two are systems designed for hospitals.
The method for CBT measurement using a non-invasive sensor compromising the temperature and/or heat flux sensor is a relatively new area of scientific research, which is gaining the interest of research teams around the word. One direction is research of construction or technological modification, for example by developing flexible sensors [24,25], reducing sensitivity to convective conditions [26], or adapting sensors to the system requirements of the Internet of Things (IoT) [27]. Another fast-growing research area is the usability of such technology in clinical [28,29], sport [30], work safety [27] or free-living [26,31] applications. It is worth noting that new patents are also being sought, which confirms the commercial sector’s interest in this technology [32].
Measurement uncertainty is a crucial aspect of every measurement method. Therefore, the authors deemed it essential to investigate this aspect of dual-heat flux CBT estimation methods while also proposing some new modifications to the measurement methods. The authors are aware of only a single publication that analyses the factors impacting the measurement uncertainty of skin-contact thermal resistance [33]. Additionally, another publication examines the influence of sensor structure on measurement accuracy [22]. The aim of the work conducted and presented herein was to analyse the selected factors that influence the accuracy of the non-invasive CBT measurement using dual-heat flux sensors. Both commonly used CBT sensor designs were included in the research: one with two heat flux sensors and two temperature sensors and one with four temperature sensors. The factors analysed were the accuracy of temperature and flux sensors, as well as the mechanical construction parameters of sensors like the heat transfer coefficient, temperature of ambient air, and CBT value. The influence of these factors was assessed using analytical methods such as uncertainty analysis calculus and Monte Carlo simulations. The results of the experiments offer a valuable source of knowledge for engineers and scientists working on non-invasive CBT measurement methods.

2. Materials and Methods

A simplified model of the human body’s heat generation and distribution system was used, and CBT was assumed to be equal to the temperature of the blood perfusing through the hypodermis. The skin was considered as a thermally passive layer between blood and the environment (air). All layers (blood, skin, and air) were assumed to be infinite in directions orthogonal to tissue cross-section and the temperature of blood was constant in the whole layer. In such a system, CBT estimate (CBTe) can be expressed in terms of heat flux q flowing through the sensor, sensor heat transfer coefficient hs, and skin surface temperature Tss, as [17,20,21,34,35,36]:
C B T e = T s s + q h t
where CBTe—body core temperature estimate; Tss—temperature of skin surface; q—heat flux flowing through skin and sensor; and ht—heat transfer coefficient of the skin.
The heat flux q can be measured directly by the heat flux sensor placed between the skin and sensor material, or indirectly using two temperature sensors measuring the temperature difference between both sides of the sensor’s thermally resistive layer. It can be expressed as:
q = h s · ( T s s T s a )
where q—heat flux flowing through skin and sensor; hs—heat transfer coefficient of the thermally resistive layer of the sensor; and Tss and Tsa—temperature of the bottom (skin–sensor) and top (sensor–air) surfaces.
For clarity, the first variant of the single-flux method comprising a heat flux sensor and a temperature sensor will be denoted by the abbreviation “HT”, and the second variant comprising two temperature sensors will be denoted as “TT”.
Even though there are commercially available products using the method described above (single-flux method), like Tcore (Dräger Medical GmbH, Germany), the practical application of single-sensor CBT measurement devices is limited due to the dependence of the CBT estimate on the thermal properties of the skin (ht). As ht is a function of tissue thickness and thermal conductivity, the application of a single sensor is limited to the places in which variation of this parameter in population is narrow, e.g., the forehead. To overcome this limitation, the dual-heat flux method was introduced [17,21,35,37]. In this approach, two sensors positioned near each other are used (Figure 1).
If two heat flux sensors are used, two independent equations for CBTe can be formulated.
C B T e = T s s 1 + q 1 h t
C B T e = T s s 2 + q 2 h t
Using Equations (3) and (4), the formula for ht can be derived.
h t = q 1 q 2 T s s 1 T s s 2
Finally, the formulae for a CBT estimate independent of tissue properties can be obtained by substituting Equation (5) in Equation (3). If the HT configuration is used, the resulting equation is:
C B T e H T = T s s 1 + q 1 · ( T s s 1 T s s 2 ) q 2 q 1
If the TT configuration is used, Equation (6) can be expressed as:
C B T e T T = T s s 1 + ( T s s 1 T s a 1 ) ( T s s 1 T s s 2 ) k · ( T s s 2 T s a 2 ) ( T s s 1 T s a 1 )
where k is the characteristic parameter of the sensor and equals hs2/hs1.
One can notice that Equations (6) and (7) make use of the difference between temperature and heat flux measured in both channels. The error of this differential measure can be reduced by sensor pairing and estimating constant bias between both sensors. In the case of temperature sensors, this can be easily achieved by submerging both sensors in the same fluid, i.e., an oil bath, and measuring the difference between temperature readings from both sensors. Then, the correction factor can be introduced. If the initial bias between sensors is corrected, the only source of uncertainty of temperature difference is their internal noise. Theoretically, this can also be undertaken to reduce the error of heat flux difference measurement, but the process is more complex. For simplicity, in this work, only the influence of temperature difference calibration will be considered. As the uncertainty of measurement of the temperature difference will be different from absolute temperature measurement, the approach with a pair of calibrated sensors will be treated as another variant, for which Equations (6) and (7) are expressed as follows:
C B T e H T p = T s s 1 + q 1 · Δ T s s ( q 2 q 1 )
C B T e H T p = T s s 1 + Δ T s 1 · Δ T s s k · Δ T s 2 Δ T s 1
where:
Δ T s s = T s s 1 T s s 2
Δ T s 1 = T s s 1 T s a 1
Δ T s 2 = T s s 2 T s a 2
Equations (8) and (9) can be transformed as a function of the readings from temperature sensors other than Tss1. Equation (8) can be expressed as:
C B T e H T p = T s s 2 + q 2 · Δ T s s ( q 2 q 1 )
and Equation (9) can be transformed into three other forms:
C B T e T T p = T s s 2 + Δ T s s + Δ T s 1 · Δ T s s k · Δ T s 2 Δ T s 1
C B T e T T p = T s a 1 + Δ T s 1 + Δ T s 1 · Δ T s s k · Δ T s 2 Δ T s 1
C B T e T T p = T s a 2 + Δ T s s + Δ T s 2 + Δ T s 1 · Δ T s s k · Δ T s 2 Δ T s 1
Equations (8) and (13), as well as Equations (9), (14), (15), and (16), can be considered as independent measurements whose values can be averaged, which should reduce the CBT estimation uncertainty. The averaged results from the procedure will be termed CBTeHTpm when only Equations (8) and (13) are used, and CBTeTTpm when Equations (9), (14), (15), and (16) are used.
For clarity, all the used measurement strategies for which the uncertainty was validated are summed up in Table 1.

2.1. CBT Measurement Uncertainty Analysis

The influence of measurement setup parameters, such as ambient and CBT temperatures, values and ratios of the hs parameters of both channels and values of the uncertainty of input measurement factors, e.g., heat flux and temperature, was investigated using the Monte Carlo (MC) method. This method was chosen due to the high nonlinearity of Equations (6)–(9). Next, in the linear region of Equations (6)–(9) (estimated using MC simulation), the contribution of each uncertainty source to the total CBT measurement uncertainty was studied using the linearization method based on a first-order Taylor expansion of Equations (6)–(9). This analysis was carried out for the HT, HTp, TT, and TTp measurement strategies (Table 1).

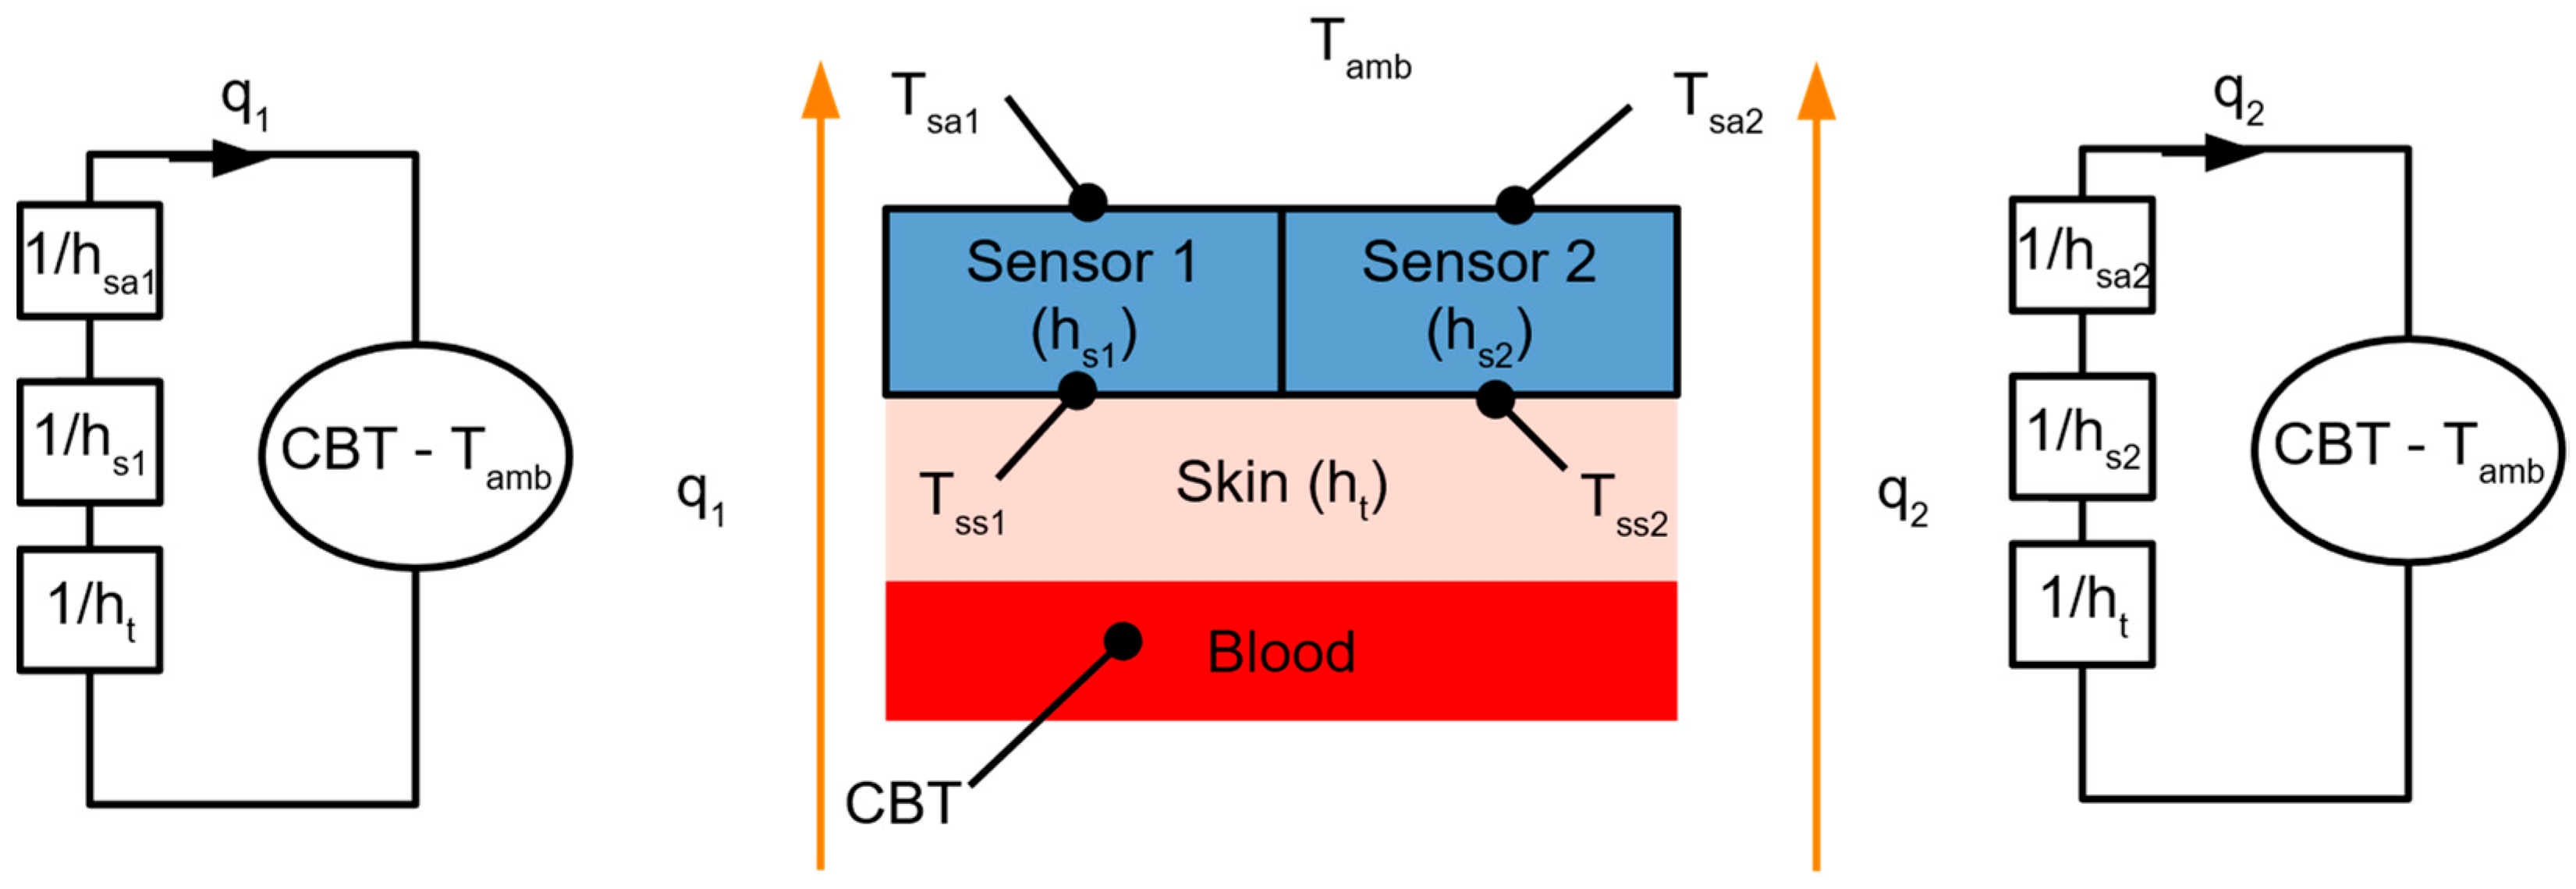
2.1.1. Measurement Setup

The estimation of CBT measurement uncertainty using the dual-flux method requires a prediction of the expected value of measurement from each sensor embedded in the dual-flux probe, i.e., the temperature and flux sensors. These values provided a reference to which random error was added to simulate the uncertainty of the measurements. The reference values of temperature and heat flux readings from each sensor composed into a dual-heat flux probe were calculated using simplified lumped models presented in Figure 1. The parameters of this model are presented in Table 2.
The calculation of the q1, Tss1, and Tsa1 in channel 1 was conducted according to the following equations:
h 1 = 1 1 h t + 1 h s 1 + 1 h s a
q 1 = h 1 · ( C B T T a m b )
T s s 1 = C B T q 1 h t
T s a 1 = T s s 1 q 1 h s
An analogous calculation leads to values of q2, Tss2, and Tsa2 in the second channel of the probe.
Using the above methodology, a simulation of the expected values of the q1, q2, Tss1, Tss2, Tsa1, and Tsa2 for different values of Tamb and CBT was conducted. The influence of Tamb and CBT values was investigated independently in the ranges of −15 °C to +45 °C and 35 °C to 42 °C, respectively.

2.1.2. Monte Carlo Analysis

The main procedure of CBT uncertainty estimation involves the following steps: calculation of the expected (error-free) values of measurements (using Equations (18)–(20); calculation of the noisy values of the measurements by adding a random value to each measurement (as described below); calculation of the CBT value estimate for each measurement variant (Table 1) using Equations (6)–(16) and noisy values of the heat flux and temperature measurement; and calculation of the CBT estimation error by subtracting the CBT referential value from the CBT estimate. This procedure was repeated 10,000 times for each set of the experimental setup parameters (Table 1 and Table 2), while the value of the noise was sampled from Gaussian distribution (Table 3). The CBT estimate uncertainty was estimated for the selected measurements variant (Table 1) as the standard deviation of estimate errors from 10,000 repetitions. The CBT estimate uncertainty estimation was repeated 100 times to estimate the repeatability of MC analysis results. Finally, the mean muCBT and standard deviation suCBT of the CBT estimate uncertainty derived for 100 trials were calculated. The muCBT constitutes the prediction of the standard uncertainty value of the CBT estimate using selected measurement variants and the measurement setup parameter values. The suCBT is the measure of the repeatability of the MC simulation for a given measurement method and setup configuration and can be used as a measure of confidence in the estimation of the muCBT. The noisy measurements were calculated by assuming that the error values originate from a normal distribution with a mean value of 0. The standard deviation for each type of error source is denoted as uT, uΔT, uq, and uh, representing measurement errors of non-paired temperature, differential temperature using paired sensors, heat flux, and heat transfer coefficient of measurement channels, respectively. The default values for these uncertainties, along with their justifications, are presented in Table 3.
Using the MC method, the impact of serval factors on CBT estimation uncertainty was investigated. The study was divided into a series of independent experiments. In each experiment, only the value of one parameter of the measurement setup was changed while other parameters presented in Table 2 and Table 3 were set to their default values. The list of all conducted experiments is presented in Table 4.

2.1.3. First-Order Tylor Series Expansion

For the dual-flux sensor in HT with non-paired temperature sensor configuration (Equation (6)), the combined uncertainty uCBTeHT can be expressed using first-order Tylor series expansion as:
u C B T e H T ( T s s 1 , T s s 2 , q 1 , q 2 ) = ( δ C B T e H T δ T s s 1 ) 2 · u T 2 + ( δ C B T e H T δ T s s 2 ) 2 · u T 2 + ( δ C B T e H T δ q 1 ) 2 · u q 2 + ( δ C B T e H T δ q 2 ) 2 · u q 2
where uT and uq—measurement uncertainty of the applied temperature and heat flux sensors, which were assumed to be identical for all heat flux and temperature sensors.
The ratio between each factor uncertainty component and total uncertainty was calculated as a measure (ru) of the share of each component in the total measurement uncertainty. The equation for this ratio for the Tss1 component is defined as follows:
r u ( T s s 1 ) = ( δ C B T e H T δ T s s 1 ) 2 · u T 2 u C B T e H T 2
Analogously to this equation, ru values were calculated for the remaining factors, i.e., Tss2, q1, and q2.
The ru values for other measurement configurations, e.g., HTp, TT, and TTp, were calculated using the same approach. The ru coefficients for all cases were calculated following Equation (22), using the setup and uncertainty parameter values set to the default values, as presented in Table 2 and Table 3.

2.2. Tools

The analysis of the uncertainty of CBT estimates using the MC simulations and Taylor series expansions method was conducted using Python 3.10 and numpy, sympy, random, statistics, and matplotlib packages.

3. Results

3.1. Experimental Setup Validation

In the first experiment, the values of heat flux flowing through the sensors model and temperature spot on both sides of sensors were estimated for different values of ambient temperature and constant value of CBT, which equals 37 °C. Other parameters of the experimental setup were set to their default values (Table 2). The values of heat flux q1 and q2 are in the approximate range from −30 to 192 W/m2. These values are comparable with the values reported by Niedermann, R. et al. [18]—the mean value of heat flux measured at the chest equals 201 W/m2. As expected, when Tamb equals CBT, both heat fluxes are zero. The Tss values are in the range from approximately 35 °C to 38 °C, as Tsa spans between approximately 35 °C and 40 °C.
Next, the values of heat flux flowing through the sensors model and temperatures of both sides of the sensors were estimated for different values of CBT and a constant value of Tamb equal to 25 °C. As expected, due to the higher value of the heat transfer coefficient of channel 1, the value q1 is higher than q2. The difference in both measured heat fluxes grows as the CBT increases from 10 W/m2 to 17 W/m2. Similar effects are observed for temperatures Tss and Tsa. The difference between Tss2 and Tss1 varies from 0.07 °C to 0.11 °C as the difference between Tsa2 and Tsa1 varies from 1.64 °C to 2.78 °C.

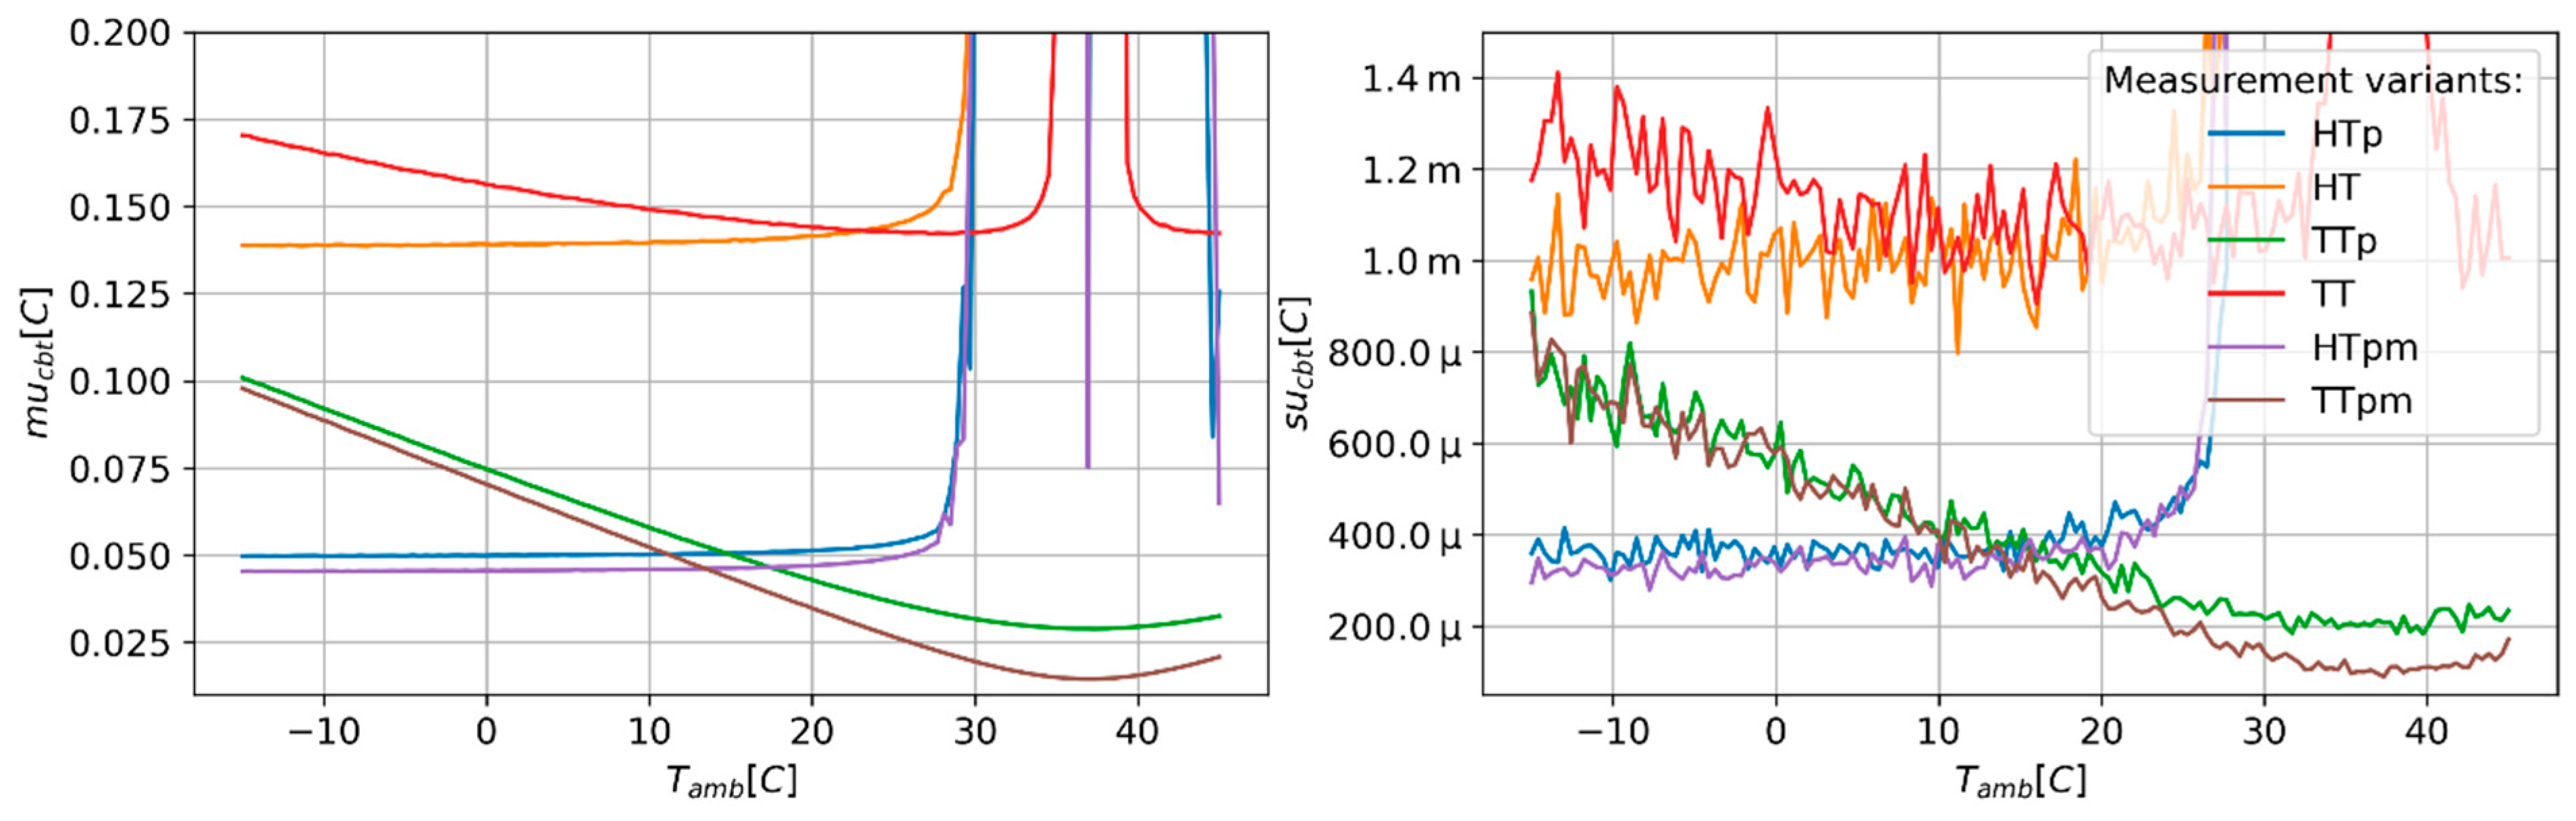
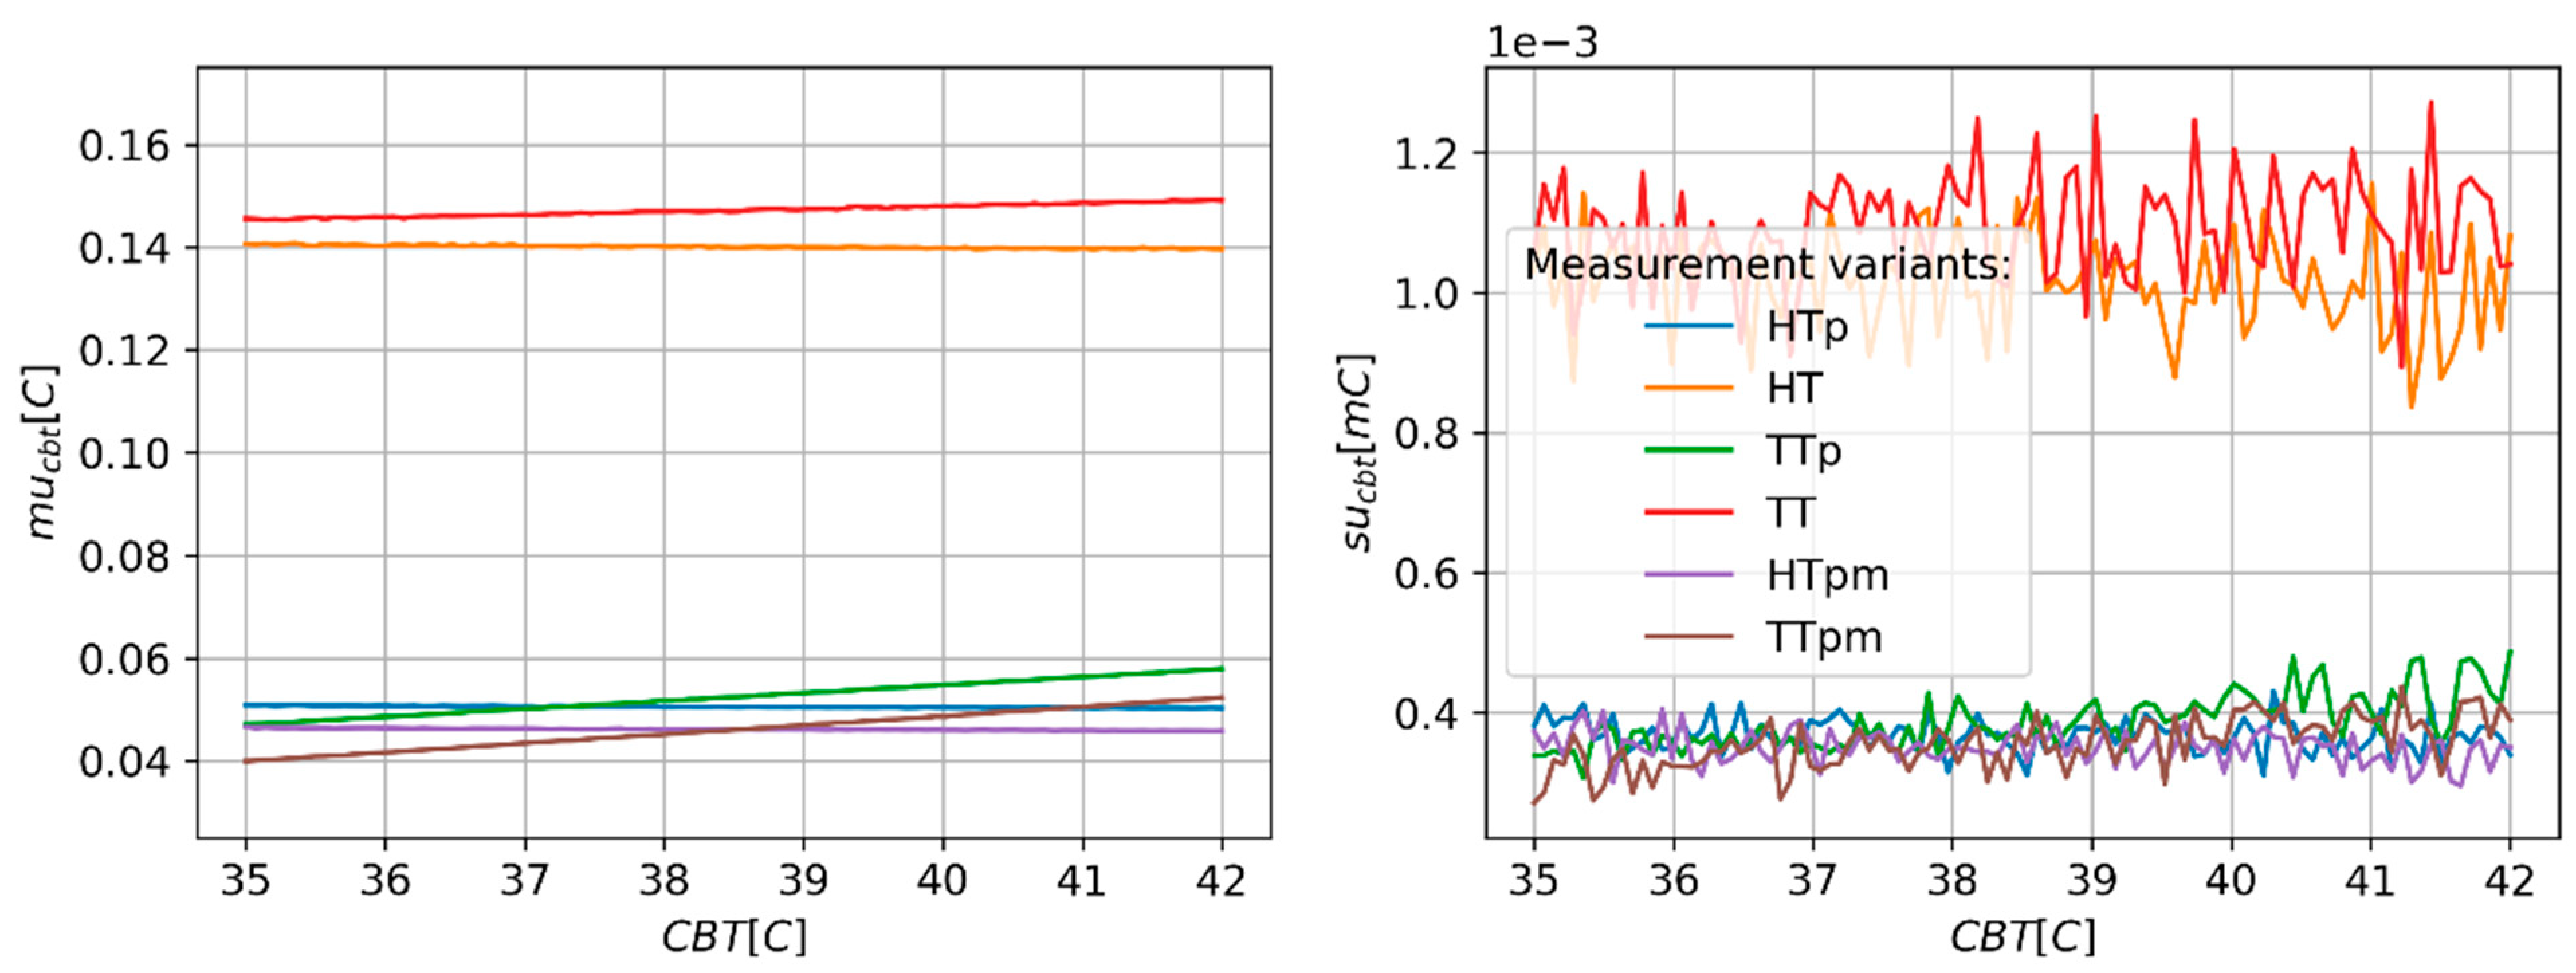
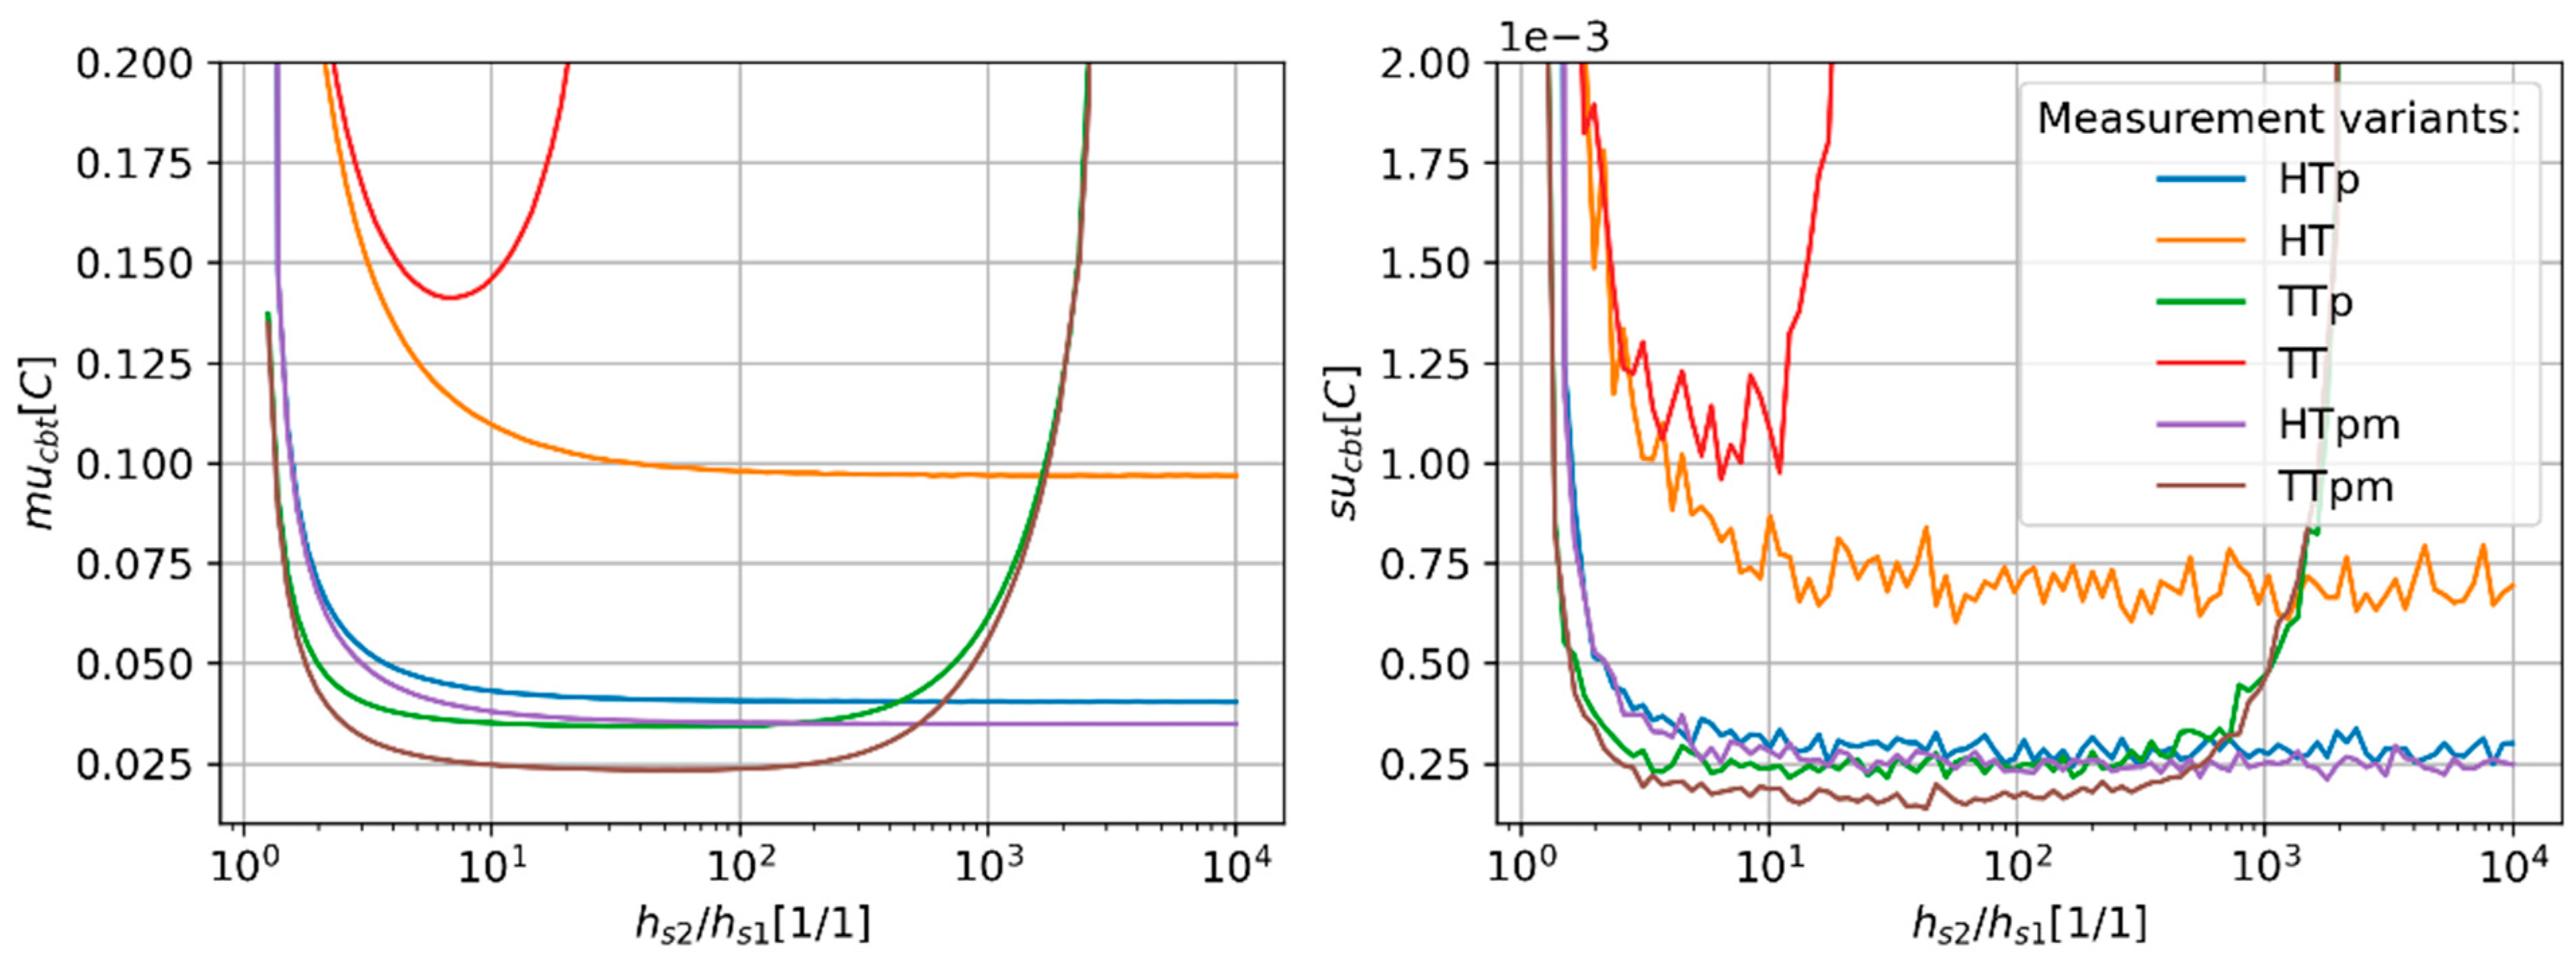
3.2. Monte Carlo Simulations

Figure 2, Figure 3 and Figure 4 present results of the estimation of the CBT measurement uncertainty (mucbt) and a standard deviation of these estimates (sucbt) in the function of the ambient temperature (Tamb). The obtained results suggest that all measurement variants show stable and unstable behaviours in different ranges of Tamb. In the unstable range of Tamb values, a rapid increase in the mucbt and sucbt is observed. The ratio between the maximum values of mucbt and sucbt obtained in the unstable regions and the maximum values denoted for stable regions can reach values ranging from hundreds to thousands. For all methods, the unstable results are yielded around the point where Tamb equals CBT. The variants using the heat flux sensors (HT, HTp, and HTpm) show the widest range of unstable behaviour, starting approximately at Tamb of 27–28 °C. The TT variant shows moderate width of unstable behaviour reaching from 33.8 °C to 42.3 °C. The TTp and TTpm show the lowest range of Tamb, resulting in unstable behaviour spreading from 36.98 °C to 37.02 °C. Also, different tendencies of mucbt in stable regions are observed for each measurement variant (Figure 3). The values of mucbt decrease as Tamb rises to the point where Tamb equals CBT, and then start to increase in cases where the measurement variants use only temperature probes (TT, TTp, and TTpm). The HT, HTp, and HTpm variants only show a minor increase in mucbt in the cases where Tamb is located in the stable behaviour range. The measurement variants using paired temperature sensors show smaller mucbt values than variants using unpaired sensors. The differences in mucbt are in the range from approx. 0.075 °C to 1.25 °C for TT type variants and 0.08 °C for HT type variants. The use of multi-measurement techniques (HTpm and TTpm) only slightly reduced mucbt as compared to the variants with paired temperature sensors.
The influence of CBT value in the range of temperature typical for the human body on mucbt and sucbt is limited (Figure 5). The value of mucbt for un-paired temperature sensors is less than 0.15 °C in the whole investigated range of CBT. For other variants, mucbt is less than 0.06 °C.
The CBT estimation error (mucbt) value depends on the ratio between the heat transfer coefficients of both channels (Figure 6). The mucbt value increases as the ratio between hs1 and hs2 approaches 1. The narrowest stable region is observed for the TT variant for which the mucbt starts to grow rapidly for a heat transfer coefficient ratio above approximately 24. The minimum value of mucbt for TT is observed for the hs2/hs1 ratio equal to 7. In the case of HT variants (HT, HTp and HTpm), the mucbt decreases steadily as the hs2/hs1 ratio grows in the whole investigated range. The values of mucbt start to settle as hs2/hs1 ratios reach approximately 100, 10, and 10 for HT, HTp, and HTpm variants, respectively. The minimum value of the mucbt reaches values of approx. 0.097 °C, 0.04 °C, and 0.035 °C for HT, HTp, and HTpm variants, respectively. The mucbt starts to rapidly grow as the hs2/hs1 ratio reaches approximately 2440 for TTp and TTpm alike. The minimum value of the mucbt reaches values of approx. 0.034 °C and 0.024 °C for TTp and TTpm variants, respectively. Those minima are located for an hs2/hs1 ratio equal to 30.
The optimal value of the heat transfer coefficient of channel 1 (hs1) varies with the measurement variant (Figure 7). The narrowest range of hs1 (from 1.9 W/(m2·K) to 50.2 W/(m2·K)) resulting in minor changes in the mucbt is observed for the method using unpaired temperature sensors (TT). The widest range (from 1.91 W/(m2·K) to 534.7 W/(m2·K)) is observed for TTp and TTpm variants. The lowest values of the mucbt were noticed for HTp and HTpm. The locations of the minima for these two variants are found for relatively low hs1 values equal to approximately 1.7 W/(m2·K).
The value of the hsa parameter, which is a measure of convective heat transfer from sensors to the surrounding air, shows a variable influence on mucbt (Figure 8). The most significant impact is observed for HT and TT measurement variants. In these cases, the mucbt lowered from 0.14 °C to approximately 0.08 °C as the has changed from 6 W/(m2·K) to 104 W/(m2·K). For the HTp and HTpm variants, the mucbt reduction is limited to approximately 0.017 °C. The mucbt measured for TTp and TTpm variants only show marginal dependency on the hsa value in the investigated range.

3.3. Linearization

The relative share of each type of independent uncertainty source to the total uncertainty of CBT measurement varied between studied variants of measurement (Table 5). In all cases, except the HTp variant, the direct (non-differential) temperature measurement constitutes the main source (~90%) of CBT estimate uncertainty. In the case of the HTp variant, the temperature and heat flux measurements contribute approximately equally to the overall uncertainty.

4. Discussion

The human body’s thermoregulation, heat generation, and transfer processes are complex, and therefore challenging to model. Even establishing a clear and unambiguous definition of CBT is not a trivial task [45]. For this reason, the analytical examination of the interaction between the body and the measuring device requires simplification. The assumptions and constraints imposed on the thermal model used for the heat generation and distribution system significantly simplified the description of the problem. The employed layer model is justified by the interaction between the sensor and the body in scenarios where typical sensor areas, such as the forehead, wrist, sternum, or side of the chest, are used for measurement. This simplification is additionally justified by the size of the measurement area, which typically is in the range of 4 cm2 to 15 cm2 [17,21,35,36,37].
The predicted ranges of readings from sensors embedded in the dual-heat flux CBT probe seem to correlate in size with the values found in the literature. The relation of these values to changes in ambient temperature and CBT confirms our expectations, which verifies the proposed methodology.
The results of the MC simulations show a strong influence of the ambient temperature on CBT estimate uncertainty. All variants of measurement show unstable behaviour around the point where Tamb equals CBT, where the heat flux in both channels equals zero and all temperature readings have the same value. This leads to an infinite number of solutions to the equation system formed by Equations (3) and (4). The range of those unstable regions is related to the CBT measurement variant. The widest unstable regions are observed for variants using direct heat flux sensors for which stable regions end at Tamb reaching 27–28 °C. This seems to be a significant limitation of those measurement variants, as this level of ambient temperature is common in many regions of the world. Moreover, this feature excludes these variants from applications in which monitoring of thermal stress is important, such as monitoring of firefighters, steelworks staff, or sports professionals. A narrower unstable region was observed for probes containing only paired temperature sensors (TTp and TTpm) for which measurements are unpredictable only in the span of 0.04 °C around the CBT value. The advantage of HT-type methods is the lower value of mucbt in the range of Tamb below 10 °C as compared to TT-type measurement variants. This can be important in applications of CBT measurement in cold environments, such as monitoring staff in cold stores or high-altitude mountaineering.
The CBT value has limited impact on its estimate uncertainty if the value of Tamb is far from the CBT value and thus measurement is conducted in the stable region. The results of the experiments indicate that when using paired temperature sensors, uncertainty around 0.05 °C could be achieved in the range of CBTs spanning from 35 °C to 42 °C. Such measurement accuracy seems to be acceptable in the majority of applications, including medical temperature measurement [46].
The ratio of the heat transfer coefficients hs2/hs1 has an impact on the CBT estimation uncertainty (mucbt). The optimal value of this ratio is specific to the measurement variant. For all HT type variants and TTp and TTpm variants, the optimal value of the ratio is between 10 and 100. In the case of the TT variant, the optimum is reached for a ratio equal to approximately seven. For all methods, mucbt rises with the hs2/hs1 ratio approaching one. The ratio of the heat transfer coefficients equal to one represents a scenario in which both channels are identical, which leads to an infinite number of solutions to the equation system formed by Equations (3) and (4). According to the obtained results, the ratio of the heat transfer coefficients should be set in the range of 3 to 10.
The use of paired temperature sensors (TTp and TTpm) results in a wider range of hs values, yielding minor changes in CBT uncertainty to its minimal value. This can be considered an additional benefit providing less restrictive design requirements for the dimensions and material of the dual-heat flux sensor. The relatively high values of hs for which minimum values of mucbt are denoted in the cases of TTp and TTpm variants indicate that these variants should be considered in the first place when significant miniaturization of dual-heat flux probes is planned. The reduction in the thickness of measurement channels can increase hs beyond the stable range of other variants. Meanwhile, HTp and HTpm variants provide the lowest mucbt values which can be beneficial in the cases when the size of the probe is not a major design limitation.
The investigated variants of measurements show varied sensitivity to the intensity of heat transfer between the sensor and the surroundings. This factor becomes crucial in the design of a dual-heat flux CBT probe intended for operation in various insulated environments, such as underneath clothing or protective suits. In such applications, hsa is expected to be relatively low and the use of TTp or TTpm approaches could be considered beneficial due to their low estimation error.
The uncertainty sources analysis shows that in all measurement variants, the application of more precise temperature sensors can lead to a significant reduction in total CBT estimation uncertainty. The designers should therefore mainly focus on searching for temperature sensors with accuracy higher than 0.05 °C to further improve the accuracy of dual-heat flux sensors.

5. Conclusions

The presented analysis compares six different variants of dual-heat flux measurement of CBT. The expected values of the uncertainty of CBT estimates obtained using these variants were estimated. The sensitivity of measurement uncertainty to factors of measurement setup such as ambient temperature, CBT, the values and ratios of the heat transfer coefficients of the dual-heat flux probe channels, and the intensity of the convective heat dissipation rate was investigated using the Monte Carlo method.
The most important observations resulting from the analysis are as follows: In the ranges of Tamb close to CBT, the measurement uncertainty is significantly high. This phenomenon limits the applications of the analysed CBT measurement methods when the ambient temperatures are close to CBT, i.e., in hot climates or work environments. These limitations are different for each measurement variant and some, such asTTp and TTpm, could be considered as not definitively excluding it from application in conditions of increased ambient temperature, as the unstable range is insufficiently broad for these variants. For all studied variants, the expected value of measurement uncertainty is less than 0.1 °C in the limited range of ambient temperatures below CBT. This indicates the usefulness of this measurement technique in medical applications, as the standards for electronic thermometers allow for an acceptable error reaching 0.1 °C [46].
For some measurement variants and in specific configurations, the predicted standard uncertainty of measurement can be lower than 0.05 °C. These results should be treated as a theoretical lower boundary of uncertainty, estimated using only analytical methods and not confirmed by empirical experiments. Another important observation is the specific range of optimal values of heat transfer coefficients of the dual-heat flux probe channels. This indicates that the material and mechanical design of the sensor should be adapted to the specific variant of measurement.
The TTp and TTpm variants allow for the use of relatively high values of the hs at which the minimum value of uncertainty is denoted. This feature predestines these variants for applications in miniature sensors, as obtaining low values of heat transfer coefficients in such cases can be a challenge.
An analysis of the individual components of uncertainty in CBT estimates reveals that, when employing temperature and heat flux sensors available on the market, the accuracy of temperature sensors has the most significant impact on the overall uncertainty of the CBT measurement. Therefore, it represents the primary limitation of the method. The conducted research showed that using paired temperature sensors could substantially decrease the uncertainty of the CBT measurement.
The main limitation of the presented study is the lack of empirical validation and the use of a simplified model. The former should be an inspiration for the continuation of this research. The latter limitation could be justified by the preliminary form of the study, as well as the need for simplification of the very complex system of the human body and its thermal interaction with the environment. Without such simplification, the number of parameters which should be included in the analysis would reduce the clarity and interpretability of the results. The values of the predicted readings from the sensors using the proposed model correspond with the values measured in vivo, which are publicly available. This seems to confirm the usefulness of the applied models and methods. The obtained values of uncertainty correlate with results obtained in empirical tests conducted by other authors (see Table 6), further supporting the presented methodology.

Author Contributions

In the preparation of the manuscript titled “Analytical analysis of factors affecting the accuracy of a dual-heat flux core body temperature sensor” the following authors contributed: J.Ż.: Conceptualization, Methodology, Software, Formal analysis, Investigation, Data Curation, Writing—Original Draft, Writing—Review and Editing, Visualization; S.C.: Software, Formal analysis, Investigation, Writing—Review and Editing; J.Ł.: Formal analysis, Writing—Original Draft, Writing—Review and Editing; P.L.: Conceptualization, Resources, Writing—Review and Editing, Project Administration. All authors have read and agreed to the published version of the manuscript.

Funding

This research received no external funding.

Institutional Review Board Statement

Not applicable.

Informed Consent Statement

Not applicable.

Data Availability Statement

Data are contained within the article.

Acknowledgments

The authors would like to acknowledge that this research was partially supported by the statutory funds of the Faculty of Mechatronics, Warsaw University of Technology.

Conflicts of Interest

Authors Jan Łusakowski and Patryk Lamprecht were employed by the company Healthwear Sp. z o.o. The remaining authors declare that the research was conducted in the absence of any commercial or financial relationships that could be construed as a potential conflict of interest The funders had no role in the design of the study; in the collection, analyses, or interpretation of data; in the writing of the manuscript; or in the decision to publish the results.

Abbreviations

A list of all abbreviations used in the text:
CBTCore body temperature
CBTeEstimated core body temperature
CBTeHTEstimated core body temperature using sensor in HT configuration
CBTeHTpEstimated core body temperature using sensor in HT configuration with paired temperature sensors
CBTeHTpm Estimated core body temperature for HT configuration with paired temperature sensors with averaged value
CBTeTTEstimated core body temperature using sensor in TT configuration
CBTeTTpEstimated core body temperature using sensor in TT configuration with paired temperature sensors
CBTeTTpm Estimated core body temperature for TT configuration with paired temperature sensors with averaged value
ds, ds1, ds2The thickness of the PDMS layer, and the thickness of the PDMS layer in sensors 1 and 2, respectively
has, has1, has2,The heat transfer coefficients of the interference between the sensor and air, and the heat transfer coefficient between air and sensors 1 and 2, respectively
hs, hs1, hs2The heat transfer coefficient of the sensor, and the heat transfer coefficient of sensors 1 and 2, respectively
HTThe CBT sensor configuration, comprising combinations of flux sensor and temperature sensor
htSkin heat transfer coefficient
HTpCBT sensor with heat flux sensors and paired temperature sensors
HTpmCBT sensor with heat flux sensors and paired temperature sensors. The value of the final estimate is the average value of estimates derived from measurements using Equations (8) and (13).
kThe ratio of the heat transfer coefficient of the DHF sensor equals hs2/hs1
ks, ks1, ks2Thermal conductivity of sensor, and thermal conductivity of sensors 1 and 2, respectively
ktThermal conductivity of skin
MCMonte Carlo method
mucbtMeasurement uncertainty
PSIPhysiological Strain Index
q, q1, q2Heat flux, and heat flux flowing through sensors 1 and 2, respectively
SBTSurface Body Temperature
sucbtStandard deviations of mucbt
TambAmbient (air) temperature
Tsa, Tsa1, Tsa2 The temperature of the air-sensor surface, and the temperature measured between air and sensors 1 and 2, respectively
Tss, Tss1, Tss2 The temperature of the skin-sensor surface, and the temperature measured between the skin and sensors 1 and 2, respectively
TTThe CBT sensor configuration comprising four temperature sensors
TTpCBT sensor comprising four temperature sensors with temperature sensors paired
TTpmCBT sensor comprising four temperature sensors with temperature sensors paired. The value of the final estimate is the averaged value of estimates derived from measurements using Equations (9), (14), (15) and (16).
uCBTeHT combined uncertainty for the dual-flux sensor in the HT variant with non-paired temperature sensor configuration
uhThe standard uncertainty of the measurement of the heat transfer coefficients hs1 and hs2
uqThe standard uncertainty of heat-flux measurement
uTThe standard uncertainty temperature measurement using a non-paired sensor
uΔTThe standard uncertainty of the differential temperature measurement using paired sensors

References

  1. Dolson, C.M.; Harlow, E.R.; Phelan, D.M.; Gabbett, T.J.; Gaal, B.; McMellen, C.; Geletka, B.J.; Calcei, J.G.; Voos, J.E.; Seshadri, D.R. Wearable Sensor Technology to Predict Core Body Temperature: A Systematic Review. Sensors 2022, 22, 7639. [Google Scholar] [CrossRef]
  2. Moran, D.S.; Shitzer, A.; Pandolf, K.B. A Physiological Strain Index to Evaluate Heat Stress. Am. J. Physiol. Regul. Integr. Comp. Physiol. 1998, 275, R129–R134. [Google Scholar] [CrossRef]
  3. Moran, D.S.; Montain, S.J.; Pandolf, K.B. Evaluation of Different Levels of Hydration Using a New Physiological Strain Index. Am. J. Physiol. Regul. Integr. Comp. Physiol. 1998, 275, R854–R860. [Google Scholar] [CrossRef] [PubMed]
  4. Buller, M.J.; Welles, A.P.; Friedl, K.E. Wearable Physiological Monitoring for Human Thermal-Work Strain Optimization. J. Appl. Physiol. 2017, 124, 432–441. [Google Scholar] [CrossRef] [PubMed]
  5. Huggins, R.; Glaviano, N.; Negishi, N.; Casa, D.J.; Hertel, J. Comparison of Rectal and Aural Core Body Temperature Thermometry in Hyperthermic, Exercising Individuals: A Meta-Analysis. J. Athl. Train. 2012, 47, 329–338. [Google Scholar] [CrossRef] [PubMed]
  6. Coiffard, B.; Diallo, A.B.; Culver, A.; Antonini, F.; Hammad, E.; Leone, M.; Mege, J.-L. Exacerbation of Circadian Rhythms of Core Body Temperature and Sepsis in Trauma Patients. J. Crit. Care 2020, 60, 23–26. [Google Scholar] [CrossRef] [PubMed]
  7. Baron, K.G.; Reid, K.J. Circadian Misalignment and Health. Int. Rev. Psychiatry 2014, 26, 139–154. [Google Scholar] [CrossRef]
  8. Videnovic, A.; Willis, G.L. Circadian System—A Novel Diagnostic and Therapeutic Target in Parkinson’s Disease? Mov. Disord. 2016, 31, 260–269. [Google Scholar] [CrossRef]
  9. Taillard, J.; Sagaspe, P.; Philip, P.; Bioulac, S. Sleep Timing, Chronotype and Social Jetlag: Impact on Cognitive Abilities and Psychiatric Disorders. Biochem. Pharmacol. 2021, 191, 114438. [Google Scholar] [CrossRef]
  10. Molzof, H.E.; Prapanjaroensin, A.; Patel, V.H.; Mokashi, M.V.; Gamble, K.L.; Patrician, P.A. Misaligned Core Body Temperature Rhythms Impact Cognitive Performance of Hospital Shift Work Nurses. Neurobiol. Learn. Mem. 2019, 160, 151–159. [Google Scholar] [CrossRef]
  11. Crouse, J.J.; Carpenter, J.S.; Song, Y.J.C.; Hockey, S.J.; Naismith, S.L.; Grunstein, R.R.; Scott, E.M.; Merikangas, K.R.; Scott, J.; Hickie, I.B. Circadian Rhythm Sleep–Wake Disturbances and Depression in Young People: Implications for Prevention and Early Intervention. Lancet Psychiatry 2021, 8, 813–823. [Google Scholar] [CrossRef]
  12. Vinales, K.L.; Begaye, B.; Thearle, M.S.; Krakoff, J.; Piaggi, P. Core Body Temperature, Energy Expenditure, and Epinephrine during Fasting, Eucaloric Feeding, and Overfeeding in Healthy Adult Men: Evidence for a Ceiling Effect for Human Thermogenic Response to Diet. Metabolism 2019, 94, 59–68. [Google Scholar] [CrossRef] [PubMed]
  13. Webster, W.W.; Smarr, B. Using Circadian Rhythm Patterns of Continuous Core Body Temperature to Improve Fertility and Pregnancy Planning. J. Circadian Rhythm. 2020, 18, 5. [Google Scholar] [CrossRef]
  14. Wang, X.-J.; Li, X.-T.; Chen, N.; Huang, L.; Huang, S.-X.; Chen, T.-T.; Liu, G.-H.; Hu, R.-F. Mental Health, Sleep Quality, and Hormonal Circadian Rhythms in Pregnant Women with Threatened Preterm Labor: A Prospective Observational Study. BMC Pregnancy Childbirth 2023, 23, 501. [Google Scholar] [CrossRef]
  15. Sund-Levander, M.; Grodzinsky, E. Time for a Change to Assess and Evaluate Body Temperature in Clinical Practice. Int. J. Nurs. Pract. 2009, 15, 241–249. [Google Scholar] [CrossRef] [PubMed]
  16. Chen, W. Thermometry and Interpretation of Body Temperature. Biomed. Eng. Lett. 2019, 9, 3–17. [Google Scholar] [CrossRef]
  17. Huang, M.; Tamura, T.; Tang, Z.; Chen, W.; Kanaya, S. A Wearable Thermometry for Core Body Temperature Measurement and Its Experimental Verification. IEEE J. Biomed. Health Inform. 2017, 21, 708–714. [Google Scholar] [CrossRef]
  18. Niedermann, R.; Wyss, E.; Annaheim, S.; Psikuta, A.; Davey, S.; Rossi, R.M. Prediction of Human Core Body Temperature Using Non-Invasive Measurement Methods. Int. J. Biometeorol. 2014, 58, 7–15. [Google Scholar] [CrossRef] [PubMed]
  19. Tamura, T.; Huang, M.; Togawa, T. Current Developments in Wearable Thermometers. Adv. Biomed. Eng. 2018, 7, 88–99. [Google Scholar] [CrossRef]
  20. Uth, M.-F.; Koch, J.; Sattler, F. Body Core Temperature Sensing: Challenges and New Sensor Technologies. Procedia Eng. 2016, 168, 89–92. [Google Scholar] [CrossRef]
  21. Fang, J.; Zhou, C.; Ye, X. Optimization of a Wearable Device for Core Body Temperature Monitoring Based on the Dual-Heat-Flux Model. IOP Conf. Ser. Mater. Sci. Eng. 2019, 677, 032006. [Google Scholar] [CrossRef]
  22. Huang, M.; Tamura, T.; Chen, W.; Kanaya, S. Evaluation of Structural and Thermophysical Effects on the Measurement Accuracy of Deep Body Thermometers Based on Dual-Heat-Flux Method. J. Therm. Biol. 2015, 47, 26–31. [Google Scholar] [CrossRef]
  23. Xu, X.; Wu, G.; Lian, Z.; Xu, H. Feasibility Analysis of Applying Non-Invasive Core Body Temperature Measurement in Sleep Research. Energy Build. 2024, 303, 113827. [Google Scholar] [CrossRef]
  24. Panunzio, N.; Diamanti, A.; Marrocco, G. Flexible Multi-Layer Sensor for the Wireless Implementation of Dual-Heat-Flux Monitoring of Body Temperature. In Proceedings of the 2022 IEEE International Conference on Flexible and Printable Sensors and Systems (FLEPS), Vienna, Austria, 10–13 July 2022; pp. 1–4. [Google Scholar]
  25. Zhang, Y.; Chad Webb, R.; Luo, H.; Xue, Y.; Kurniawan, J.; Cho, N.H.; Krishnan, S.; Li, Y.; Huang, Y.; Rogers, J.A. Theoretical and Experimental Studies of Epidermal Heat Flux Sensors for Measurements of Core Body Temperature. Adv. Healthc. Mater. 2016, 5, 119–127. [Google Scholar] [CrossRef]
  26. Matsunaga, D.; Tanaka, Y.; Tajima, T.; Seyama, M. Technology for Visualizing the Circadian Rhythm: Wearable Core-Body-Temperature Sensor. NTT Tech. Rev. 2021, 19, 34–39. [Google Scholar] [CrossRef]
  27. Tamura, T.; Huang, M.; Yoshimura, T.; Umezu, S.; Ogata, T. An Advanced Internet of Things System for Heatstroke Prevention with a Noninvasive Dual-Heat-Flux Thermometer. Sensors 2022, 22, 9985. [Google Scholar] [CrossRef]
  28. Janke, D.; Kagelmann, N.; Storm, C.; Maggioni, M.A.; Kienast, C.; Gunga, H.-C.; Opatz, O. Measuring Core Body Temperature Using a Non-Invasive, Disposable Double-Sensor During Targeted Temperature Management in Post-Cardiac Arrest Patients. Front. Med. 2021, 8, 666908. [Google Scholar] [CrossRef]
  29. Lauronen, S.-L.; Kalliomäki, M.-L.; Kalliovalkama, J.; Aho, A.; Huhtala, H.; Yli-Hankala, A.M.; Mäkinen, M.-T. Comparison of Zero Heat Flux and Double Sensor Thermometers during Spinal Anaesthesia: A Prospective Observational Study. J. Clin. Monit. Comput. 2022, 36, 1547–1555. [Google Scholar] [CrossRef] [PubMed]
  30. Daanen, H.A.M.; Kohlen, V.; Teunissen, L.P.J. Heat Flux Systems for Body Core Temperature Assessment during Exercise. J. Therm. Biol. 2023, 112, 103480. [Google Scholar] [CrossRef] [PubMed]
  31. Etienne, S.; Oliveras, R.; Schiboni, G.; Durrer, L.; Rochat, F.; Eib, P.; Zahner, M.; Osthoff, M.; Bassetti, S.; Eckstein, J. Free-Living Core Body Temperature Monitoring Using a Wrist-Worn Sensor after COVID-19 Booster Vaccination: A Pilot Study. BioMedical Eng. OnLine 2023, 22, 25. [Google Scholar] [CrossRef]
  32. Smits, E.C.P.; van Heck, G.T.; Kingma, B.R.M.; van den Brand, J. Core Body Temperature Sensor and Method for the Manufacturing Thereof. US20220128413A1, 28 April 2022. [Google Scholar]
  33. Saggin, B.; Tarabini, M.; Lanfranchi, G. A Device for the Skin–Contact Thermal Resistance Measurement. IEEE Trans. Instrum. Meas. 2012, 61, 489–495. [Google Scholar] [CrossRef]
  34. Gunga, H.-C.; Sandsund, M.; Reinertsen, R.E.; Sattler, F.; Koch, J. A Non-Invasive Device to Continuously Determine Heat Strain in Humans. J. Therm. Biol. 2008, 33, 297–307. [Google Scholar] [CrossRef]
  35. Matsunaga, D.; Tanaka, Y.; Seyama, M.; Nagashima, K. Non-Invasive and Wearable Thermometer for Continuous Monitoring of Core Body Temperature under Various Convective Conditions. In Proceedings of the 2020 42nd Annual International Conference of the IEEE Engineering in Medicine Biology Society (EMBC), Montreal, QC, Canada, 27 August 2020; pp. 4377–4380. [Google Scholar]
  36. Tanaka, Y.; Matsunaga, D.; Tajima, T.; Seyama, M. Skin-Attachable Sensor for Core Body Temperature Monitoring. IEEE Sens. J. 2021, 21, 16118–16123. [Google Scholar] [CrossRef]
  37. de Rivera, P.J.R.; de Rivera, M.R.; Socorro, F.; de Rivera, M.R. Measurement of Human Body Surface Heat Flux Using a Calorimetric Sensor. J. Therm. Biol. 2019, 81, 178–184. [Google Scholar] [CrossRef] [PubMed]
  38. Mark, J.E. (Ed.) Polymer Data Handbook; Oxford University Press: Oxford, UK, 1999. [Google Scholar]
  39. Hasgall, P.; Di Gennaro, F.; Baumgartner, C.; Neufeld, E.; Lloyd, B.; Gosselin, M.; Payne, D.; Klingenböck, A.; Kuster, N. IT’IS Database for Thermal and Electromagnetic Parameters of Biological Tissues. 2022. Available online: https://itis.swiss/virtual-population/tissue-properties/overview/ (accessed on 12 March 2024).
  40. Arens, E.A.; Zhang, H. The Skin’s Role in Human Thermoregulation and Comfort. In Thermal and Moisture Transport in Fibrous Materials; Woodhead Publishing Ltd.: Sawston, UK, 2006; pp. 560–602. [Google Scholar]
  41. Lienhard, J.H. A Heat Transfer Textbook; Phlogiston Press: Cambridge, MA, USA, 2020. [Google Scholar]
  42. Natural Convection Coefficient Calculator. QuickField FEA Software. Available online: https://quickfield.com/natural_convection.htm (accessed on 25 March 2022).
  43. THB. New Transient Hot Bridge Instrument. LINSEIS. Available online: https://www.linseis.com/en/products/thermal-conductivity-instruments/thb-basic-advance-ultimate/ (accessed on 25 March 2022).
  44. Convection Wizard. Available online: https://thermal.mayahtt.com/tmwiz/convect/forced/fp-isot/fp-isot.htm (accessed on 31 March 2022).
  45. Taylor, N.A.S.; Tipton, M.J.; Kenny, G.P. Considerations for the Measurement of Core, Skin and Mean Body Temperatures. J. Therm. Biol. 2014, 46, 72–101. [Google Scholar] [CrossRef] [PubMed]
  46. E1112-00; Standard Specification for Electronic Thermometer for Intermittent Determination of Patient Temperature. ASTM International: West Conshohocken, PA, USA, 2011.
  47. Huang, M.; Kanaya, S.; Tamura, T.; Tang, Z.; Chen, W. Structural Optimization of a Wearable Deep Body Thermometer: From Theoretical Simulation to Experimental Verification. J. Sens. 2016, 2016, 4828093. [Google Scholar] [CrossRef]
Figure 1. The CBT measurement setup for a dual flux sensor and its looped model equivalent. Tamb—ambient (air) temperature, Tsa1 and Tsa2—temperature measured between air and sensors 1 and 2, respectively, Tss1 and Tss2—temperature measured between skin and sensors 1 and 2, respectively, CBT—core body temperature, which was assumed to be equal to the blood temperature, ht, hs1, hs2, hsa1, and hsa2—the heat transfer coefficients of the skin, sensors 1 and 2, and the interfaces between sensors 1 and 2 and air, respectively, and q1 and q2—heat flux through sensors 1 and 2, respectively.
Sensors 24 01887 g001
Figure 2. Predicted values of CBT estimation uncertainty (mucbt—(right) panel) and corresponding values of standard deviation (sucbt—(left) panel) of MC simulation repetitions as a function of ambient temperature.
Sensors 24 01887 g002
Figure 3. Predicted values of CBT estimation uncertainty (mucbt—(right) panel) and corresponding values of standard deviation (sucbt—(left) panel) of MC simulation repetitions as a function of ambient temperature. Close up on the stable interval of the mucbt and sucbt value range.
Sensors 24 01887 g003
Figure 4. Predicted values of CBT estimation uncertainty (mucbt—(right) panel) and corresponding values of standard deviation (sucbt—(left) panel) of MC simulation repetitions as a function of ambient temperature. Narrowed Tamb value range to present the range of unstable behaviour of TTp and TTpm measurement variants.
Sensors 24 01887 g004
Figure 5. Predicted values of CBT estimation uncertainty (mucbt—(right) panel) and corresponding values of standard deviation (sucbt—(left) panel) of MC simulation repetitions as a function of CBT.
Sensors 24 01887 g005
Figure 6. Predicted values of CBT estimation uncertainty (mucbt—(right) panel) and corresponding values of standard deviation (sucbt—(left) panel) of MC simulation repetitions as a function of the heat transfer coefficient of both measurement channels.
Sensors 24 01887 g006
Figure 7. Predicted values of CBT estimation uncertainty (mucbt—(right) panel) and corresponding values of standard deviation (sucbt—(left) panel) of MC simulation repetitions as a function of heat transfer coefficient of sensor 1 (hs2 equals 0.5 hs1).
Sensors 24 01887 g007
Figure 8. Predicted values of CBT estimation uncertainty (mucbt—(right) panel) and corresponding values of standard deviation (sucbt—(left) panel) of MC simulation repetitions as a function of convection heat transfer coefficient (hsa).
Sensors 24 01887 g008
Table 1. List of all CBT measurement variants used in the study of CBT measurement uncertainty analysis.
Method *Designation of Independent Measurement Uncertainties (See Section 2.1.2. Monte Carlo Analysis)Description
HTuT, uqThe temperature sensors are not paired.
HTpuT, uq, uΔTThe temperature sensors are paired.
HTpmuT, uq, uΔTThe temperature sensors are paired. The value of the final estimate is the average value of estimates derived from measurements using Equations (8) and (13).
TTuTThe temperature sensors are not paired.
TTpuT, uΔTThe temperature sensors are paired.
TTpmuT, uΔT,The temperature sensors are paired. The value of the final estimate is the averaged value of estimates derived from measurements using Equations (9), (14), (15) and (16).
* The CBT sensors come in two types: HT and TT. The HT-type sensors consist of two heat flux and two temperature sensors positioned between the skin and thermoresistive material. The TT-type sensors have four temperature sensors placed at the top and bottom of the thermoresistive material layer of each sub-sensor, as shown in Figure 1.
Table 2. List of parameters and their default values used in lumped thermal model of the measurement setup.
ParameterUnitDefault ValueDescription
CBT[°C]37Core body temperature.
Tamb[°C]25Ambient (air) temperature.
ks1, ks2 [ W m 2 · K ] 0.15Thermal conductivity of sensors in channels 1 and 2 as typical material Poly(dimethylsiloxane)(PDMS) was chosen [38].
ds1, ds2[mm]15, 30The thickness of the PDMS layer of sensors in channels 1 and 2, respectively.
kt [ W m 2 · K ] 0.37Thermal conductivity of the skin [39]
dt[mm]2.5Thickness of the skin [40]
hsa [ W m 2 · K ] 6.1Natural convection coefficient at the surface between sensors and air. Its value was estimated for an upward-oriented circular plate with a radius of 1.5 cm [41,42]. The radius of the plate was chosen based on the description of sensors presented in publications [17,21,35,36,37].
hs1, hs2 [ W m 2 · K ] 10, 5Heat transfer coefficient of sensors 1 and 2, respectively. These values were calculated according to the general equation h = k/d.
Table 3. Default values of standard uncertainty of different sensors and their elements used in the estimation of combined uncertainty of CBT measurement using dual-heat flux method.
ParameterUnitDefault ValueDescription
uT[°C] ± 0.05 3 The standard uncertainty of non-paired sensor temperature measurement. The value was estimated based on the datasheet of the LMT70 (Texas Instruments, Dallas, TX, USA) sensor.
uΔT[°C] ± 2 · 0.0003 The standard uncertainty of paired sensor differential temperature measurement. The value was estimated based on spectral output noise distribution presented in the datasheet of the LMT70 (Texas Instruments, USA) sensor.
uq [ W m 2 ] ±1.3The standard uncertainty of heat flux measurement. The value was estimated based on the PHFS-01 sensor (Fluxteq, Blacksburg, VA, USA) sensor and AD7713 (Analog Devices, Wilmington, NC, USA) analog-digital converter (ADC) datasheet.
uh [ W m 2 · K ] ±0.12The standard uncertainty of measurement of the heat transfer coefficients hs1 and hs2. This value was estimated assuming that the standard uncertainty of sensor thickness equals ±0.1 mm and the relative uncertainty of material conductivity measurement equals ±1% [43].
Table 4. List of conducted experiments using Monte Carlo analysis.
Changed ParameterUnitRange of ValuesDescription
Tamb[°C]−15–+45
and
36.95–37.05
The influence of ambient temperature on CBT uncertainty. This test was restated with a narrowed temperature range for TTp and TTpm measurement variants.
CBT[°C]35–45The influence of CBT value on CBT uncertainty.
hs1, hs2 [ W m 2 · K ] 0.7–6667The influence of the heat transfer coefficient values of the DHF probe channels on CBT uncertainty. The ratio of the hs1 to hs2 was constant and equal to 2. The range of the hs1 value was selected by changing the thermal conductivity k1 and k2 in the range from 0.01 W/(m·K) to 100 W/(m·K).
hs2/hs1[1/1]1.25–10,000The influence of the ratio between heat transfer coefficients of the DHF probe channels on CBT uncertainty. The hs1 value was constant as hs2 was reduced by increasing the thickness (d2) of the second channel.
hsa [ W m 2 · K ] 6–104The influence of heat transfer coefficient between air and sensor for air flow changing from 0 m/s to 14 m/s on CBT uncertainty. The maximum value of hsa for airflow equal to 14 m/s was estimated using an online [44] calculator assuming that the probe has a size of 2 cm by 2 cm and a temperature equal to 36 °C, and the surrounding air temperature was 25 °C.
Table 5. Values of the uncertainty ratio (ru) of a given component to the total uncertainty of CBT measurement using the given measurement variant.
Measurement Variantru [%]
Tss1Tss2Tsa1Tsa2q1q2ΔTssΔTs1ΔTs2hs1hs2
HT31.83259.694--2.9475.527-----
HTp33.857---22.96943.0740.1----
TT35.30662.0850.1410.066-----0.481.921
TTp90.048-----0.3670.0010.0011.9177.667
Table 6. Comparison of accuracy of CBT estimation using wearable devices reported in the literature.
ReferenceAccuracy [°C]DeviceType of Experiment
[21]0.09DHFPhysical model
[22]0.3DHFNumerical simulation (FEM)
[20]0.15–0.29SHFClinical experiment
[47]0.095–0.019Modified SHFNumerical (FEM) and limited trials with humans
[31]0.34Calera® (greenTEG, Rümlang, Switzerland)Clinical experiment
Disclaimer/Publisher’s Note: The statements, opinions and data contained in all publications are solely those of the individual author(s) and contributor(s) and not of MDPI and/or the editor(s). MDPI and/or the editor(s) disclaim responsibility for any injury to people or property resulting from any ideas, methods, instructions or products referred to in the content.

