
Embeddable Chloride Sensor for Monitoring Chloride Penetration into Cement Mortar


Abstract
1. Introduction
2. Experimental Materials and Methods
2.1. Preparation of Ag/AgCl Electrode
2.2. Preparation of Mn/MnO2 Reference Electrode
2.3. Performance Test of Ag/AgCl Working Electrode
2.4. Performance Test of Mn/MnO2 Reference Electrode
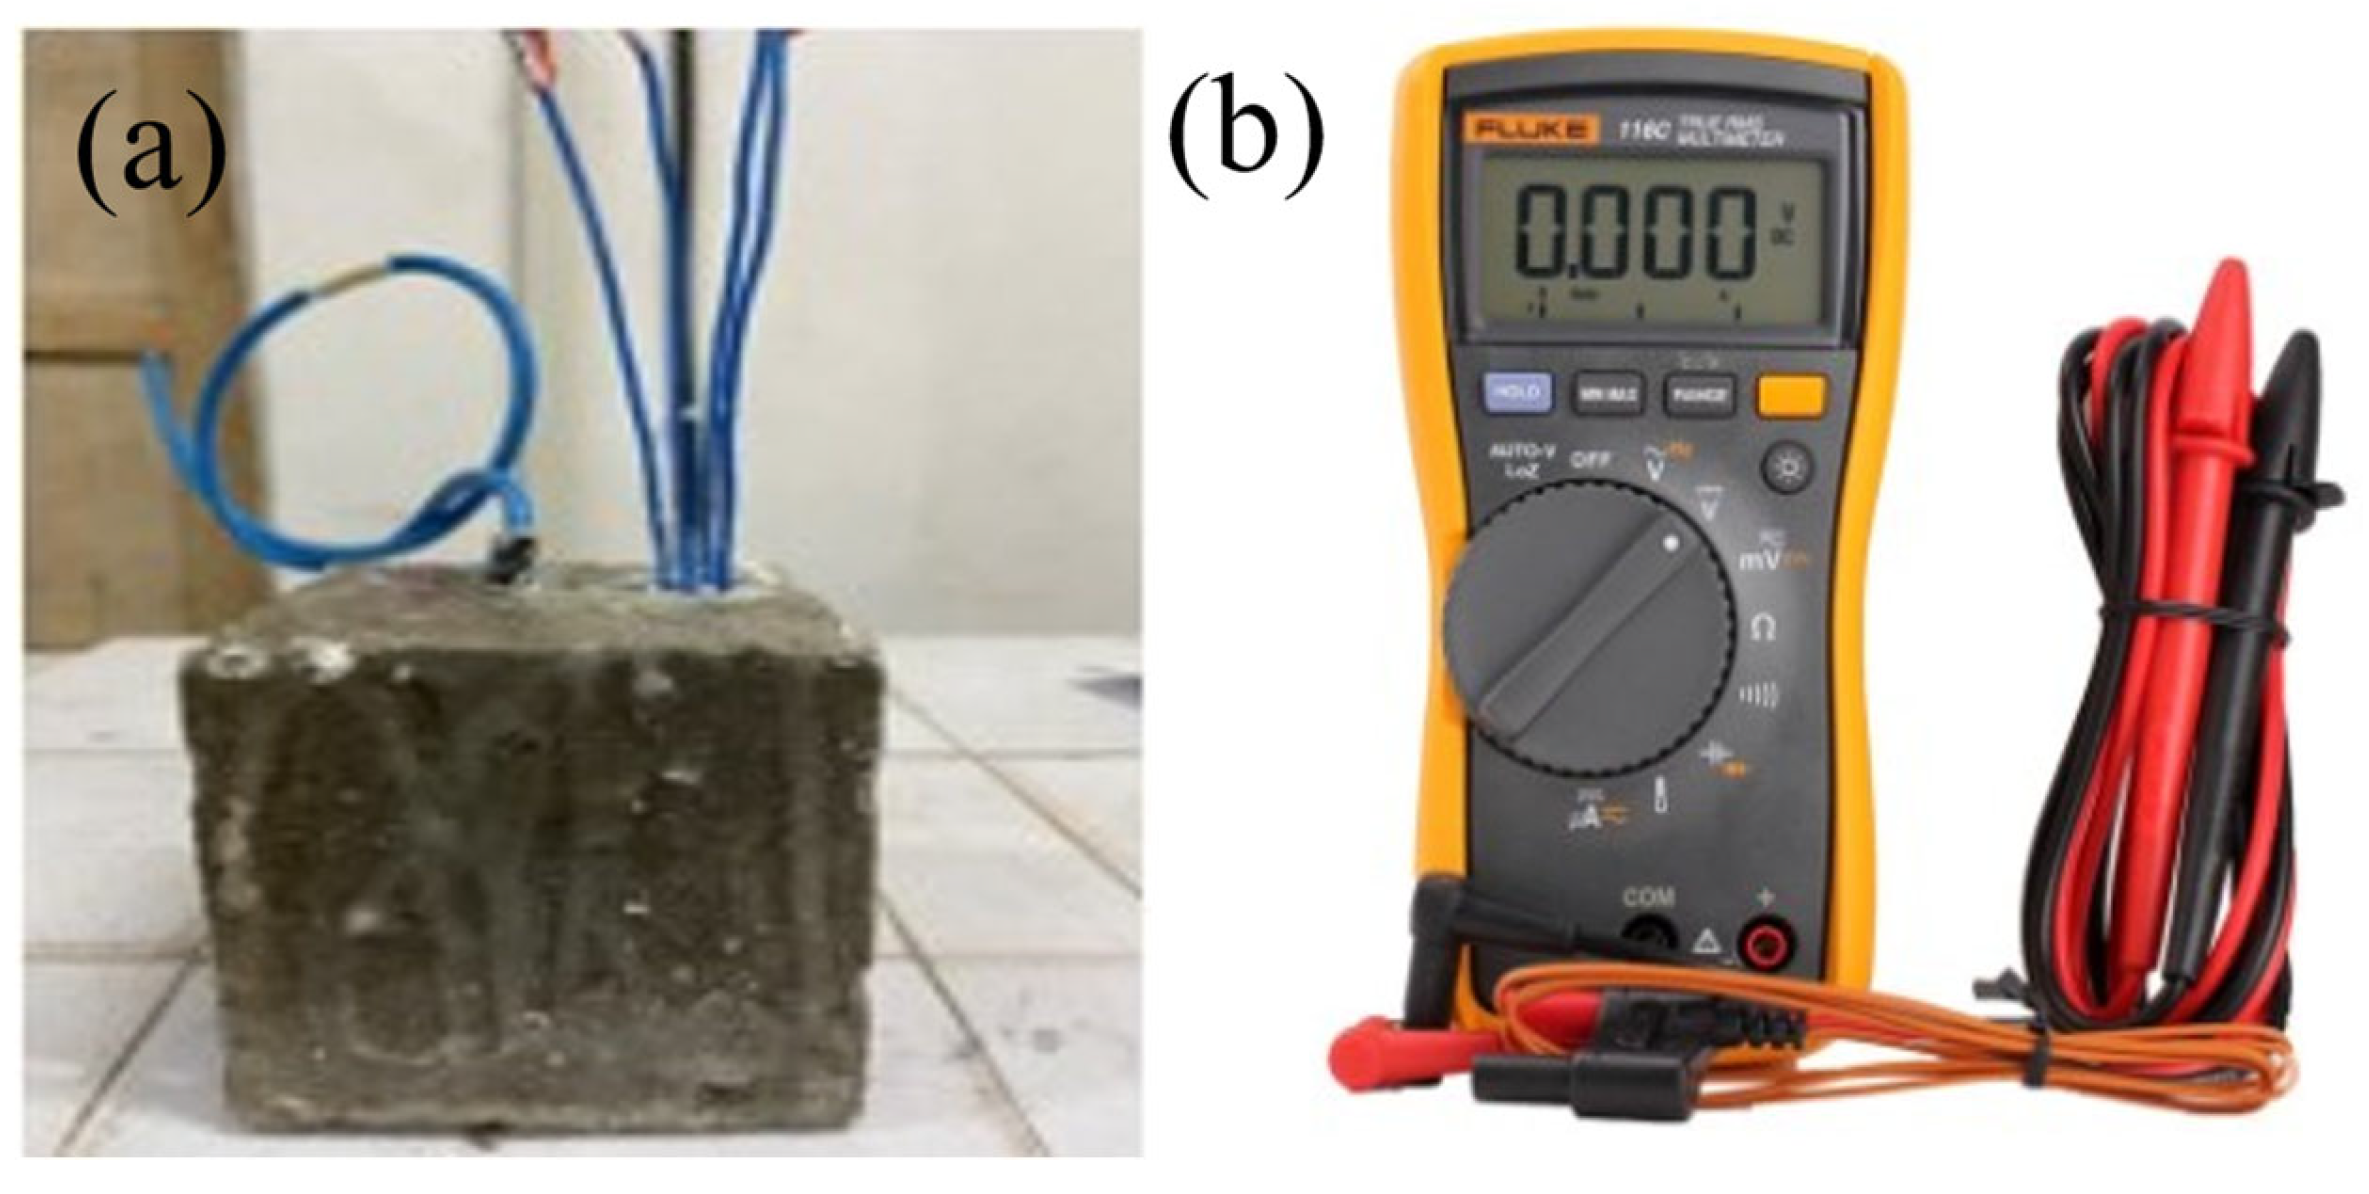
2.5. Performance Test of Solid Chloride Sensor
3. Results and Discussion
3.1. Performance of Working Electrode
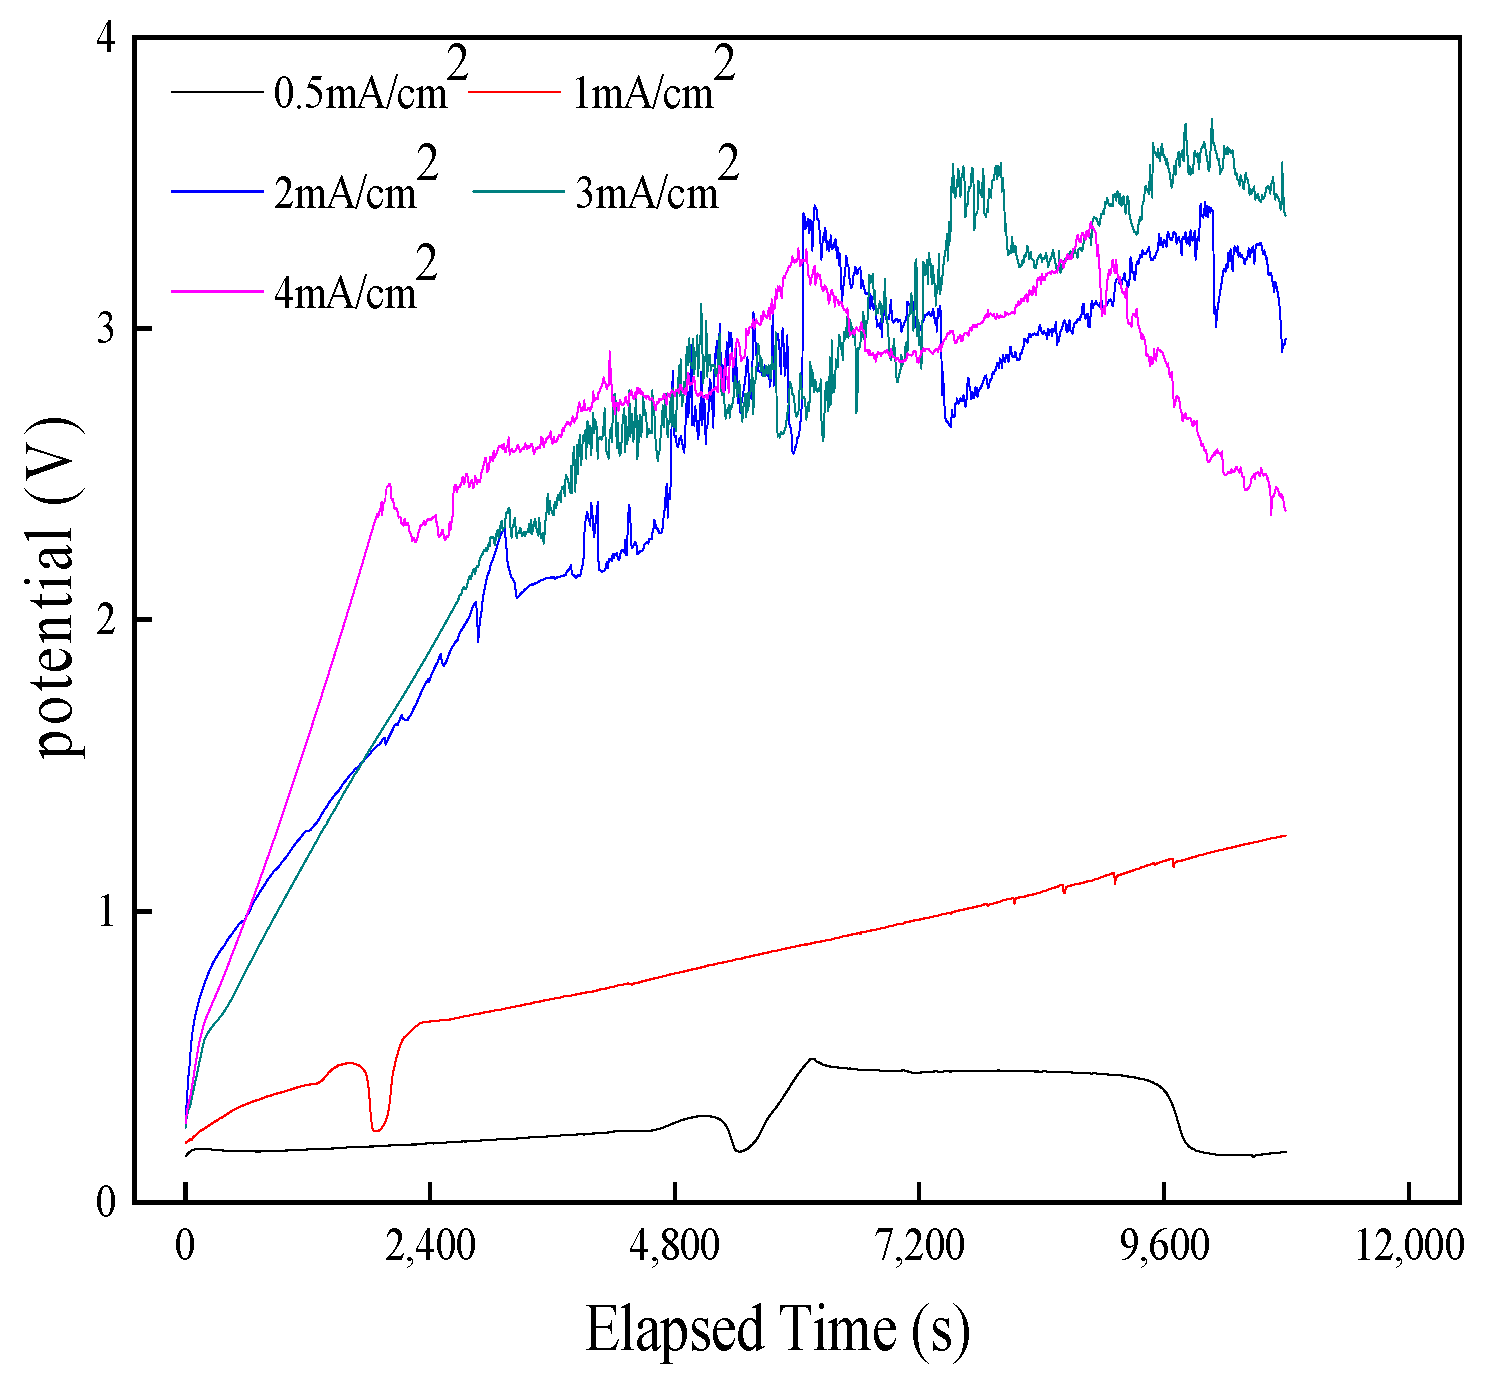
3.1.1. Transient Analysis of the Formation Process of AgCl Film
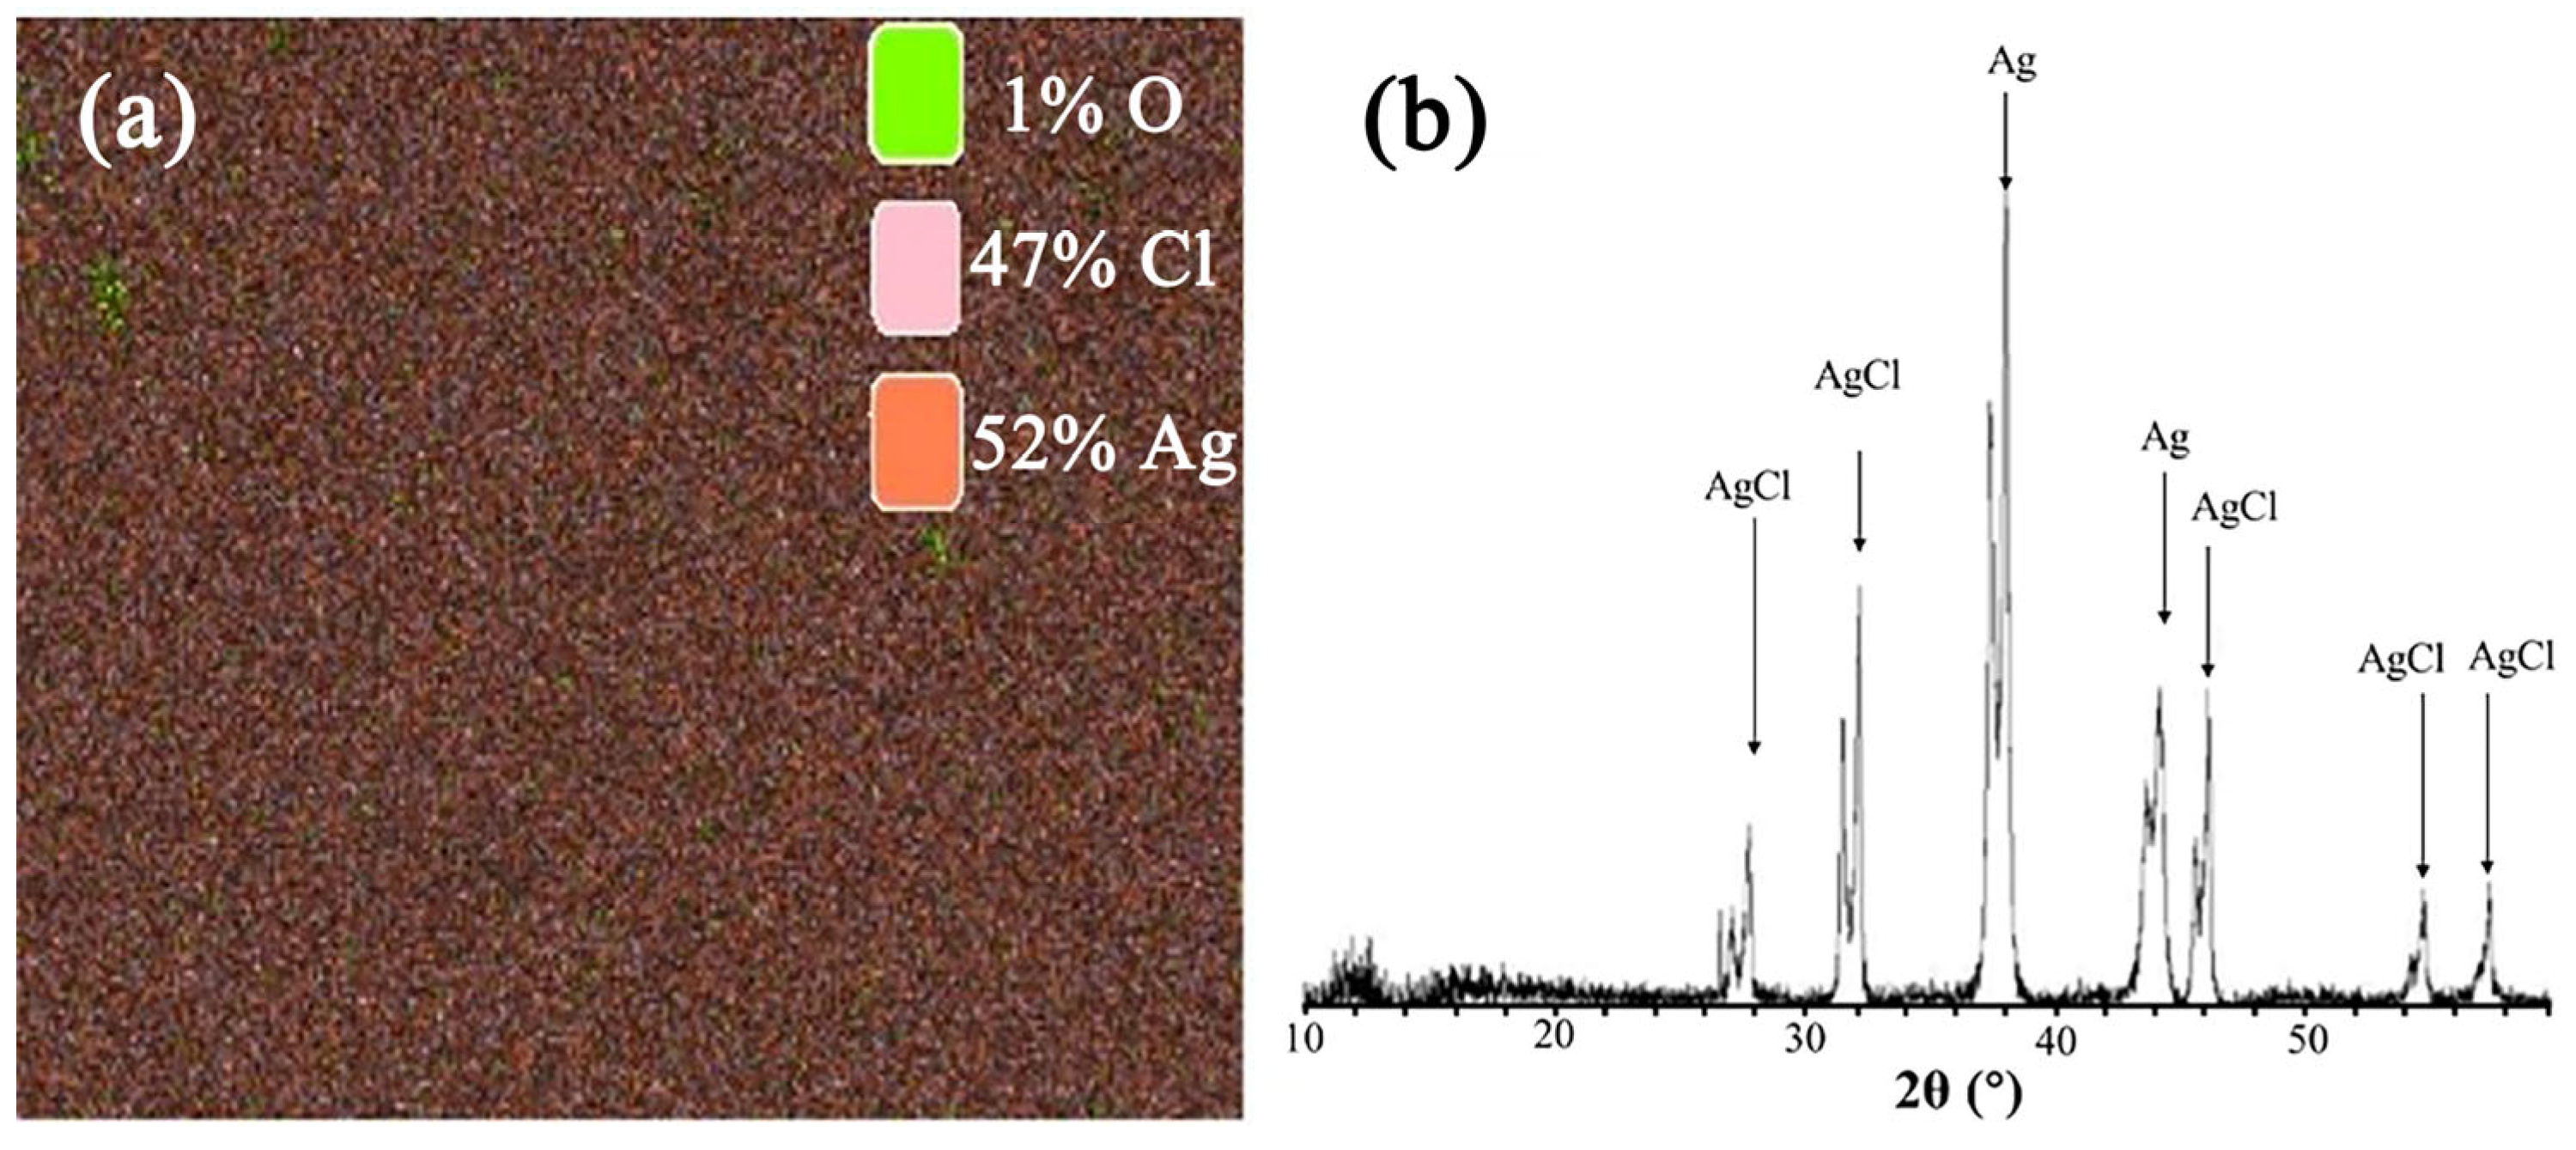
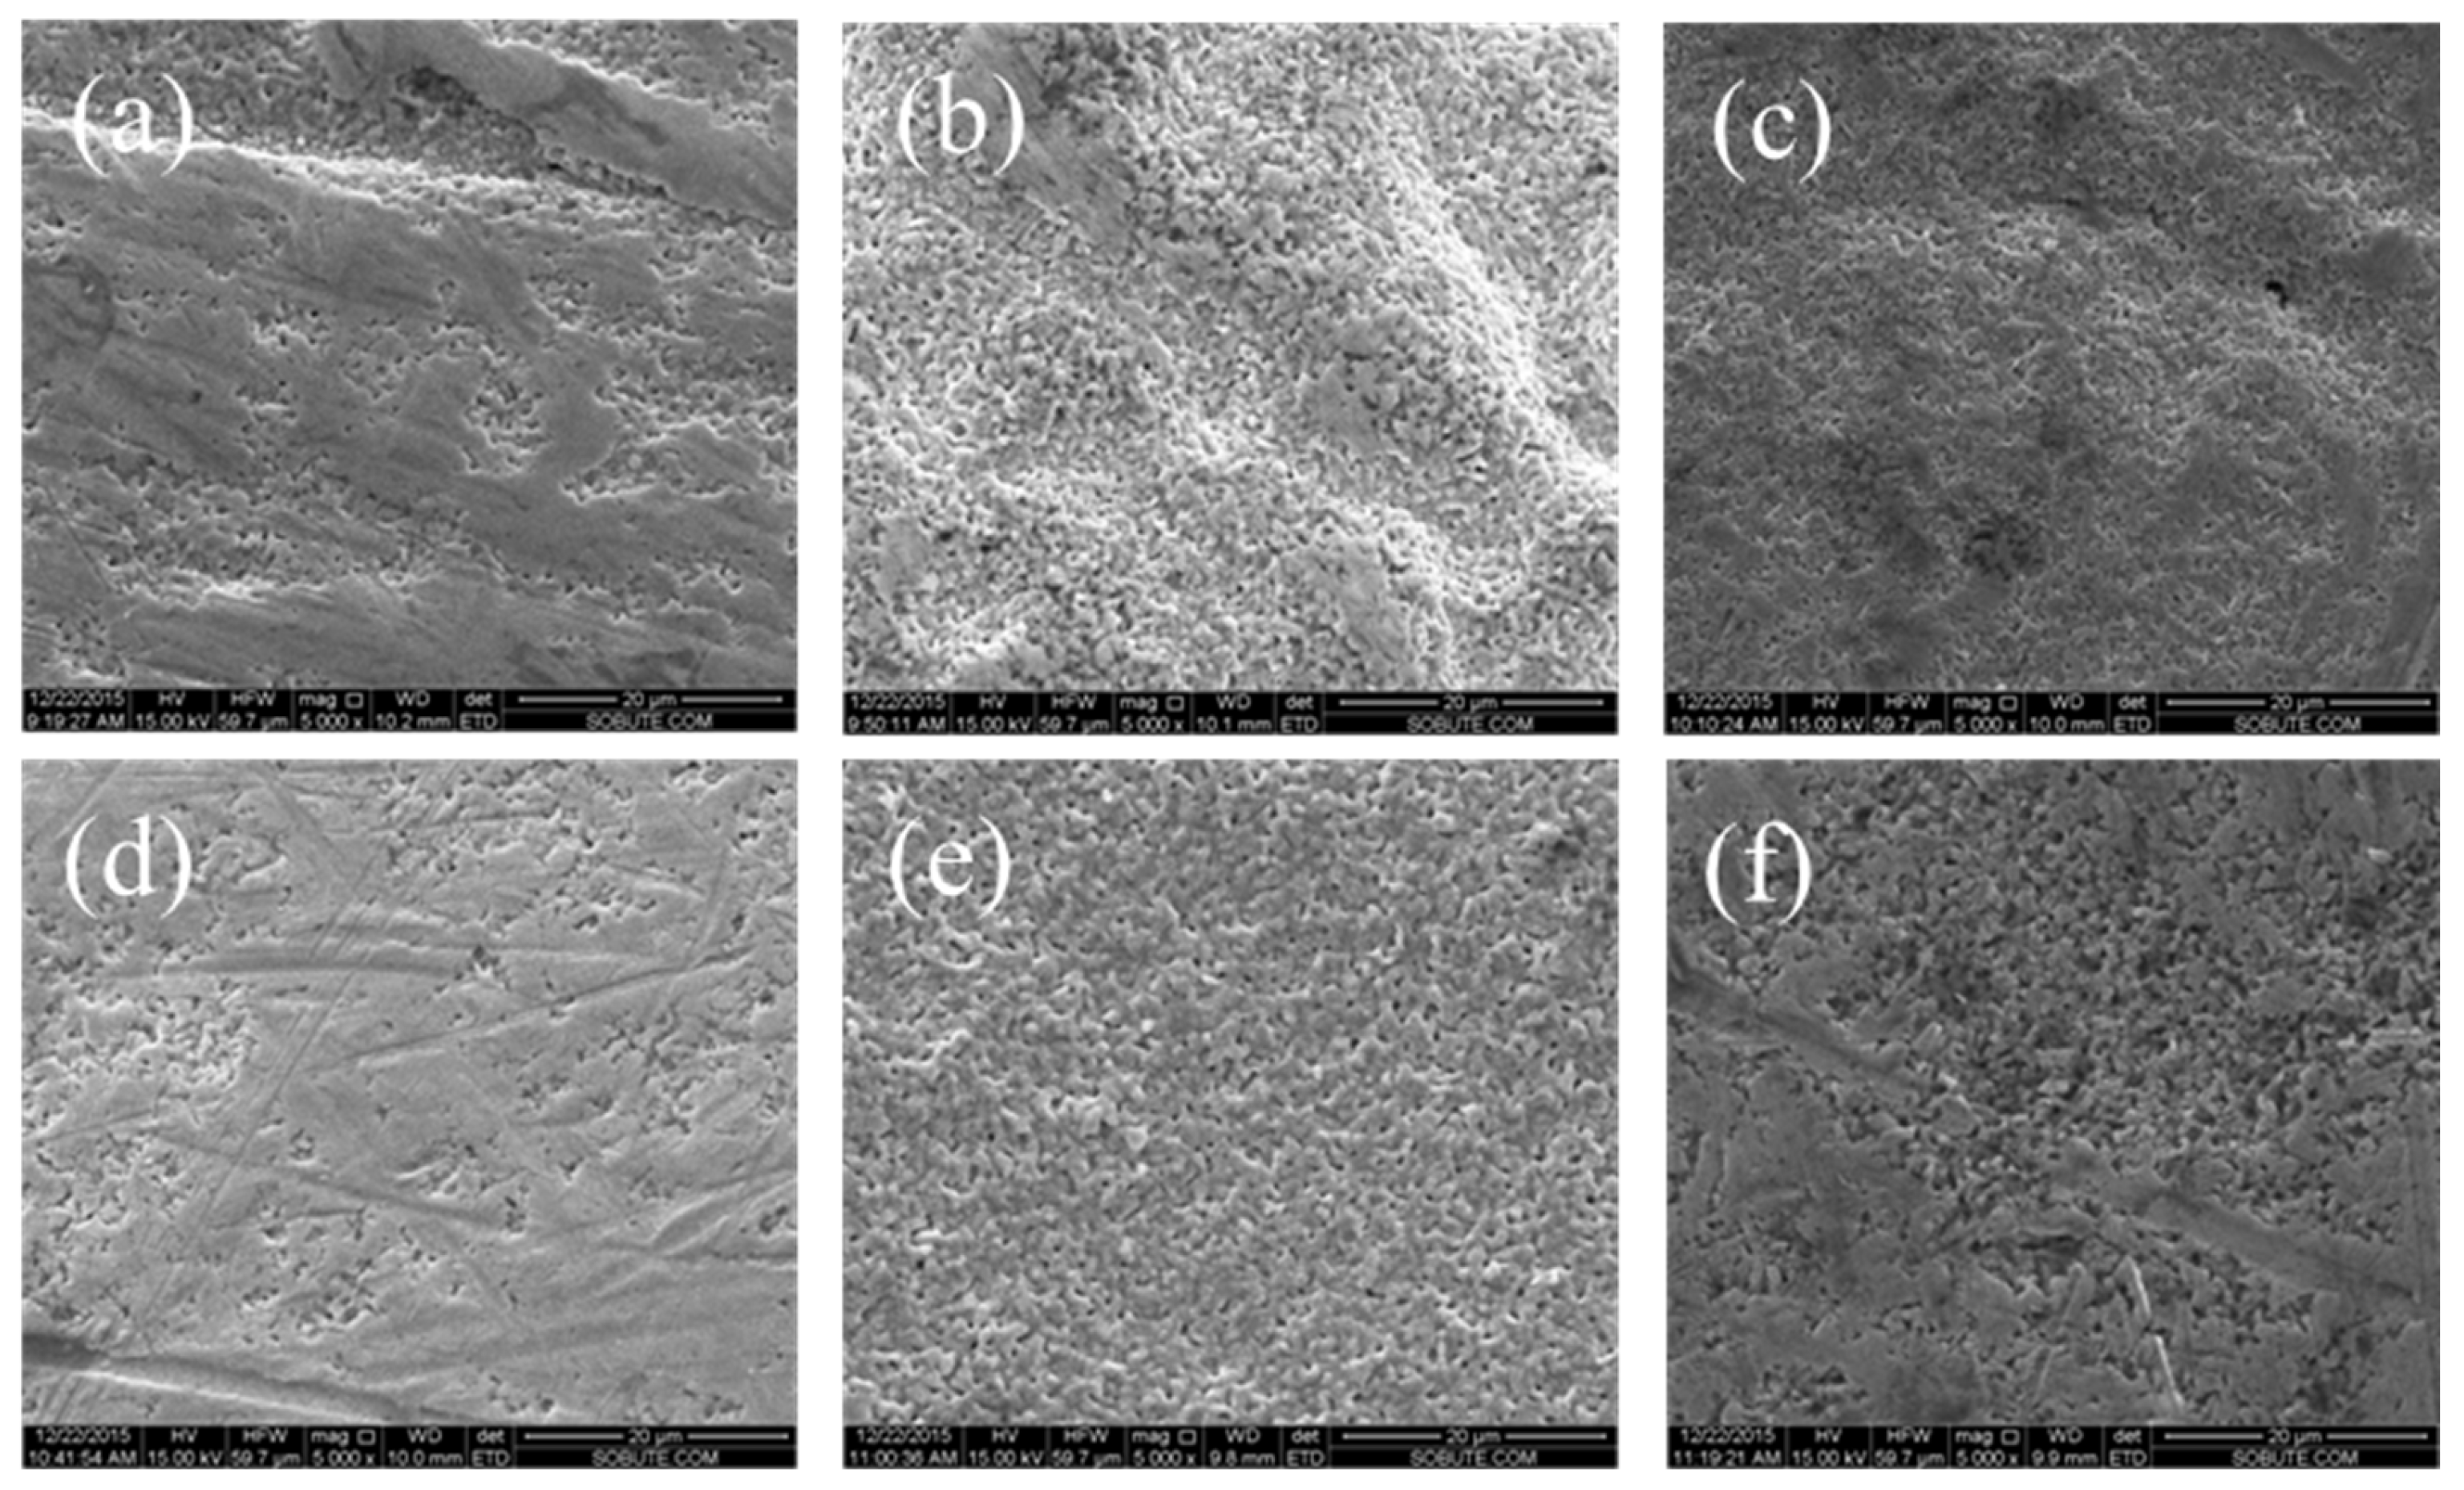
3.1.2. Micromorphology of Ag/AgCl Electrode
3.1.3. Response Time of Ag/AgCl Electrode
3.1.4. Nernst Response of Ag/AgCl Electrode
3.1.5. Stability and Reproducibility of Ag/AgCl Electrode
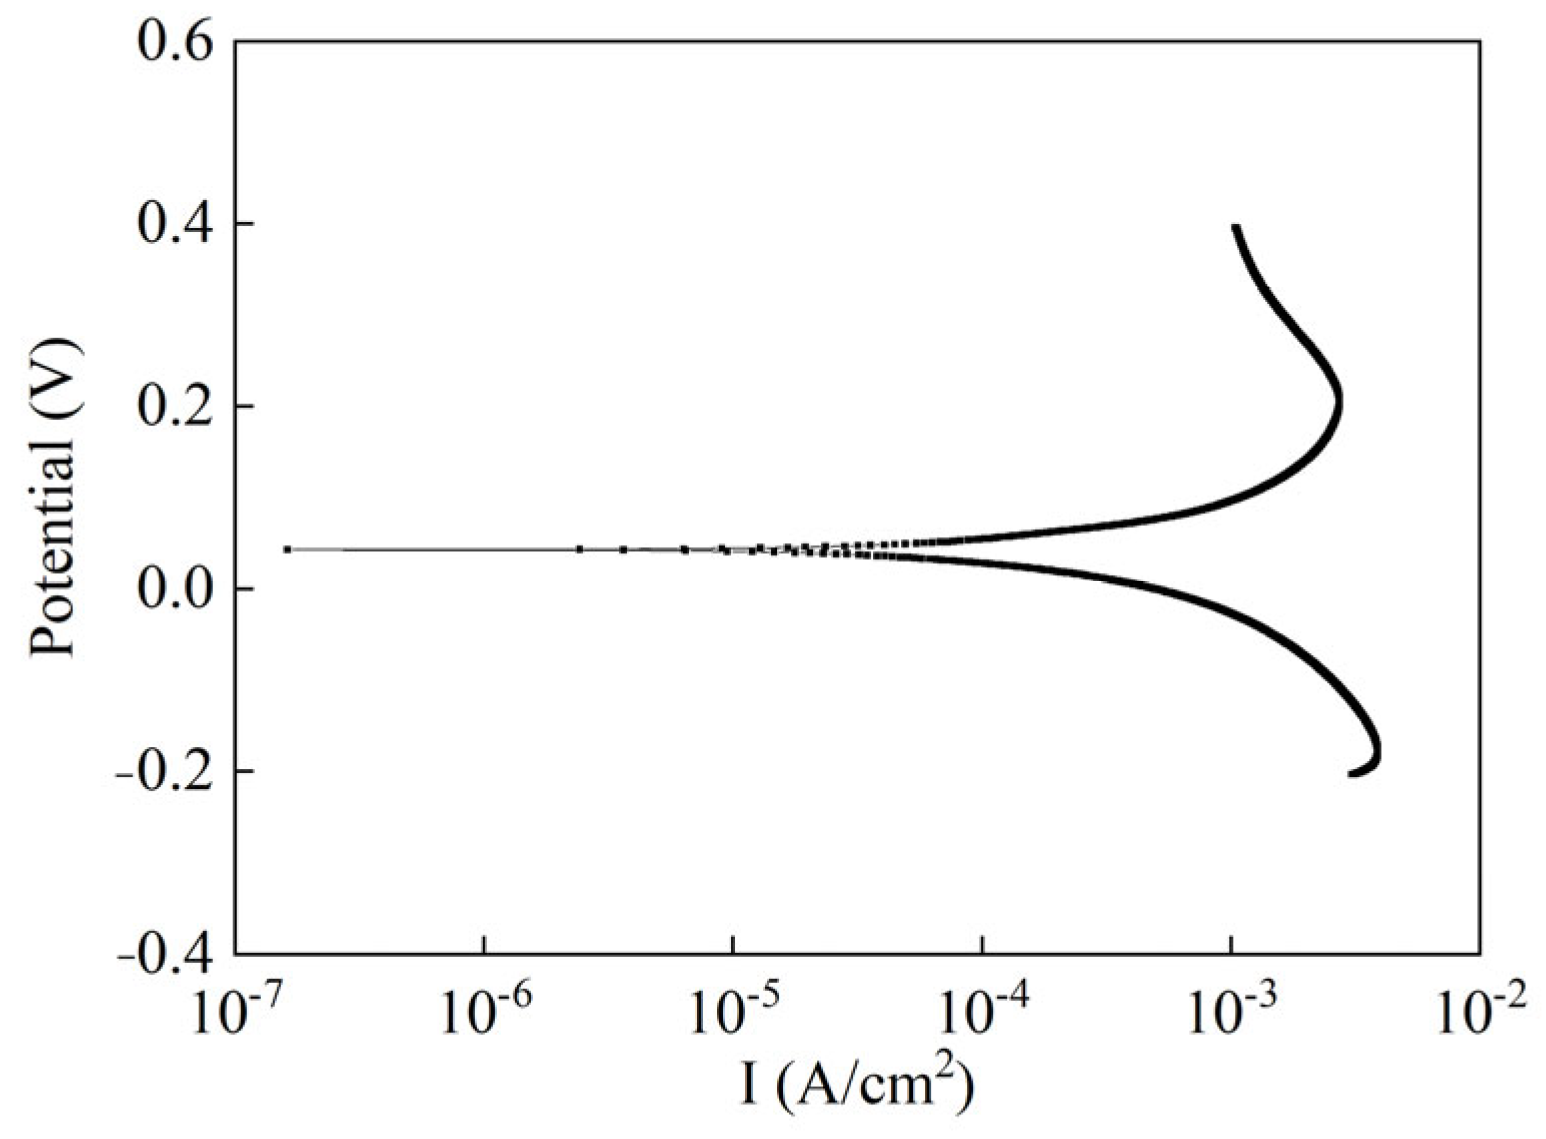
3.1.6. Anti-Polarization Capability of Ag/AgCl Electrode
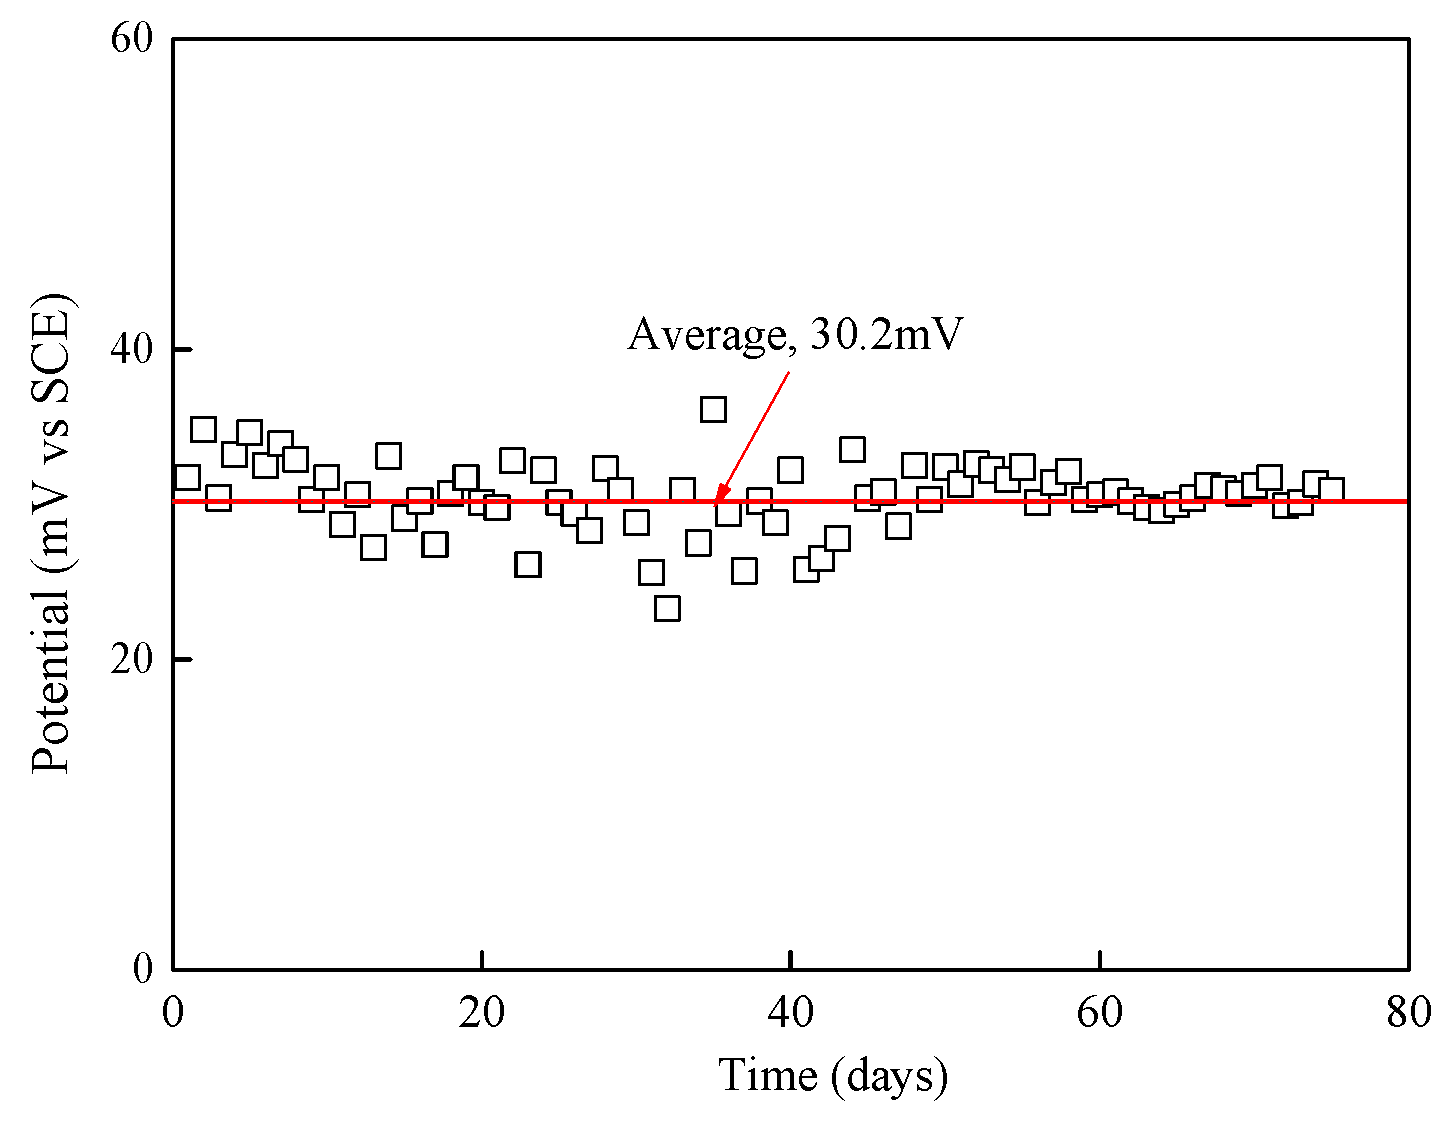
3.2. Stability of Potential of Mn/MnO2 Reference Electrode
3.3. Performance of Chloride Sensor
3.3.1. Response Time of Chloride Sensor in Saturated Ca(OH)2 Solution
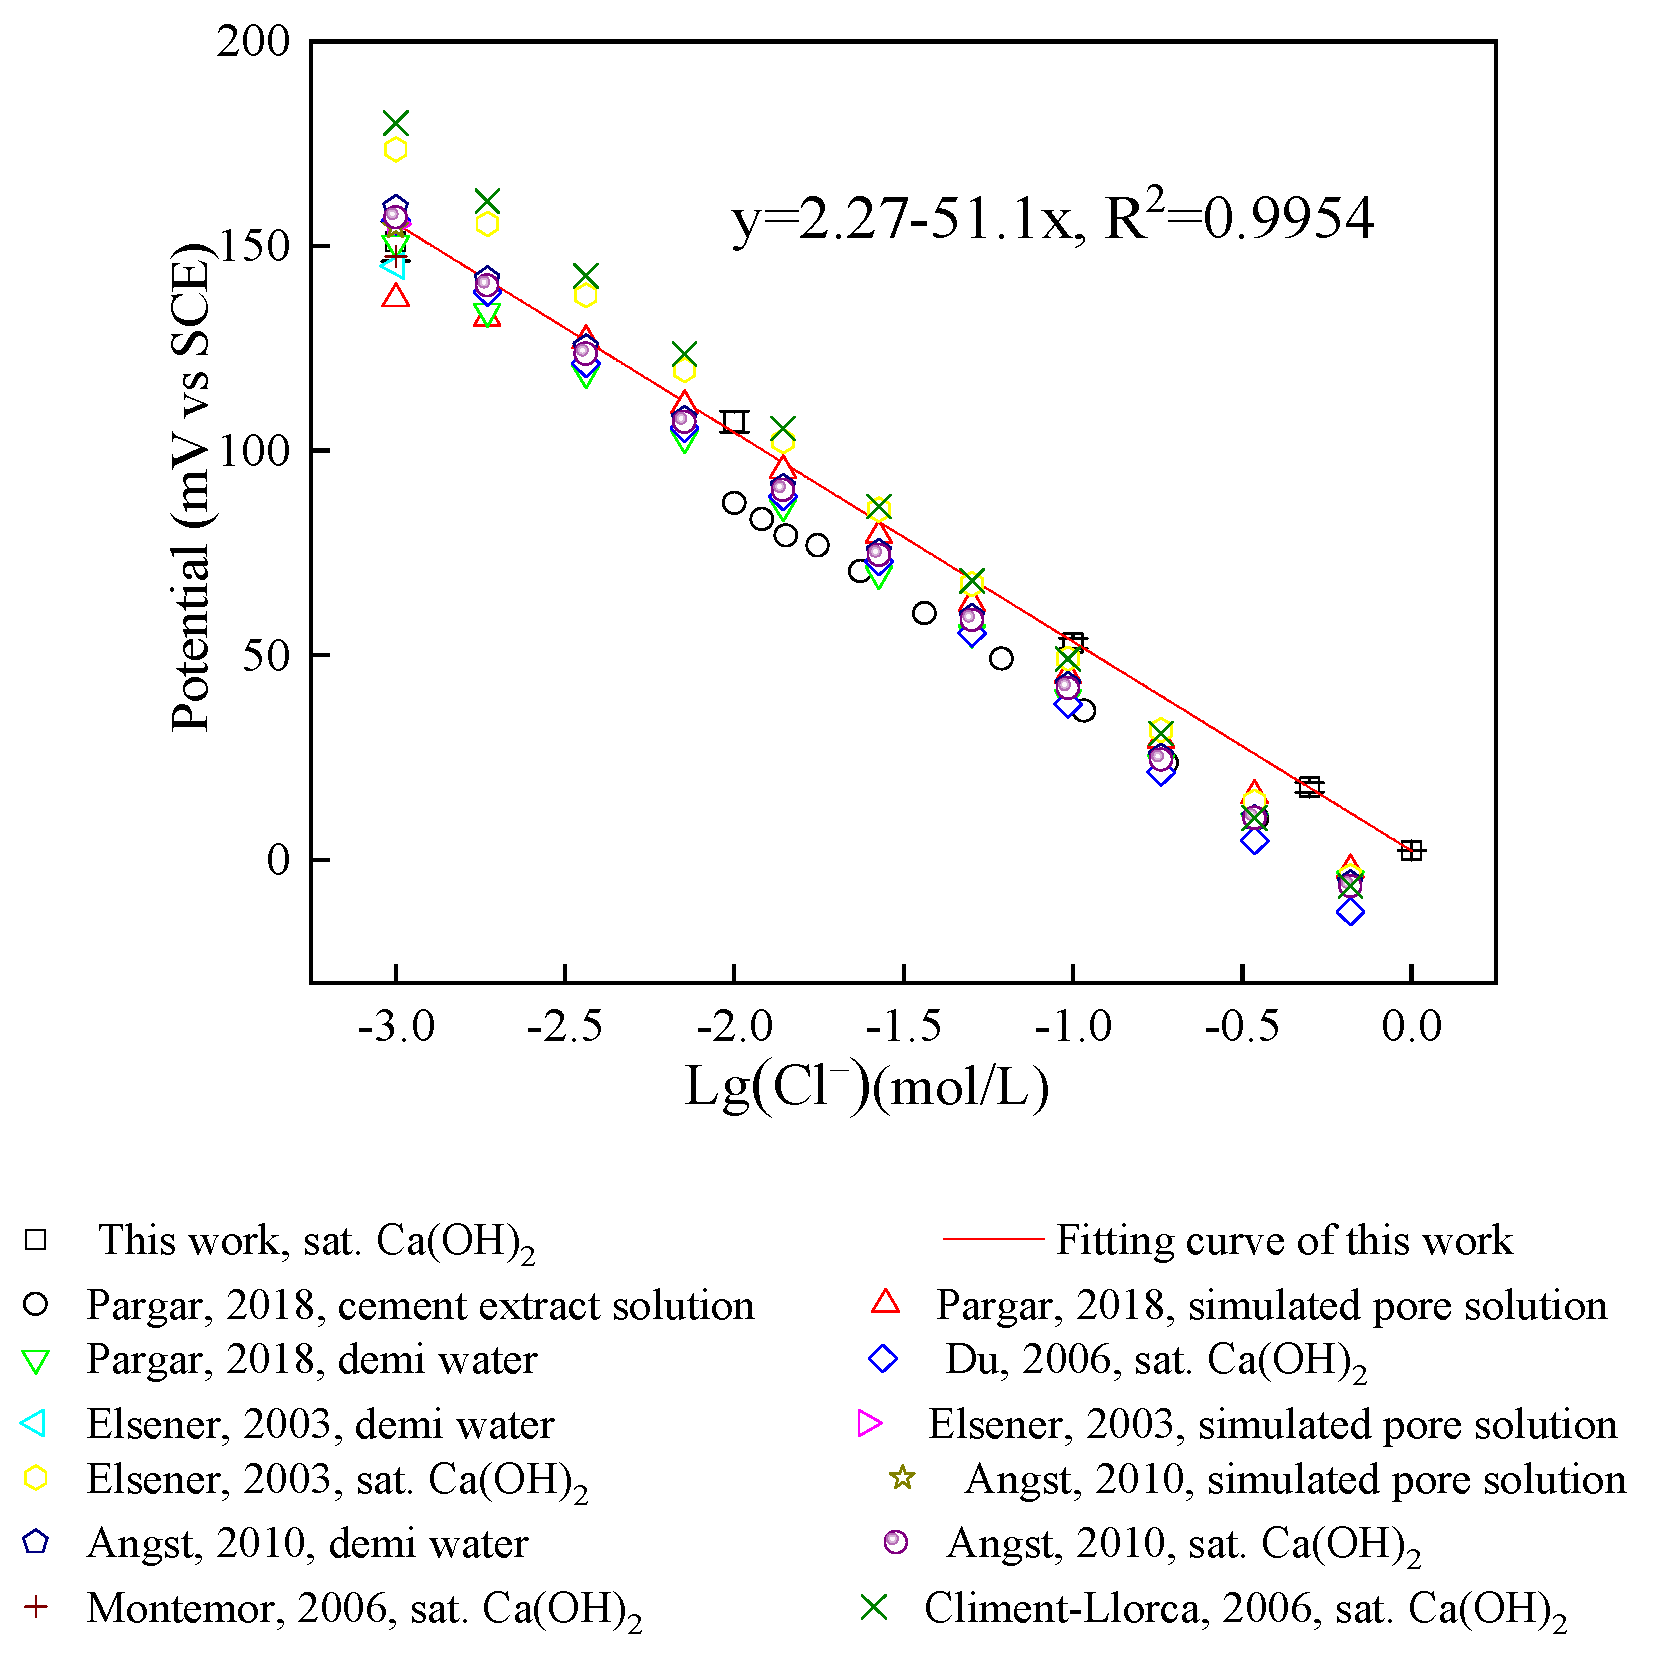
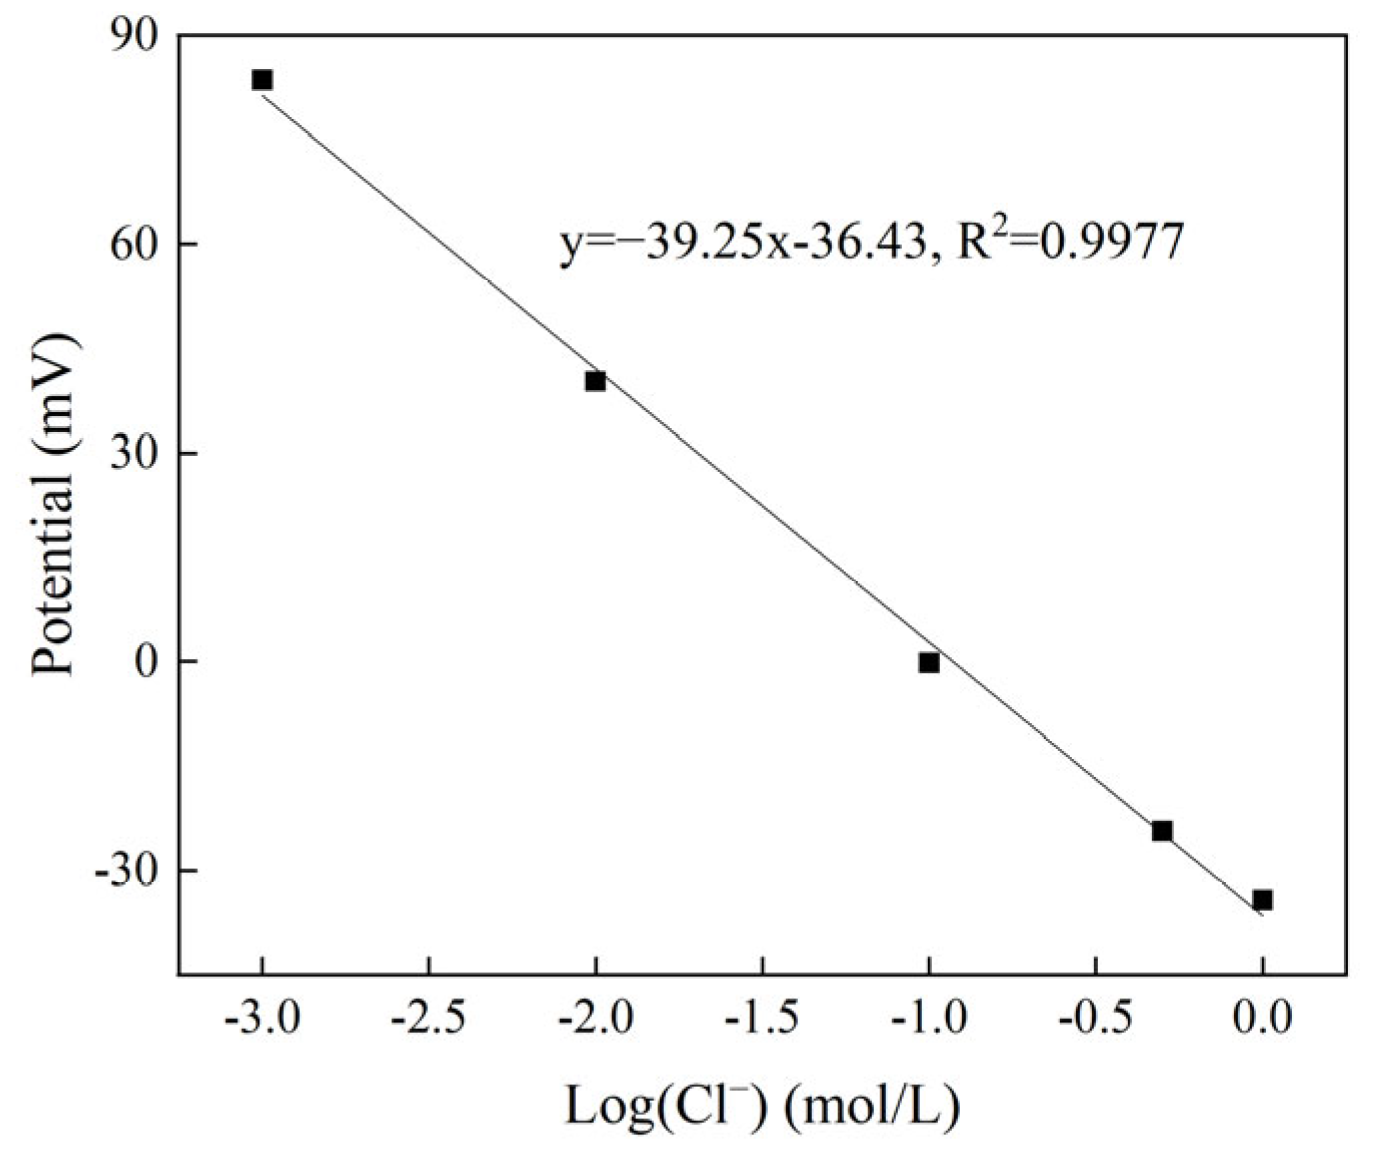
3.3.2. Nernst Response of Chloride Sensor in Saturated Ca(OH)2 Solution
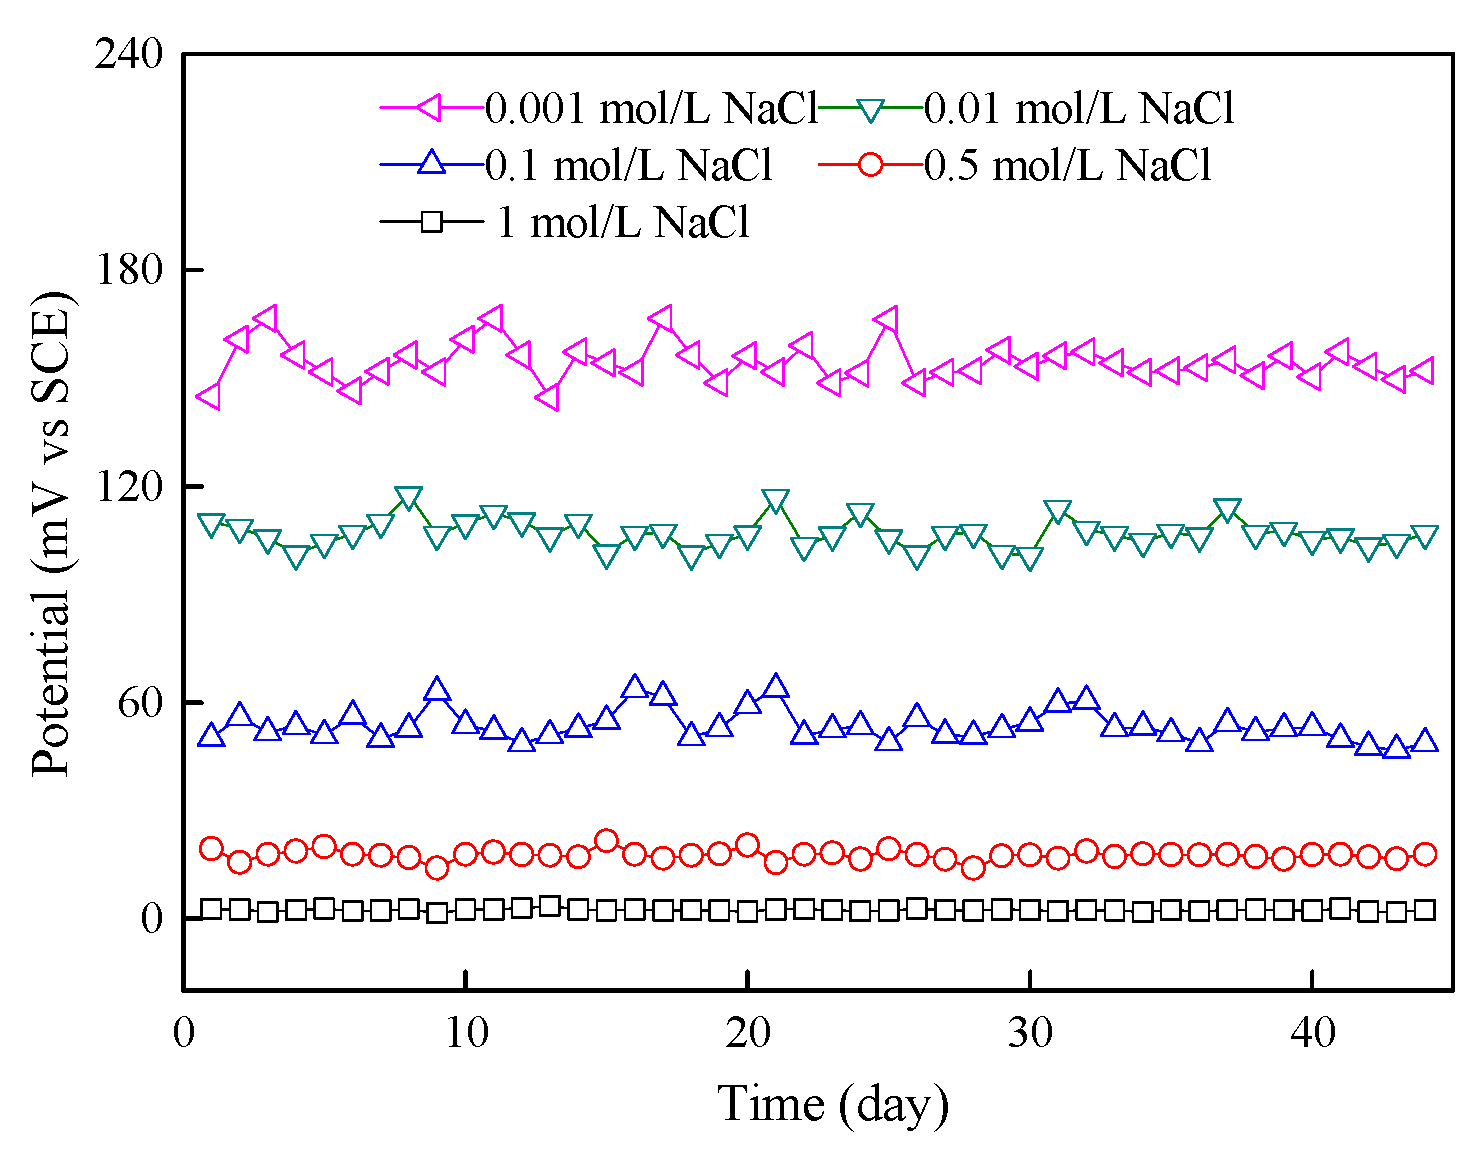
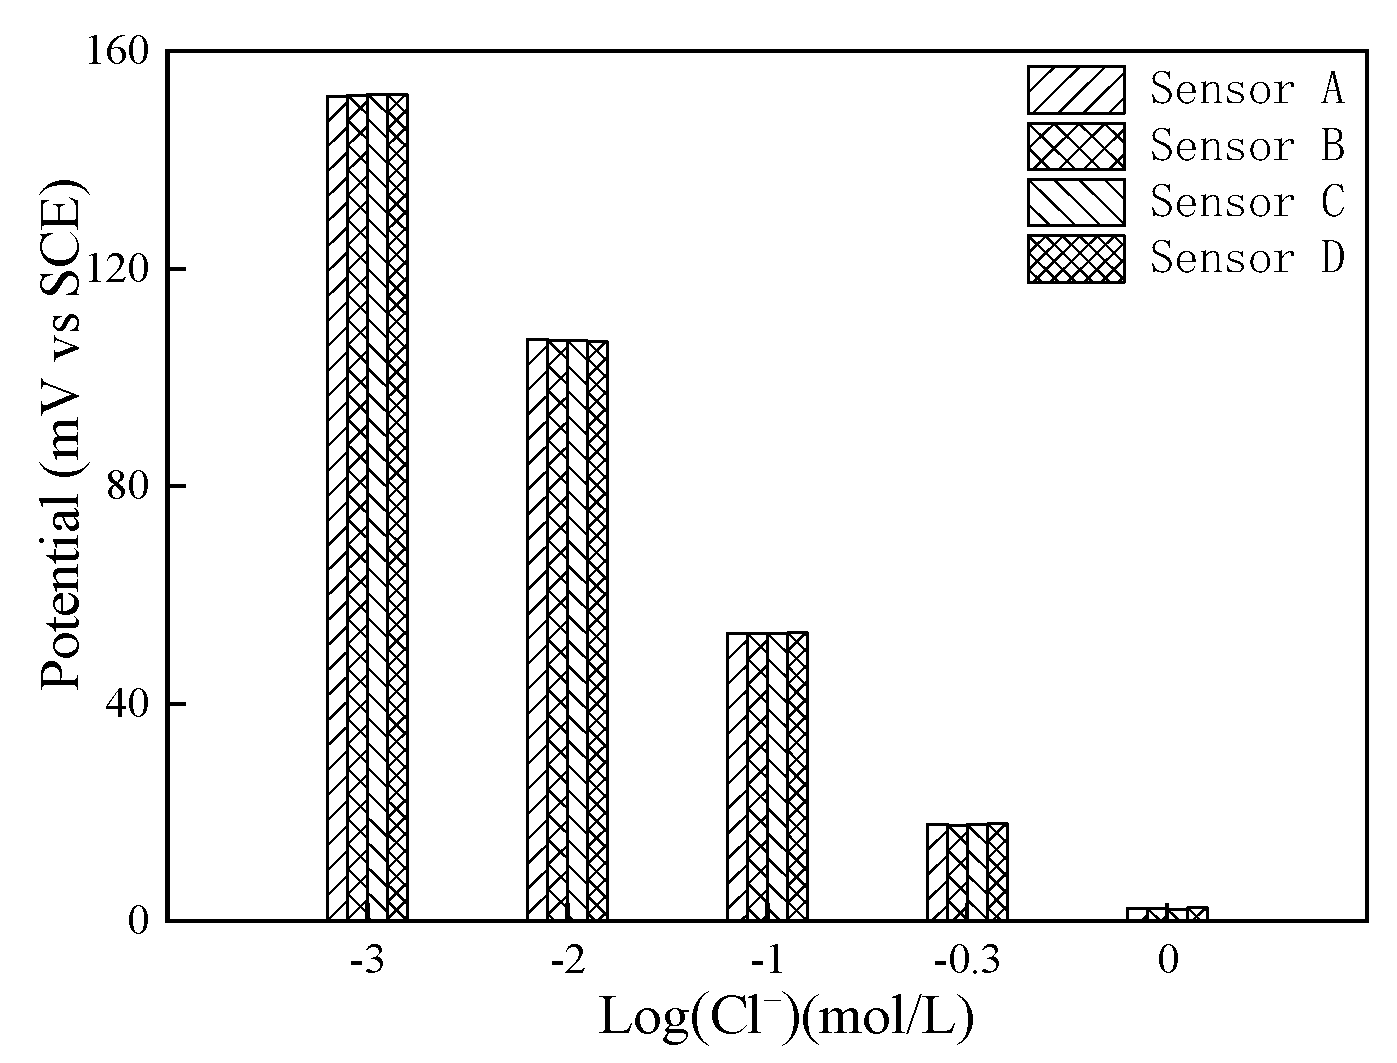
3.3.3. Stability and Reproducibility of Chloride Sensor in Saturated Ca(OH)2 Solution
3.3.4. Calibration of Chloride Sensor in Mortar
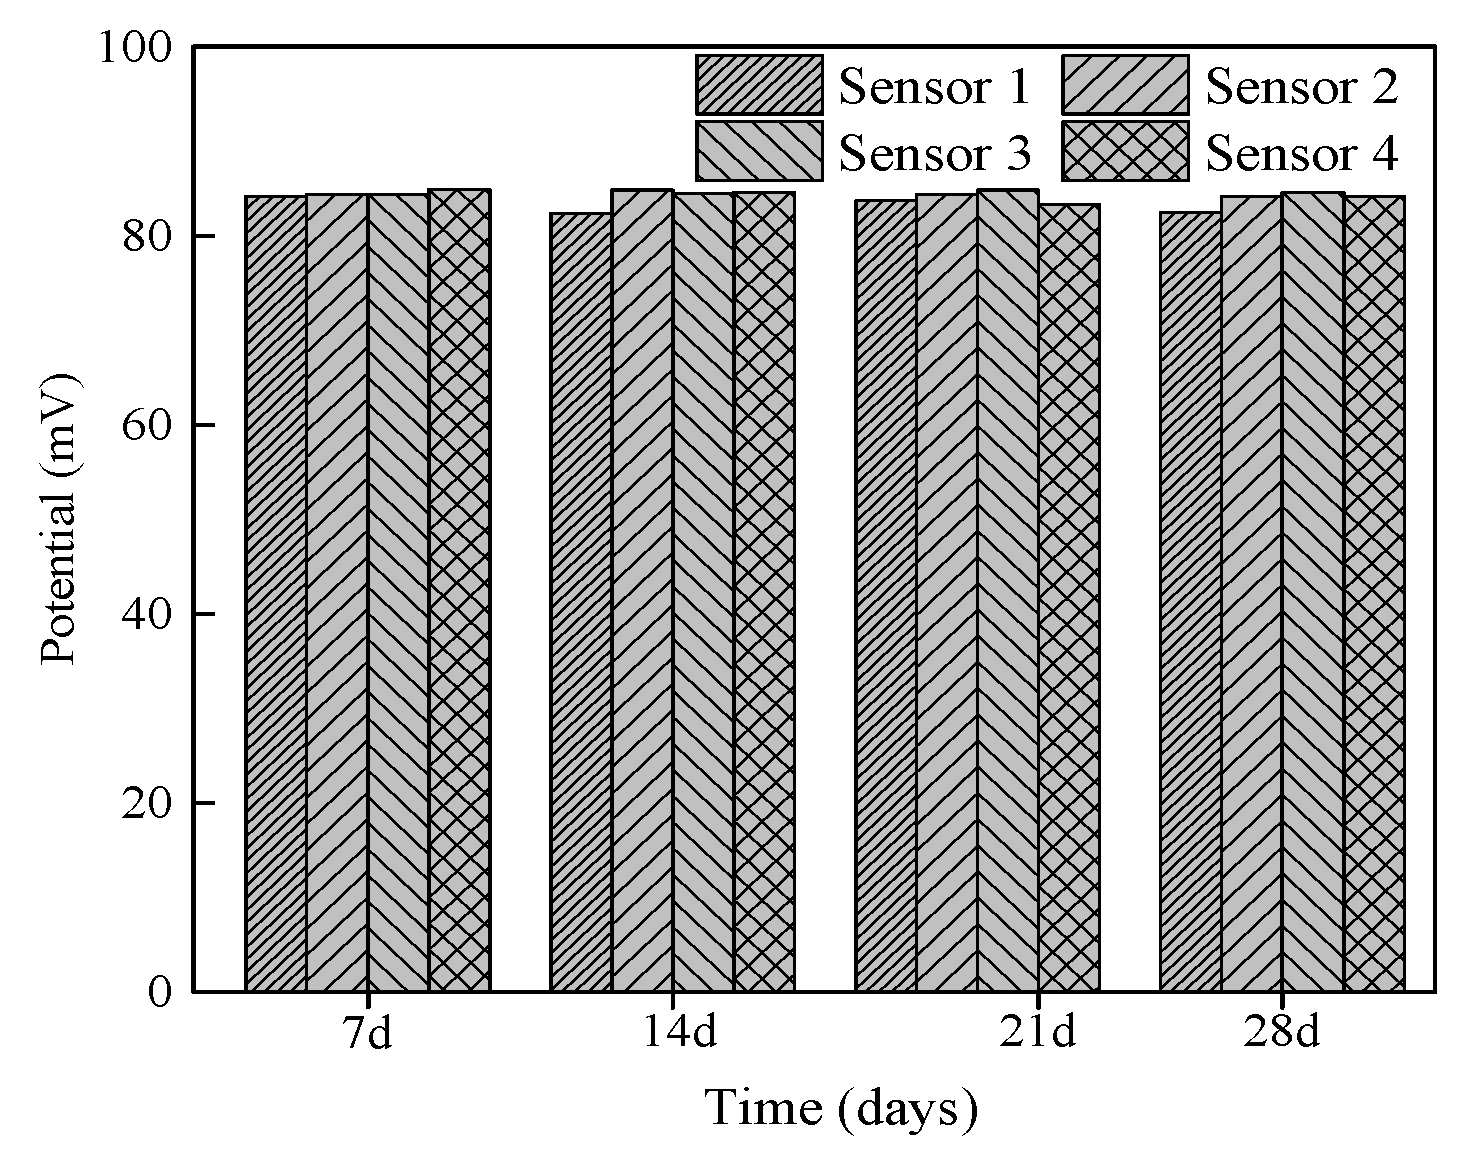
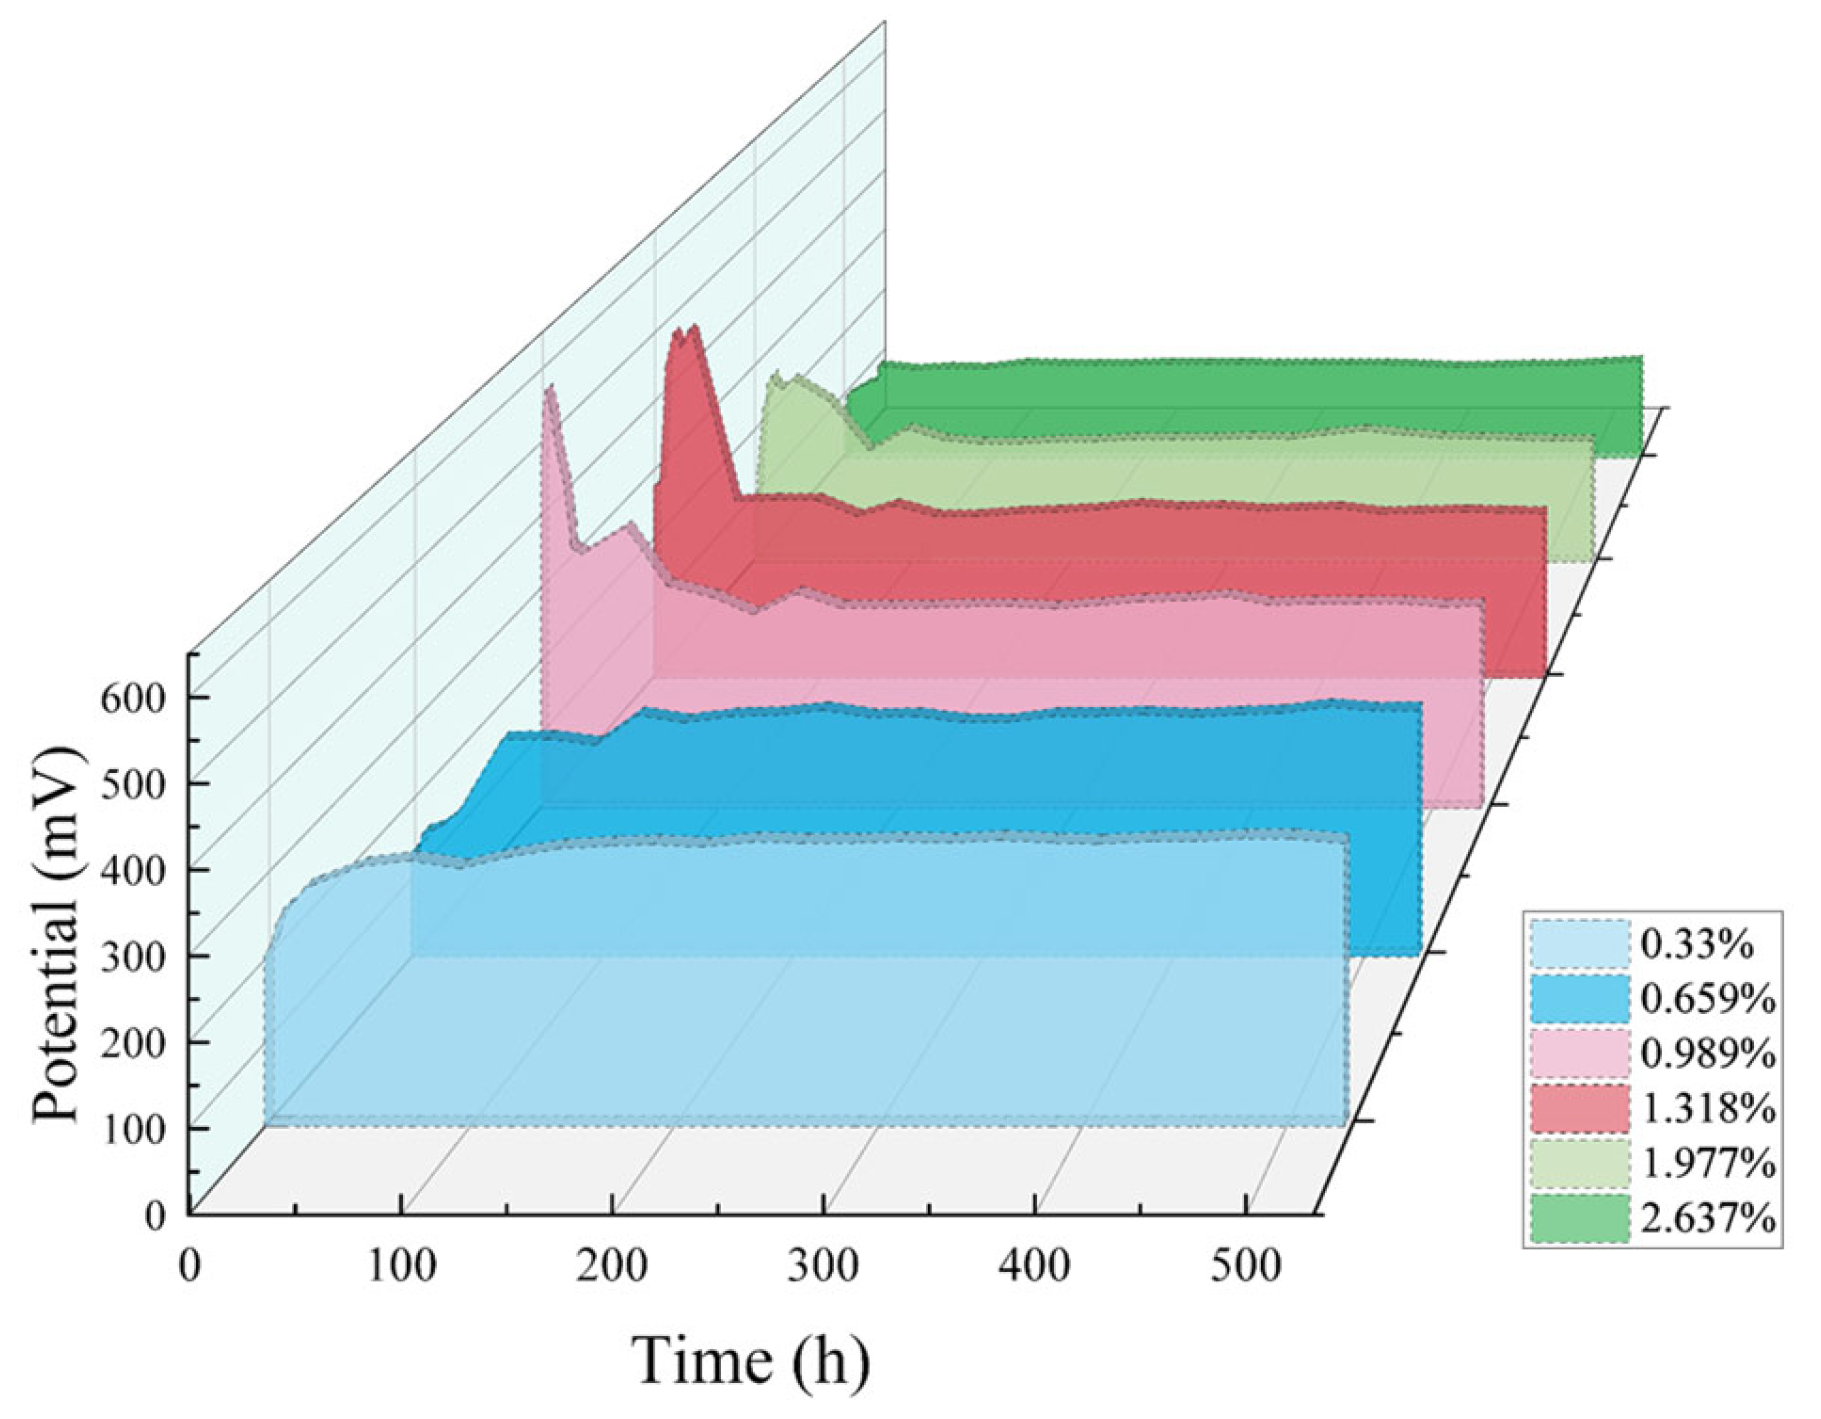
3.3.5. Stability of Chloride Sensor in Mortar
4. Conclusions
Author Contributions
Funding
Institutional Review Board Statement
Informed Consent Statement
Data Availability Statement
Conflicts of Interest
References
- Karthick, S.; Kwon, S.J.; Lee, H.S.; Muralidharan, S.; Saraswathy, V.; Natarajan, R. Fabrication and evaluation of a highly durable and reliable chloride monitoring sensor for civil infrastructure. RSC Adv. 2017, 7, 31252–31263. [Google Scholar] [CrossRef]
- Bertolini, L.; Elsener, B.; Pedeferri, P.; Polder, R. Corrosion of Steel in Concrete—Prevention, Diagnosis, Repair; Wiley VCH Verlag Gmbh & Co Kgaa: Weinheim, Germany, 2013; Volume 49, pp. 4113–4133. [Google Scholar]
- Wang, P.; Fu, H.; Zuo, W.; Luo, S.; Zhao, H.; Feng, P.; Wang, H. Effect of nCSH-PCE and slag powder on the autogenous shrinkage of high-strength steam-free pipe pile concrete. Constr. Build. Mater. 2022, 325, 126815. [Google Scholar] [CrossRef]
- Atkins, C.; Carter, M.; Scantlebury, J. Sources of error in using silver/silver chloride electrodes to monitor chloride activity in concrete. Cem. Concr. Res. 2001, 31, 1207–1211. [Google Scholar] [CrossRef]
- Abbas, Y.; Olthuis, W.; van den Berg, A. A chronopotentiometric approach for measuring chloride ion concentration. Sens. Actuators B Chem. 2013, B188, 433–439. [Google Scholar] [CrossRef]
- Torres-Luque, M.; Bastidas-Arteaga, E.; Schoefs, F.; Sánchez-Silva, M.; Osma, J. Non-destructive methods for measuring chloride ingress into concrete: State-of-the-art and future challenges. Constr. Build. Mater. 2014, 68, 68–81. [Google Scholar] [CrossRef]
- Arya, C.; Buenfeld, N.R.; Newman, J.B. Assessment of simple methods of determining the free chloride ion content of cement paste. Cem. Concr. Res. 1987, 17, 907–918. [Google Scholar] [CrossRef]
- Song, S.; Li, P.; Zhou, W.; Wang, X. Research on a fiber Bragg grating based corrosion sensor. J. Optoelectron. Laser 2015, 26, 1866–1872. [Google Scholar]
- Moustafa, A.; Niri, E.D.; Farhidzadeh, A.; Salamone, S. Corrosion monitoring of post-tensioned concrete structures using fractal analysis of guided ultrasonic waves. Struct. Control Health Monit. 2014, 21, 438–448. [Google Scholar] [CrossRef]
- Dong, S.Y.; Liao, Y.B.; Tian, Q.; Sun, L.Q.; Wang, H.R. Applications of Fiber Optic Sensor Technique to Corrosion Monitoring. J. Anal. Sci. 2004, 20, 546–550. [Google Scholar]
- Jin, M.; Jiang, L.; Tao, D.; Bai, S. Characterization of Ag/AgCl electrode manufactured by immersion in sodium hypochloride acid for monitoring chloride content in concrete. Constr. Build. Mater. 2016, 122, 310–319. [Google Scholar] [CrossRef]
- Du, R.-G.; Hu, R.-G.; Huang, R.-S.; Lin, C.-J. In situ measurement of Cl-concentrations and pH at the reinforcing steel/concrete interface by combination sensors. Anal. Chem. 2006, 78, 3179–3185. [Google Scholar] [CrossRef] [PubMed]
- Atkins, C.P.; Scantlebury, J.D.; Nedwell, P.J.; Blatch, S.P. Monitoring chloride concentrations in hardened cement pastes using ion selective electrodes. Cem. Concr. Res. 1996, 26, 319–324. [Google Scholar] [CrossRef]
- Alonso, M.C.; Sanchez, M. Analysis of the variability of chloride threshold values in the literature. Mater. Corros. 2009, 60, 631–637. [Google Scholar] [CrossRef]
- Pargar, F.; Kolev, H.; Koleva, D.A.; Breugel, K.V. Microstructure, surface chemistry and electrochemical response of Ag|AgCl sensors in alkaline media. J. Mater. Sci. 2018, 53, 7527–7550. [Google Scholar] [CrossRef]
- Climent-Llorca, M.A.; Viqueira-Pérez, E.; López-Atalaya, M.M. Embeddable Ag/AgCl sensors for in-situ monitoring chloride contents in concrete. Cem. Concr. Res. 1996, 26, 1157–1161. [Google Scholar] [CrossRef]
- Shanghua, L.; Guangyi, T.; Ang, J. Powder Pellets Preparation for X-Ray Fluorescence Analysis. Chin. J. Spectrosc. Lab. 1998, 15, 9–15. [Google Scholar]
- Weixuan, Z.; Hengjing, B. Application of the Ag/AgCl chloride sensor in concrete. J. Funct. Mater. 2010, 41 (Suppl. 2), 371–374. [Google Scholar]
- Pargar, F.; Kolev, H.; Koleva, D.A.; van Breugel, K. Potentiometric Response of Ag/AgCl Chloride Sensors in Model Alkaline Medium. Adv. Mater. Sci. Eng. 2018, 2018, 8135492. [Google Scholar] [CrossRef]
- Femenias, Y.S.; Angst, U.; Caruso, F.; Elsener, B. Ag/AgCl ion-selective electrodes in neutral and alkaline environments containing interfering ions. Mater. Struct. 2016, 49, 2637–2651. [Google Scholar] [CrossRef]
- Pargar, F.; Koleva, D.; Koenders, E.; Van Breugel, K. The importance of chloride sensors stability in monitoring ageing phenomena in concrete structures: Ag/AgCl electrodes performance in simulated pore-water environment. In Proceedings of the AMS 14: 1st Ageing of Materials & Structures Conference, Delft, The Netherlands, 26–28 May 2014; DCMat Ageing Centre, Delft University of Technology: Delft, The Netherlands, 2014. [Google Scholar]
- Montemor, M.F.; Alves, J.H.; Simoes, A.M.; Fernandes, J.C.S.; Lourenço, Z.; Costa, A.J.S.; Appleton, A.J.; Ferreira, M.G.S. Multiprobe chloride sensor for in situ monitoring of reinforced concrete structures. Cem. Concr. Compos. 2006, 28, 233–236. [Google Scholar] [CrossRef]
- Tang, Y.B.; Wang, S.N. Preparation and properties of a pre-embeddable monitoring sensor in concrete. Port Waterw. Eng. 2015, 3, 99–103. [Google Scholar]
- Maminska, R.; Dybko, A.; Wroblewski, W. All-solid-state miniaturised planar reference electrodes based on ionic liquids. Sens. Actuators B 2006, B115, 552–557. [Google Scholar] [CrossRef]
- Muralidharan, S.; Ha, T.-H.; Bae, J.-H. Electrochemical studies on the solid embeddable reference sensors for corrosion monitoring in concrete structure. Mater. Lett. 2006, 60, 651–655. [Google Scholar] [CrossRef]
- Karthick, S.P.; Muralidharan, S.; Saraswathy, V.; Thangavel, K. Long-term relative performance of embedded sensor and surface mounted electrode for corrosion monitoring of steel in concrete structures. Sens. Actuators B Chem. 2014, B192, 303–309. [Google Scholar] [CrossRef]
- Angst, U.M.; Elsener, B.; Larsen, C.K.; Vennesland, O. Chloride induced reinforcement corrosion: Electrochemical monitoring of initiation stage and chloride threshold values. Corros. Sci. 2011, 53, 1451–1464. [Google Scholar] [CrossRef]
- Rogulski, Z.; Siwek, H.; Paleska, I.; Czerwiński, A. Electrochemical behavior of manganese dioxide on a gold electrode. J. Electroanal. Chem. 2003, 543, 175–185. [Google Scholar] [CrossRef]
- Penggang, W.; Yuan, W.; Tengfei, G.; Tiejun, Z.; Li, T.; Zuquan, J.; Xiaomei, W.; Lanqin, W. Preparation and Characterization of Mn/MnO2 Reference Electrode for Buried Concrete. Adv. Eng. Sci. 2020, 52, 207. [Google Scholar]
- Tian, Y.; Zhang, P.; Zhao, K.; Du, Z.; Zhao, T. Application of Ag/AgCl Sensor for Chloride Monitoring of Mortar under Dry-Wet Cycles. Sensors 2020, 20, 1394. [Google Scholar] [CrossRef] [PubMed]
- Angst, U.; Elsener, B.; Larsen, C.K.; Vennesland, O. Potentiometric determination of the chloride ion activity in cement based materials. J. Appl. Electrochem. 2010, 40, 561–573. [Google Scholar] [CrossRef]
- Jin, M.; Xu, J.; Jiang, L.; Xu, Y.; Chu, H. Investigation on the performance characteristics of chloride selective electrode in concrete. Ionics 2015, 21, 2981–2992. [Google Scholar] [CrossRef]
- Elsener, B.; Zimmermann, L.; Böhni, H. Non destructive determination of the free chloride content in cement based materials. Mater. Corros. 2003, 54, 440–446. [Google Scholar] [CrossRef]
- Yongjing, G.; Jingli, H.; Zehua, D. Preparation and properties of solid-state chloride ion selective electrode for detecting chloride ions in concrete. Corros. Sci. Prot. Technol. 2015, 27, 211–218. [Google Scholar]
- Cooper, S.J.; Bertei, A.; Finegan, D.P.; Brandon, N.P. Simulated impedance of diffusion in porous media. Electrochim. Acta 2017, 251, 681–689. [Google Scholar] [CrossRef]
- Gao, X.; Zhang, J.; Yang, Y.; Deng, H. Fabrication and performance of all-solid-state chloride sensors in synthetic concrete pore solutions. Sensors 2010, 10, 10226–10239. [Google Scholar] [CrossRef] [PubMed]
- Penggang, W.; Yuting, J.; Tao, L.; Dongshuai, H.; Qi, Z. Molecular dynamics study on ions and water confined in the nanometer channel of Friedel’s salt: Structure, dynamics and interfacial interaction. Phys. Chem. Chem. Phys. 2018, 20, 27049–27058. [Google Scholar]
- Yuan, Q.; Shi, C.; Schutter, G.D.; Audenaert, K.; Deng, D. Chloride binding of cement-based materials subjected to external chloride environment—A review. Constr. Build. Mater. 2009, 23, 1–13. [Google Scholar] [CrossRef]


| Cl−/cement, % | 0.2 | 0.4 | 0.6 | 0.8 | 1.2 | 1.6 |
| NaCl/cement, % | 0.330 | 0.659 | 0.989 | 1.318 | 1.977 | 2.637 |
| Solution | Slope | ||||||
|---|---|---|---|---|---|---|---|
| This Paper | Ref. [31] | Ref. [16] | Ref. [19] | Ref. [22] | Ref. [33] | Ref. [12] | |
| Saturated Ca(OH)2 | −51.10 | −57.60 | −61.72 | - | −53.46 | −59.00 | −56.02 |
| CE | - | - | - | −49.73 | - | - | - |
| SPS | - | −57.80 | - | −58.11 | - | −54.00 | - |
| DW | - | −58.30 | - | −55.39 | - | −50.00 | - |
| Theoretical value | −59.16 | ||||||
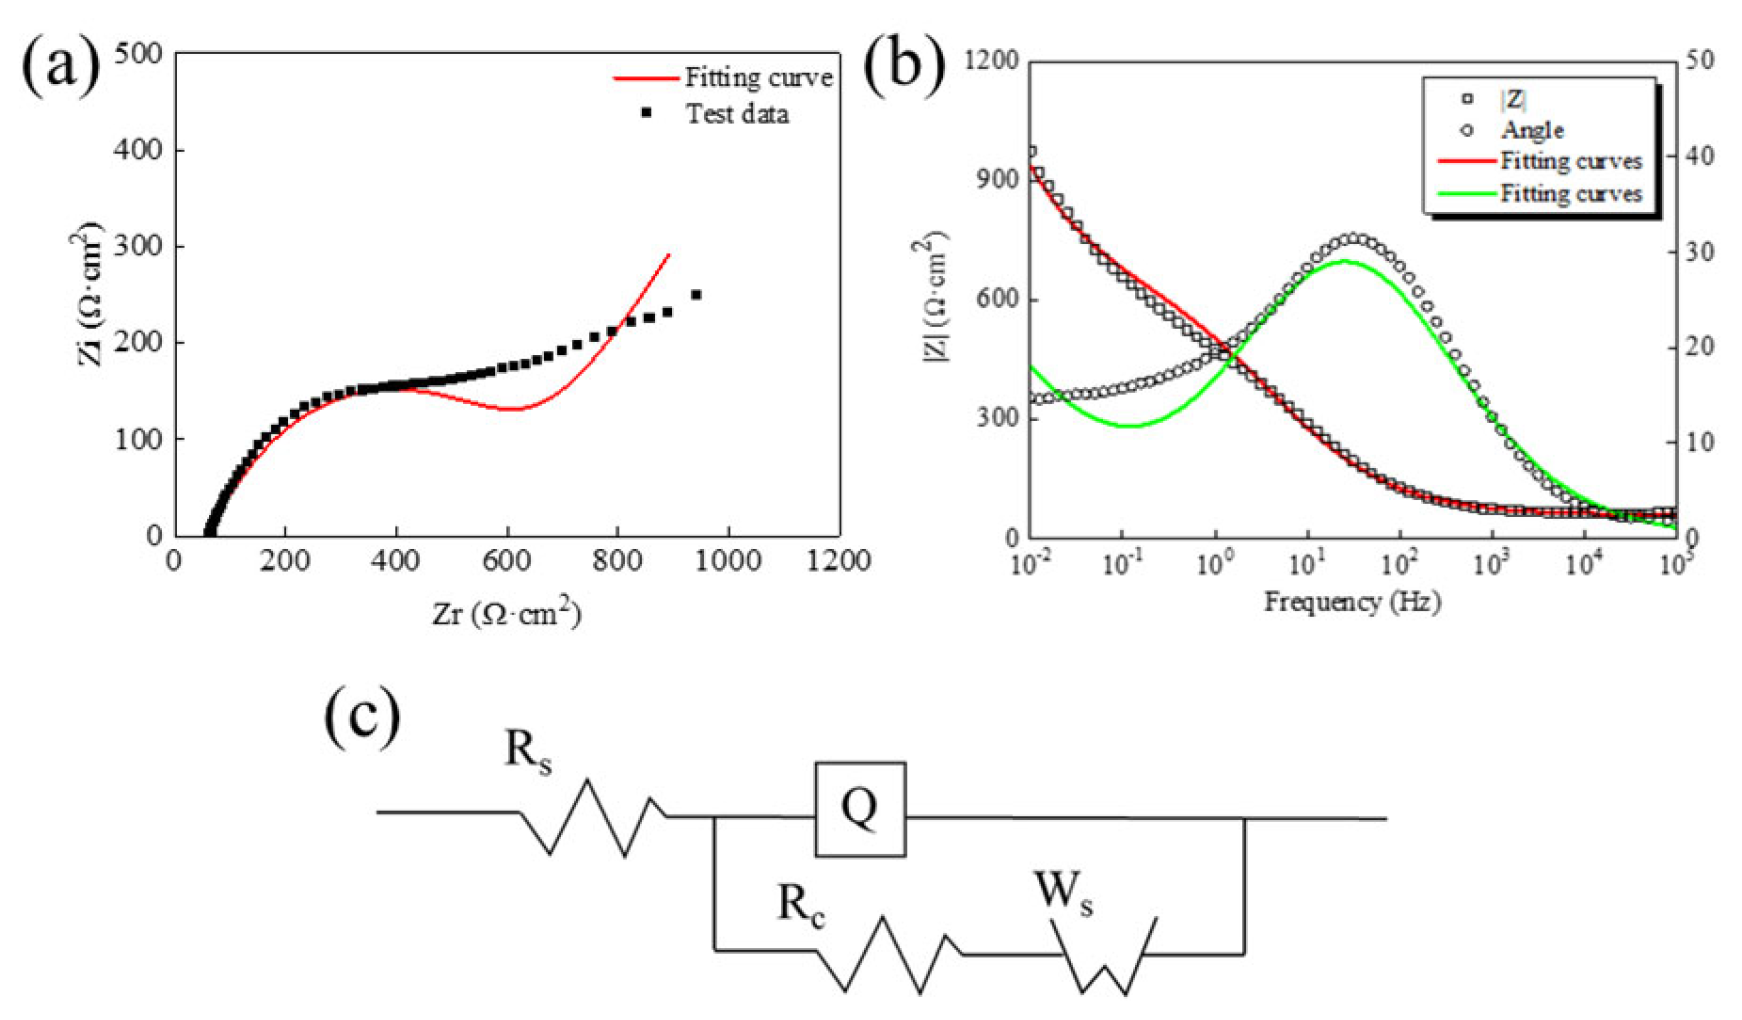
| Rs (Ω·cm2) | Q-Y (F·cm−2) | Q-n | Rc (Ω·cm2) | Ws-Y (F·cm−2) |
|---|---|---|---|---|
| 61.43 | 2.495 × 10⁻⁴ | 0.599 | 542.2 | 8.159 × 10⁻³ |
| Concentration of Cl− (mol/L) | 1 | 0.5 | 0.1 | 0.01 | 0.001 |
| Response time (s) | 5 | 8 | 10 | 24 | 30 |
Disclaimer/Publisher’s Note: The statements, opinions and data contained in all publications are solely those of the individual author(s) and contributor(s) and not of MDPI and/or the editor(s). MDPI and/or the editor(s) disclaim responsibility for any injury to people or property resulting from any ideas, methods, instructions or products referred to in the content. |
© 2024 by the authors. Licensee MDPI, Basel, Switzerland. This article is an open access article distributed under the terms and conditions of the Creative Commons Attribution (CC BY) license (https://creativecommons.org/licenses/by/4.0/).
Share and Cite
Zhang, M.; Fu, H.; Tian, L.; Du, Z.; Wang, P. Embeddable Chloride Sensor for Monitoring Chloride Penetration into Cement Mortar. Sensors 2024, 24, 2149. https://doi.org/10.3390/s24072149
Zhang M, Fu H, Tian L, Du Z, Wang P. Embeddable Chloride Sensor for Monitoring Chloride Penetration into Cement Mortar. Sensors. 2024; 24(7):2149. https://doi.org/10.3390/s24072149
Chicago/Turabian StyleZhang, Min, Hua Fu, Li Tian, Zhenxing Du, and Penggang Wang. 2024. "Embeddable Chloride Sensor for Monitoring Chloride Penetration into Cement Mortar" Sensors 24, no. 7: 2149. https://doi.org/10.3390/s24072149
APA StyleZhang, M., Fu, H., Tian, L., Du, Z., & Wang, P. (2024). Embeddable Chloride Sensor for Monitoring Chloride Penetration into Cement Mortar. Sensors, 24(7), 2149. https://doi.org/10.3390/s24072149