
Full-Section Deformation Monitoring of High-Altitude Fault Tunnels Based on Three-Dimensional Laser Scanning Technology


Abstract
1. Introduction
2. Theoretical Framework
2.1. Project Profile
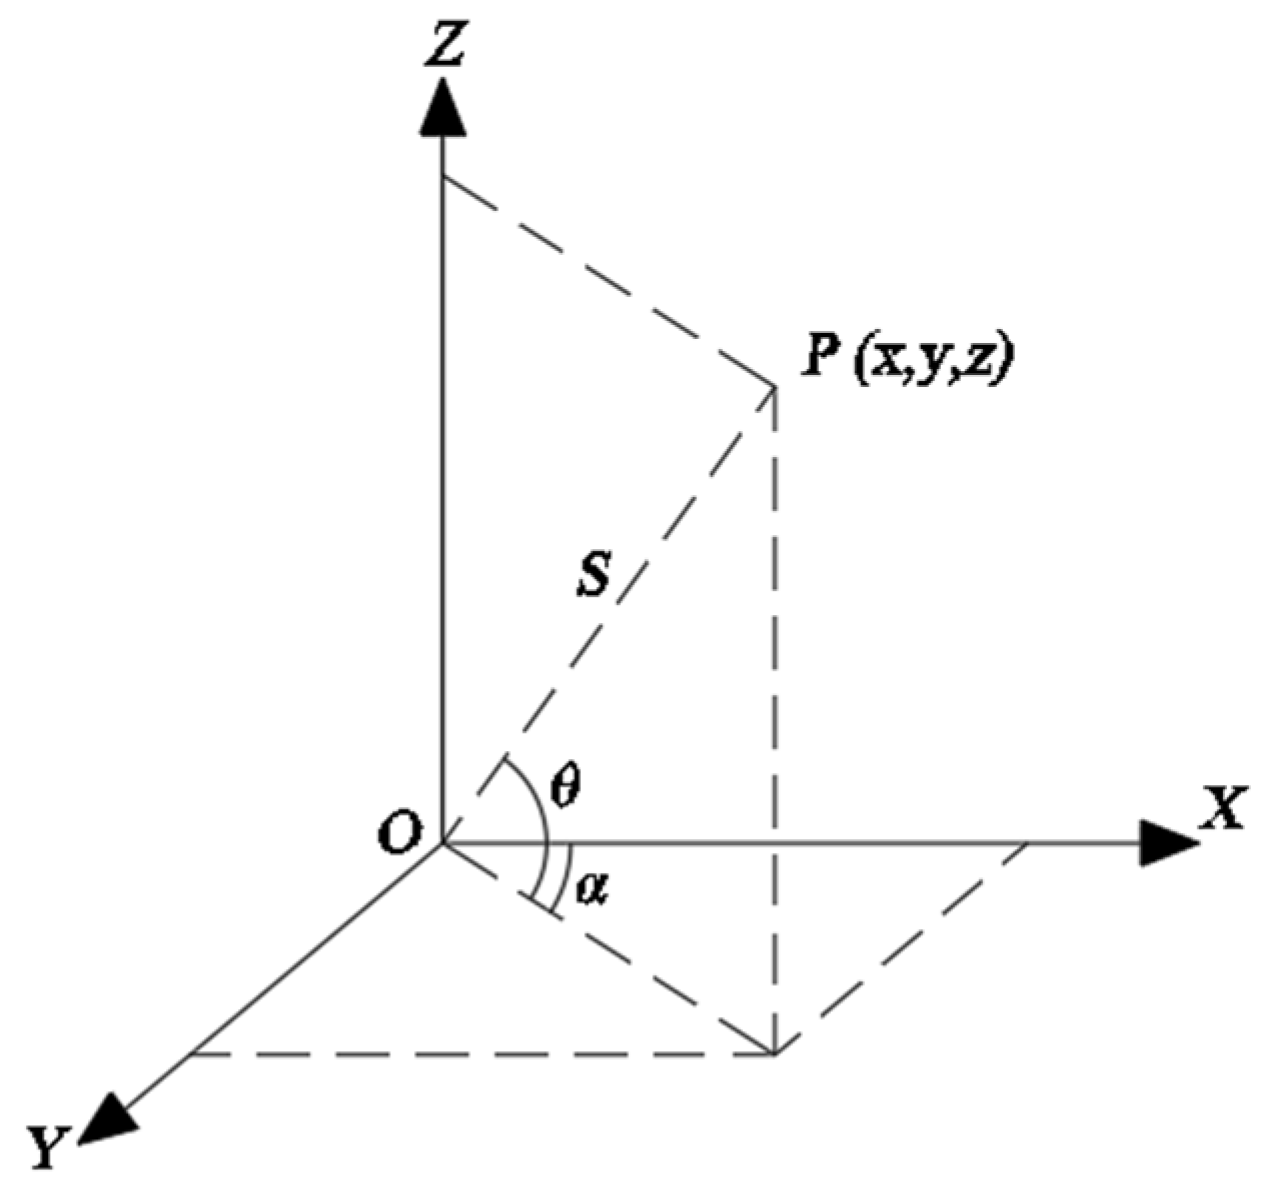
2.2. Monitoring Principle
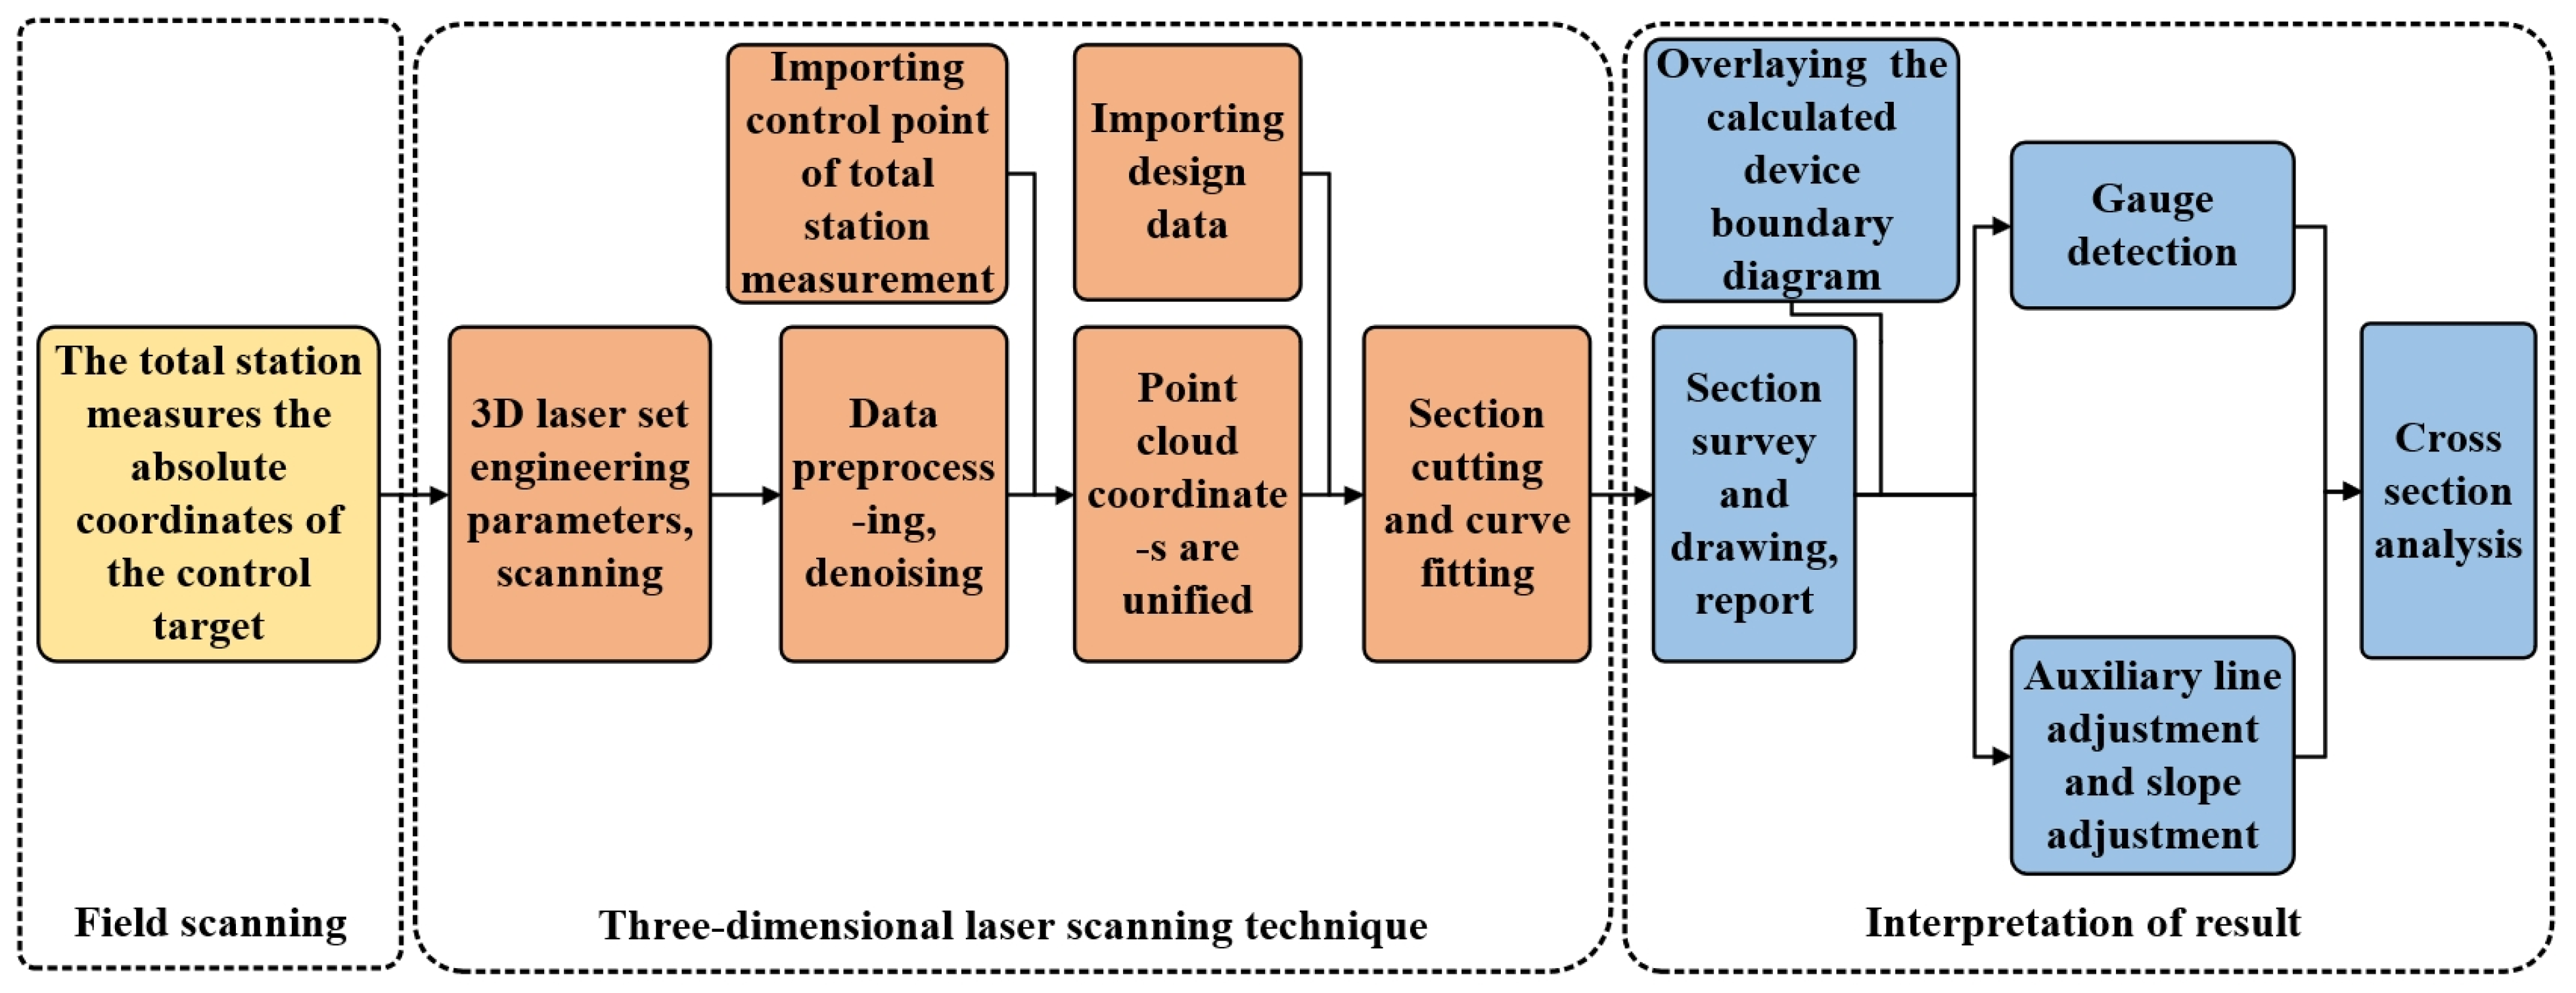
2.3. Technique Process
3. Tunnel Scanning Analysis
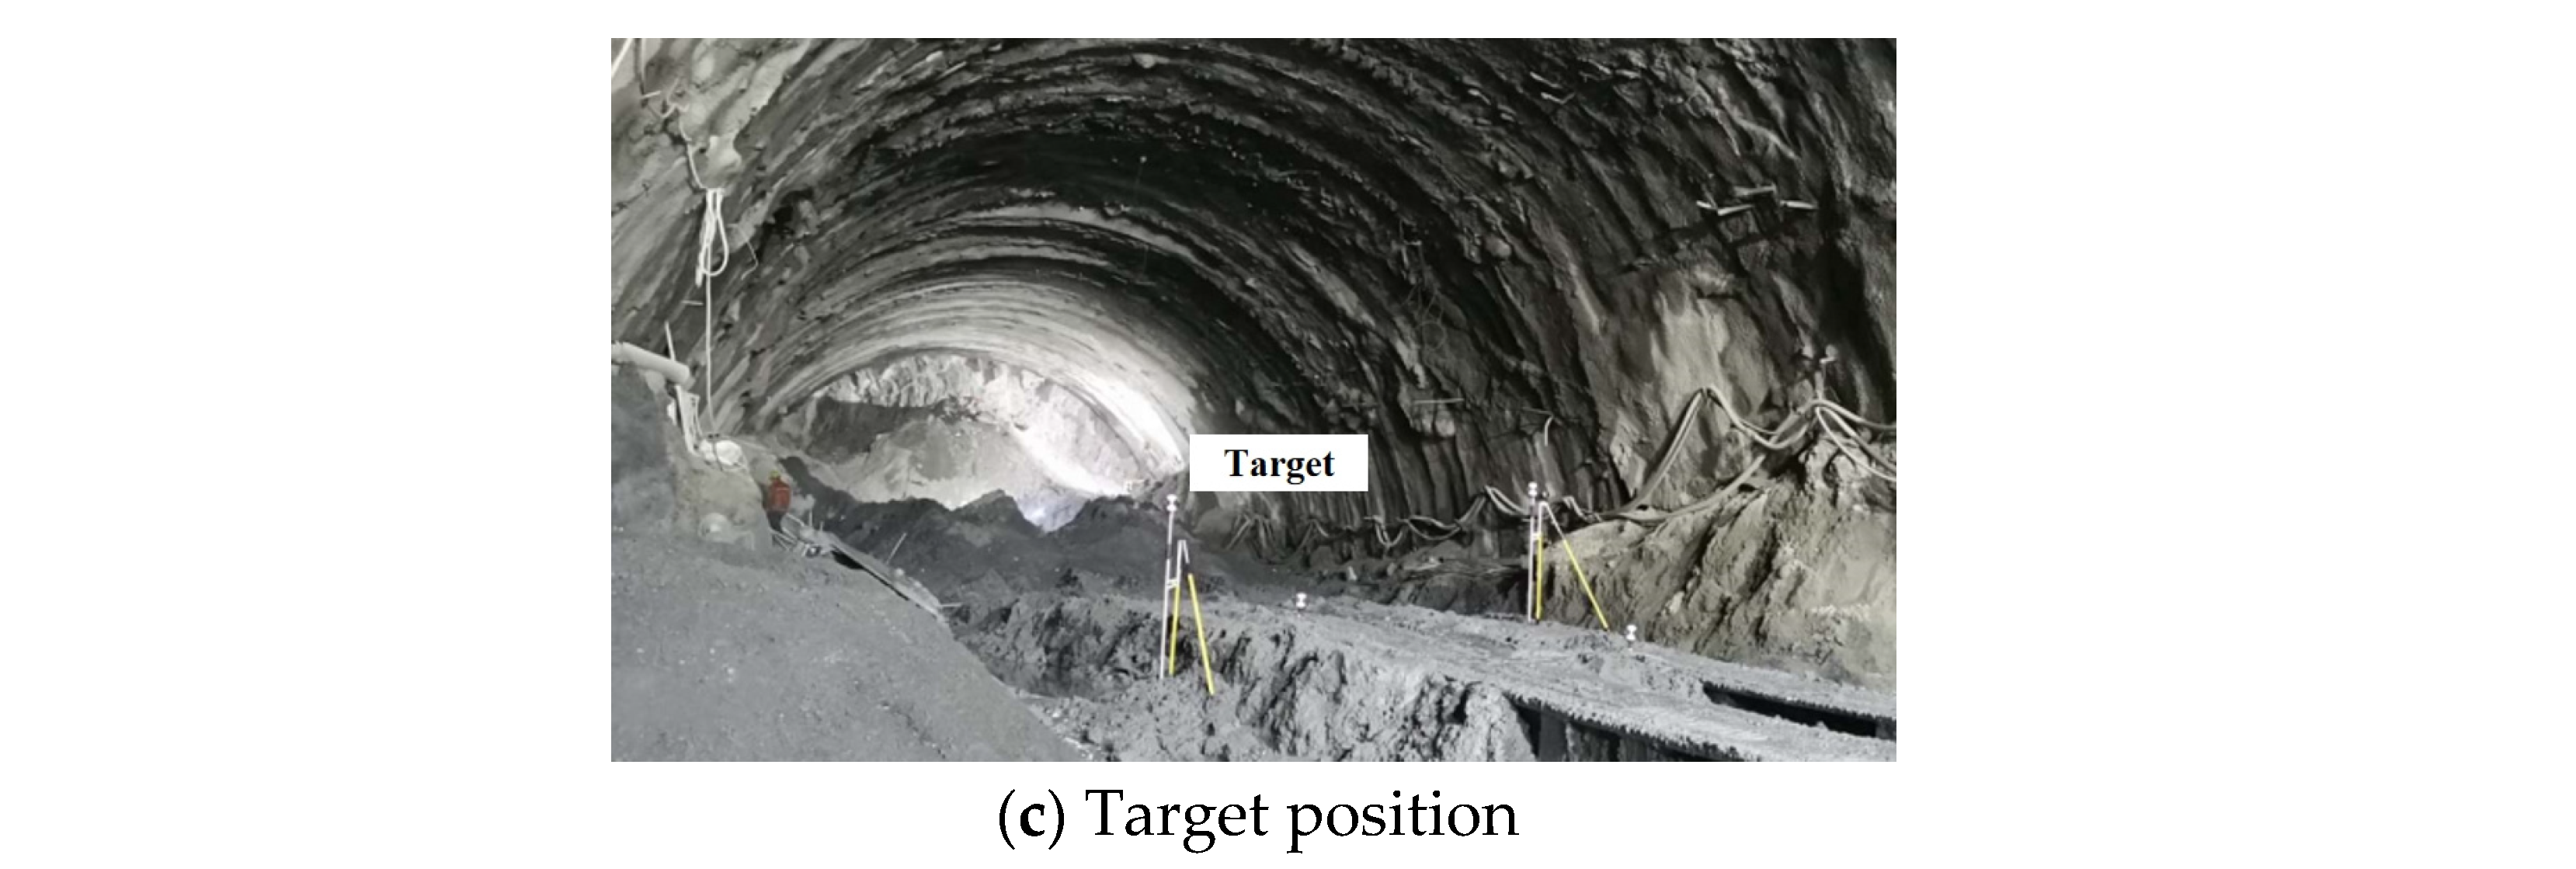
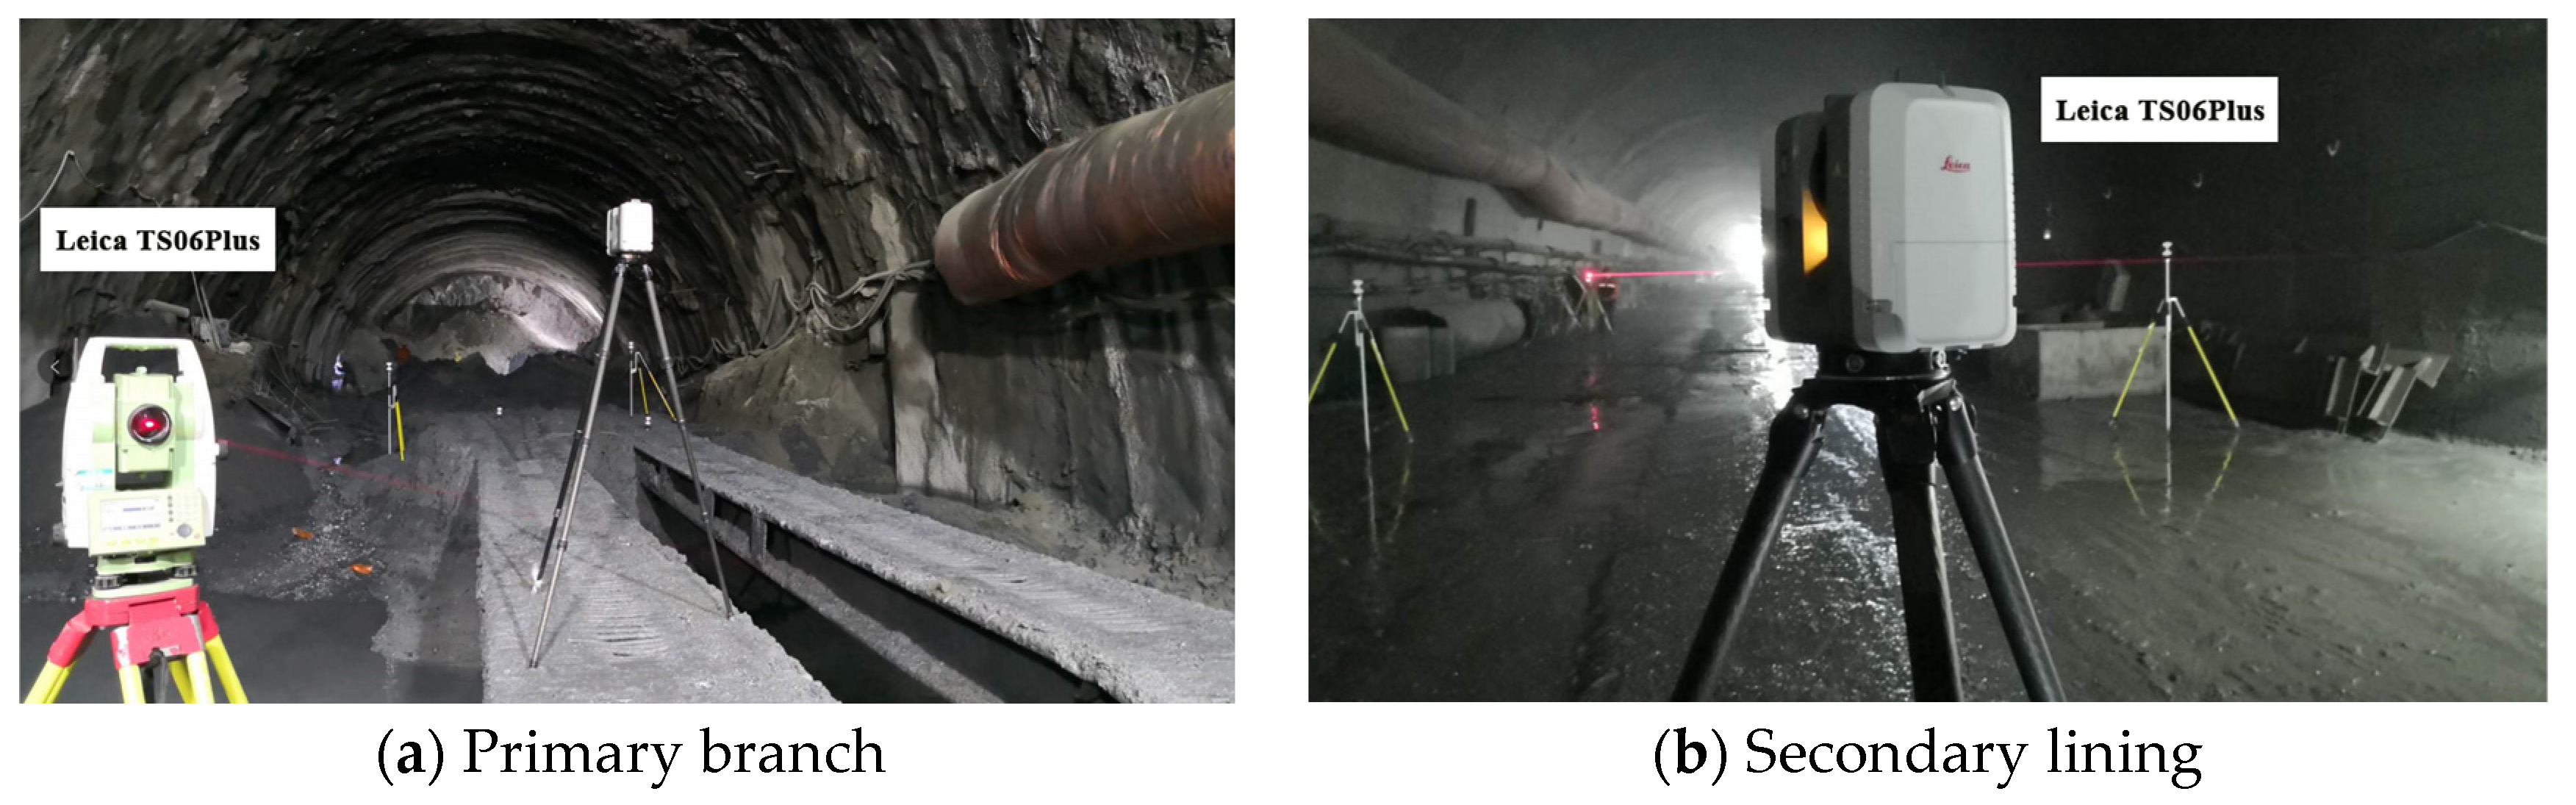
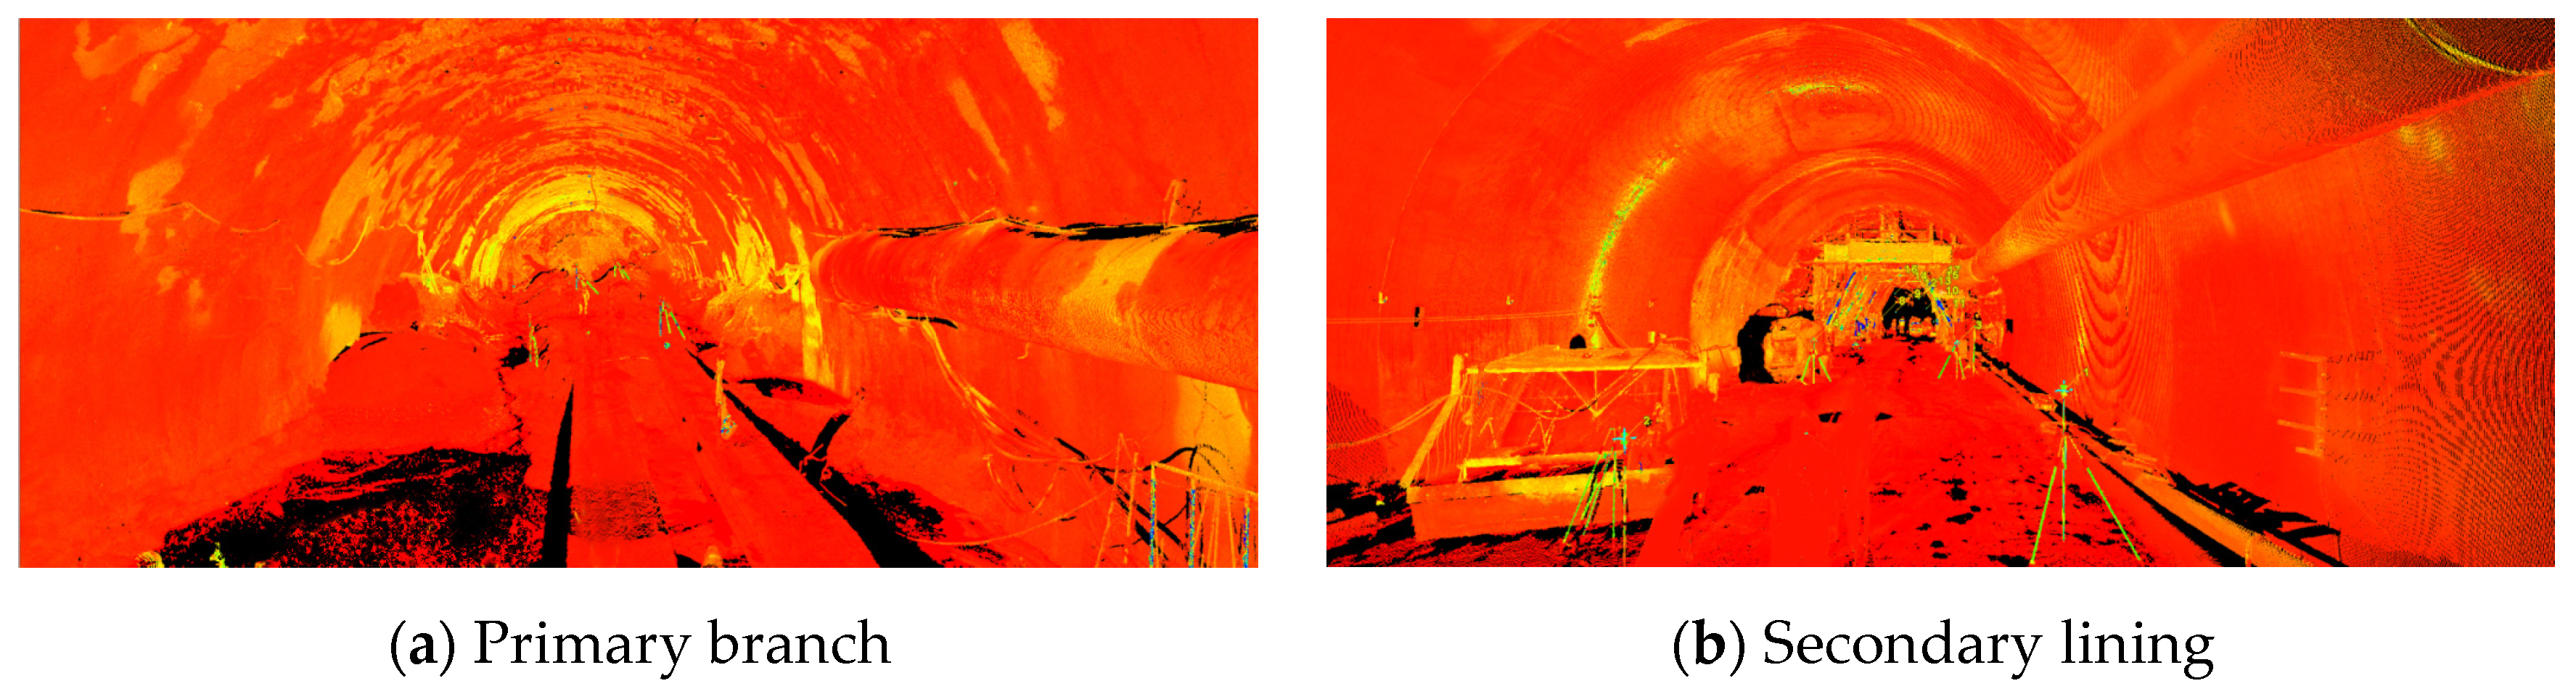
3.1. Tunnel Field Scanning
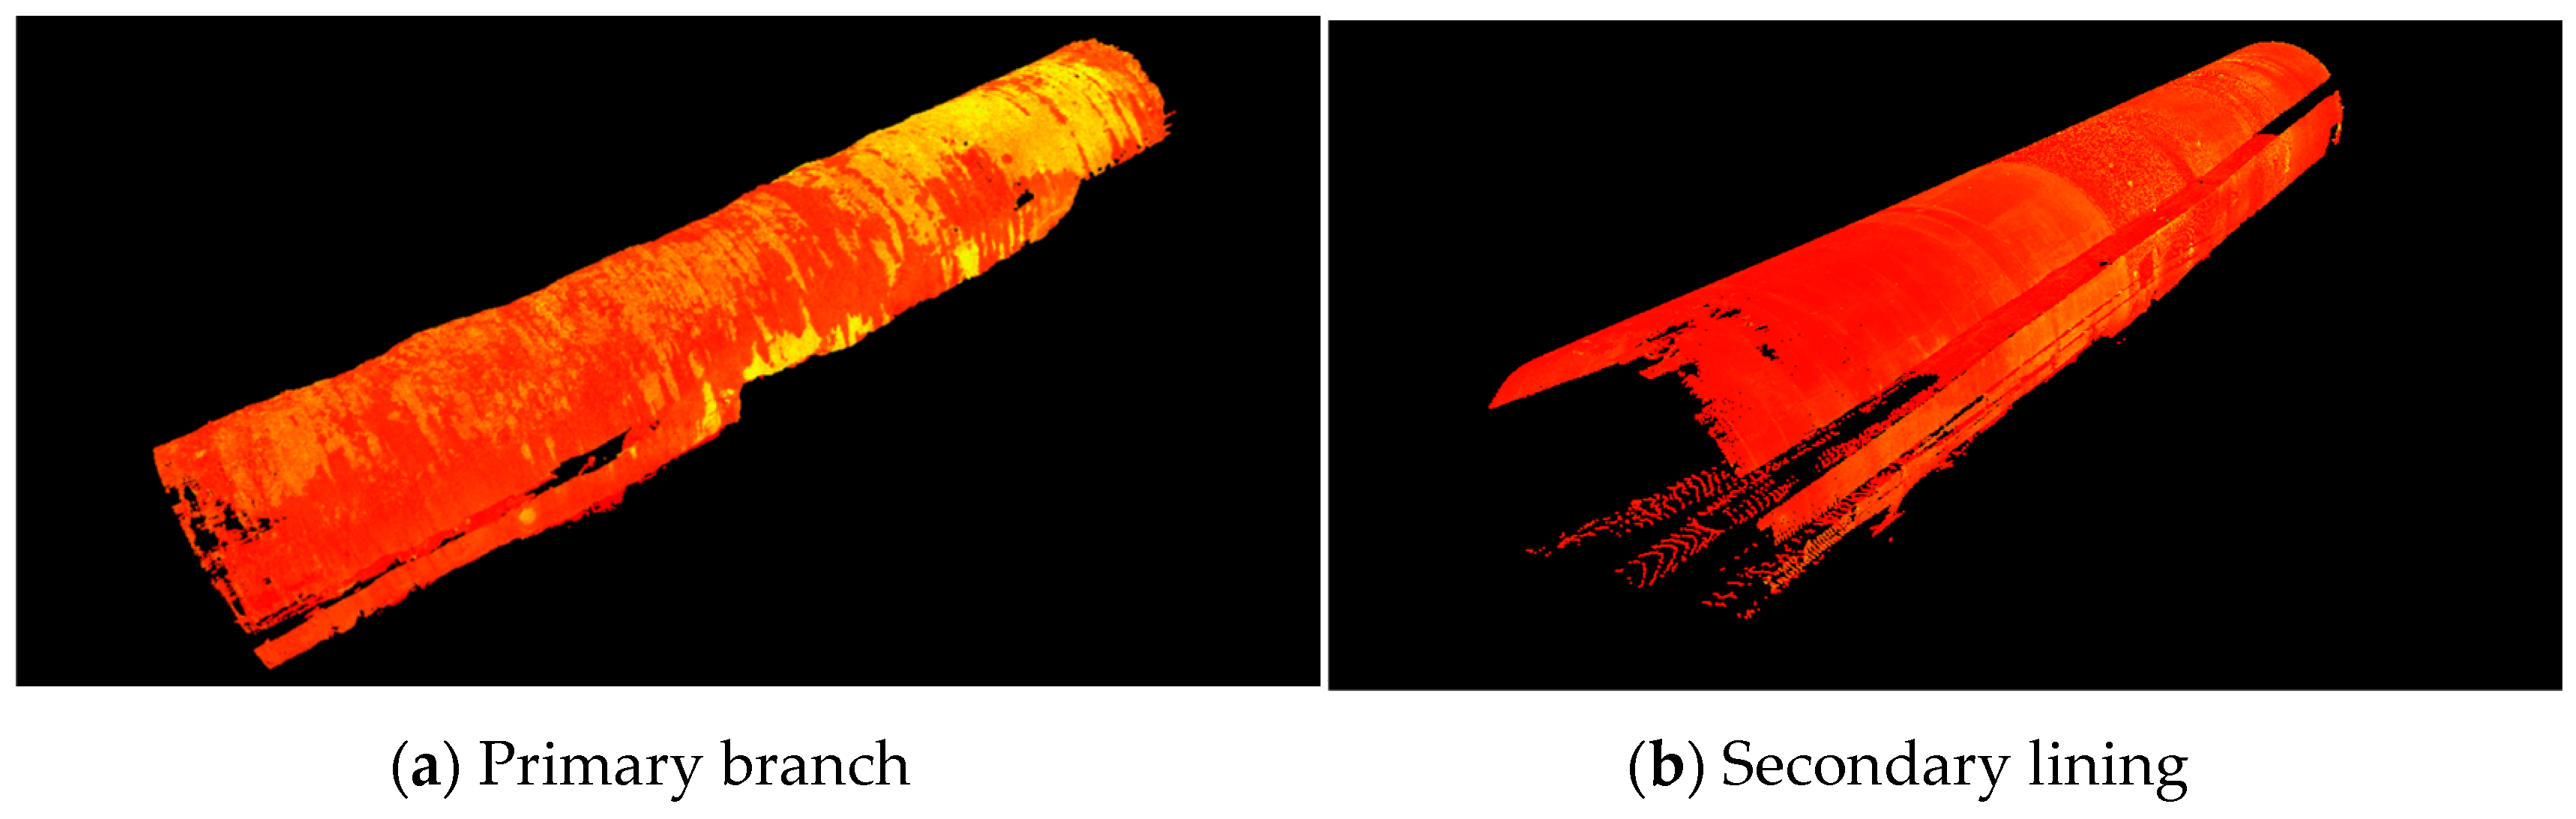
3.2. Tunnel Primary Branch and Secondary Lining Data Processing
4. Data Analysis
4.1. Analysis of the Initial Branch Section
- (1)
- Comparative analysis of the initial branch section before and after blasting
- (2)
- Deformation diagram of the surrounding rock of the initial section
- (3)
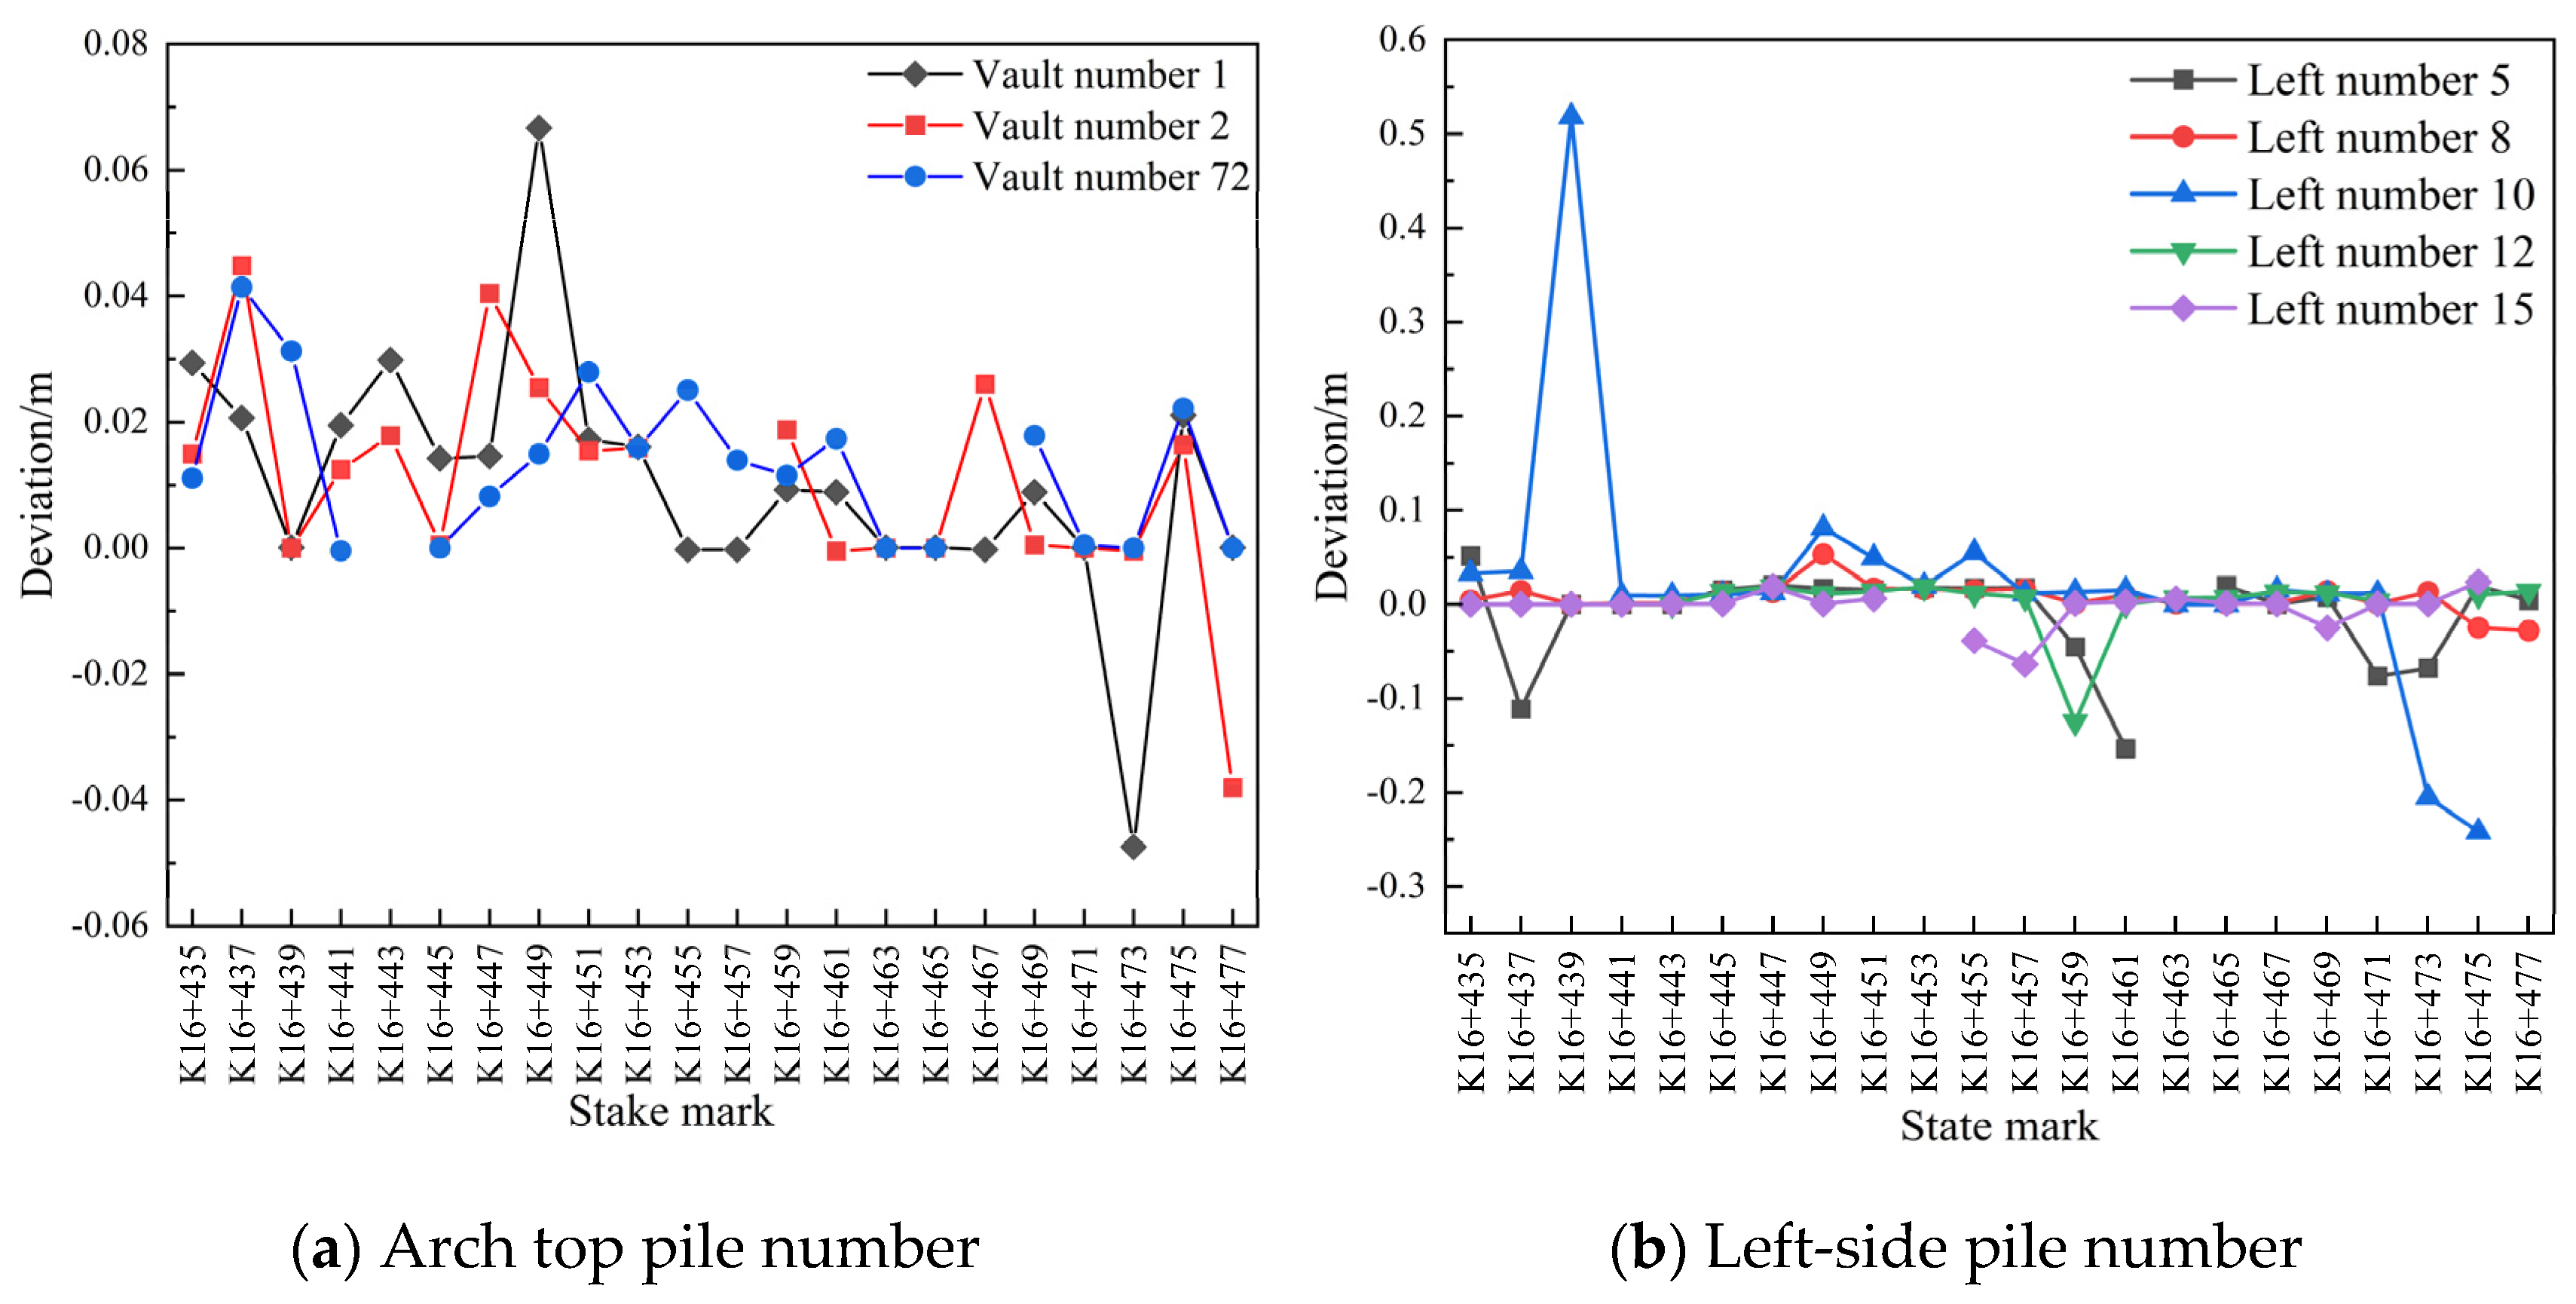
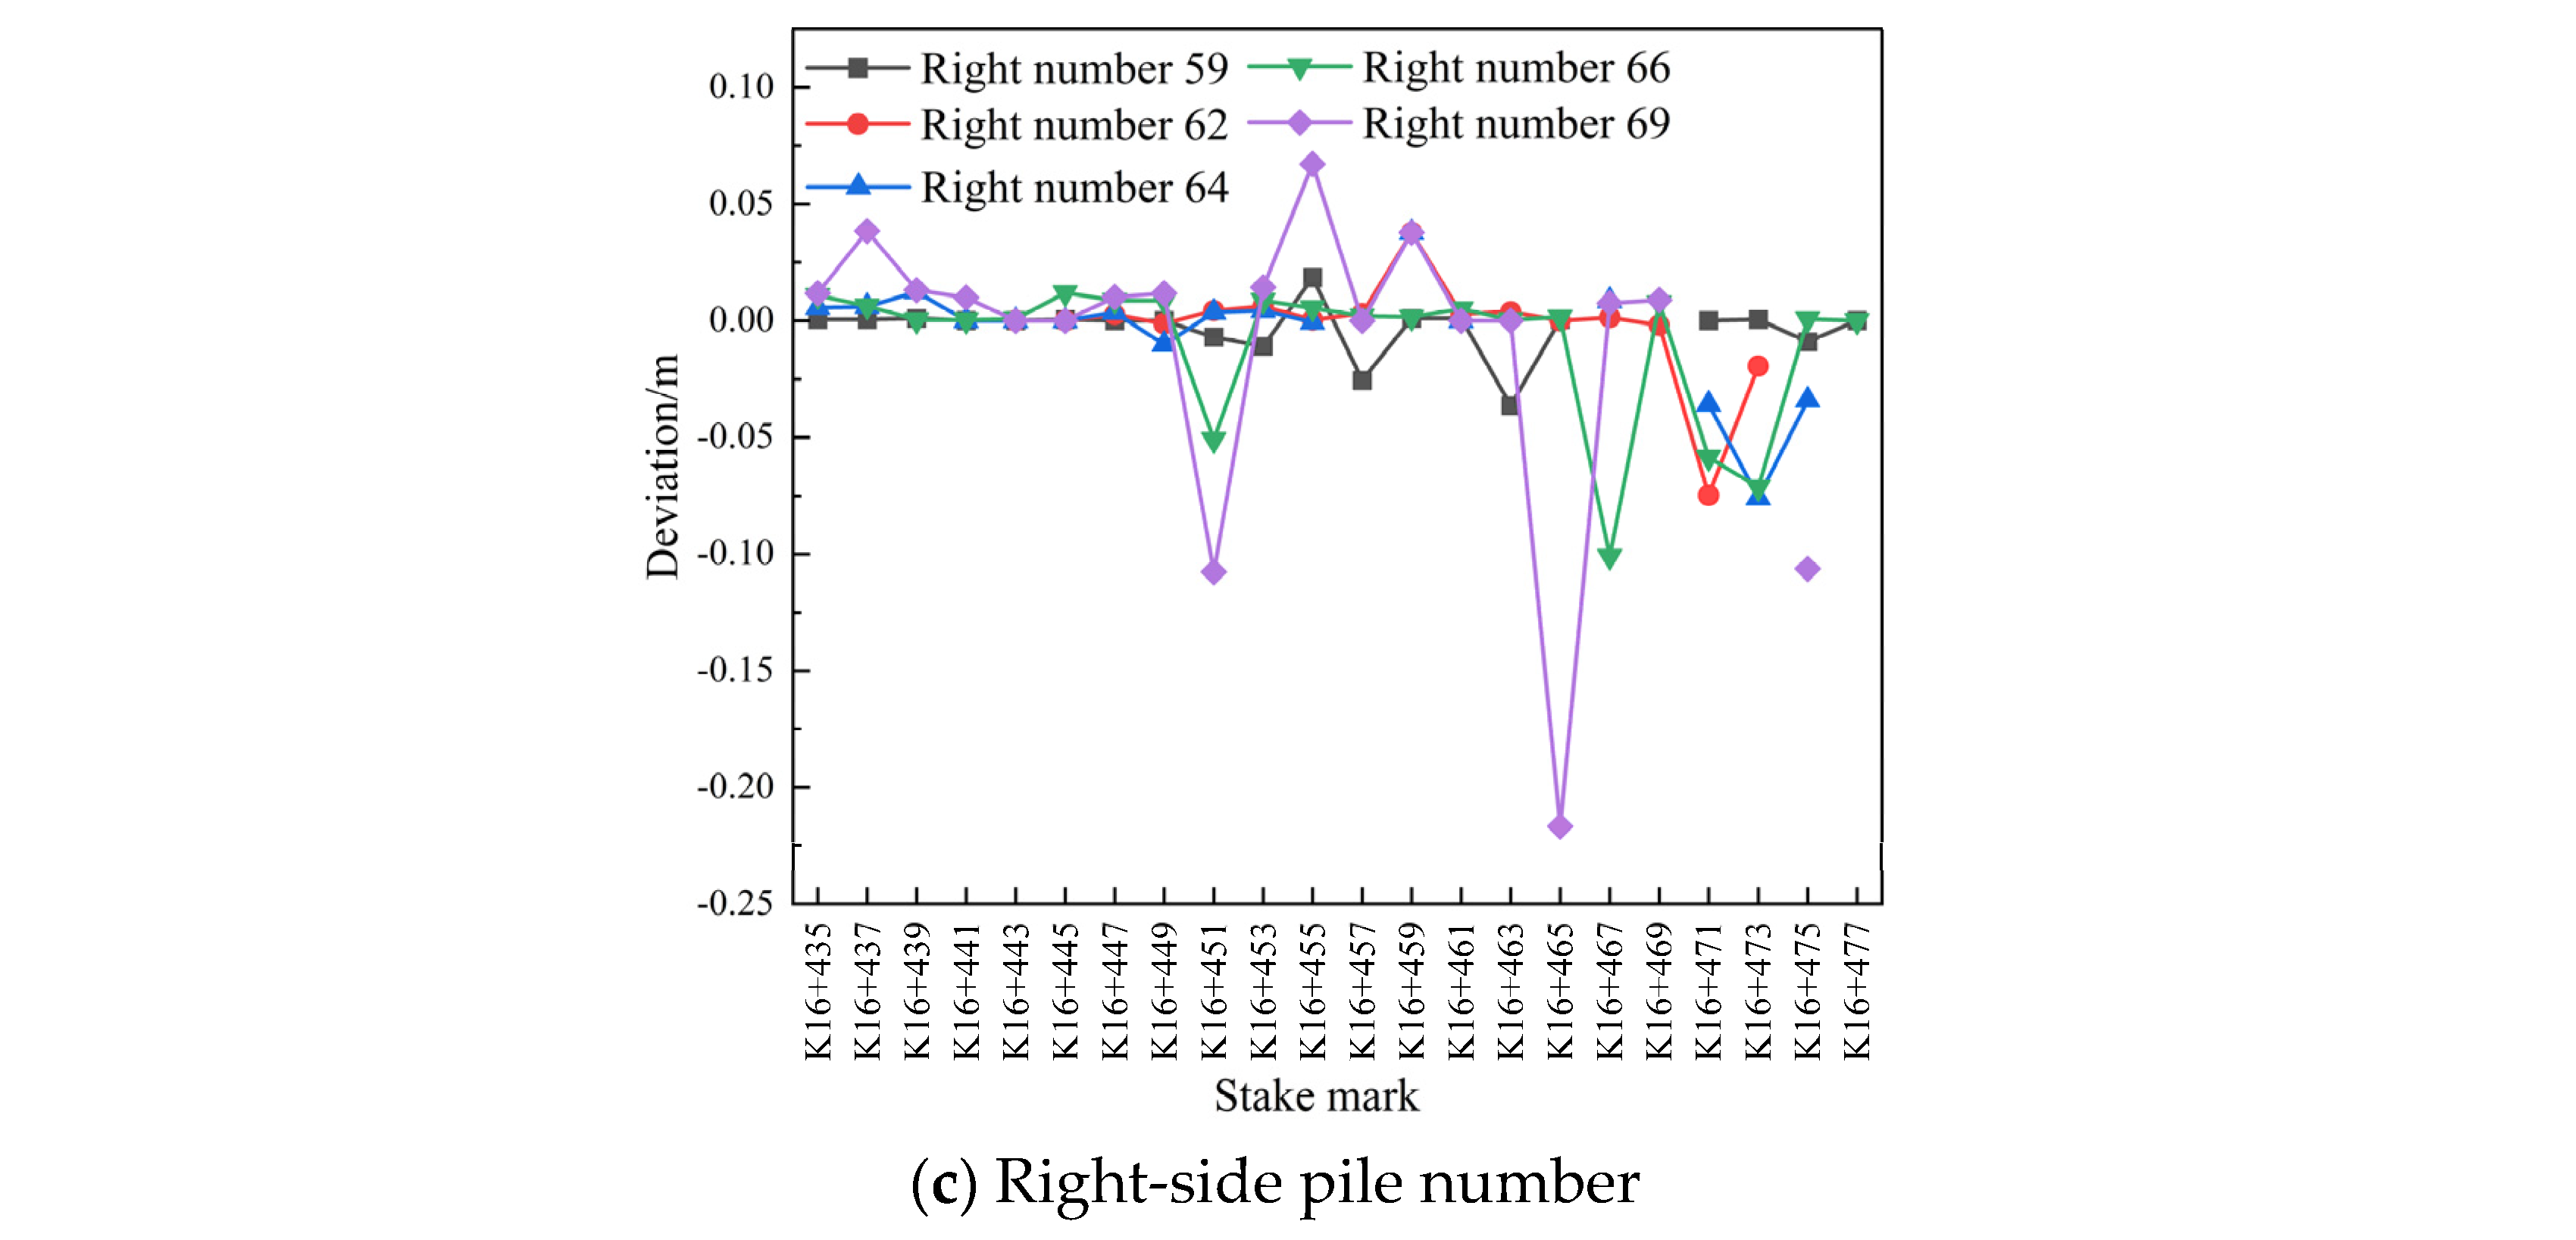
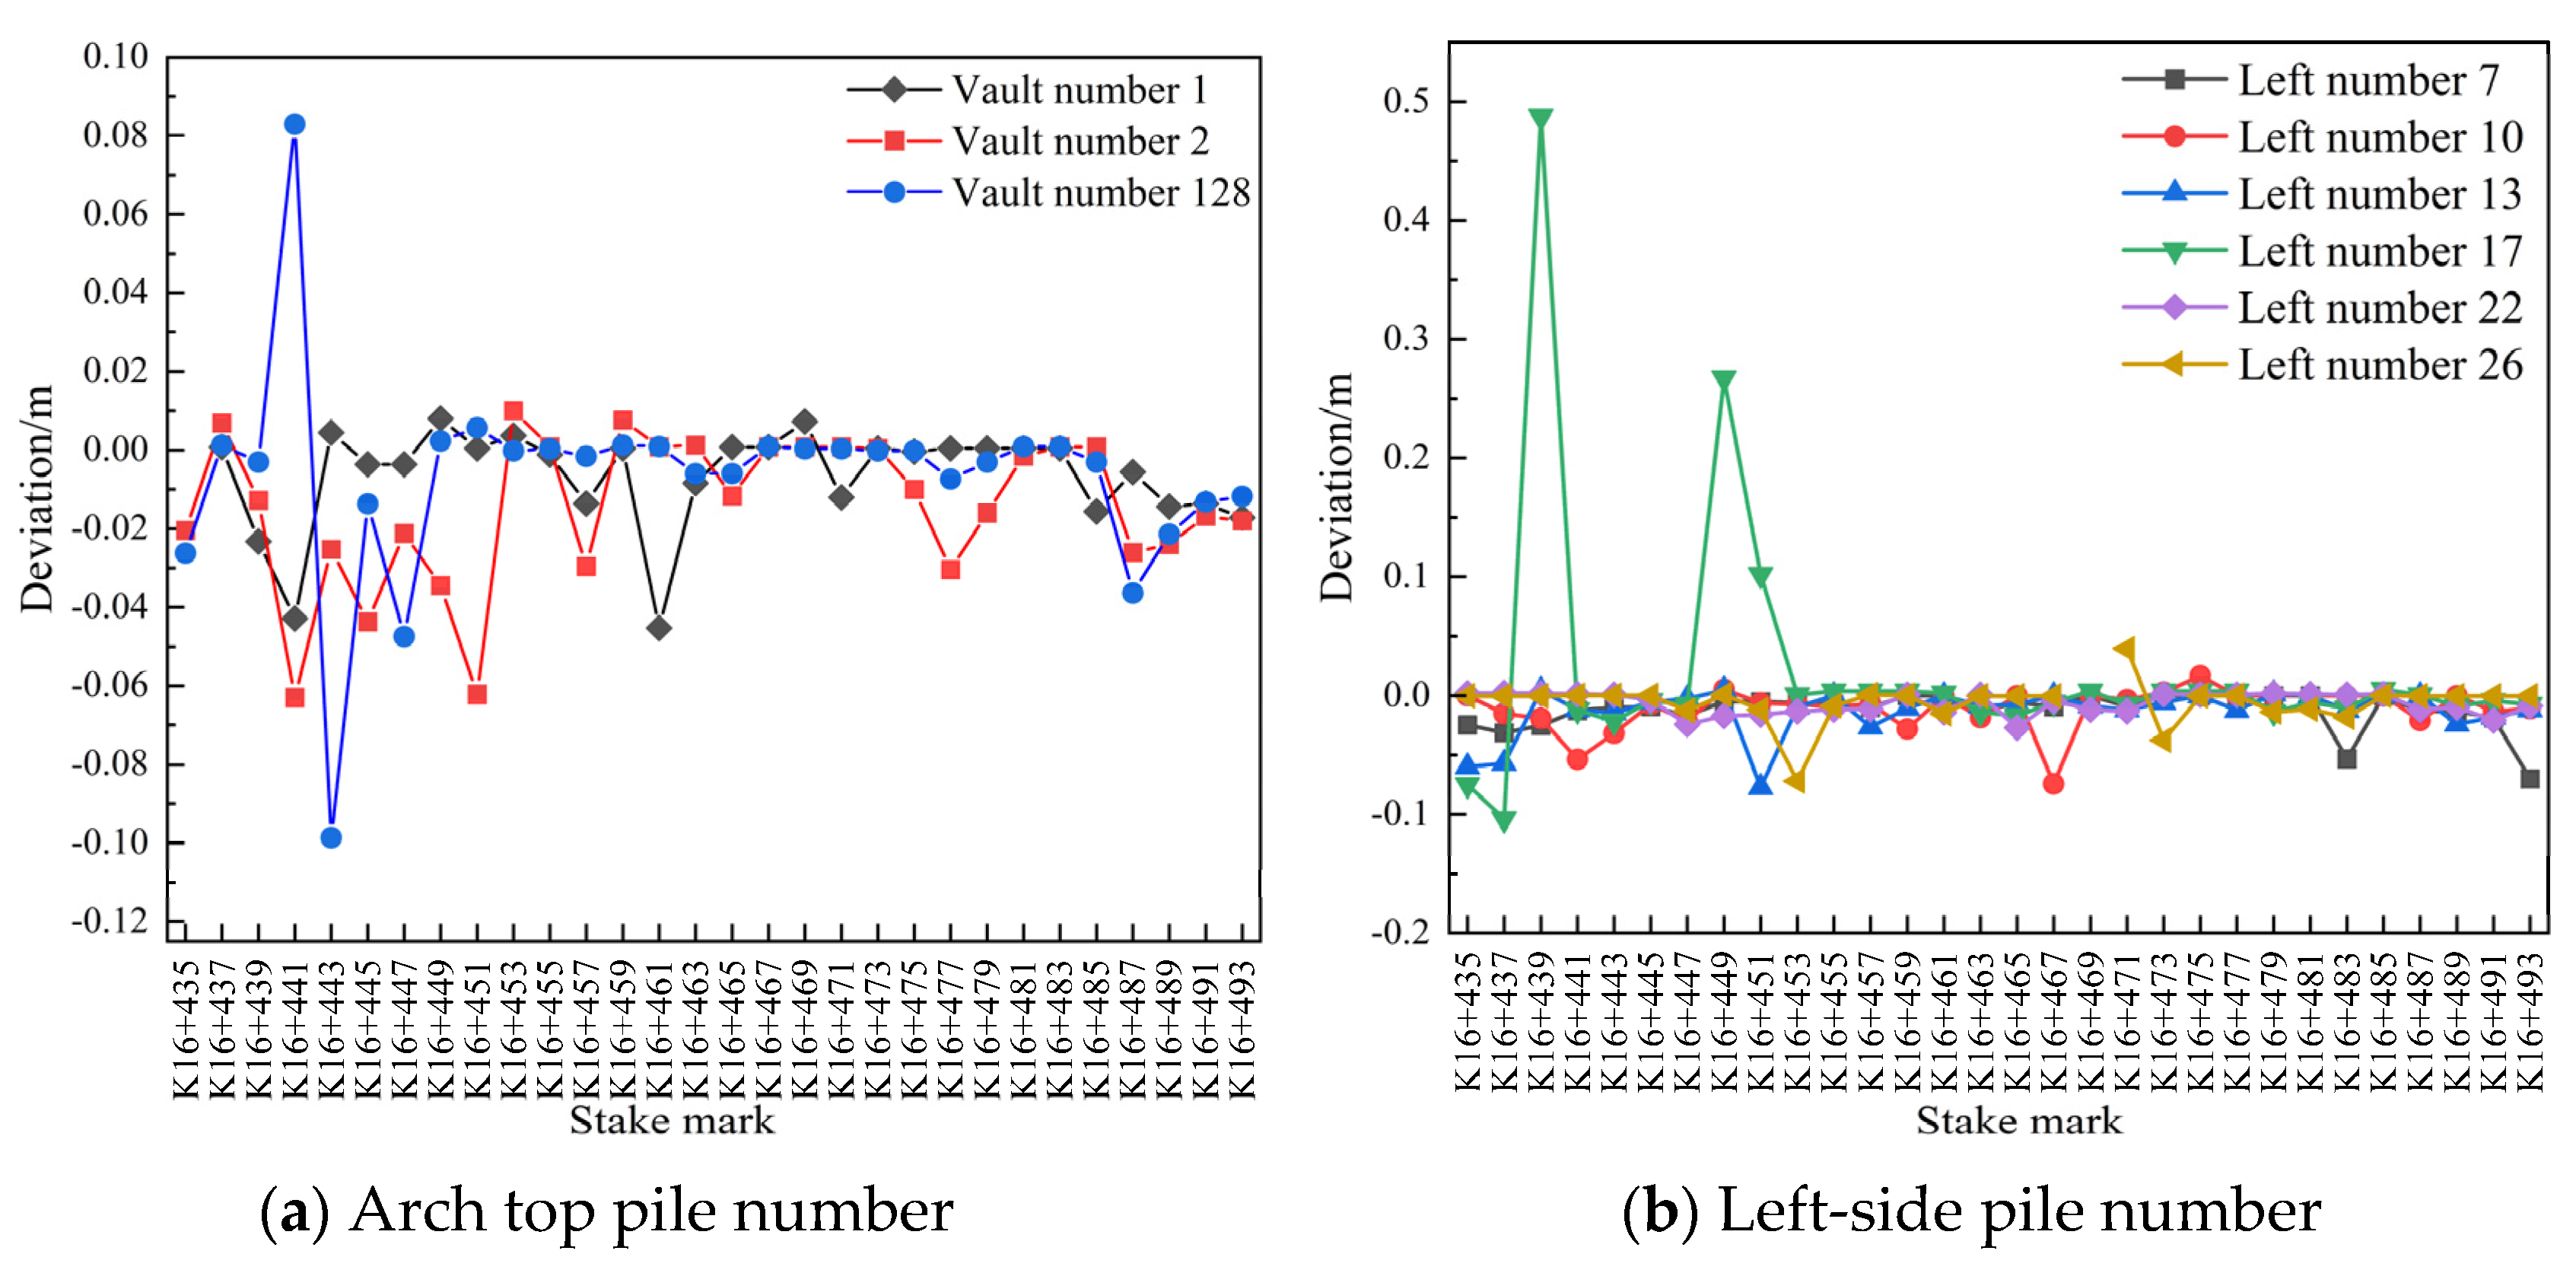
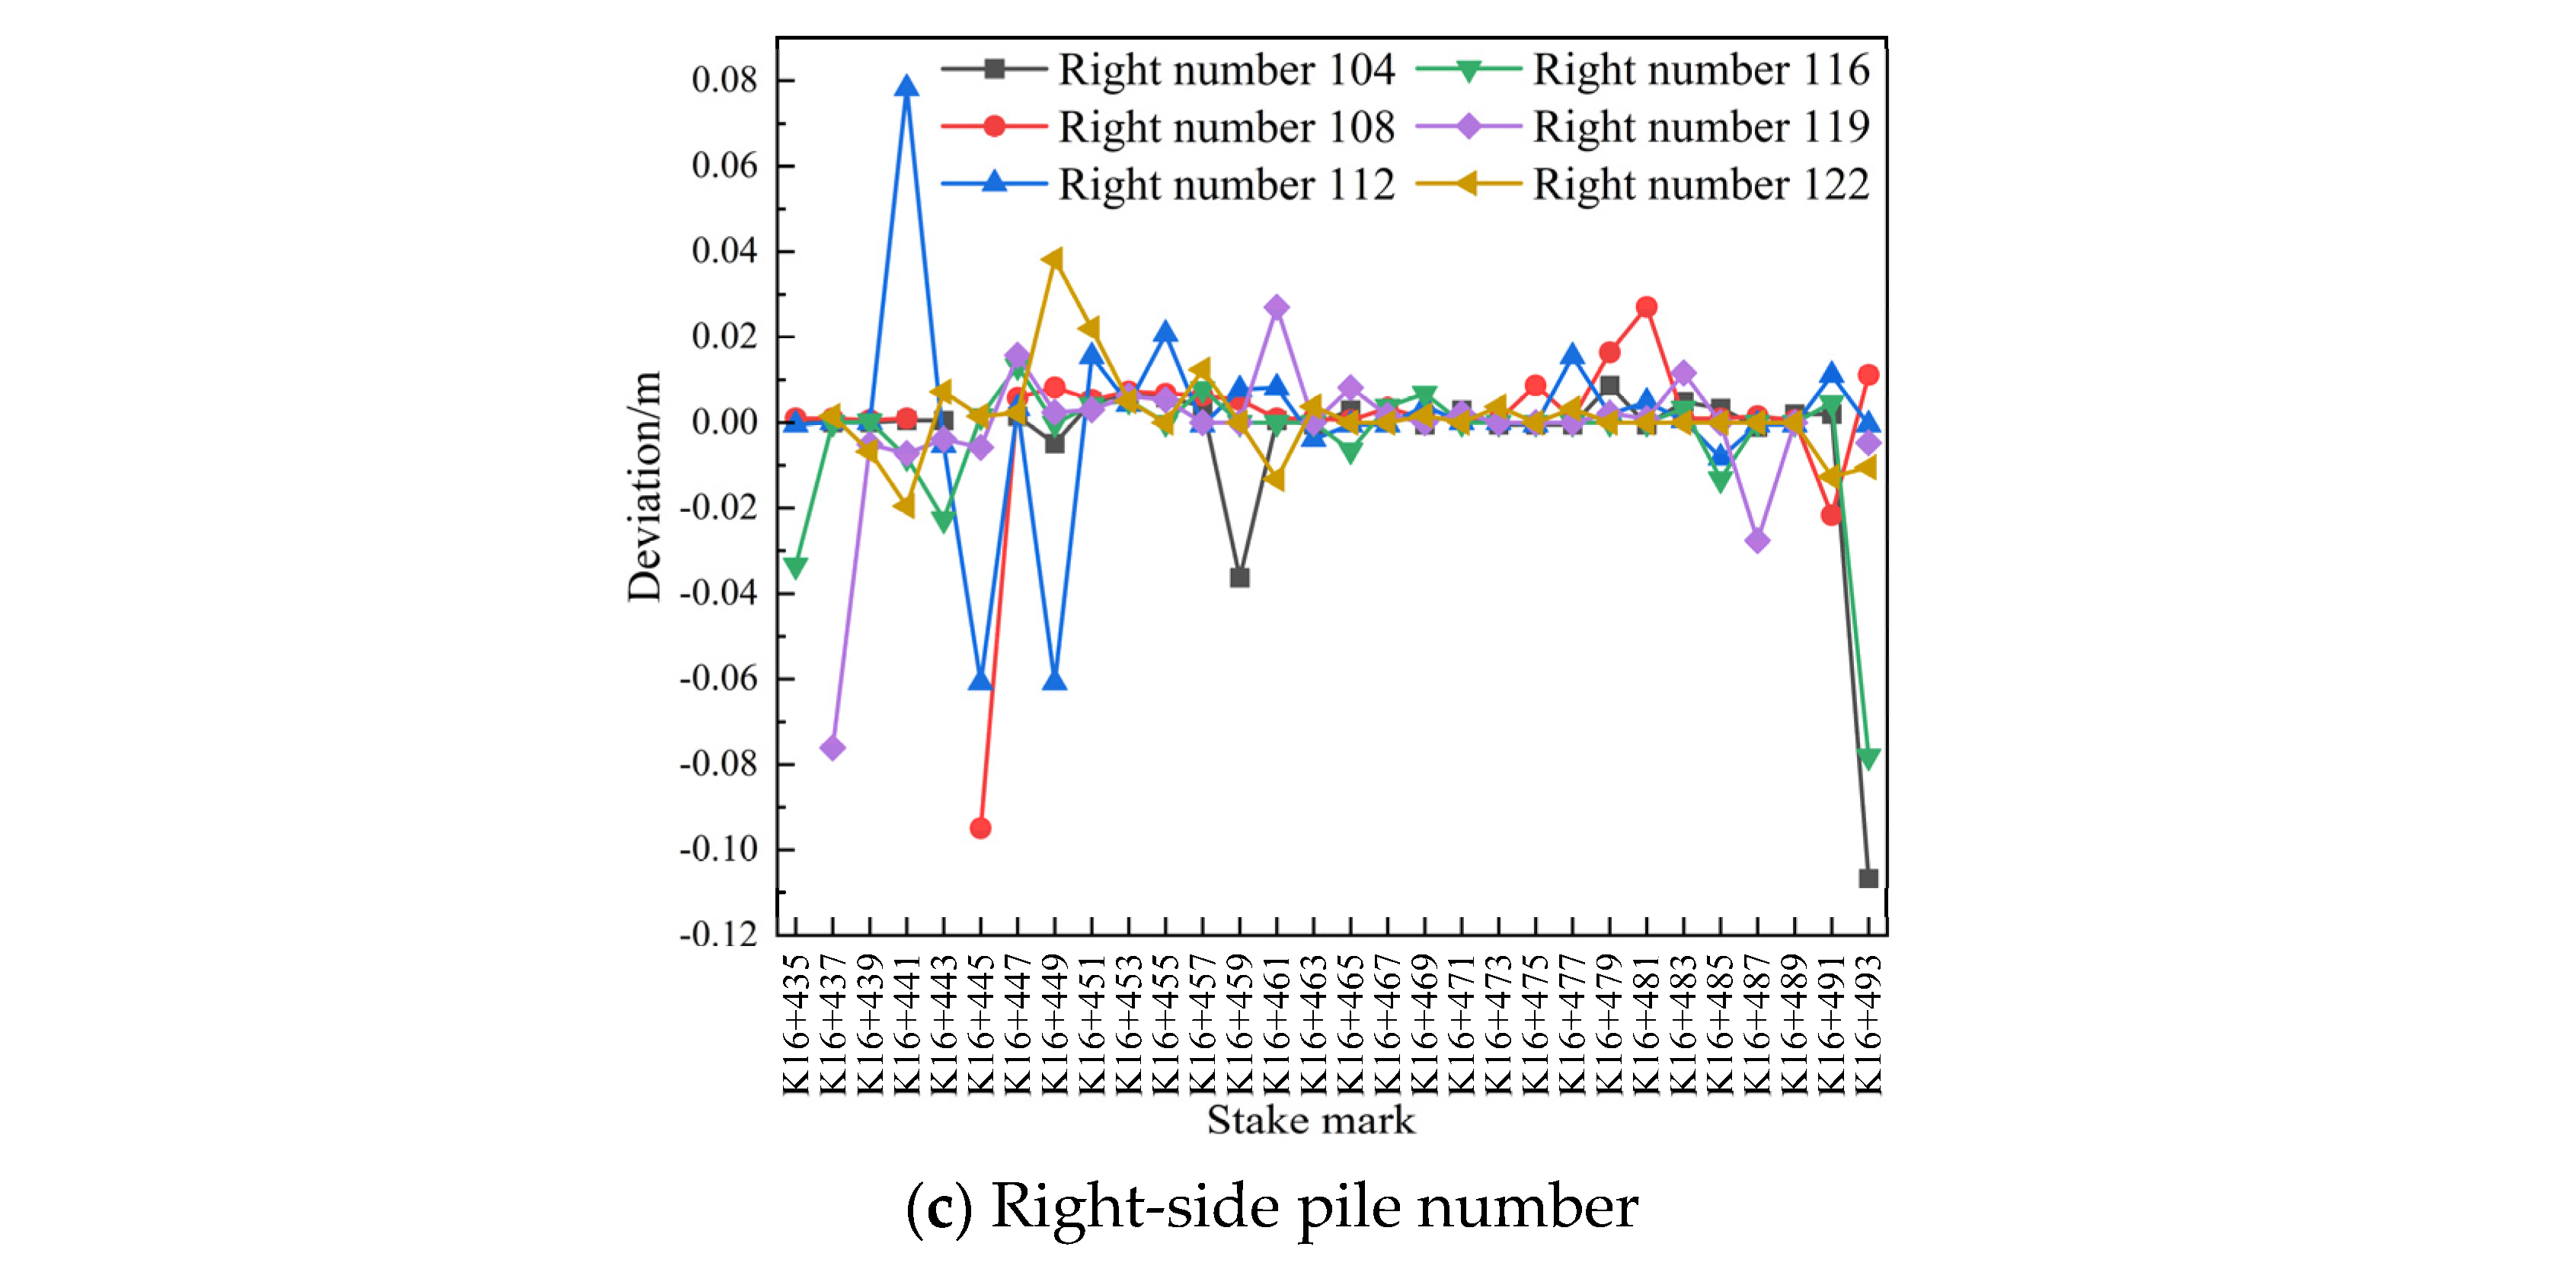
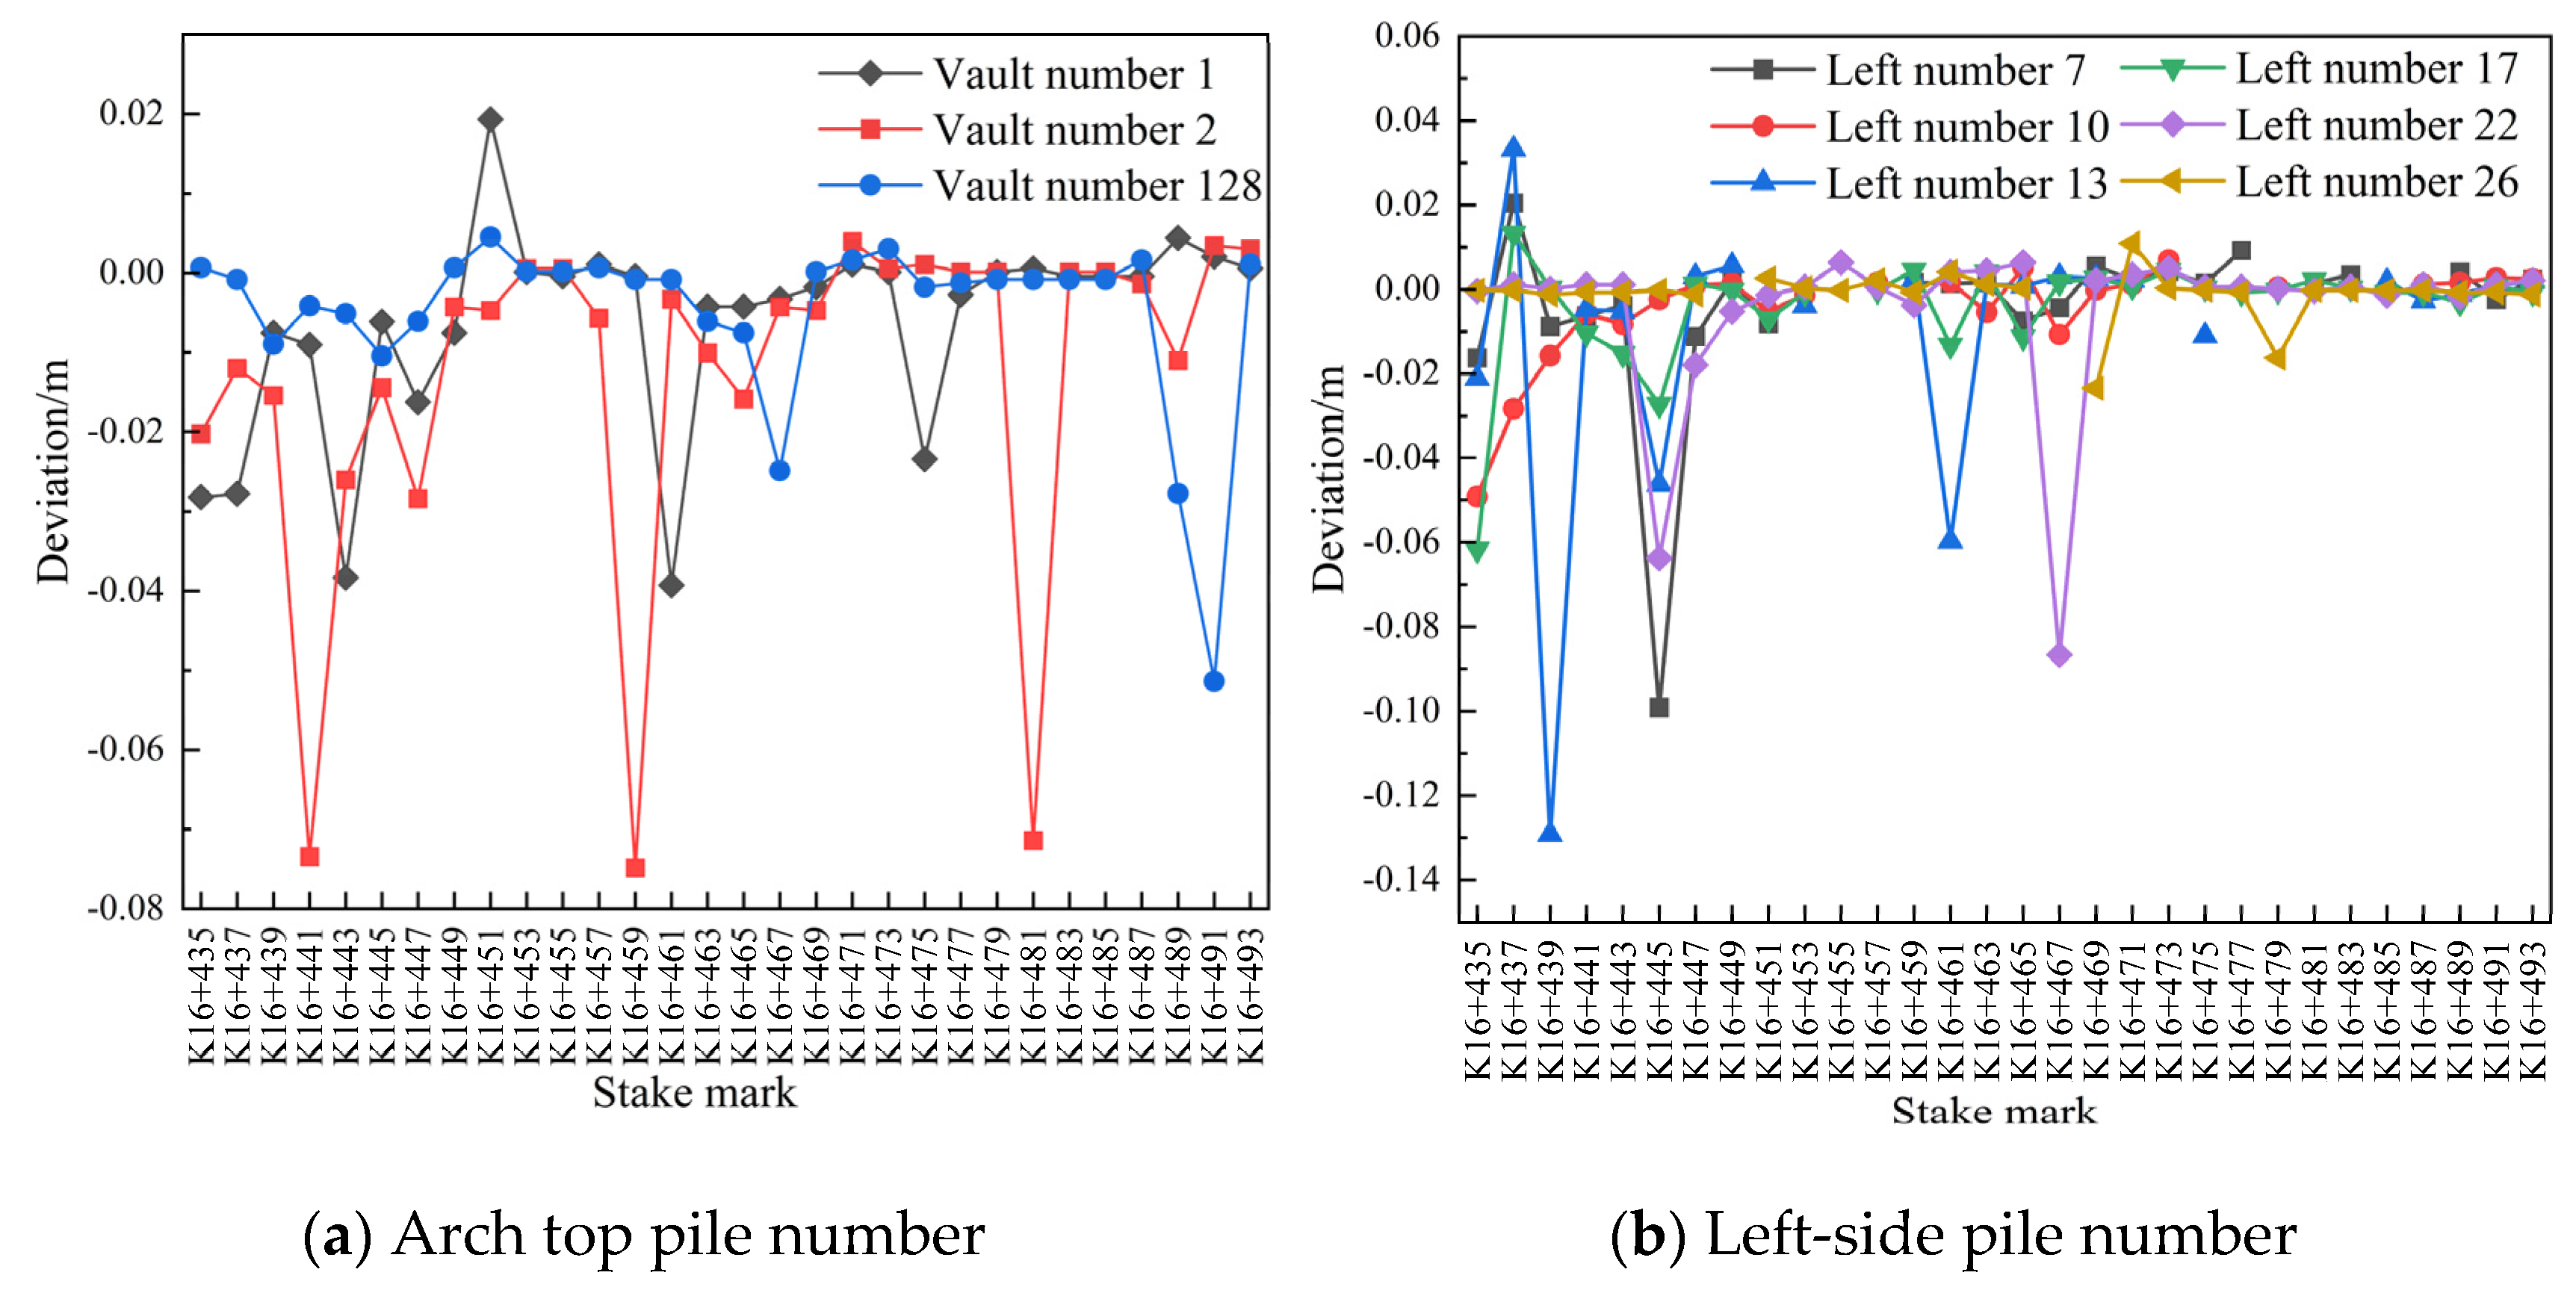
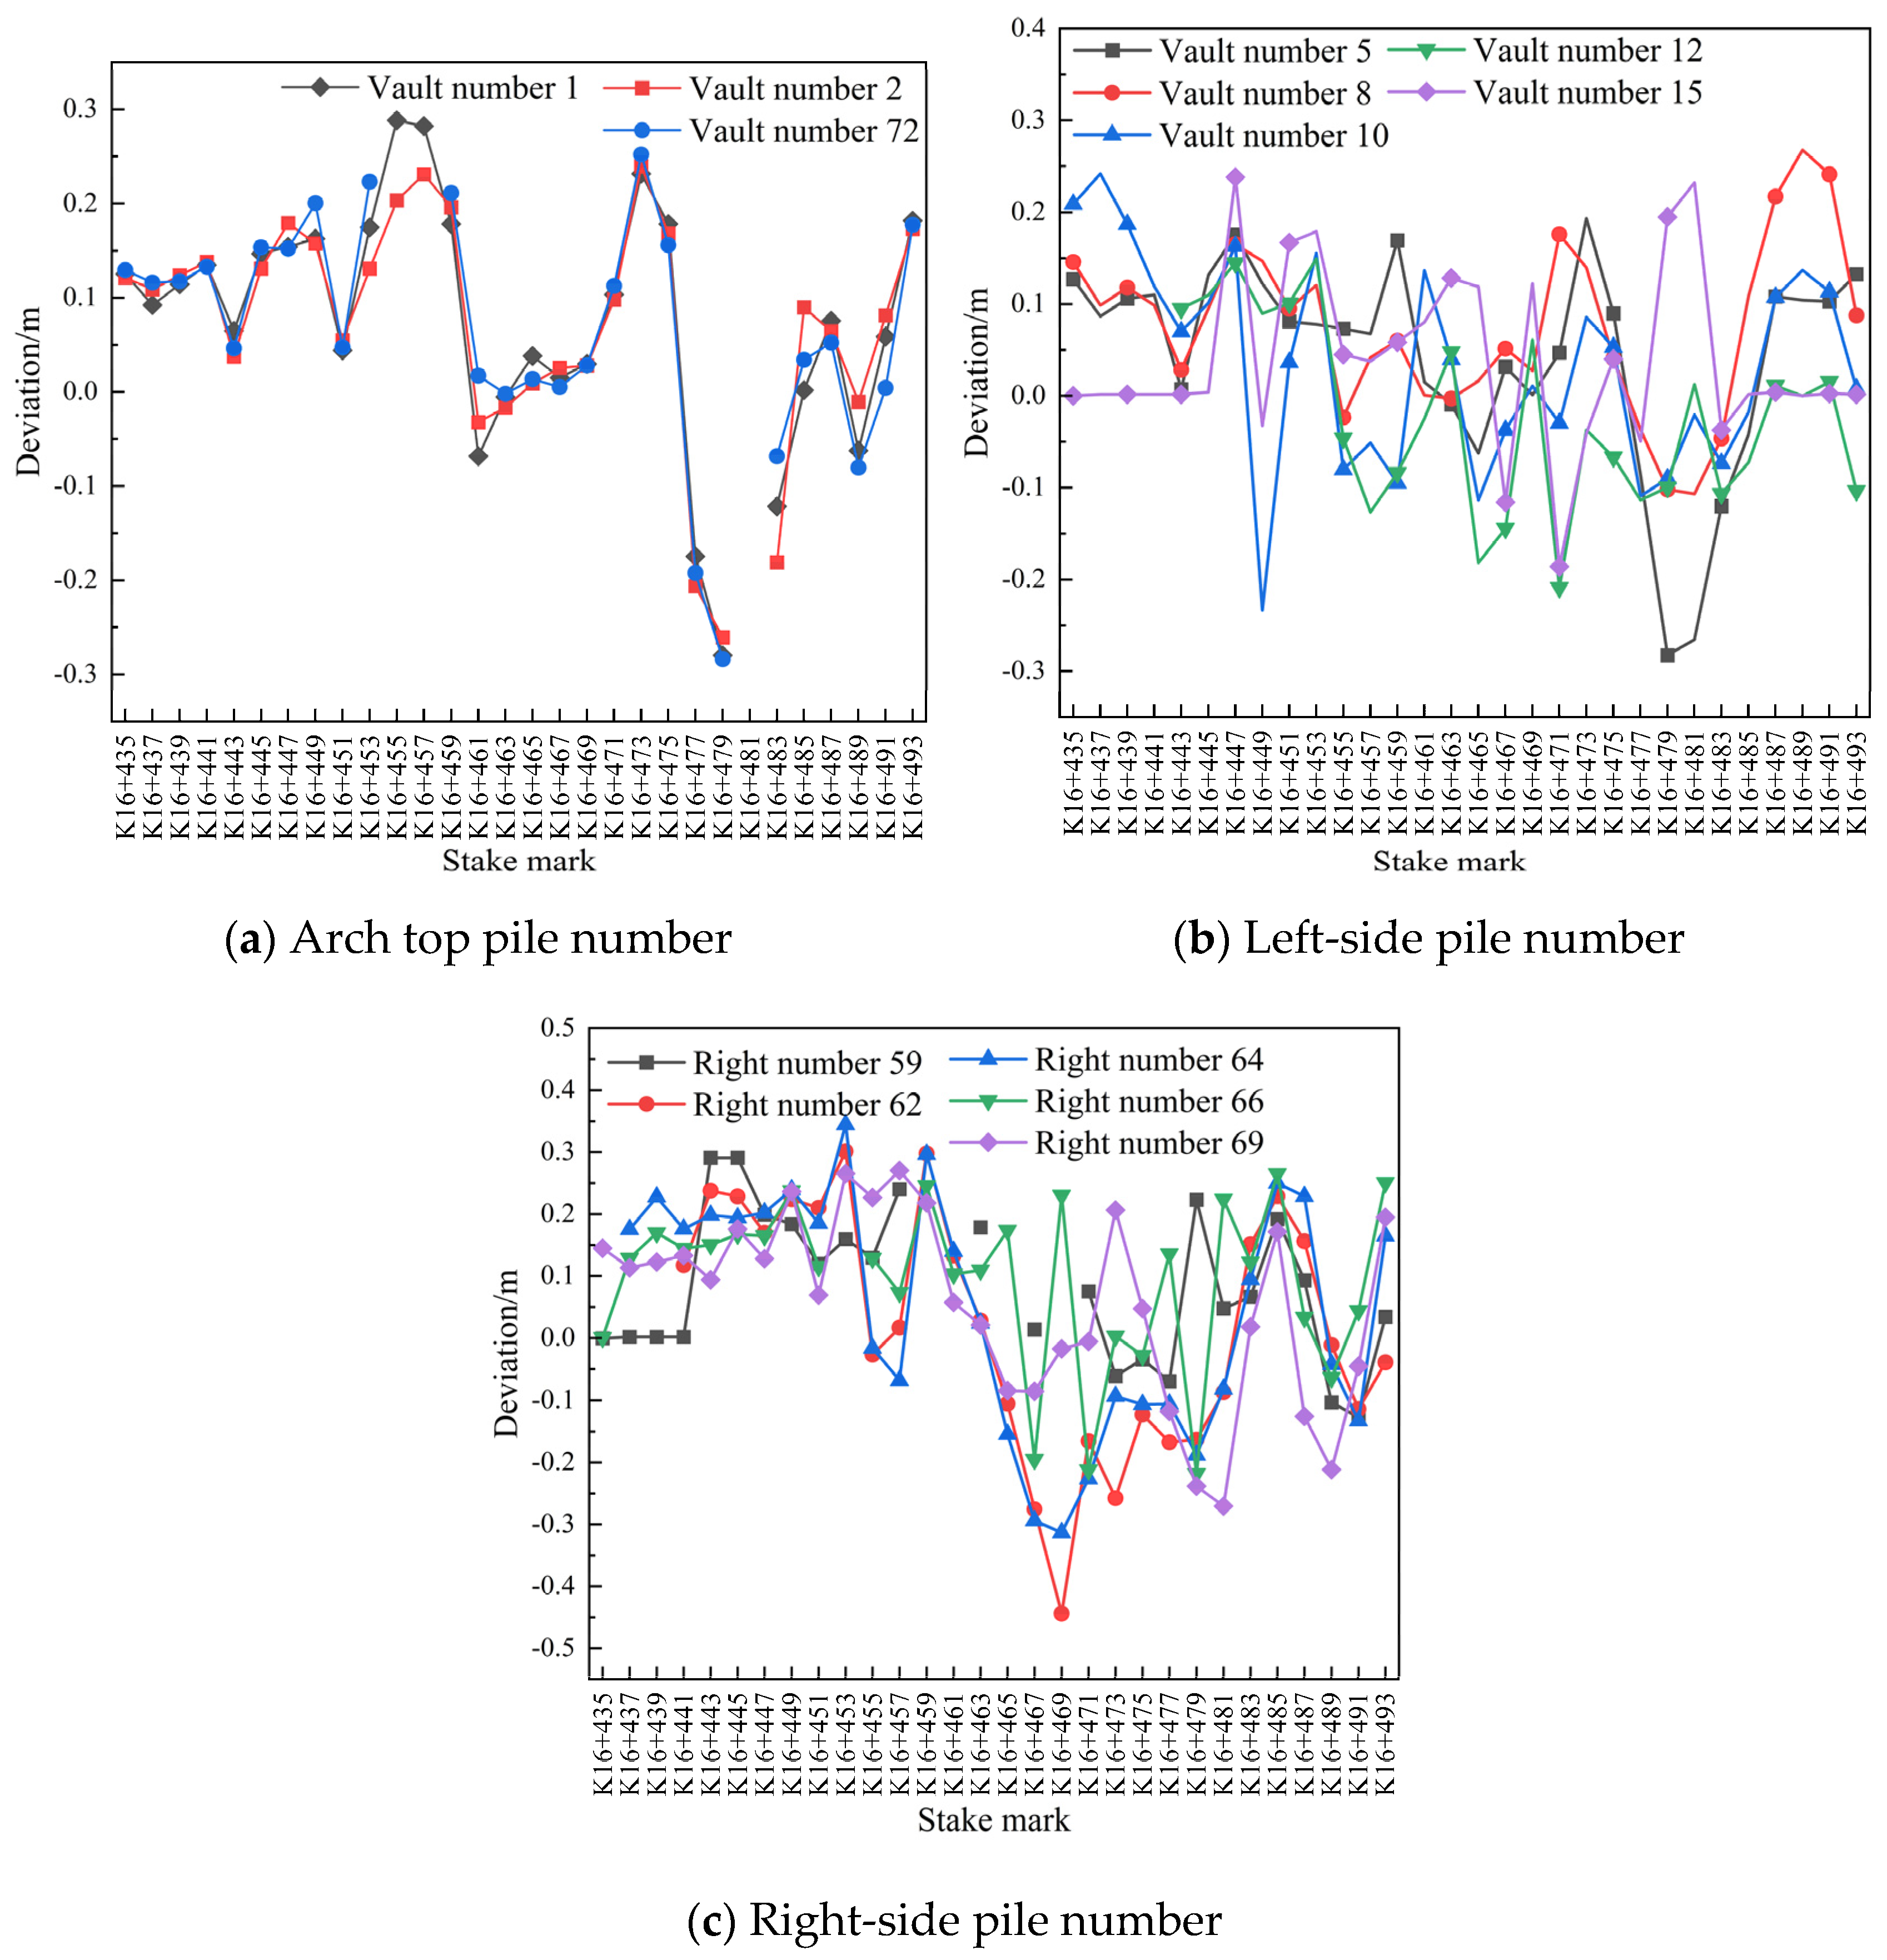
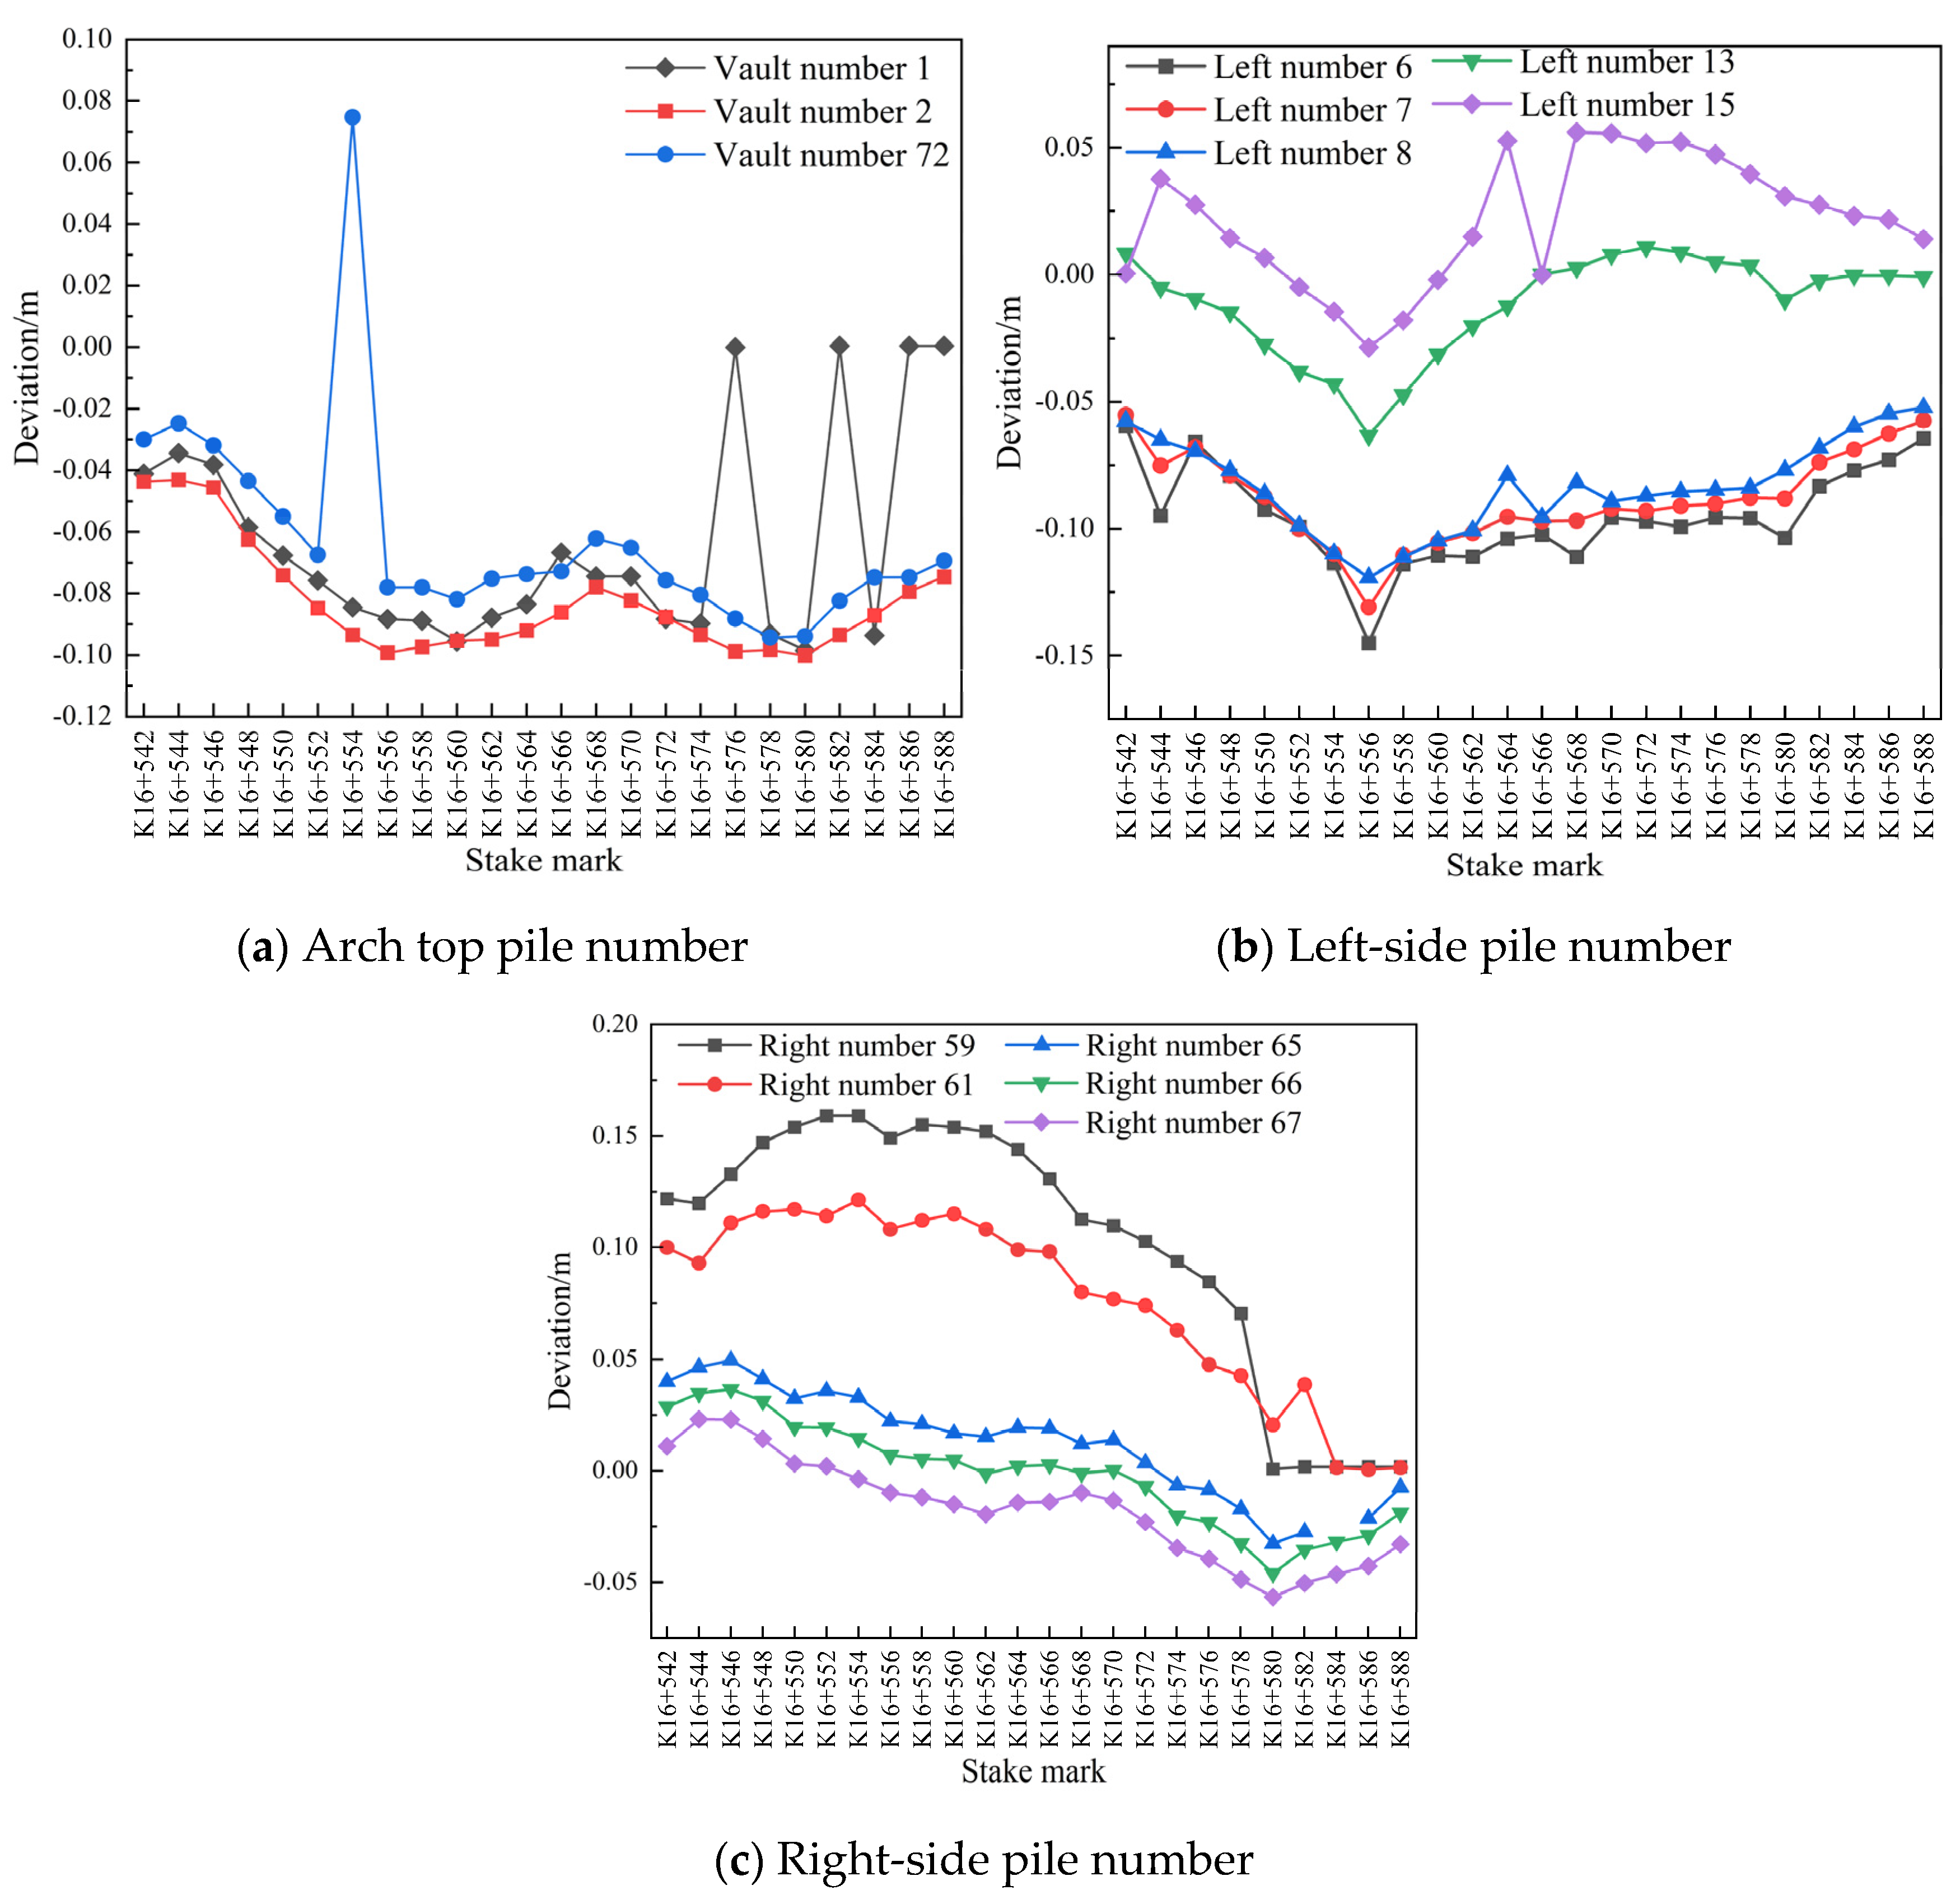
- Comparison of settlement and convergence of the initial surrounding rock at different measuring points and for different pile numbers
- (4)
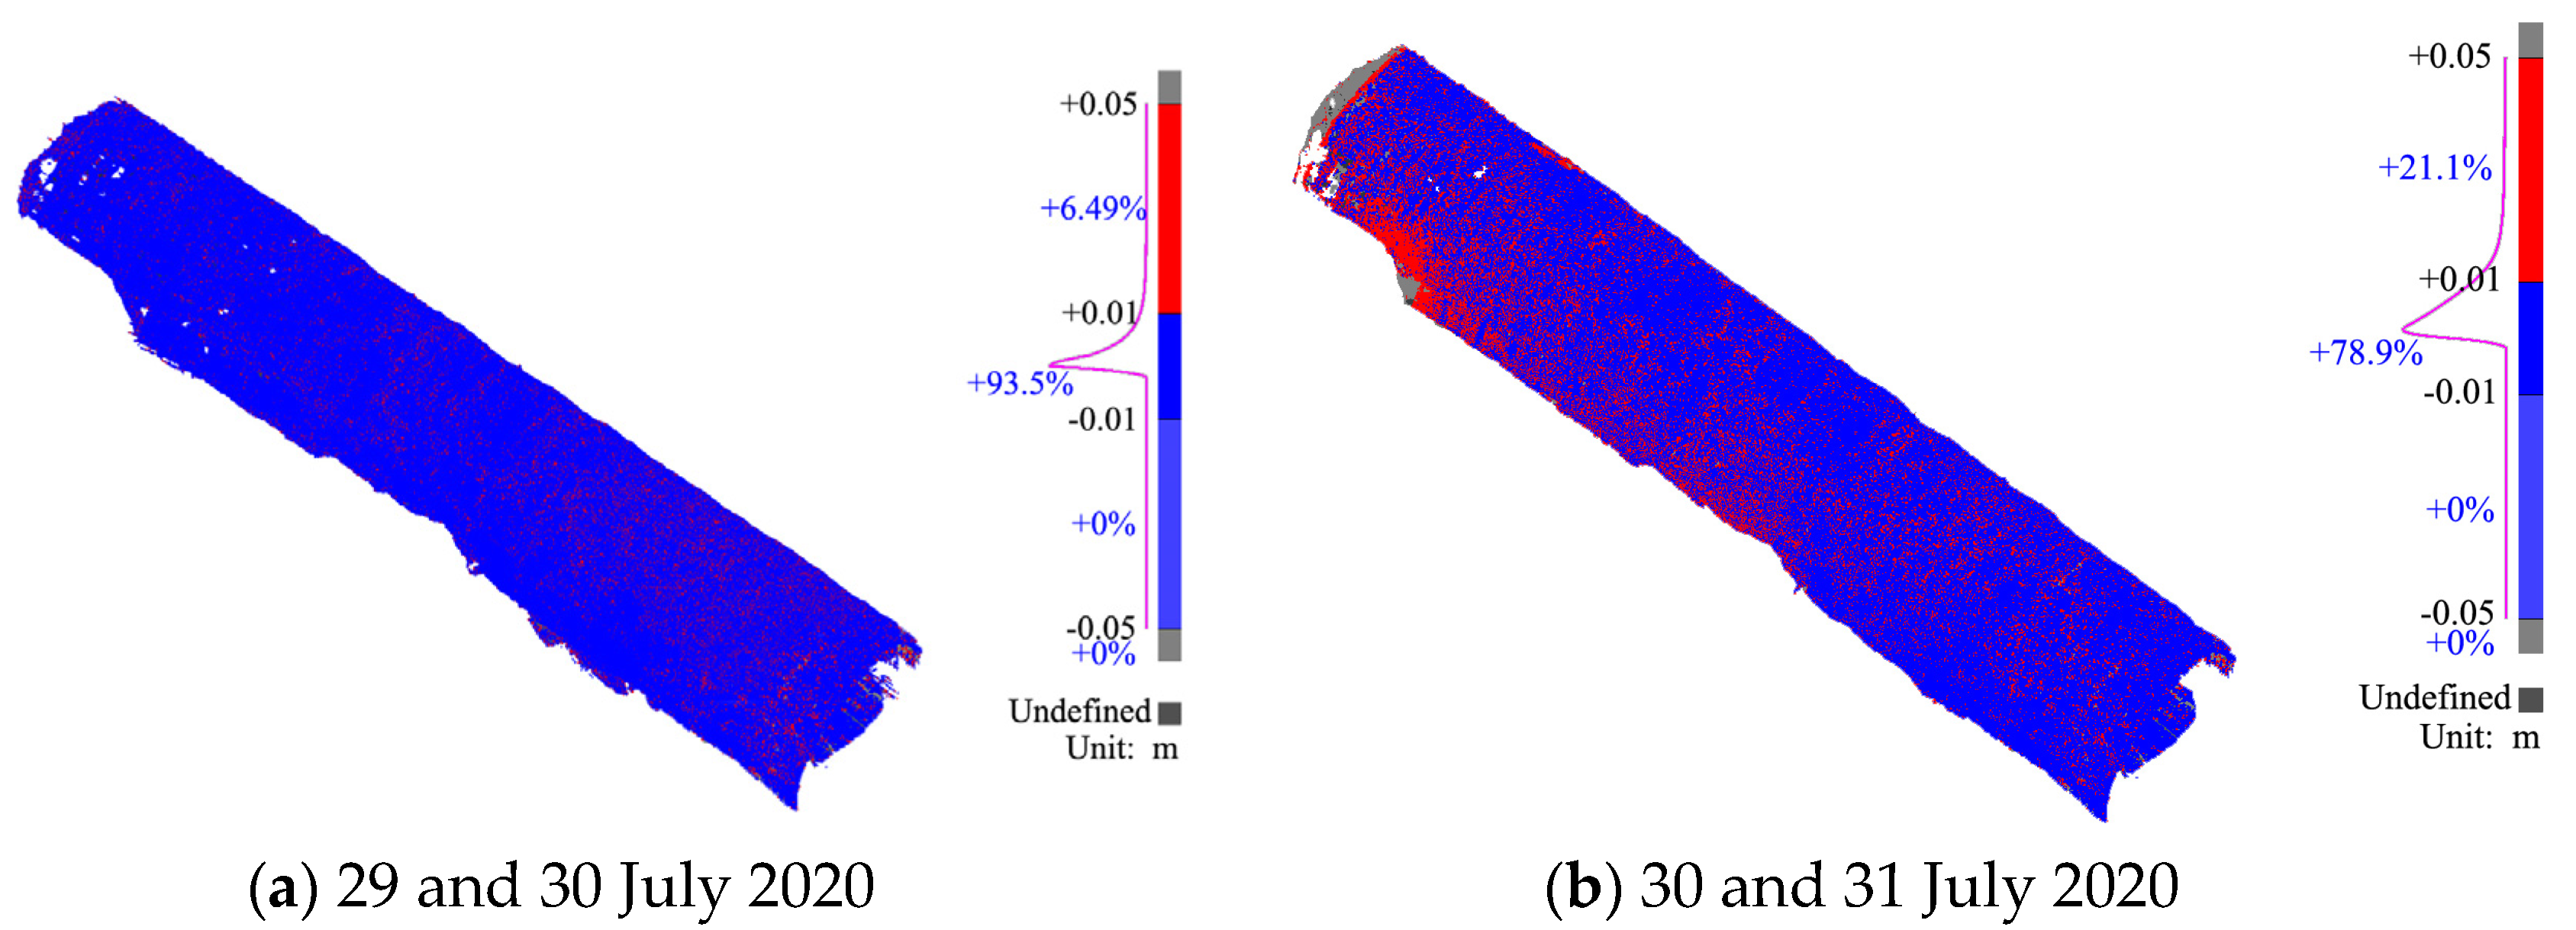
- Chromatographic analysis
- (5)
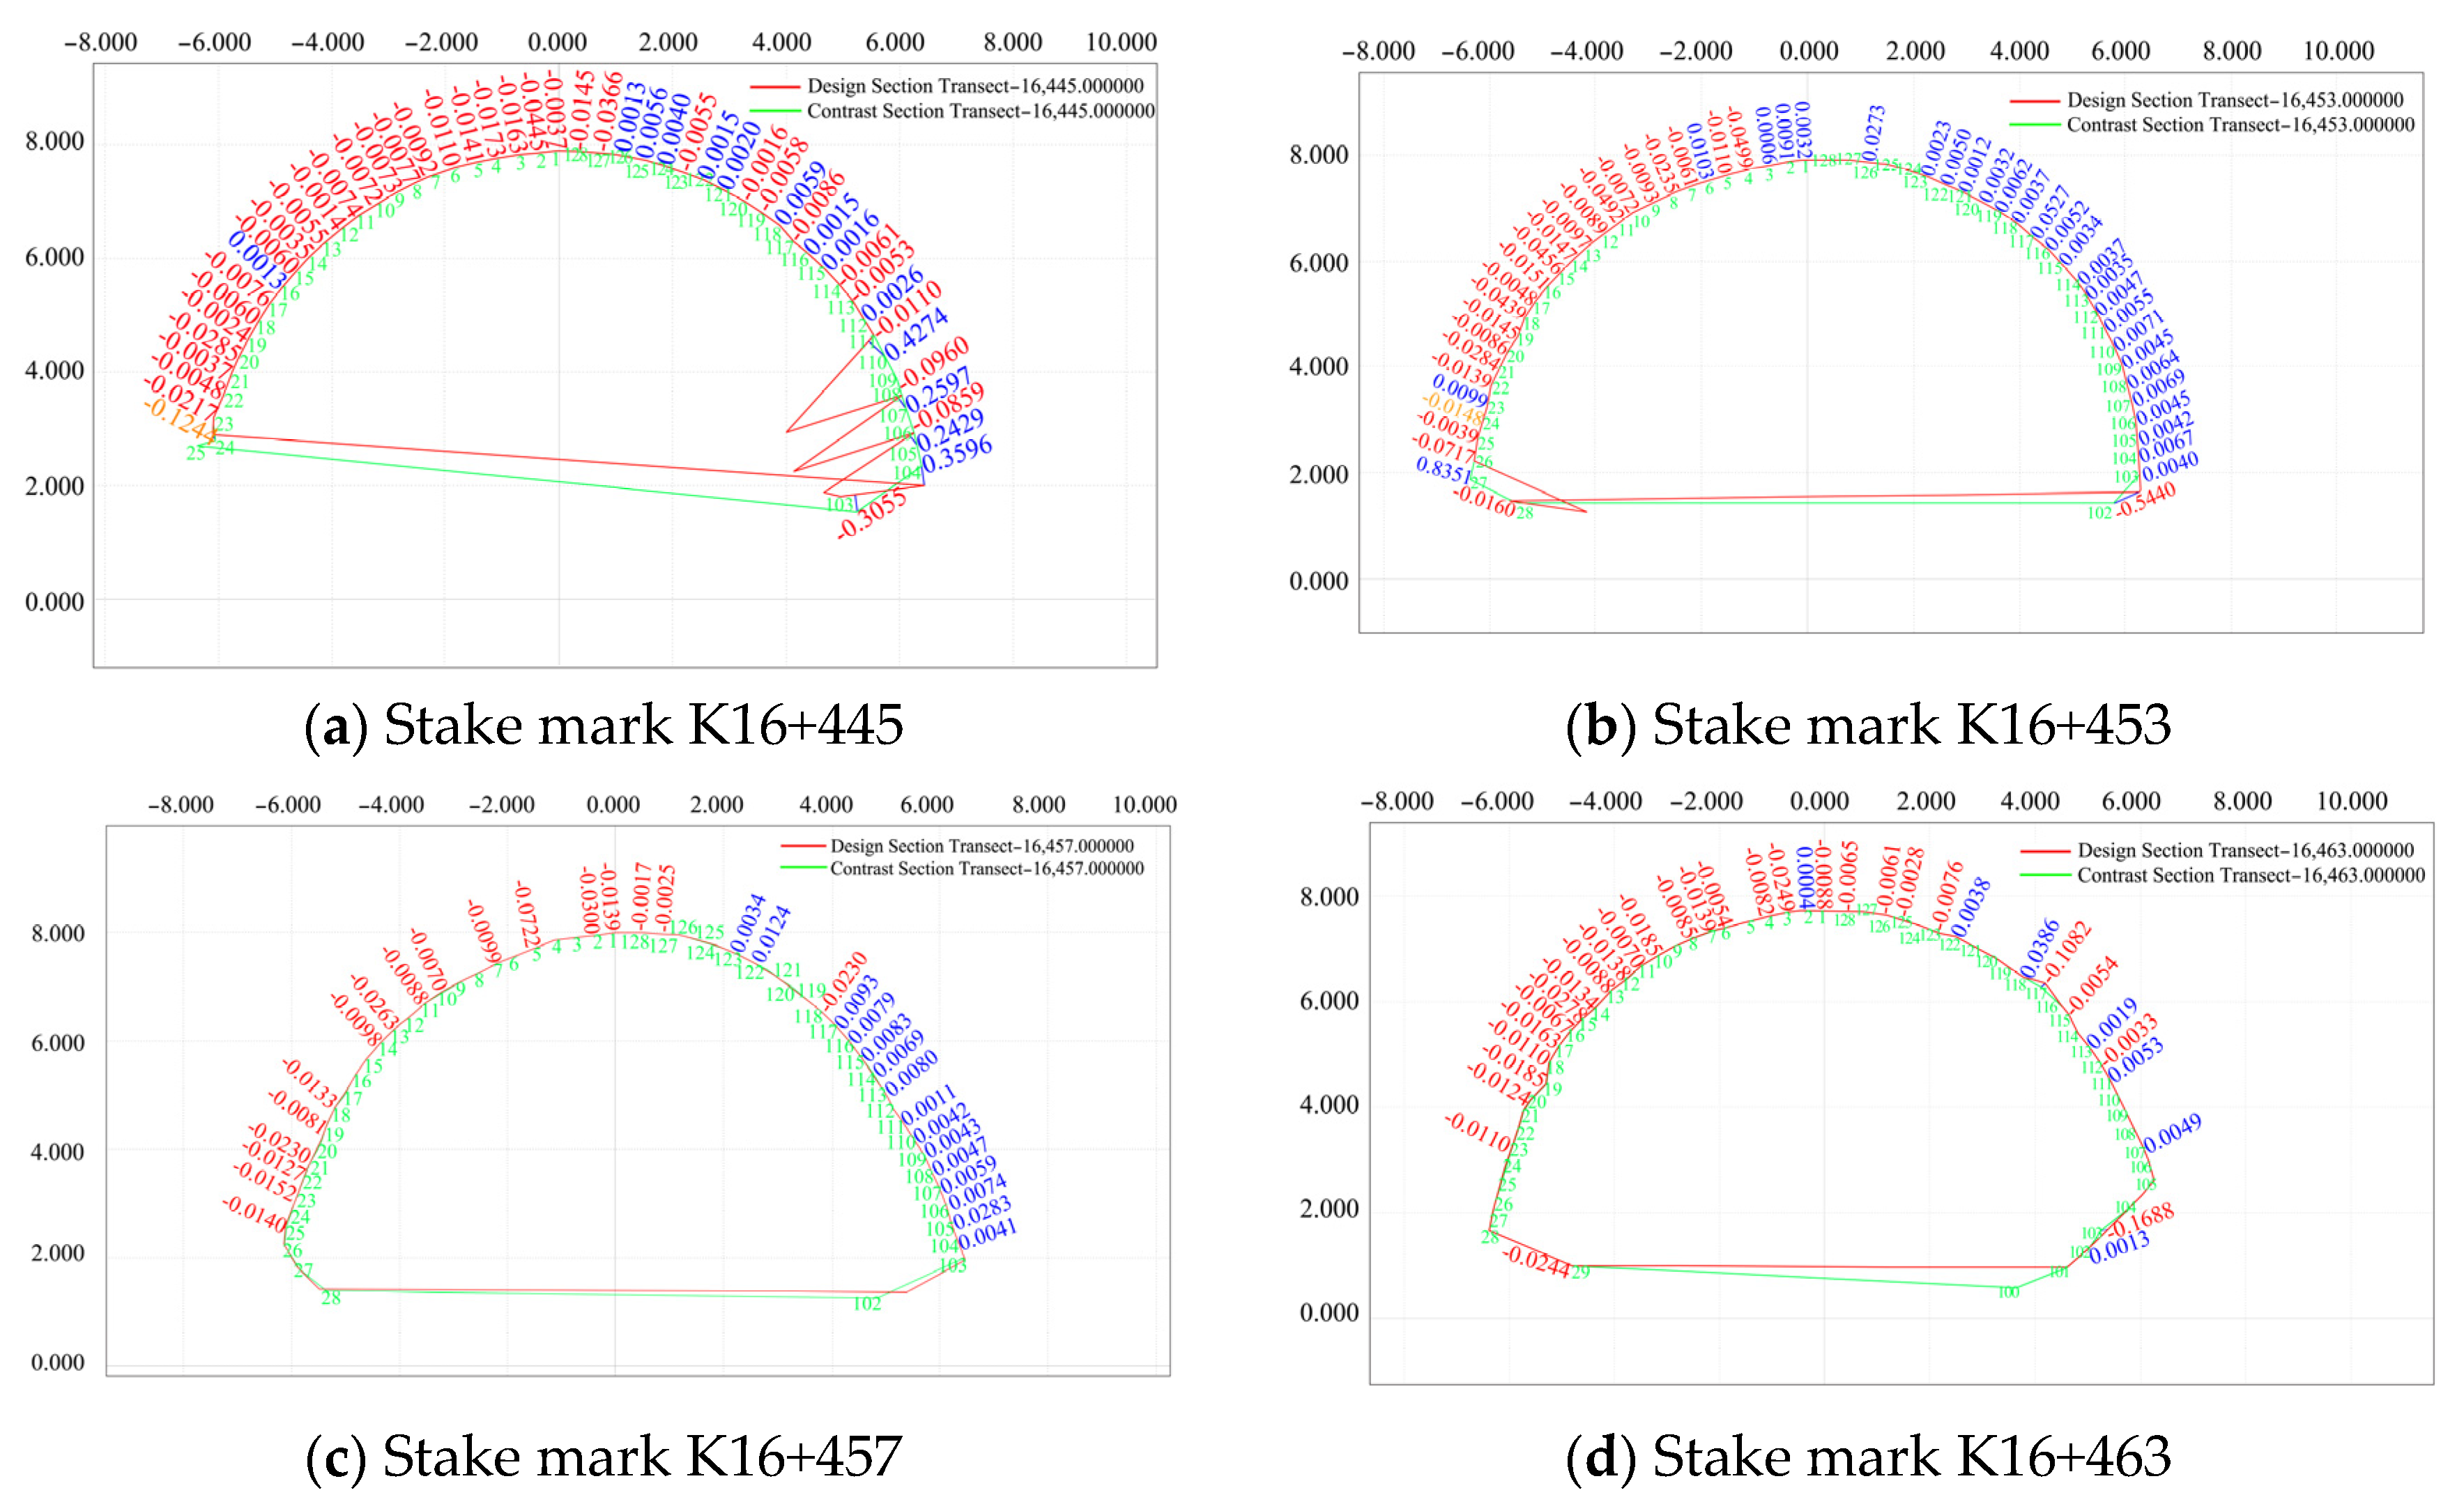
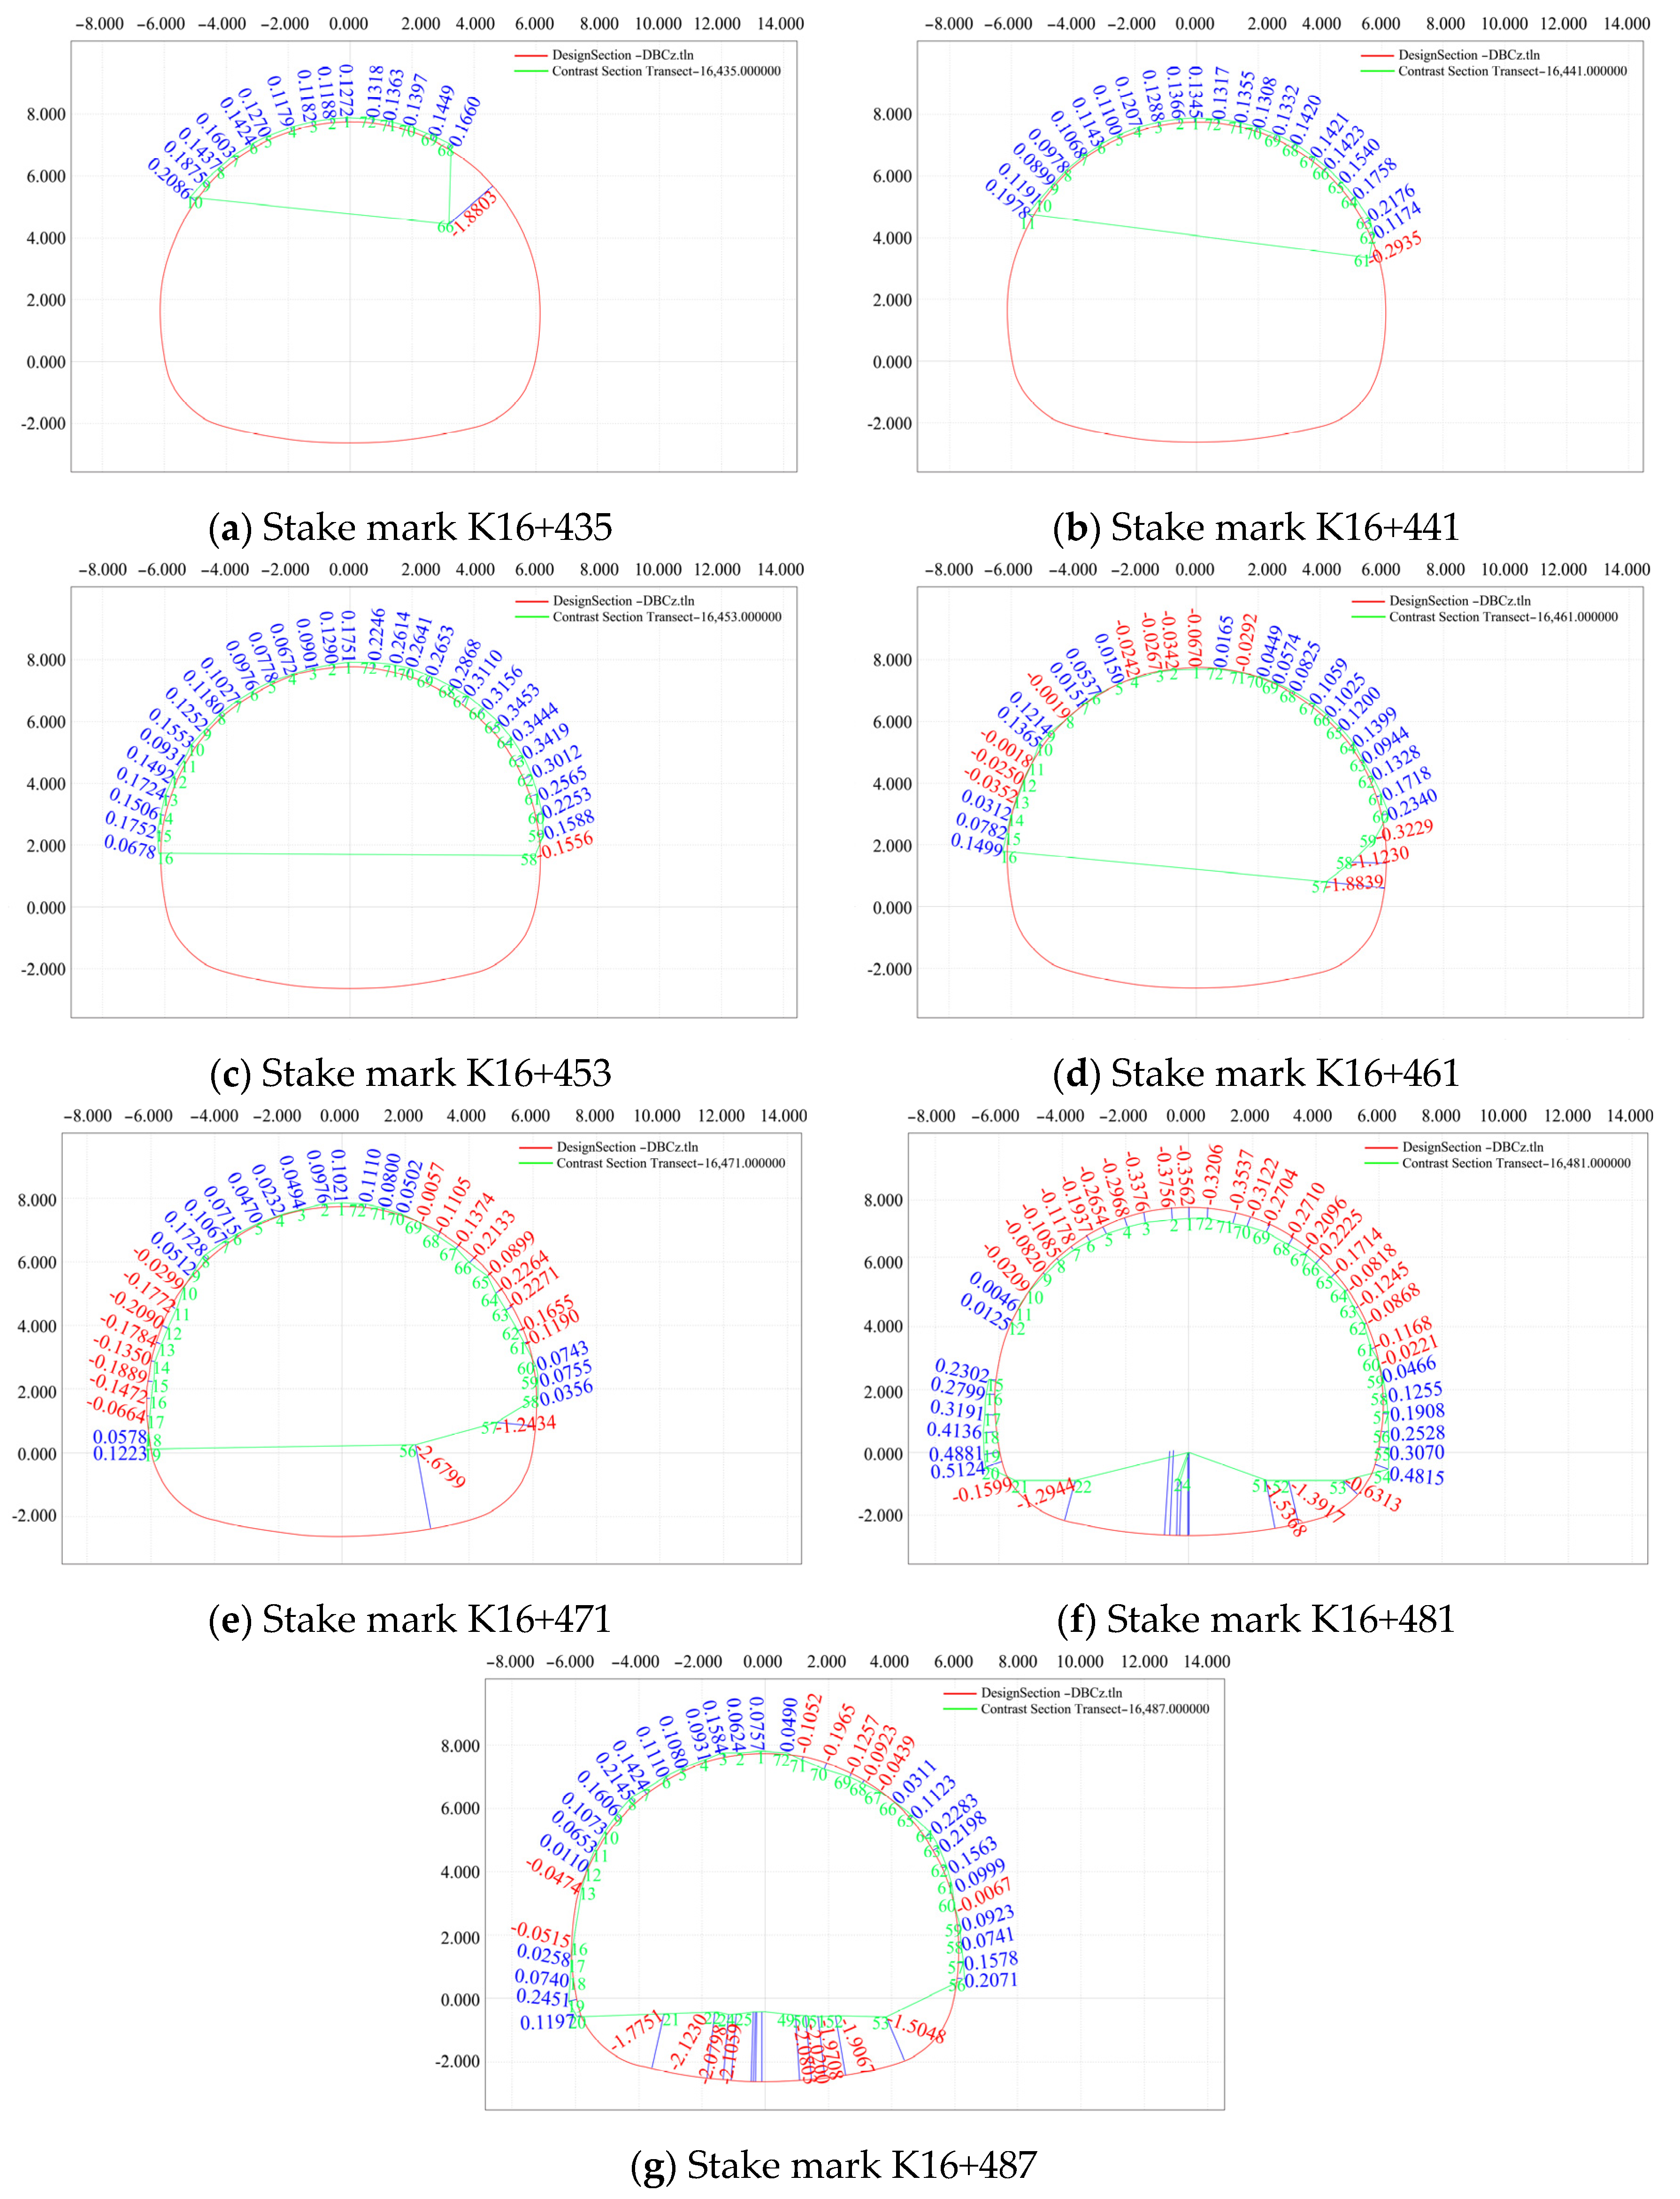
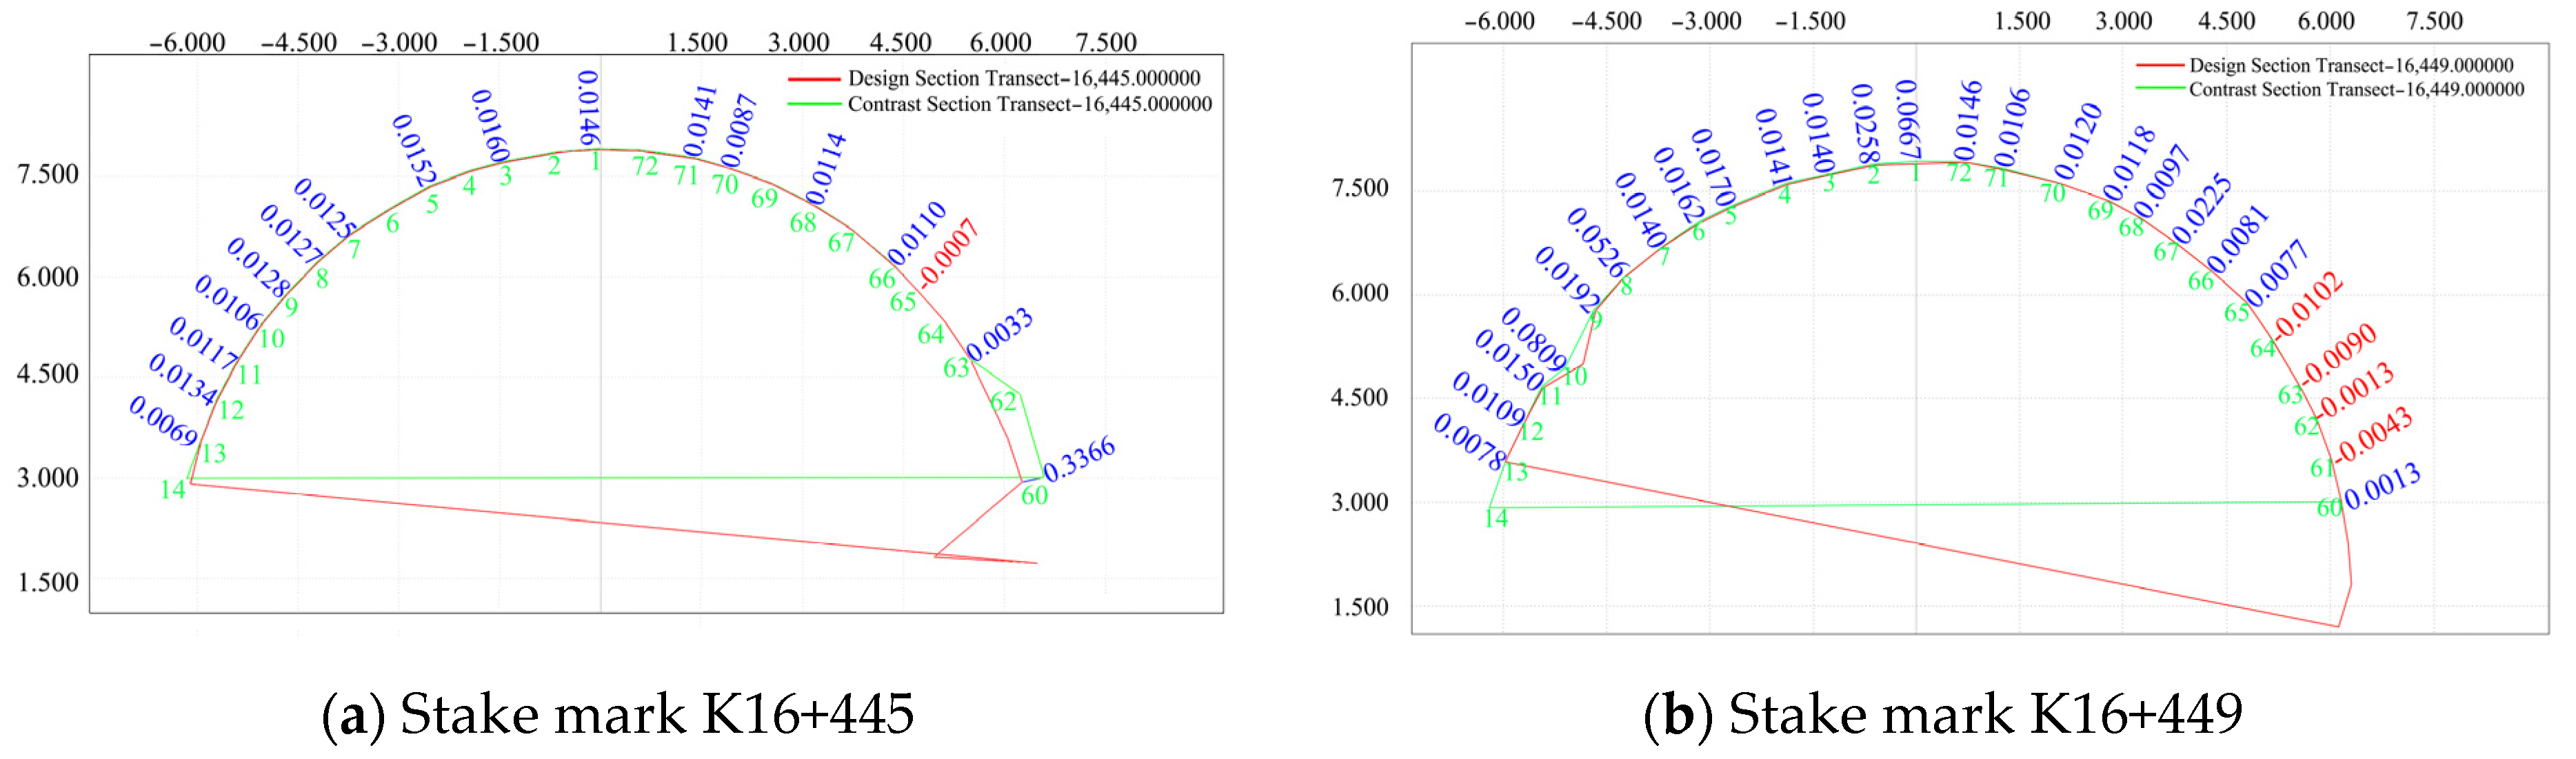
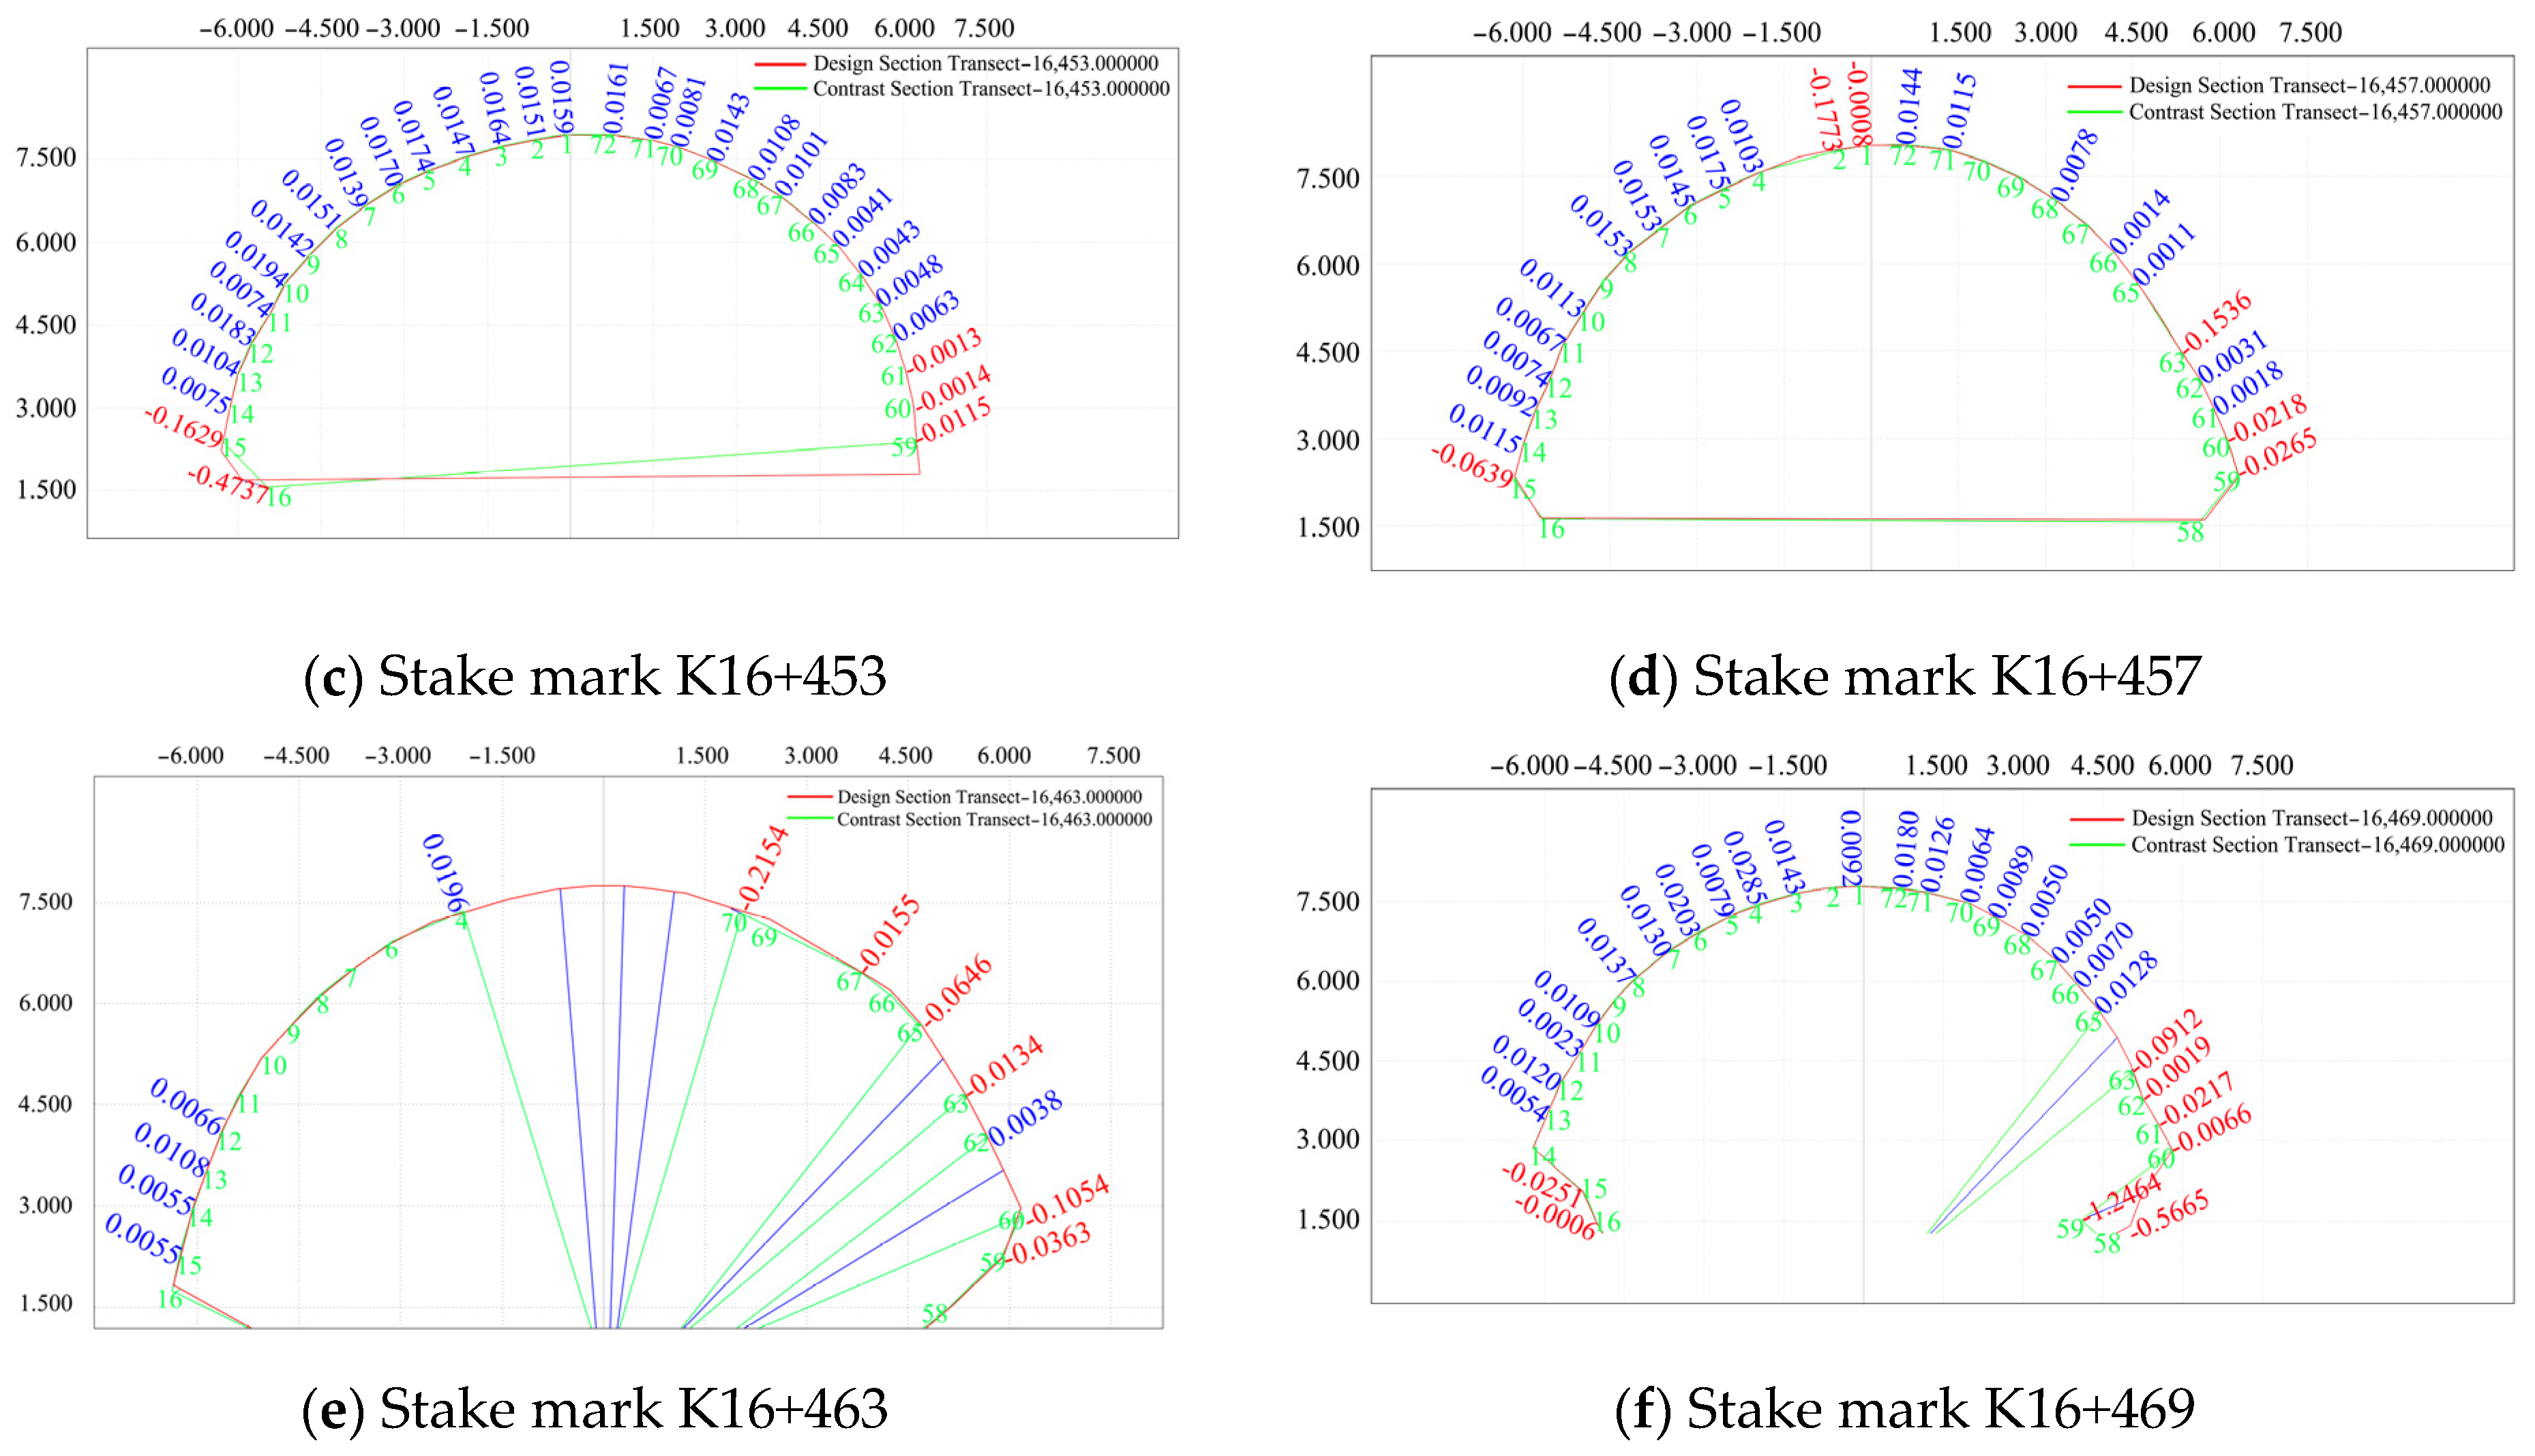
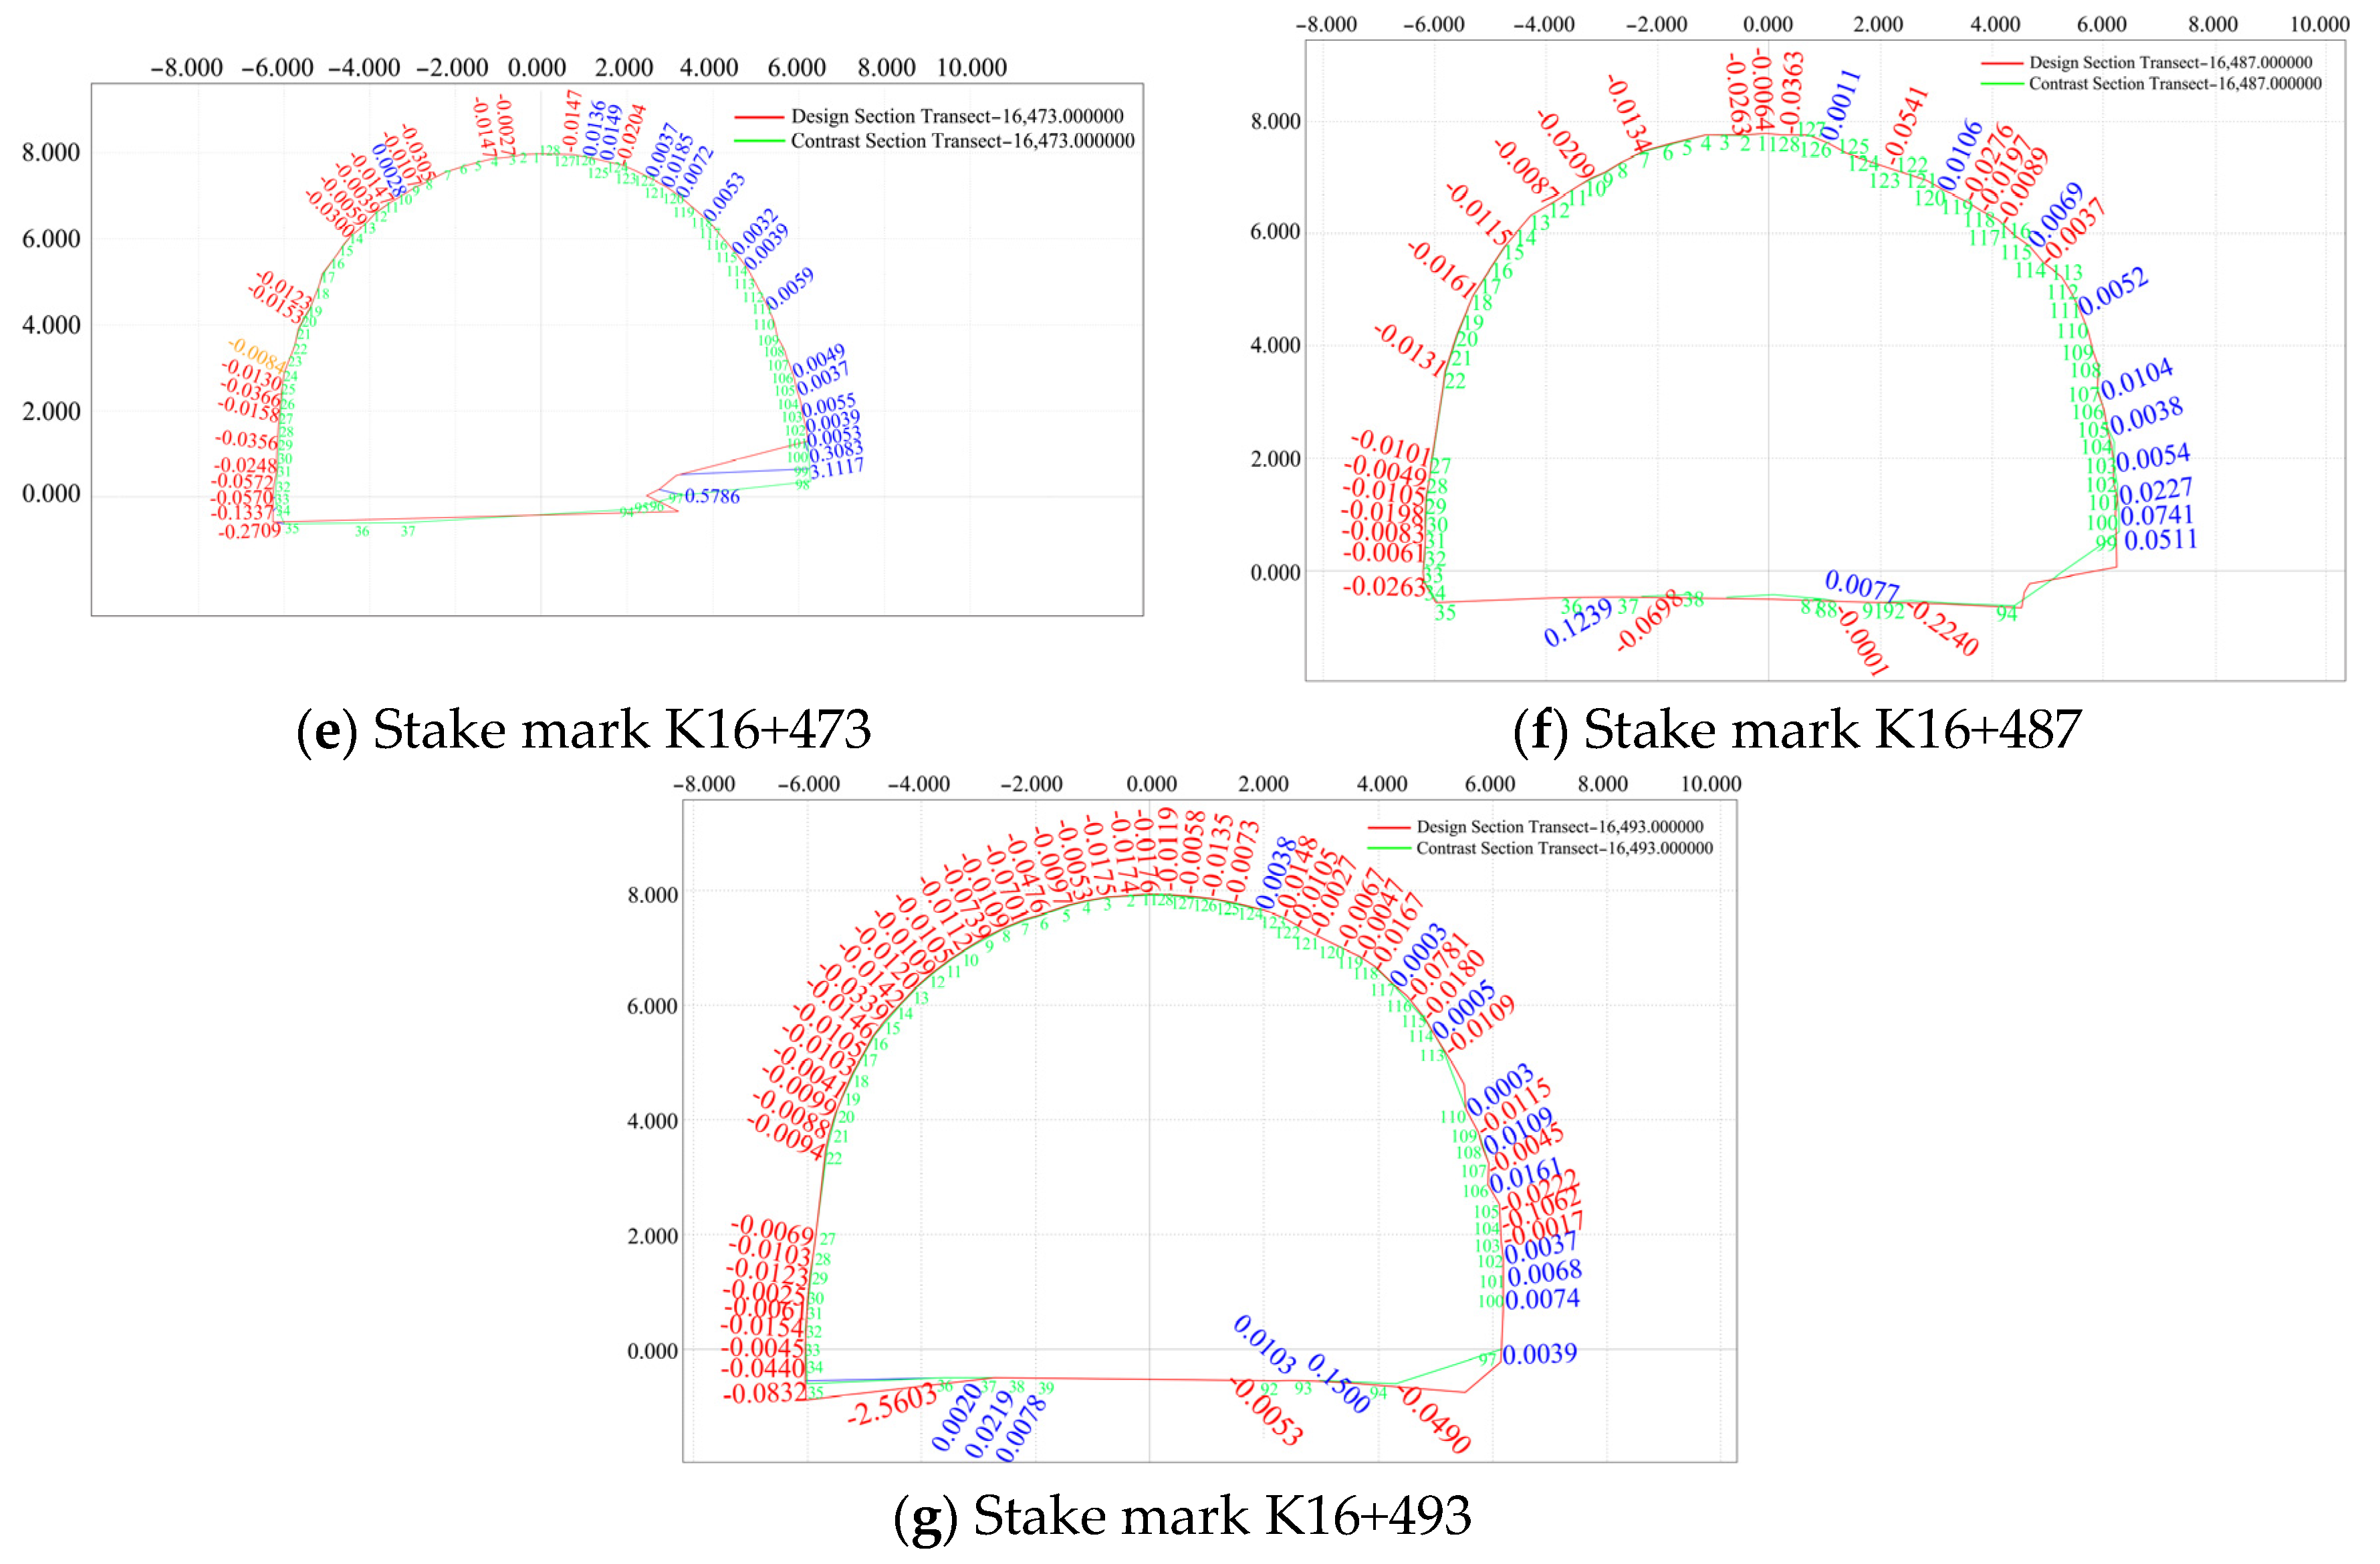
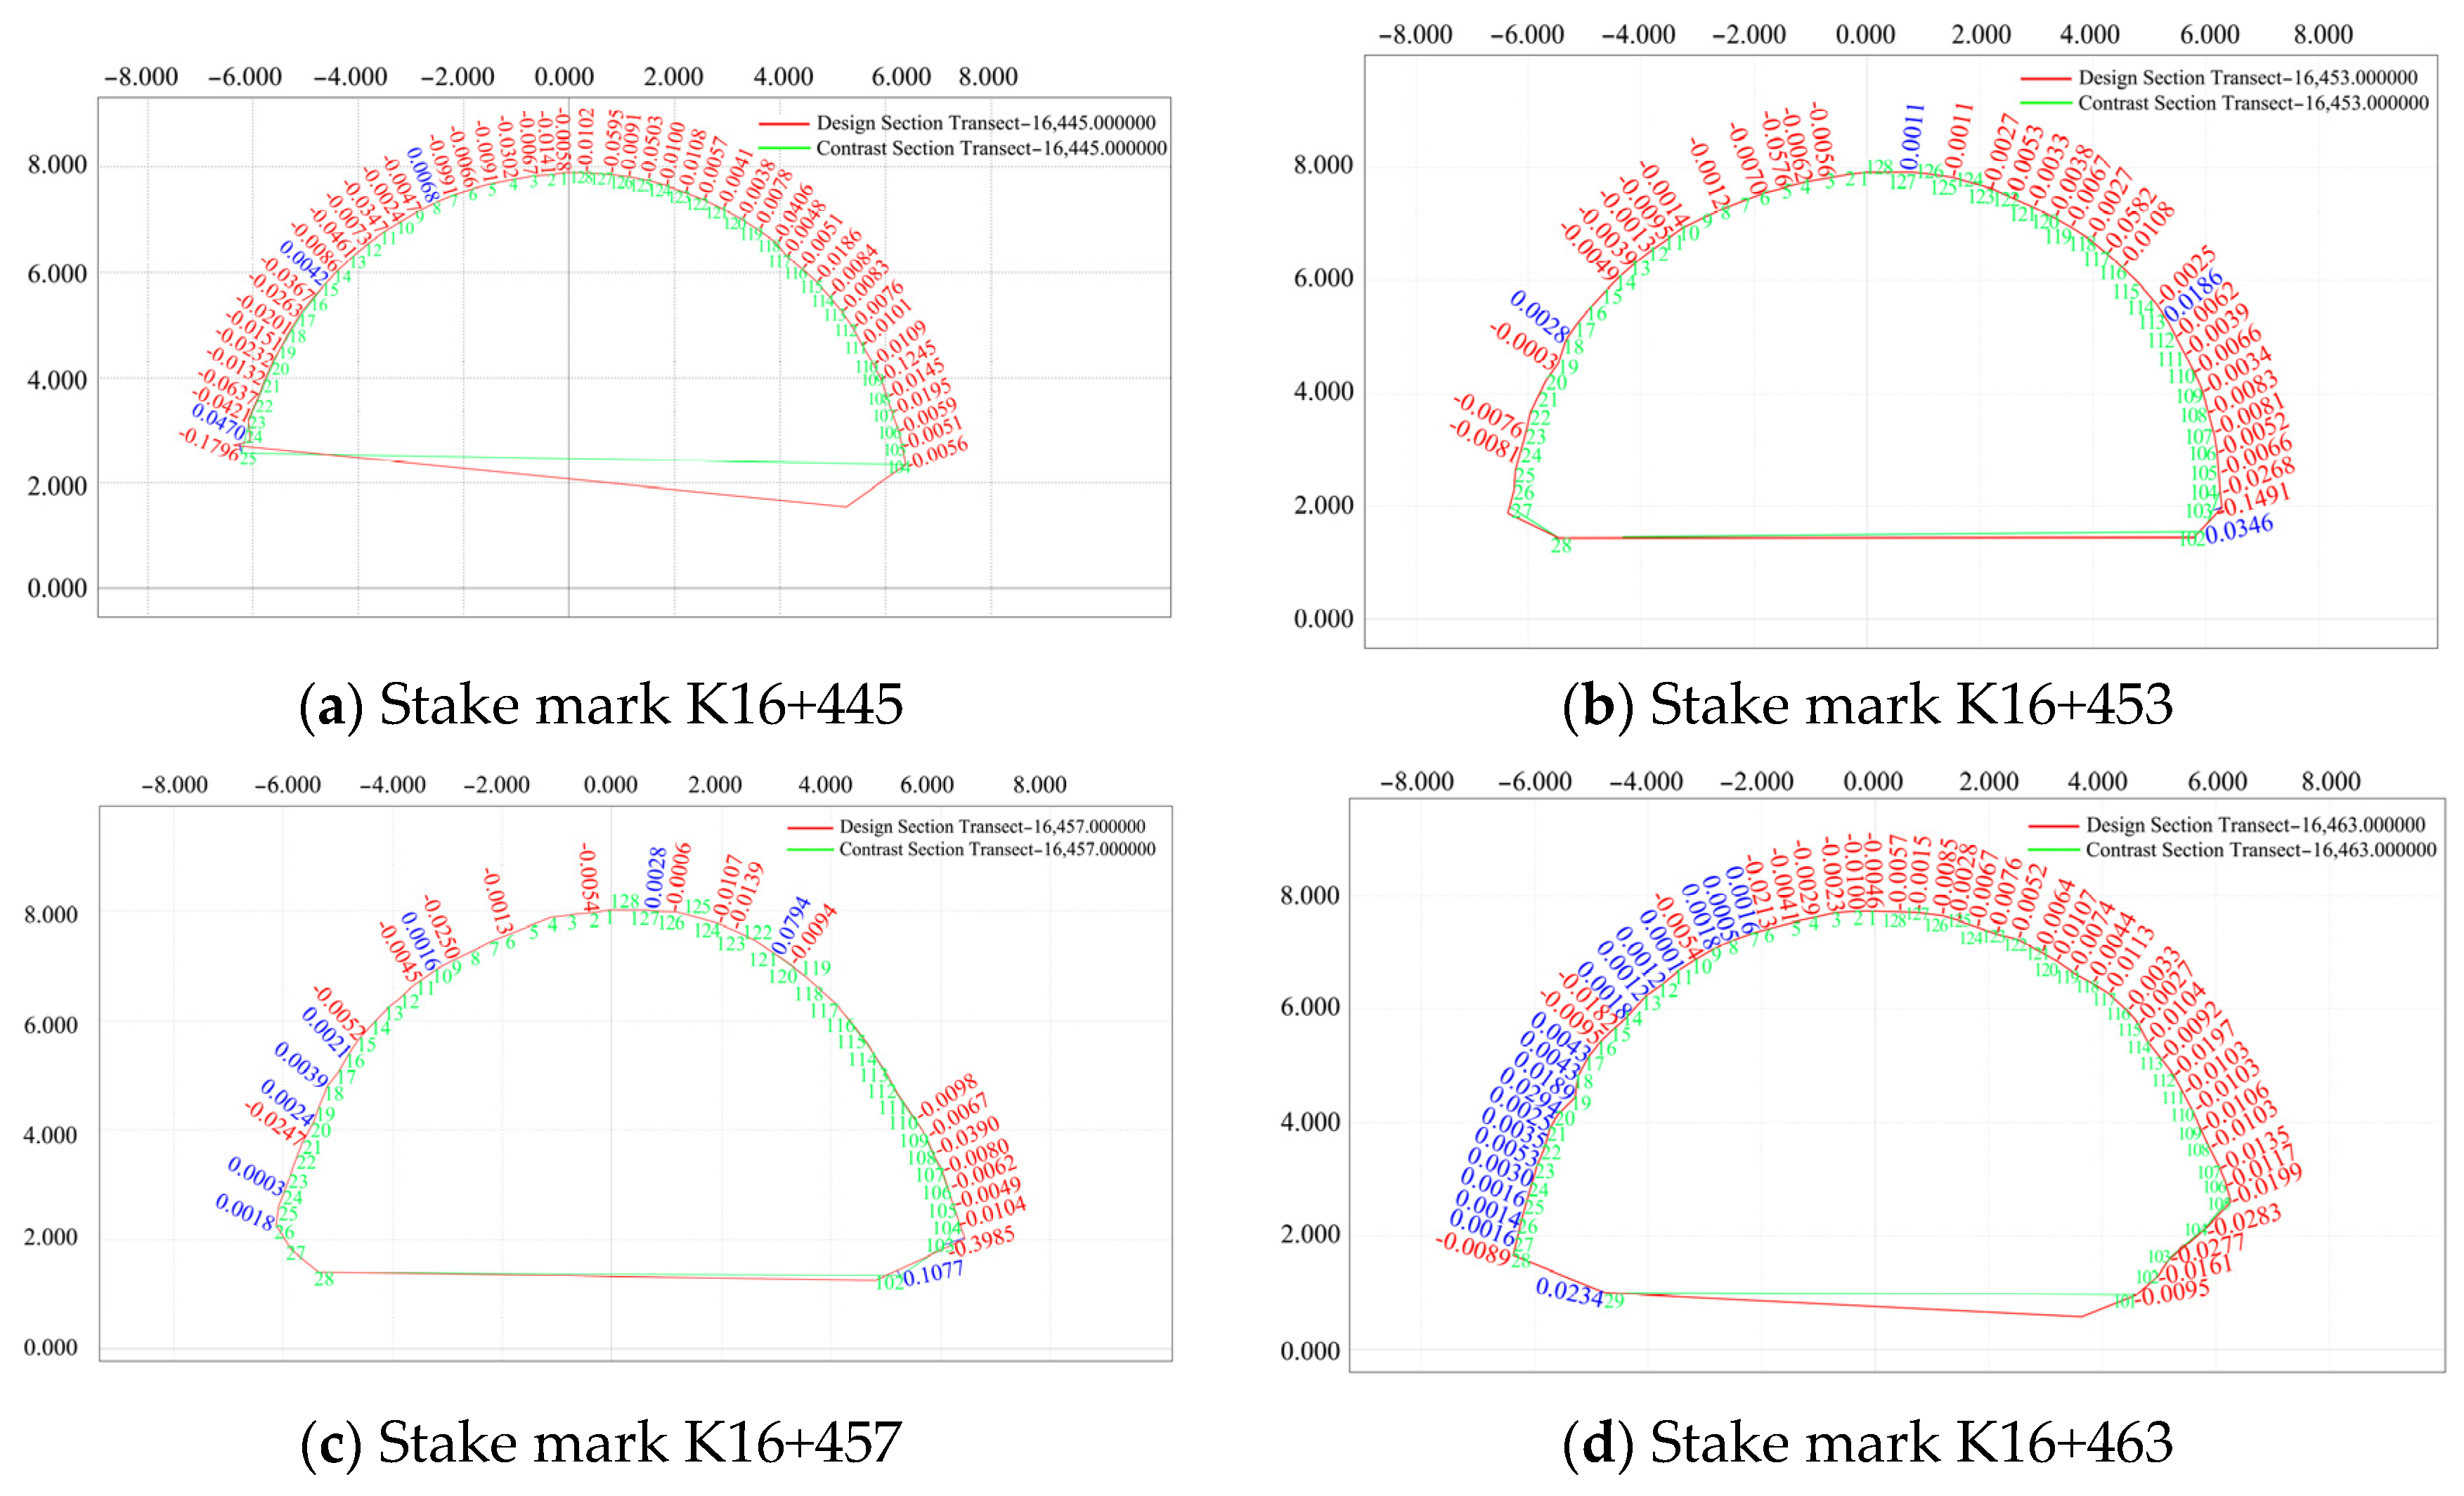
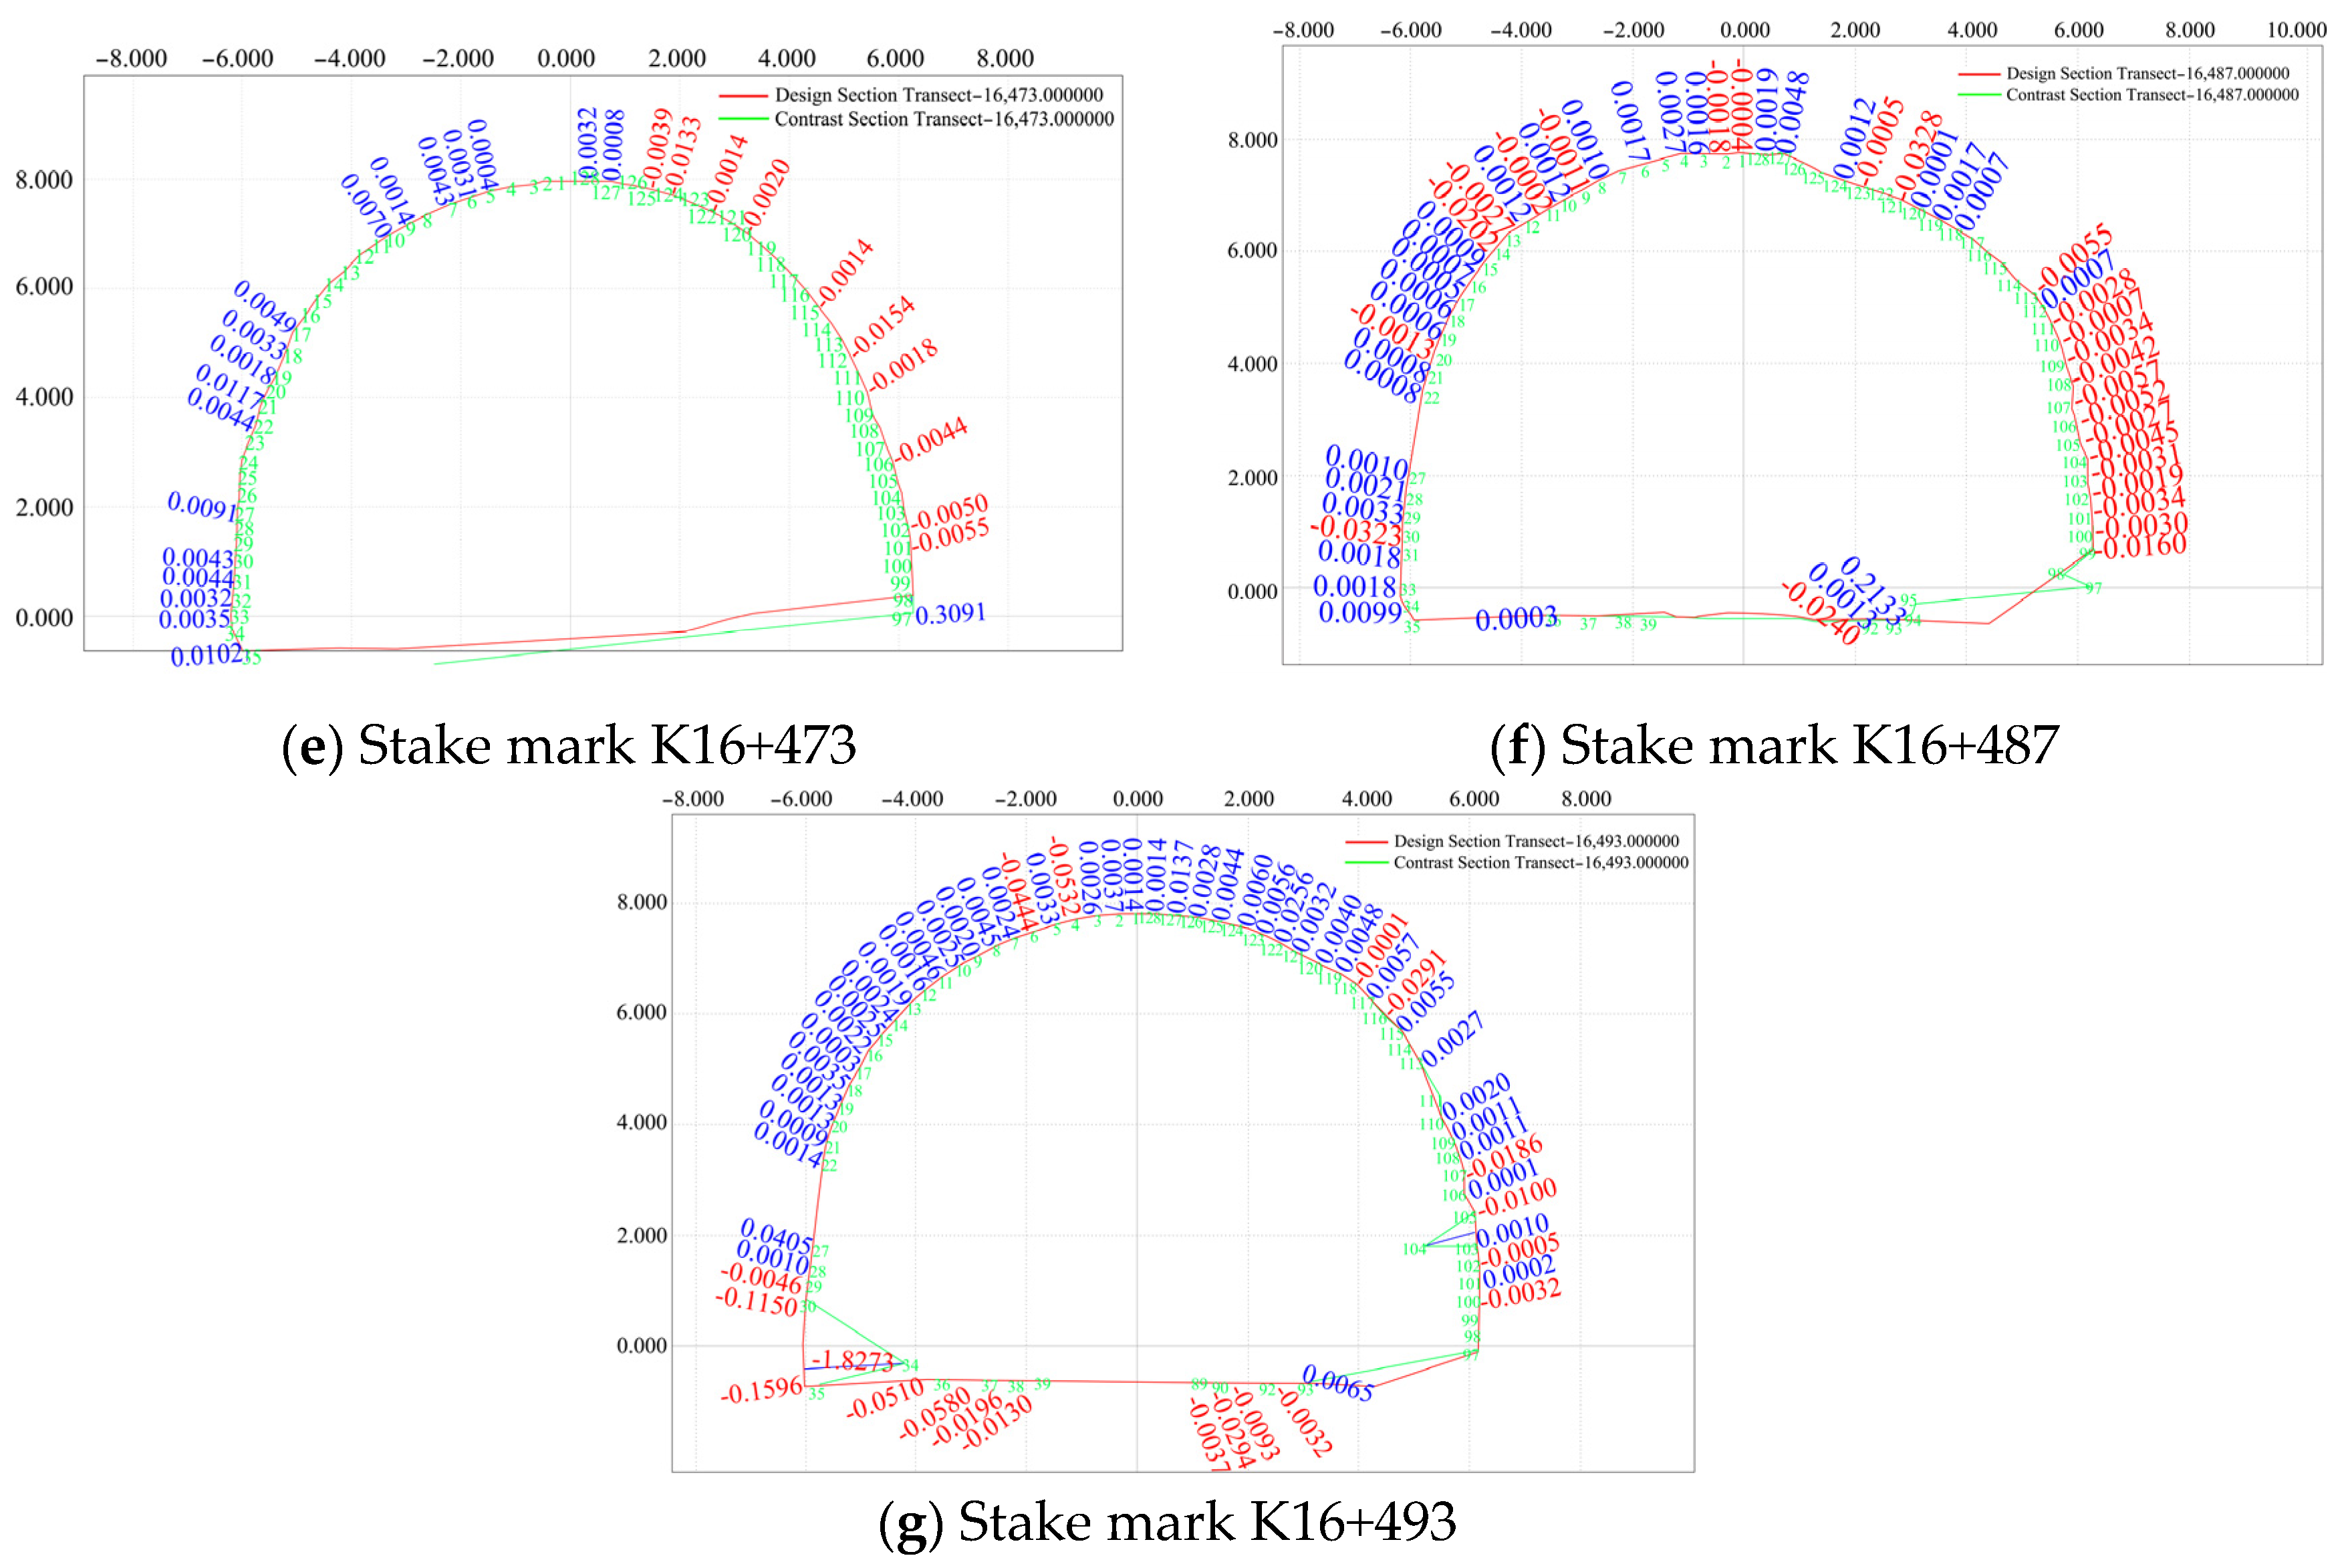
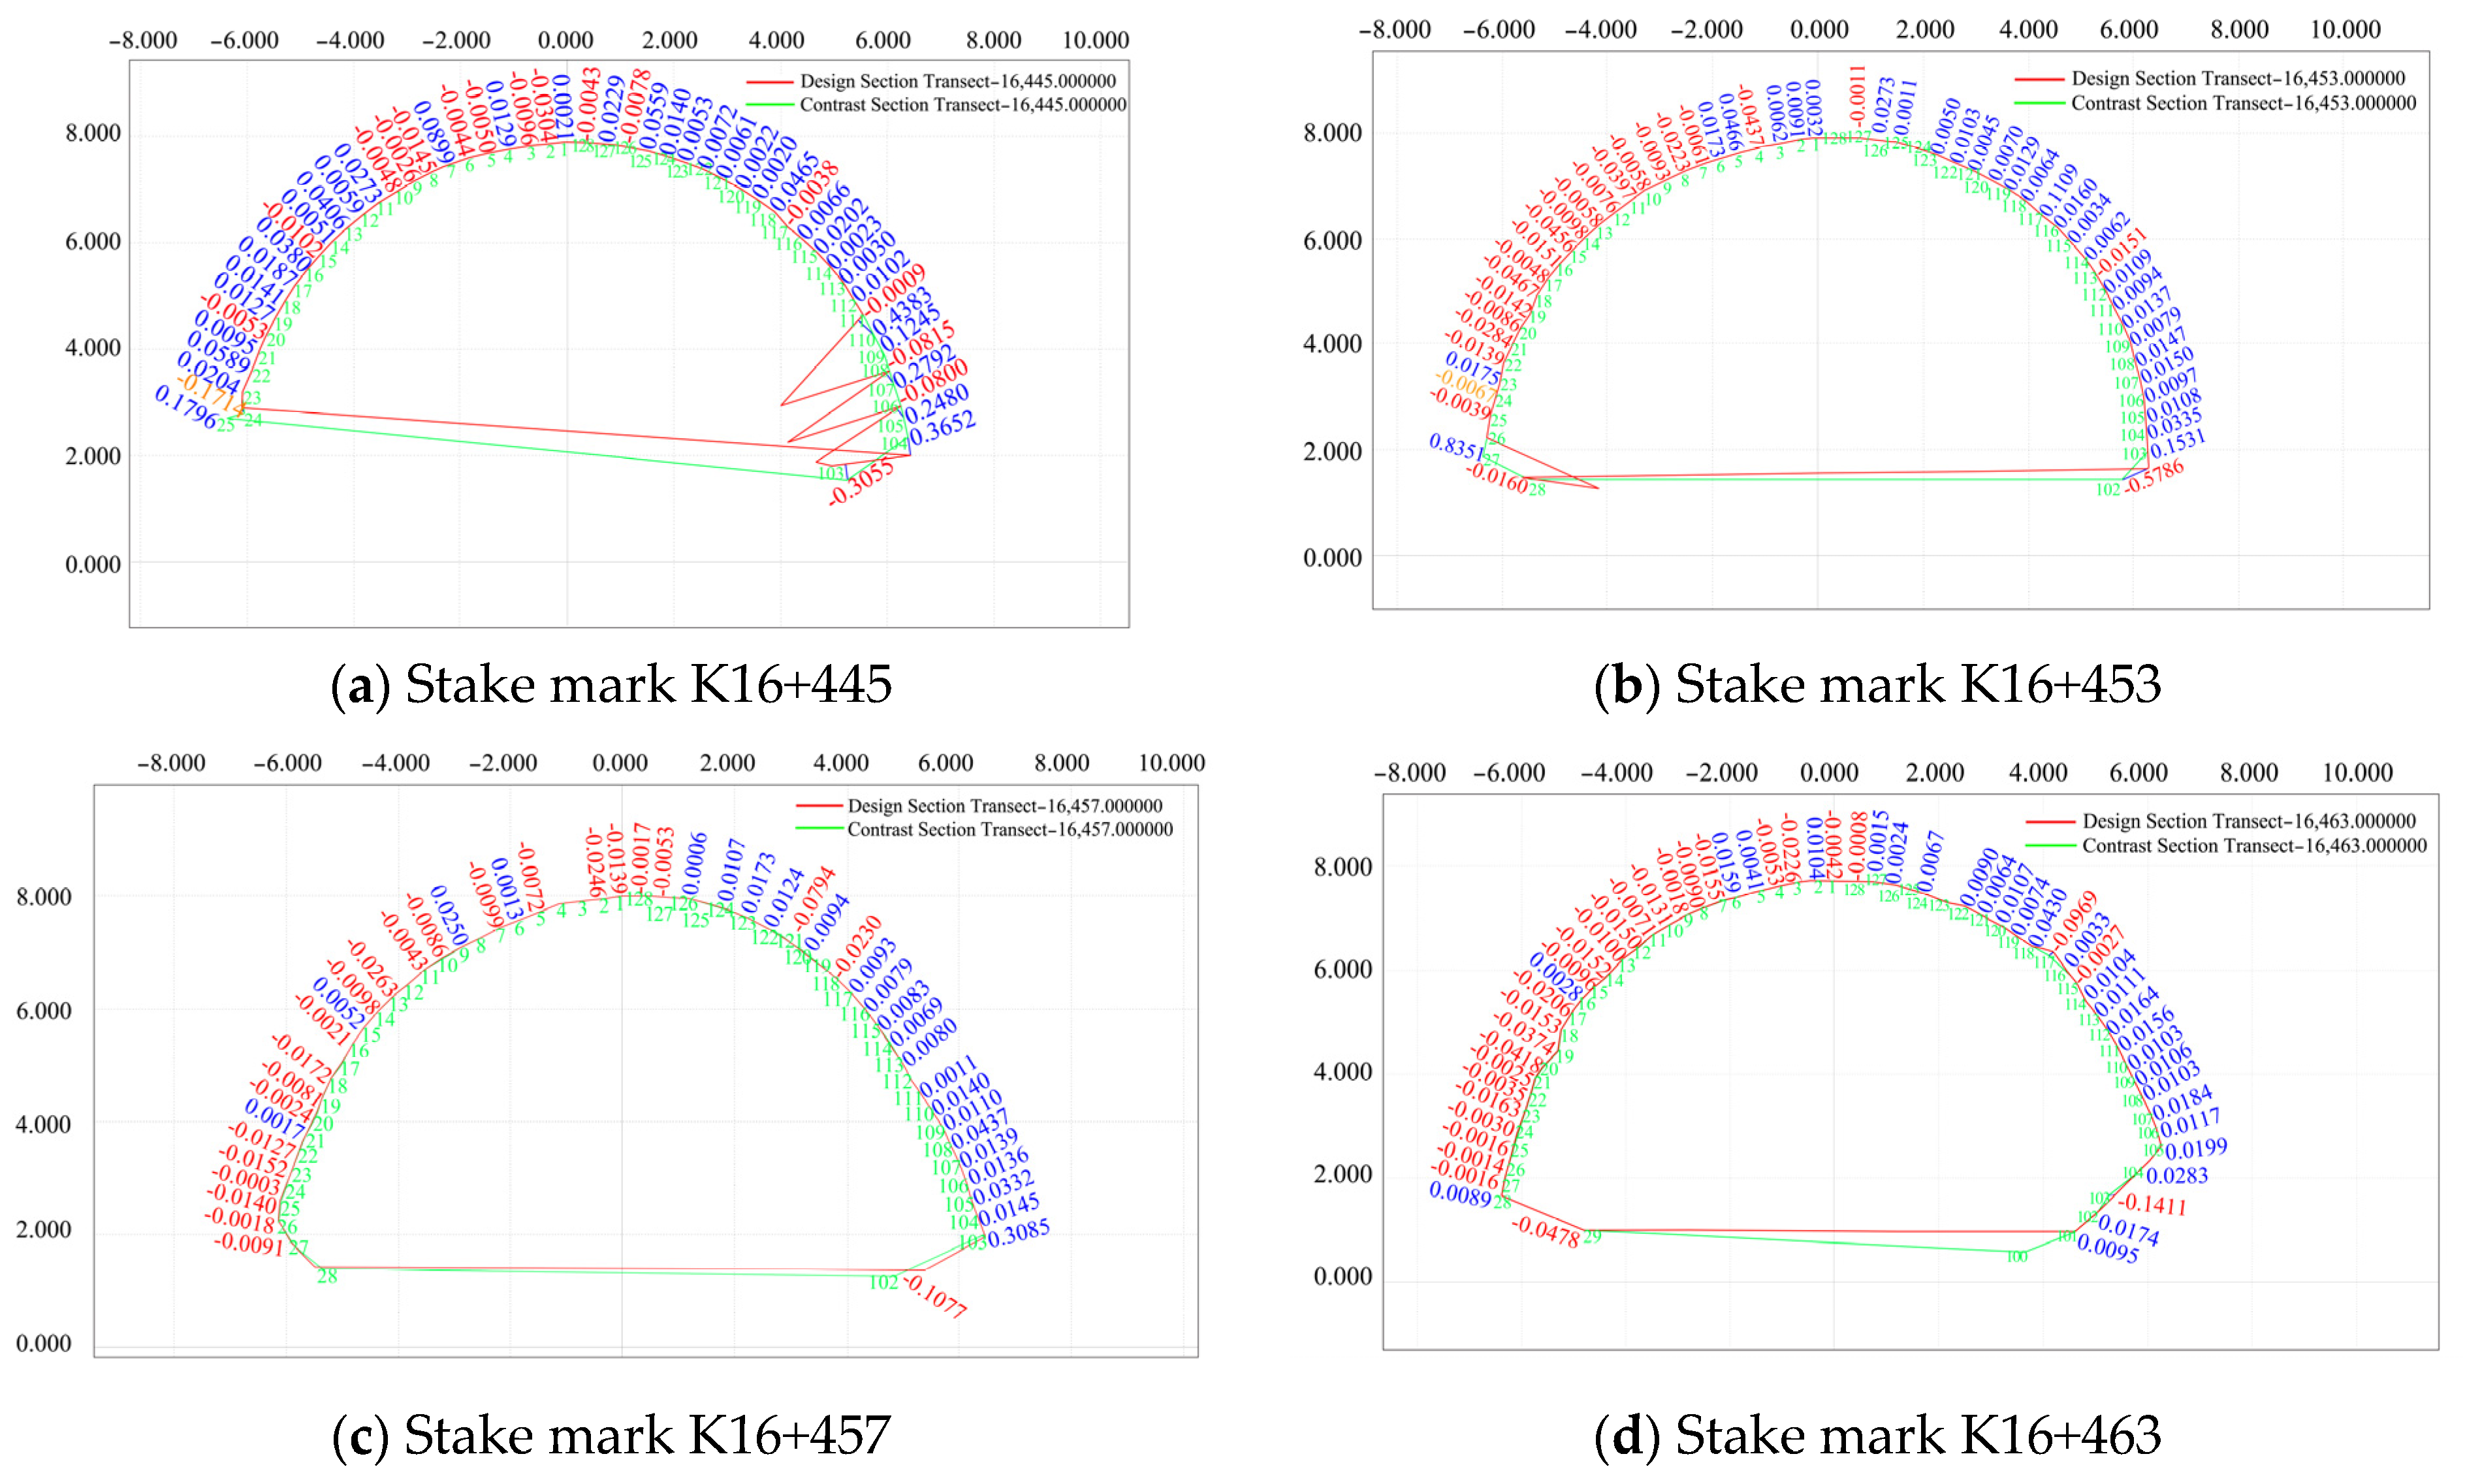
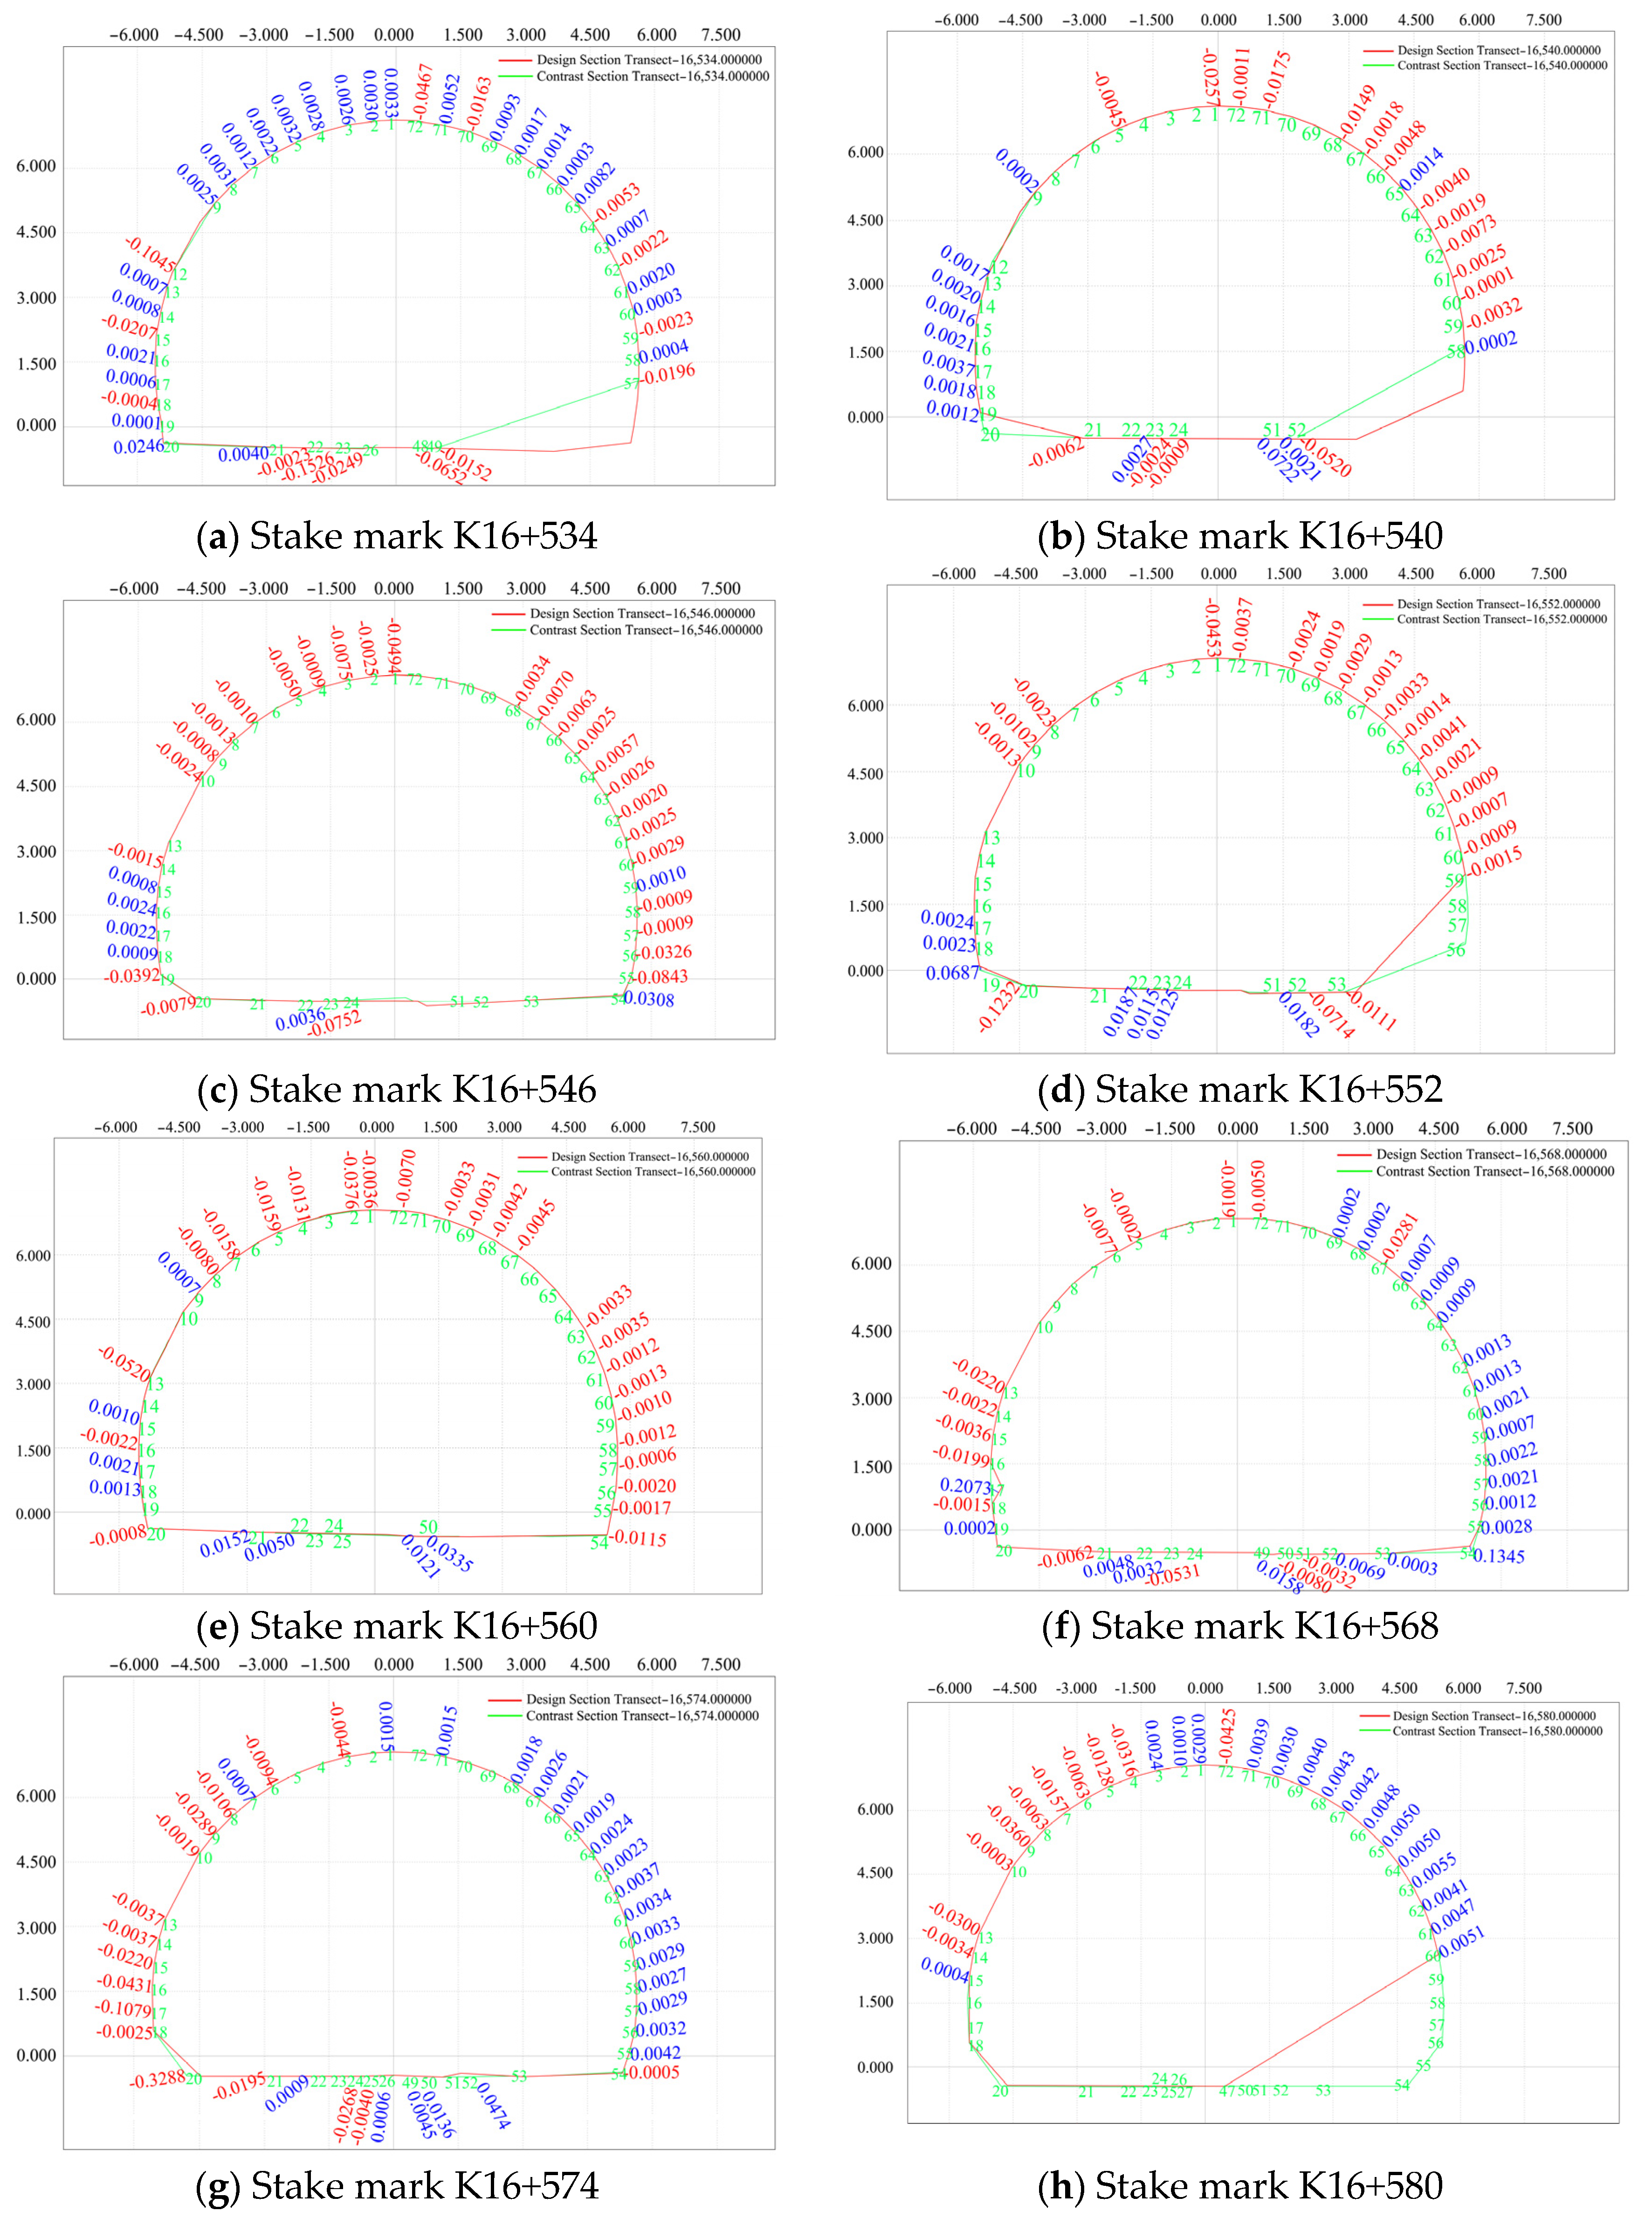
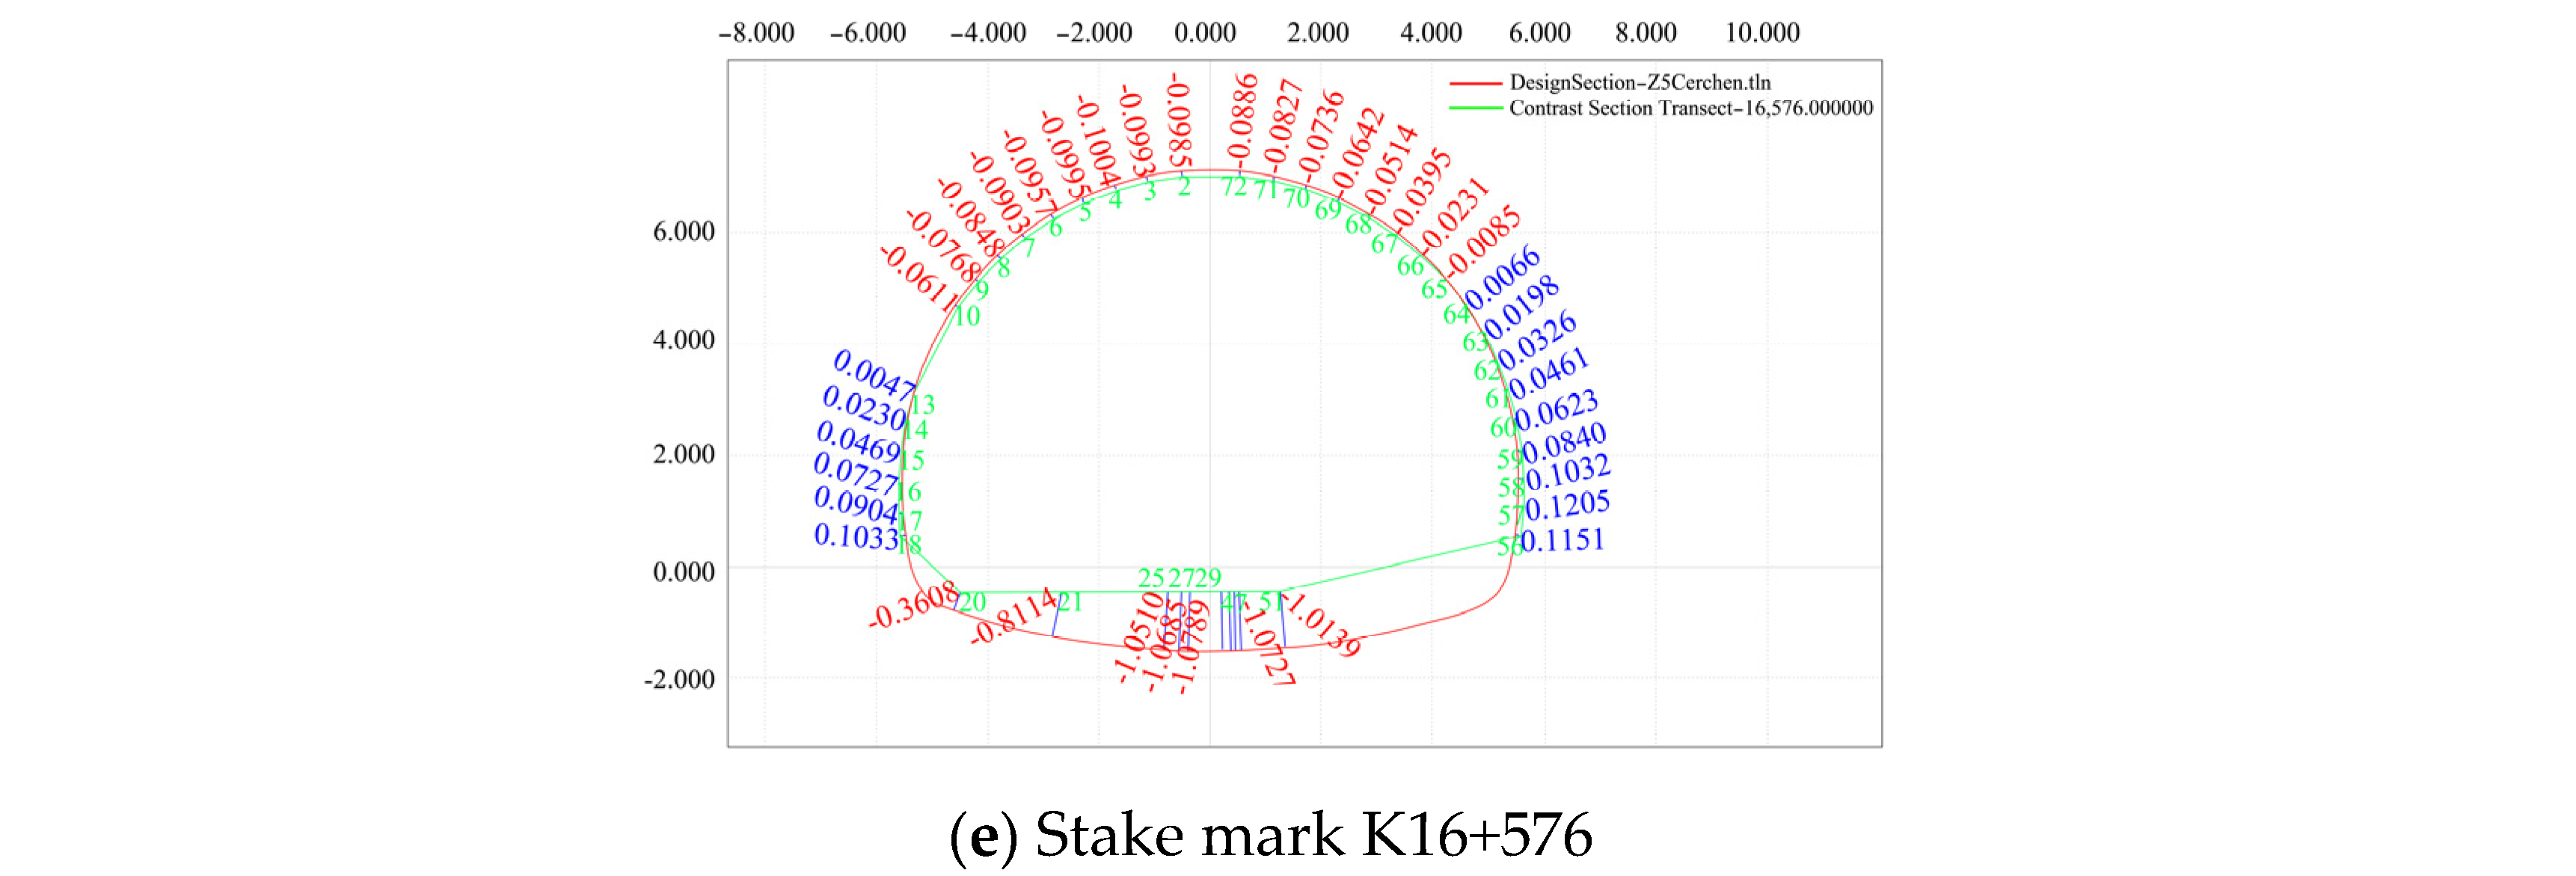
- Comparative analysis of the section generated by the initial branch and the designed section of the initial branch on 30 July 2020
- (6)
- Comparison of the settlement and convergence of the initial surrounding rock at different measuring points and for different pile numbers
4.2. Contrast Analysis of Secondary Lining Section
- (1)
- Deformation analysis of the secondary lining
- (2)
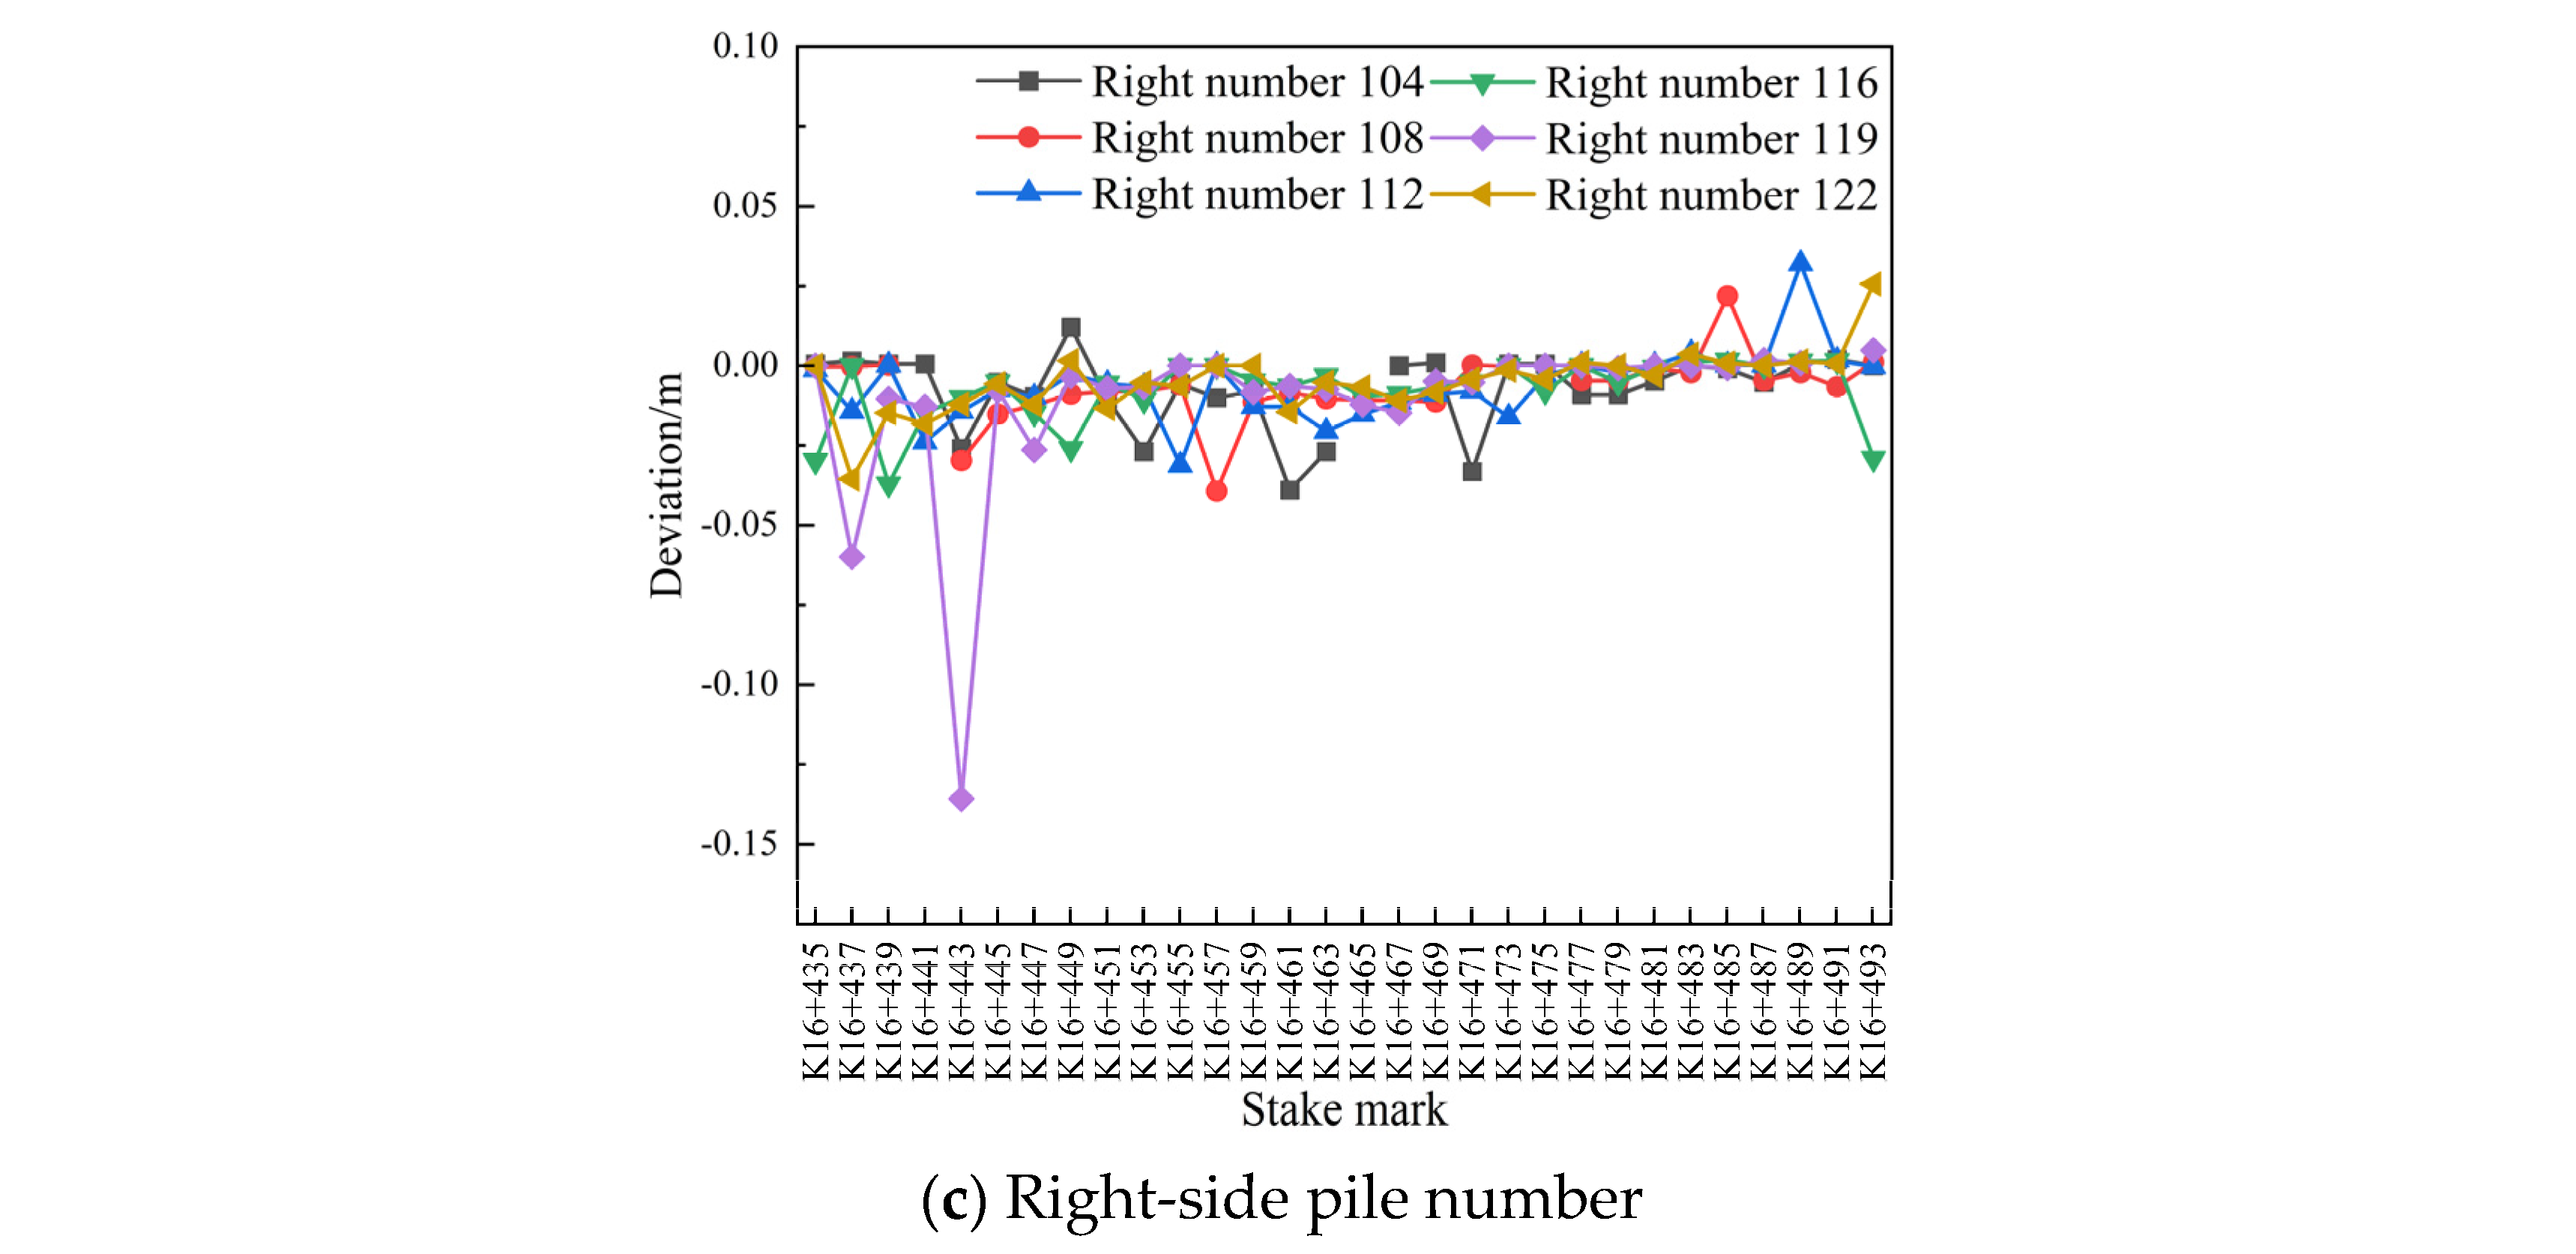
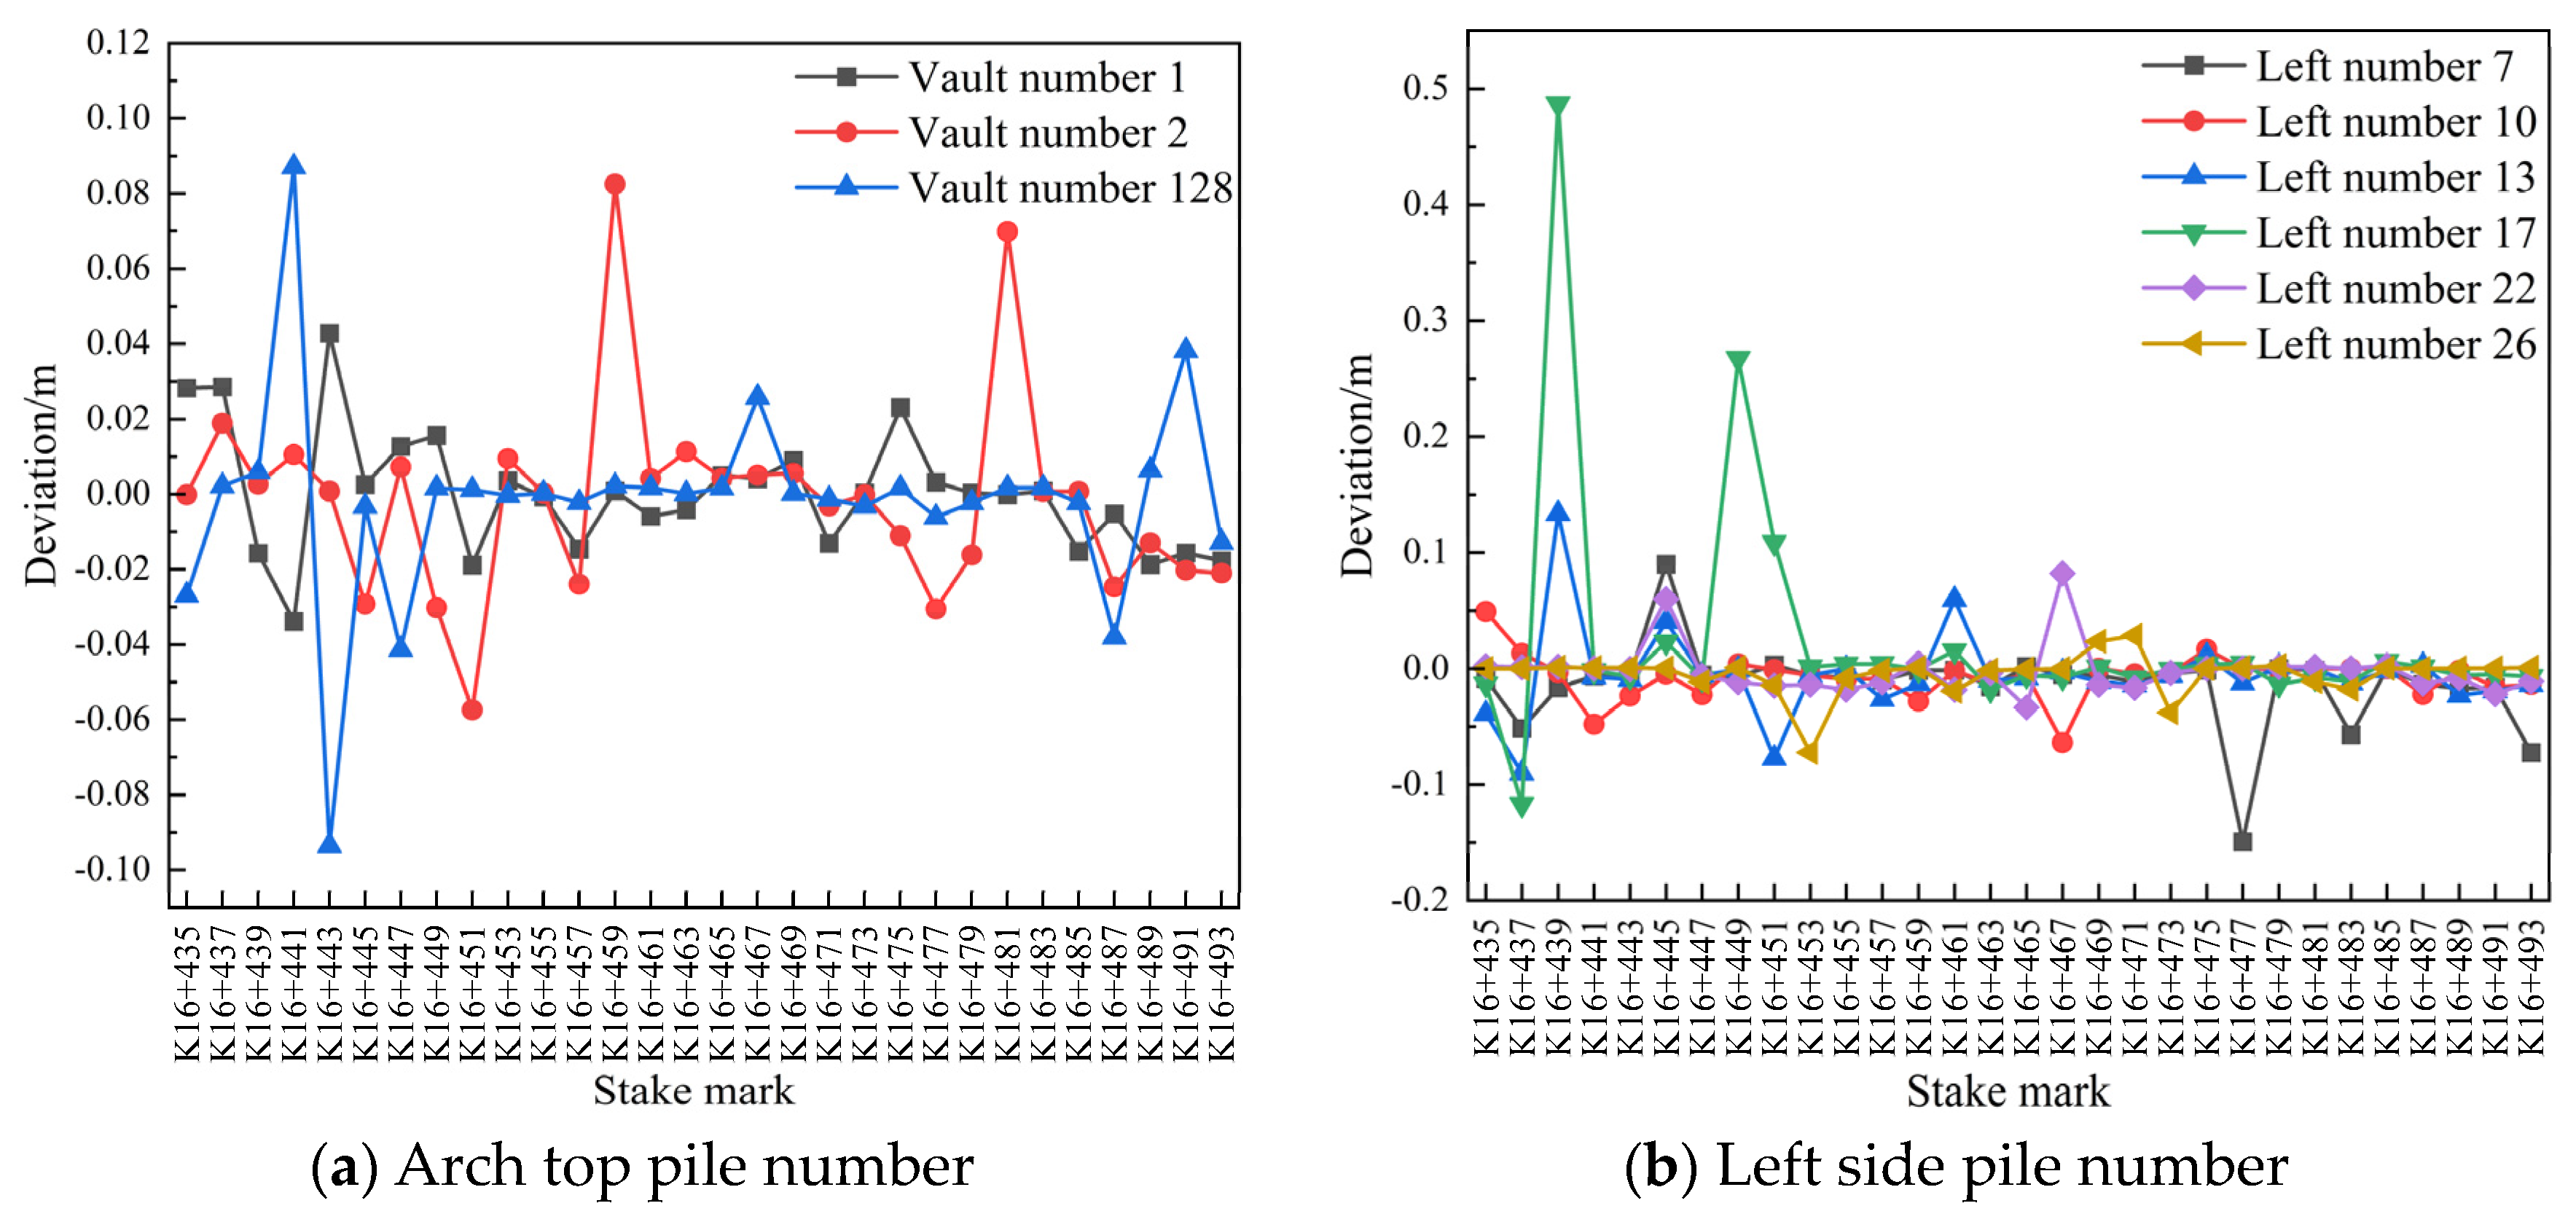
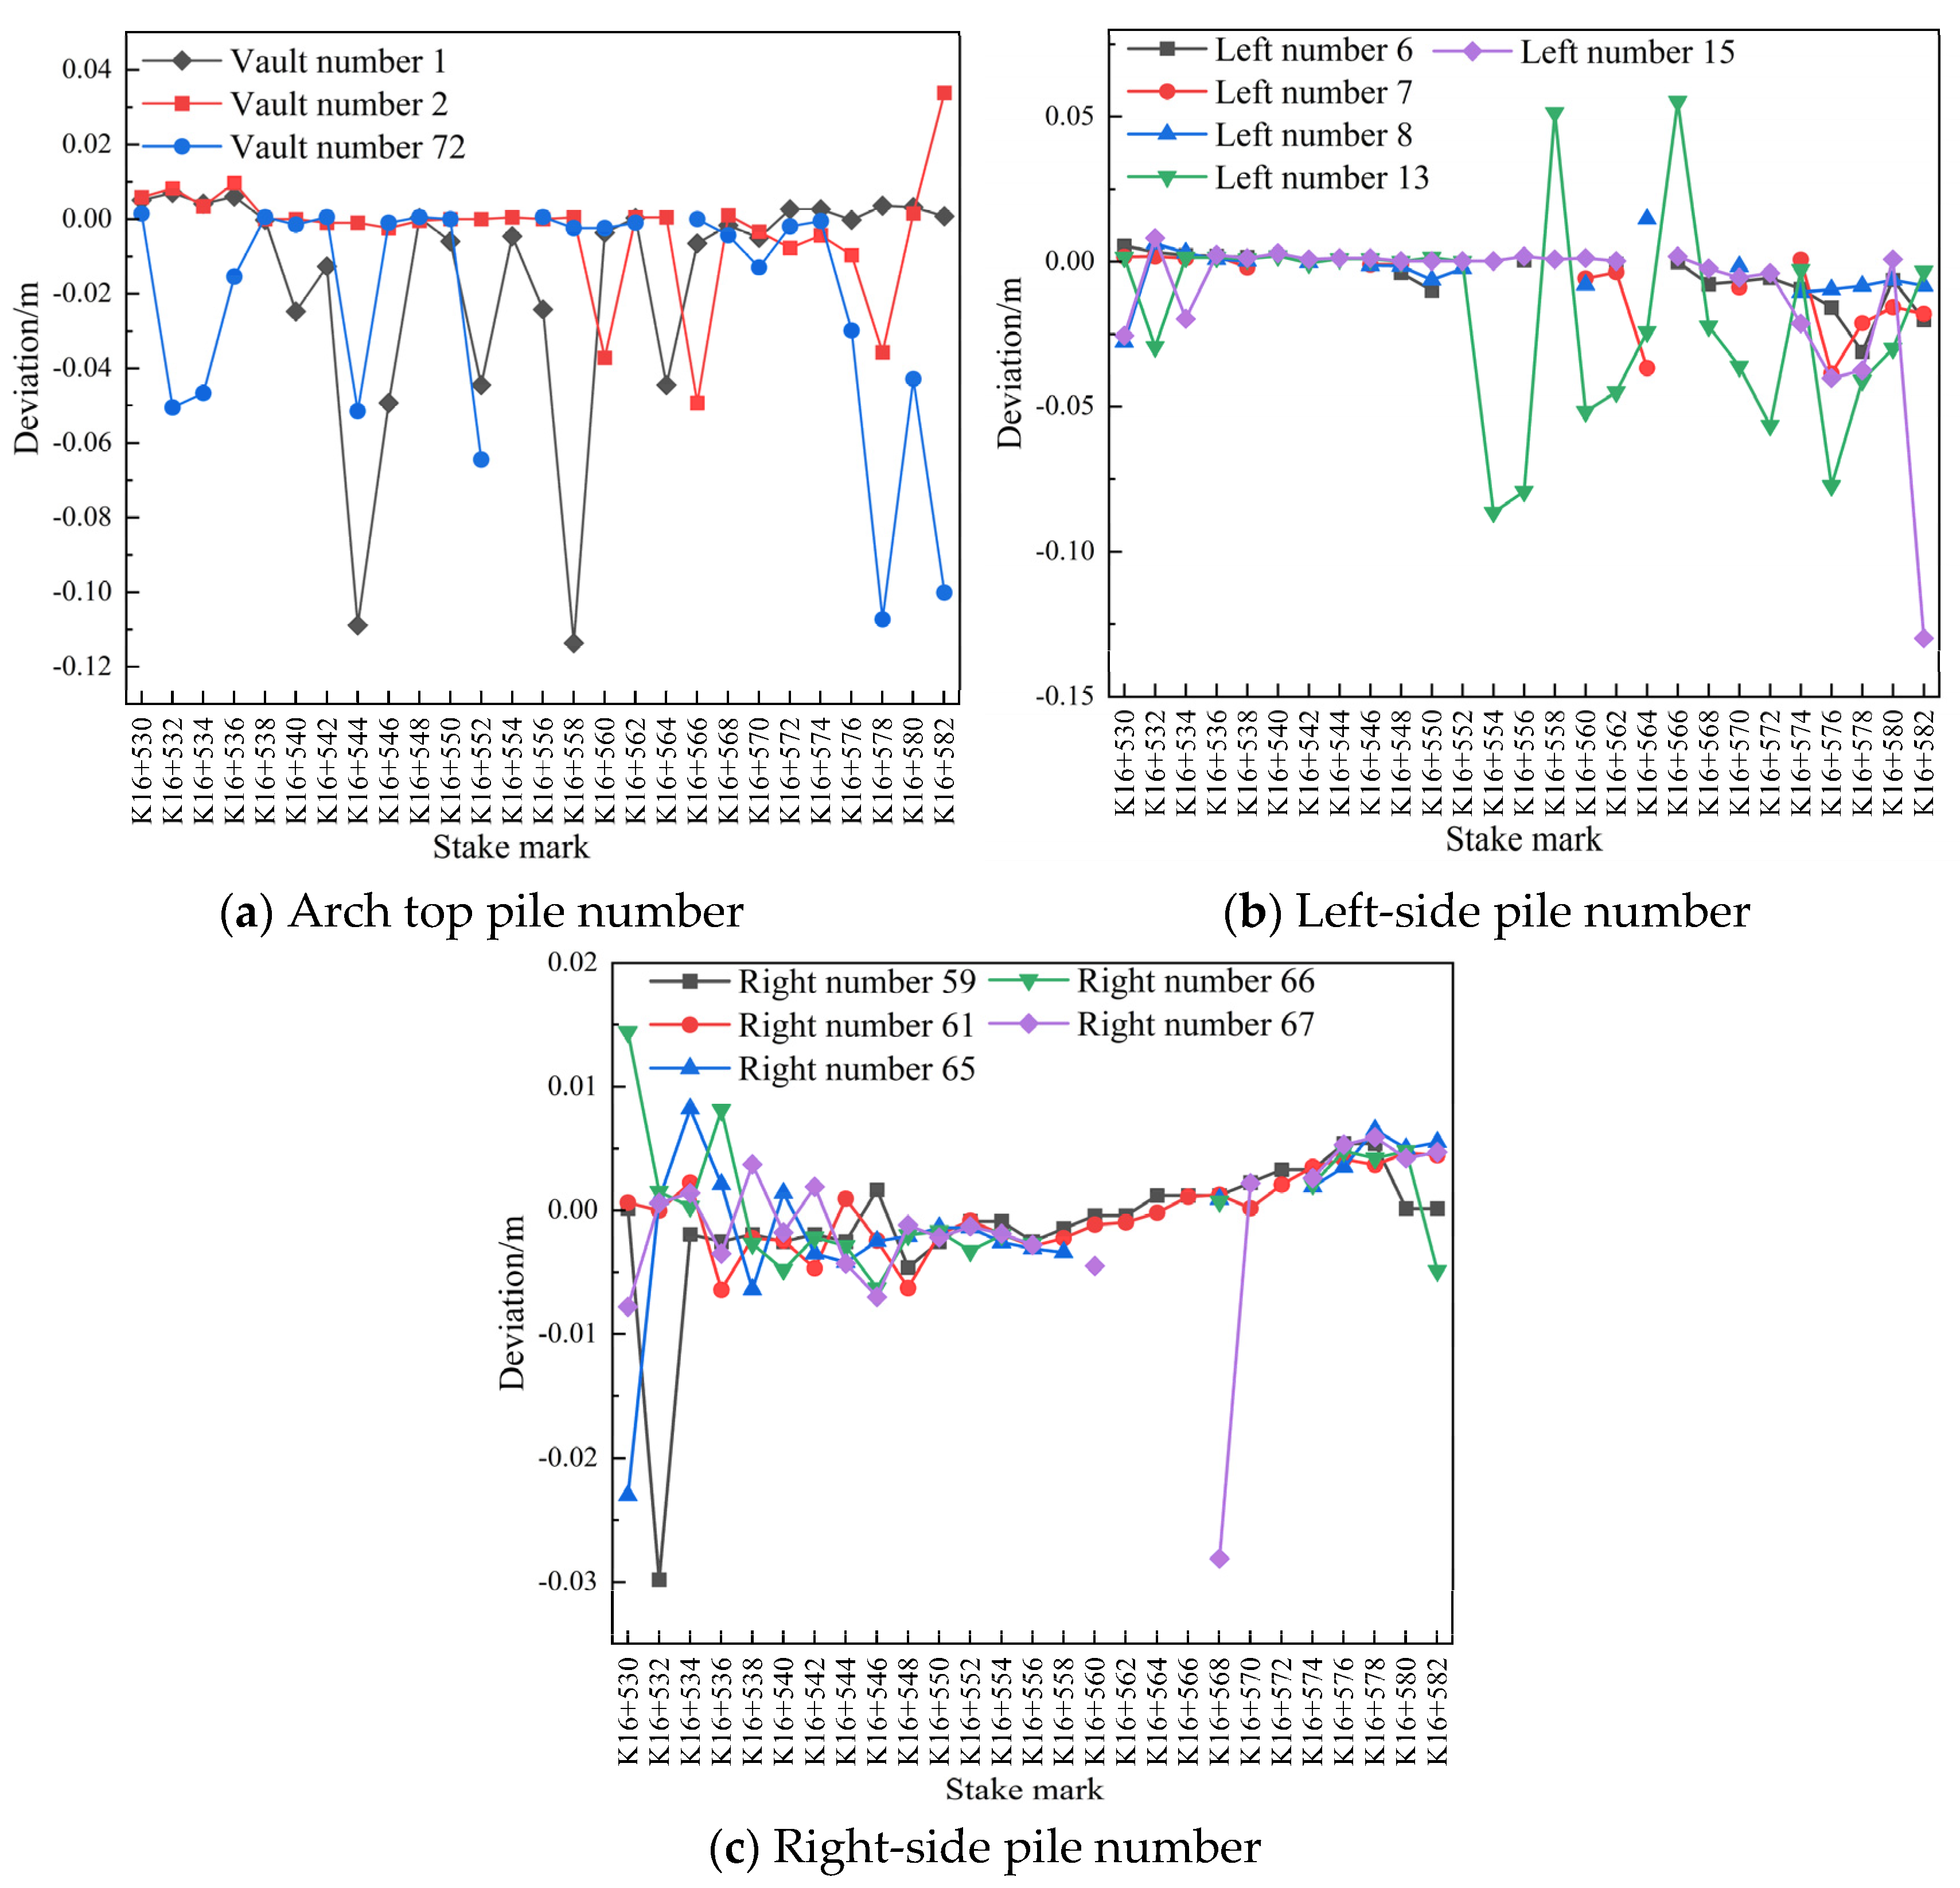
- Comparison of the surrounding rock settlement and convergence at different measuring points and for different pile numbers
- (3)
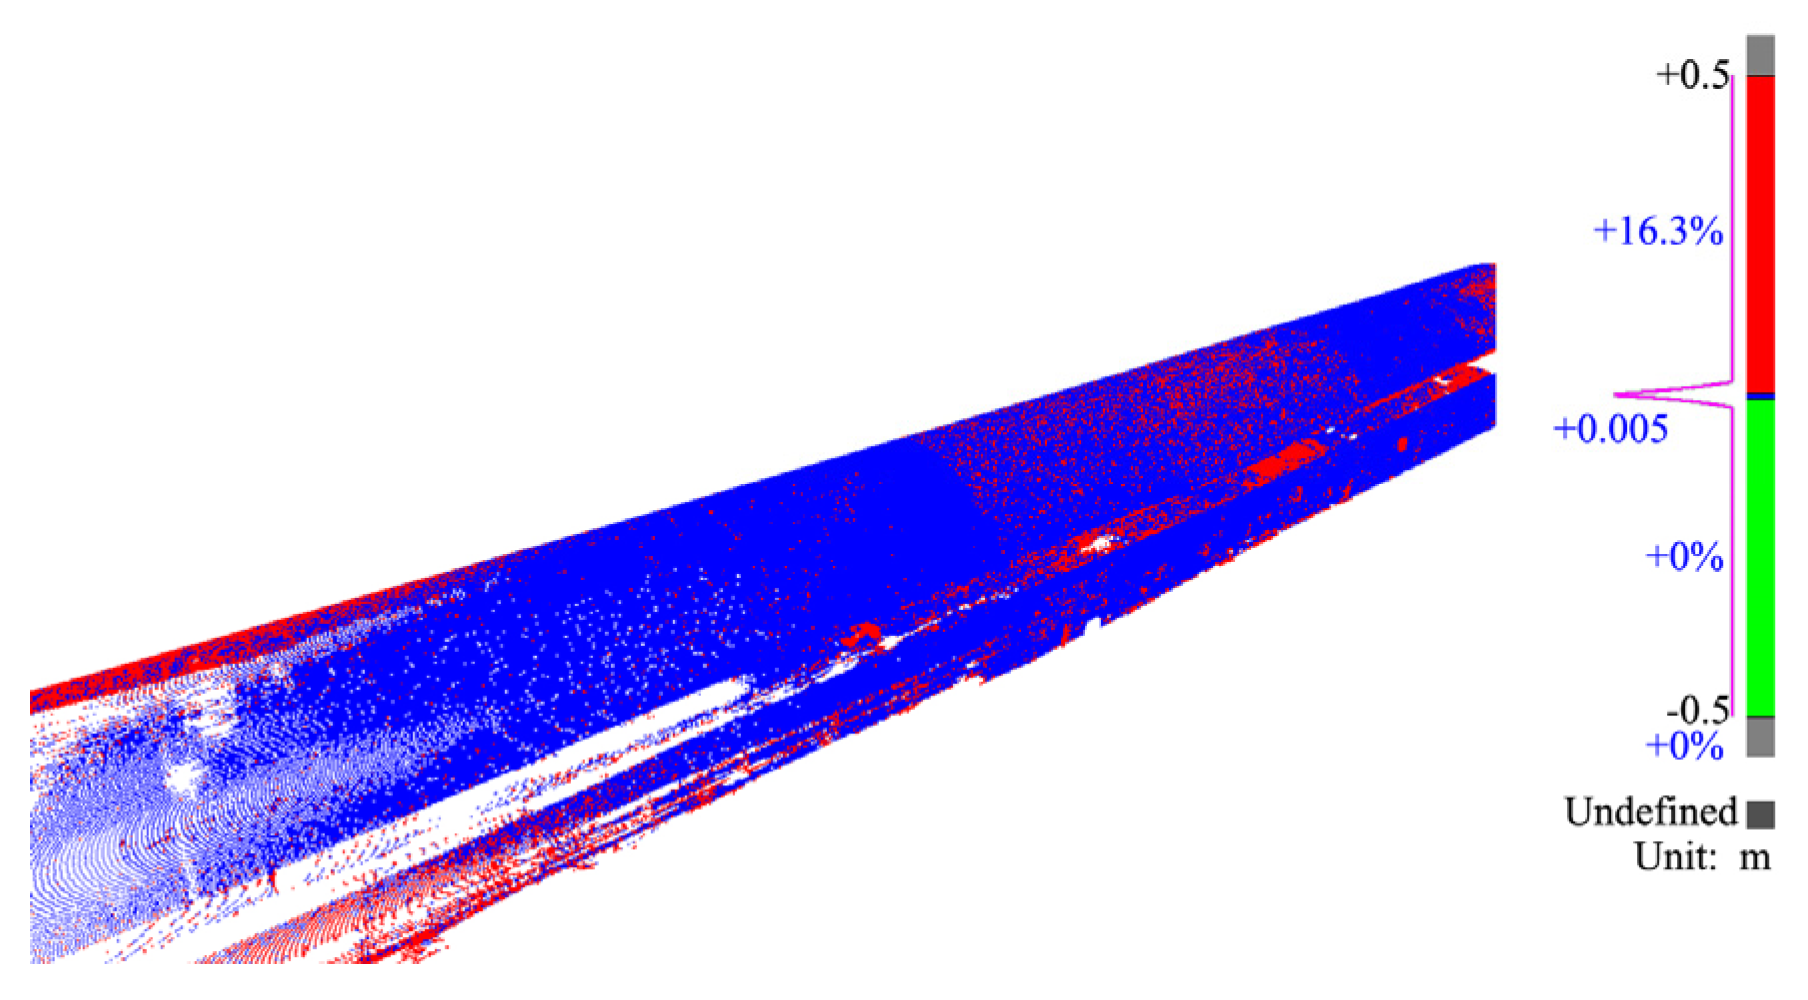
- Chromatographic analysis
- (4)
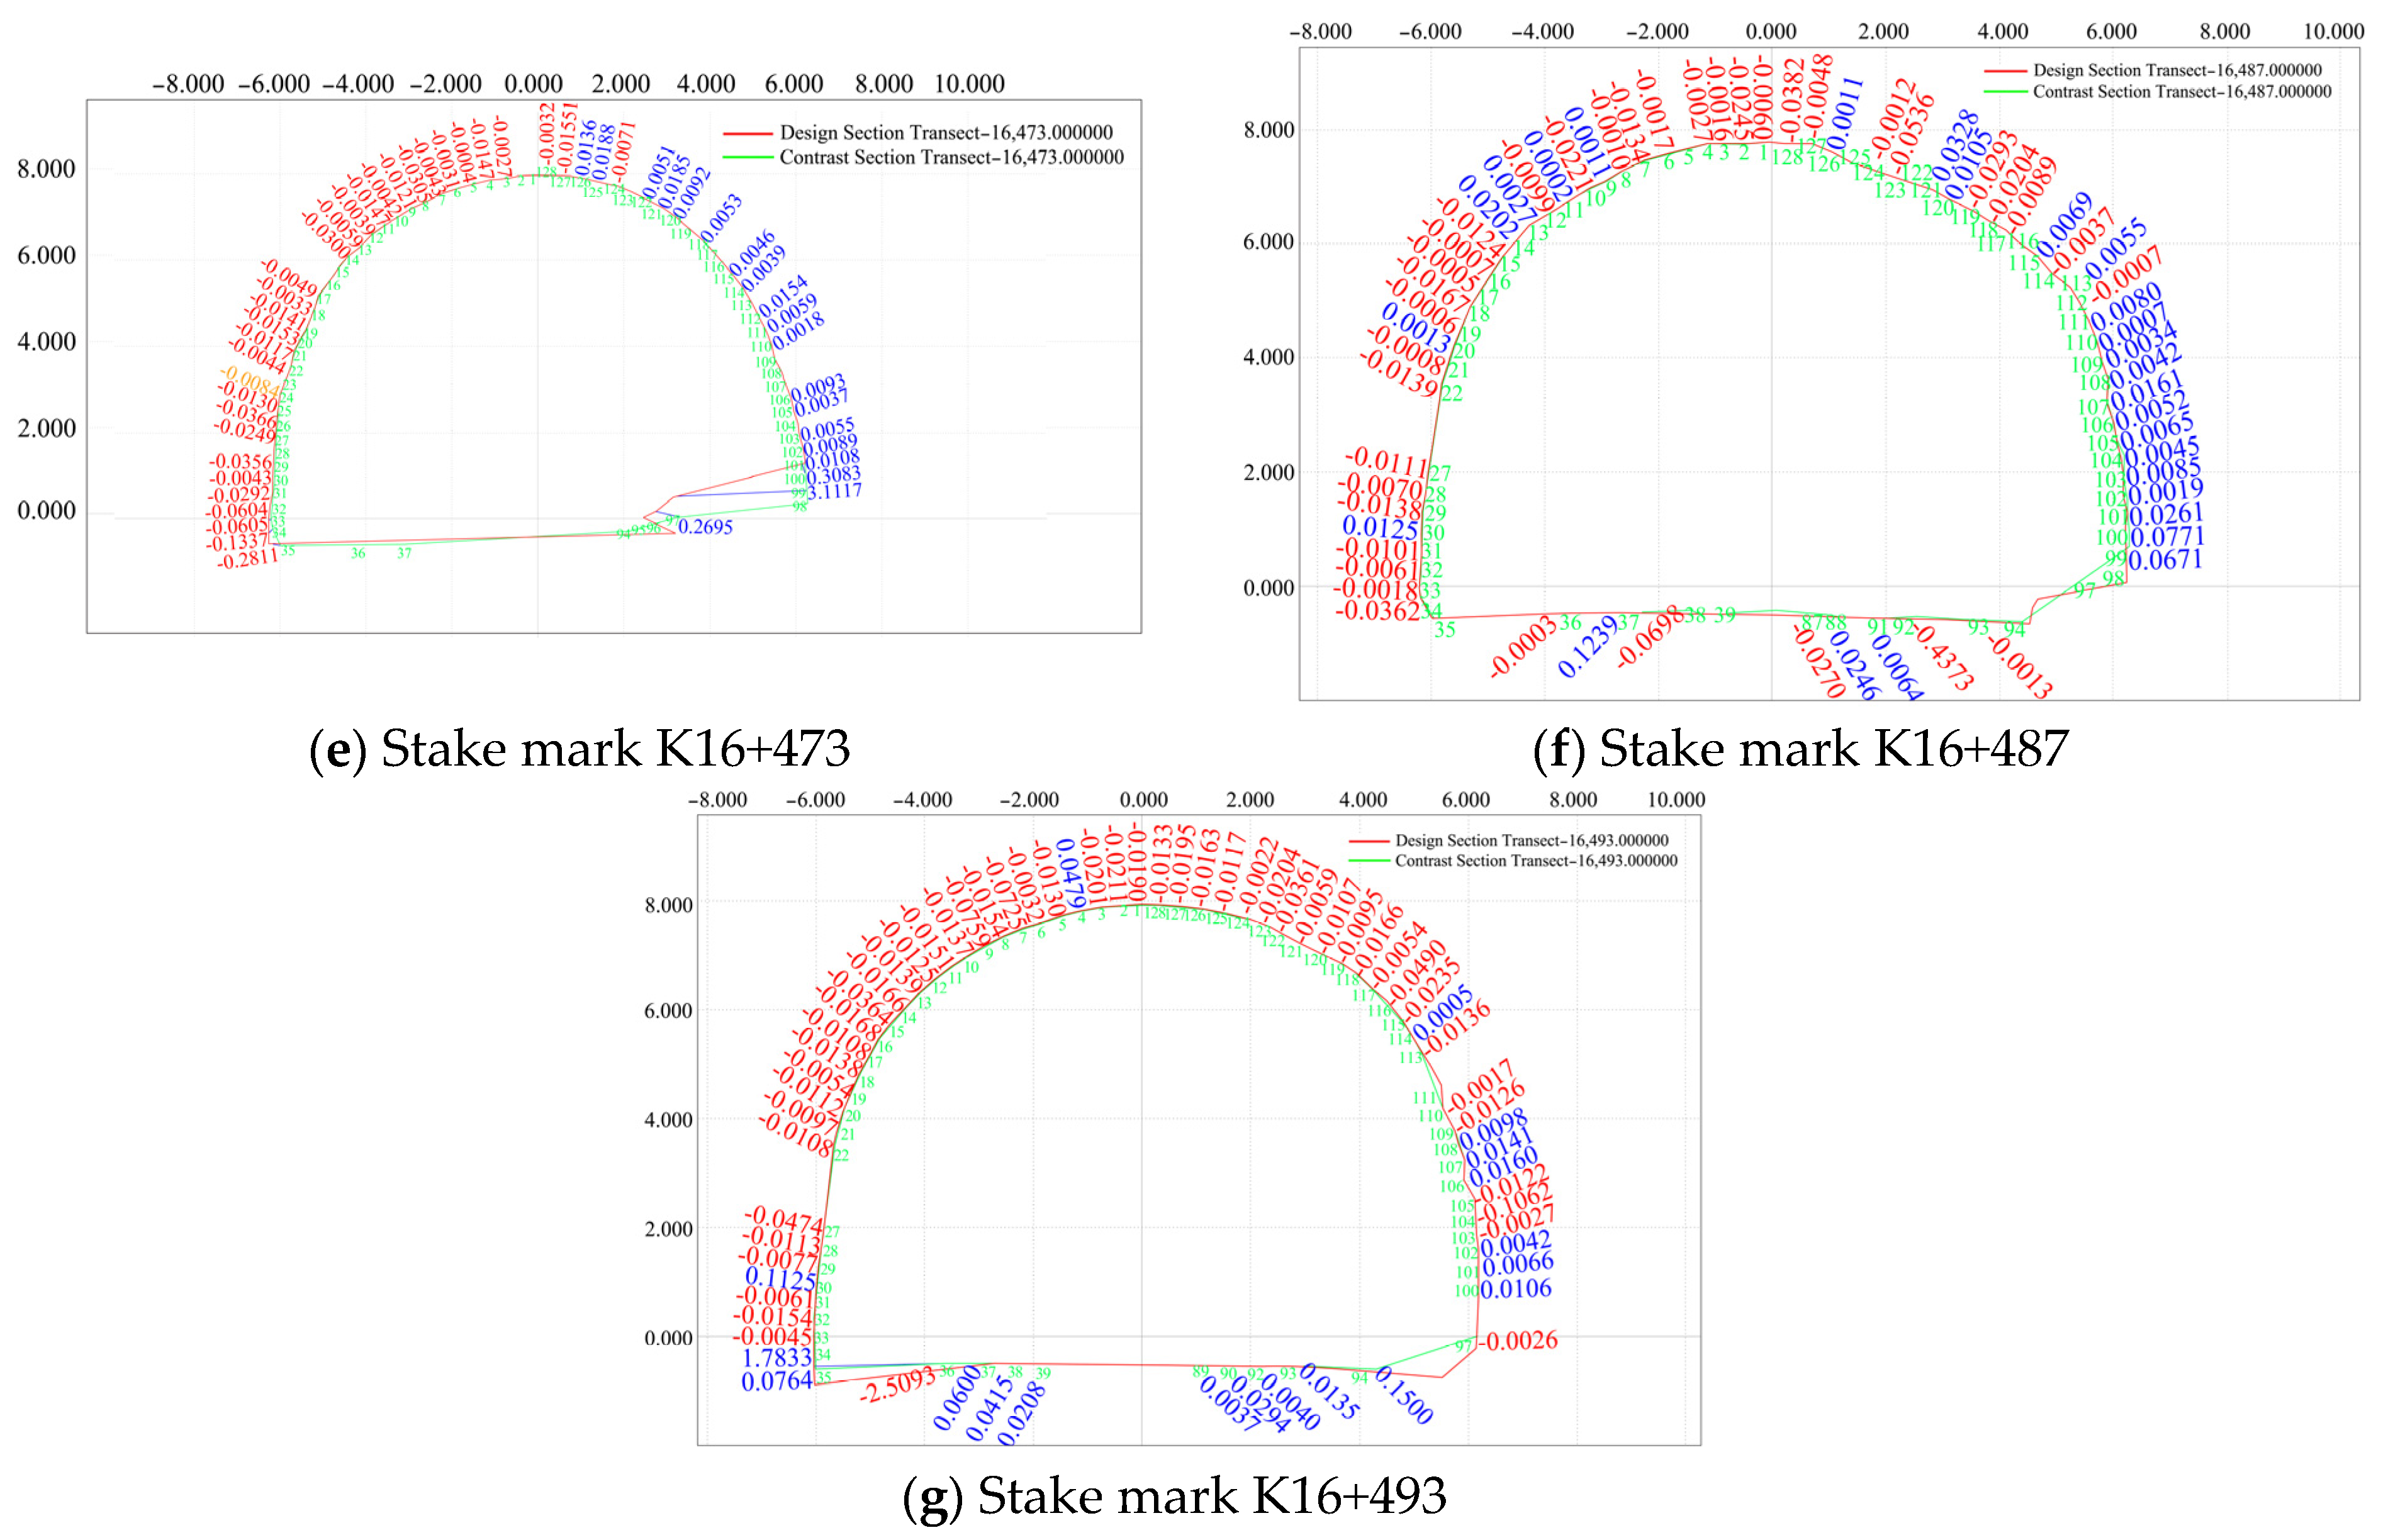
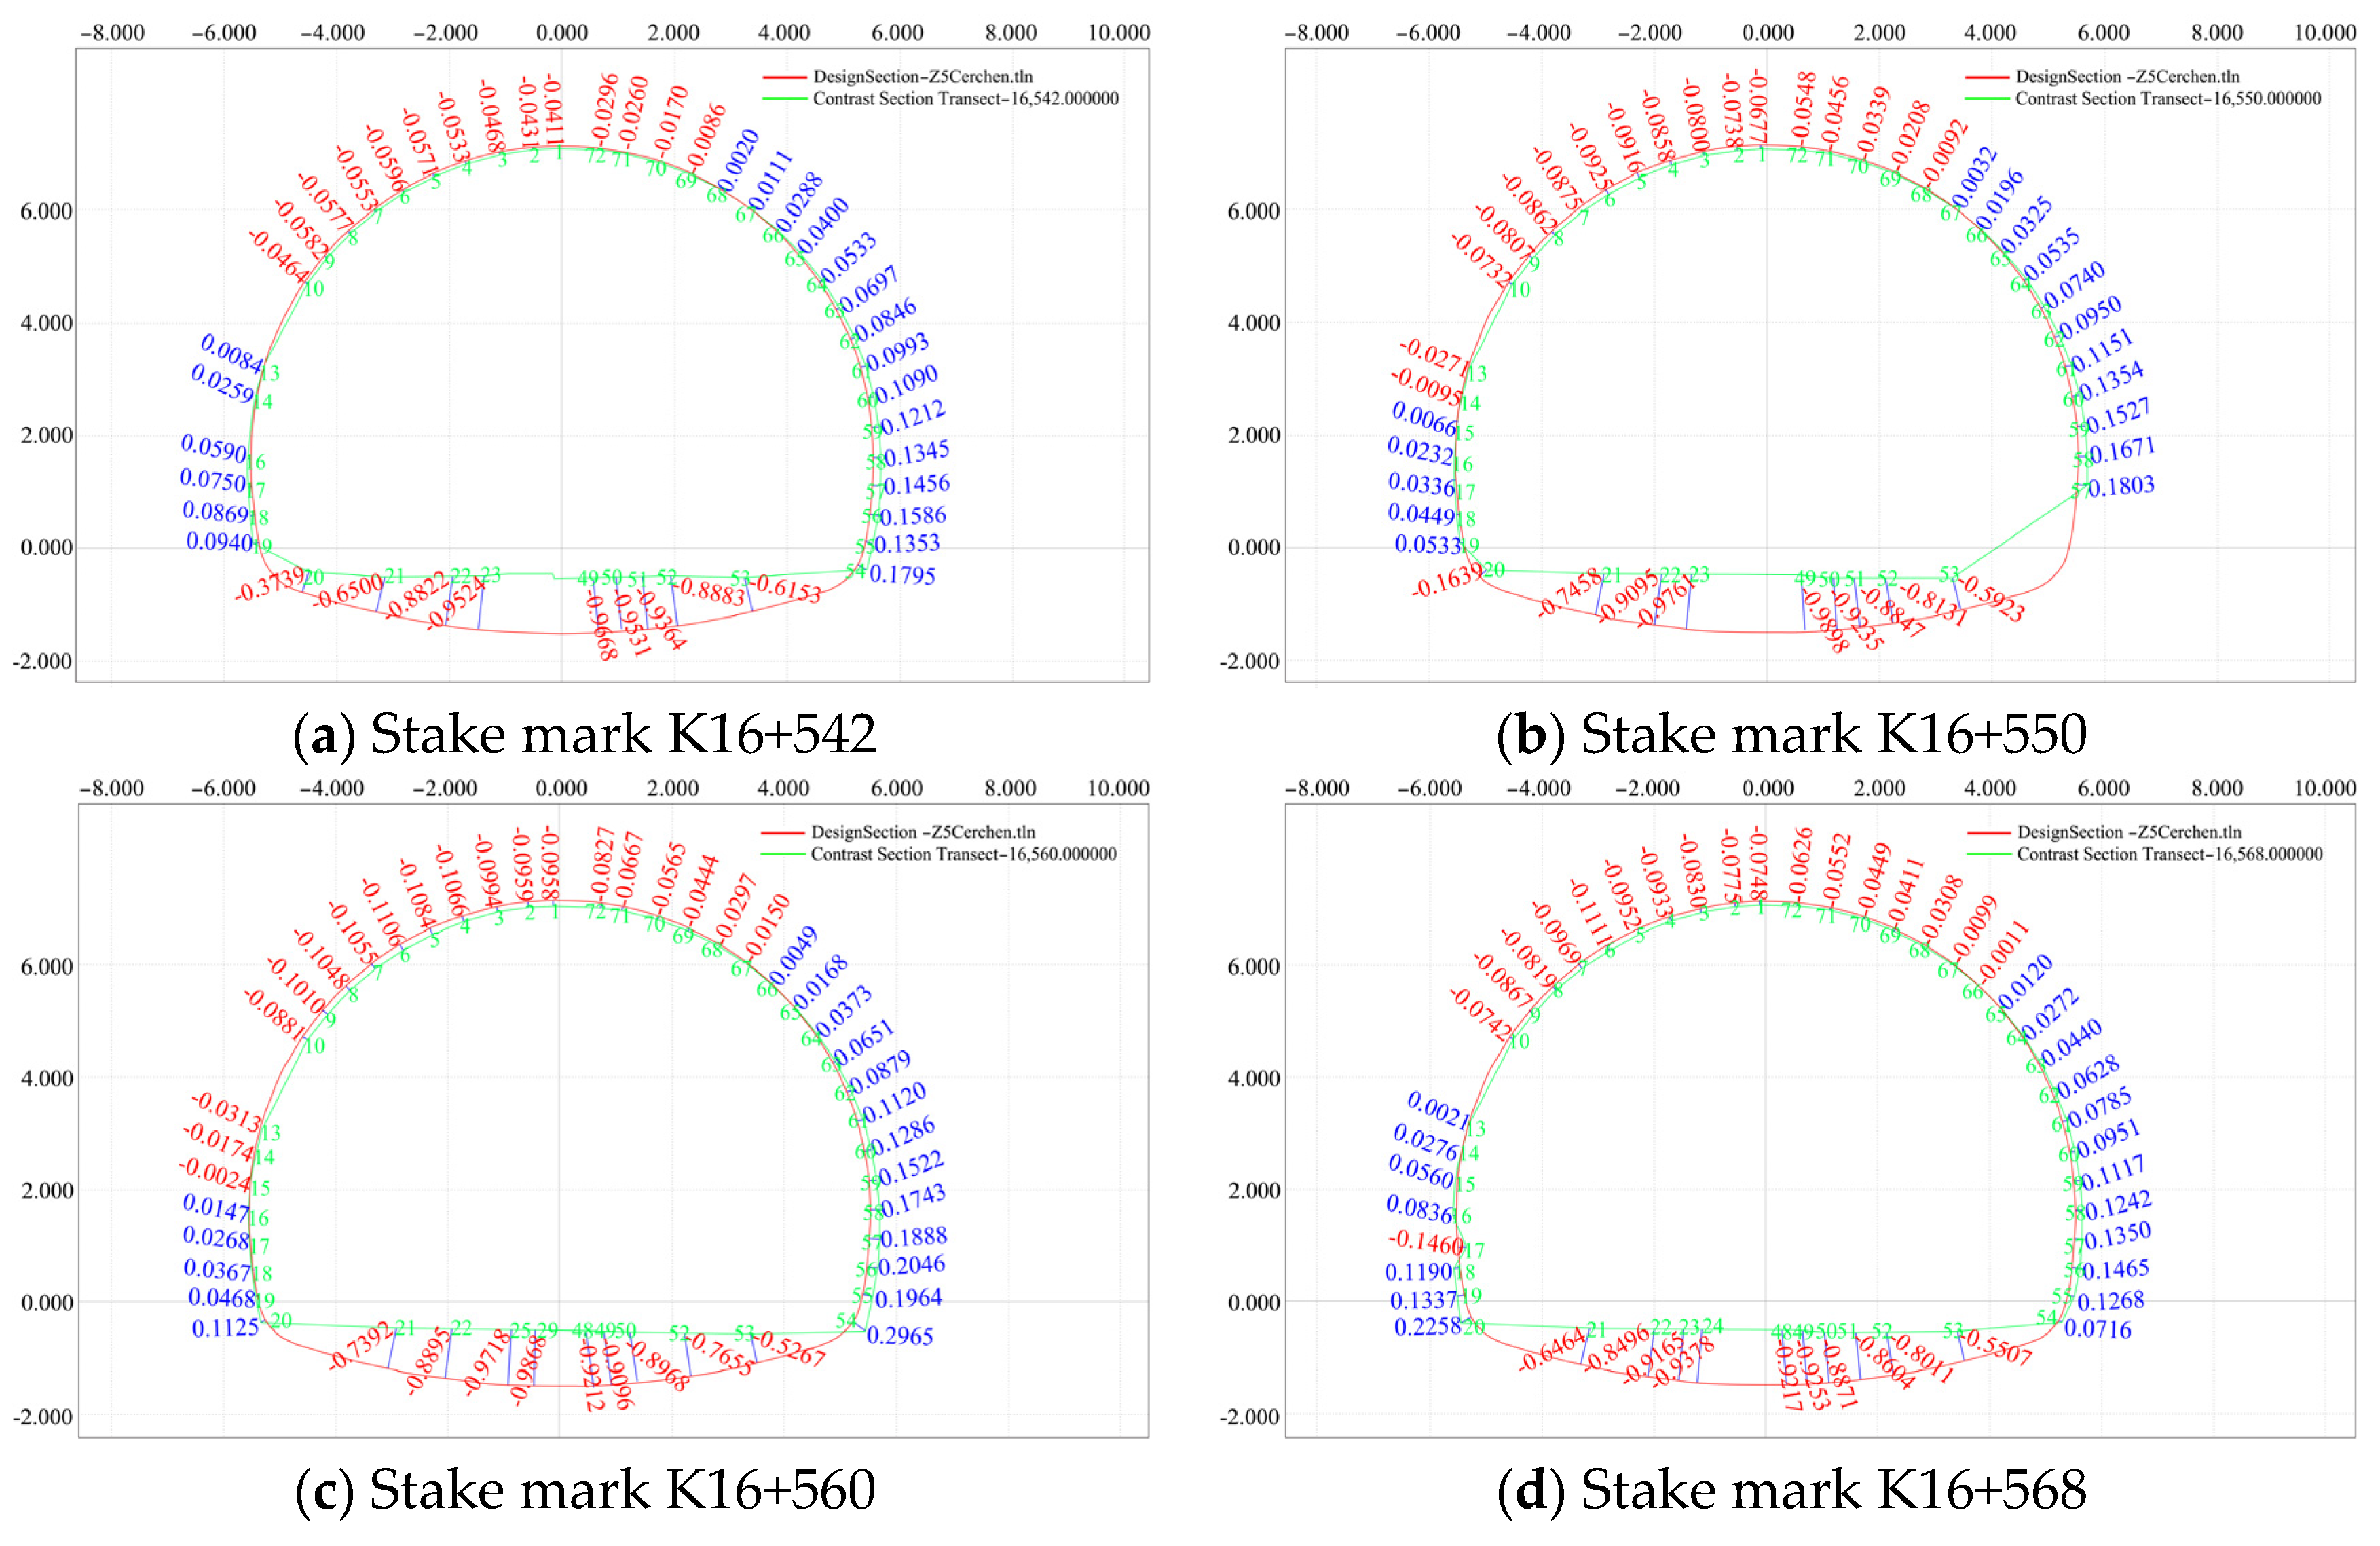
- Comparison analysis between the design of the secondary lining and the actual section on 31 July 2020
5. Discussion
6. Conclusions
- (1)
- The monitoring results of the tunnel section indicate that the distance between the first branch and secondary lining was from the inside to the outside and that the deformation of the surrounding rock exhibited a tendency for small deformations toward the right side. At different measuring points and with different pile numbers, the settlement at individual mileages of the vault was large but tended to become stable within a certain time range. Except for a few points, the deformation of the left and right sides did not exceed 0.02 m.
- (2)
- A comparison of the actual and designed sections of the first branch and the secondary lining showed that the surrounding rock arch had a downward settlement trend and that the deformation on both sides of the surrounding rock intruded into the rock mass. The actual elevation of the first branch arch (<0.3 m) was greater than the designed elevation. The actual monitoring and designed values of the secondary lining of the arch of the tunnel also showed a tendency for downward settlement at the different measuring points of each mileage.
- (3)
- Based on the chromatographic analysis conducted on the initial branch section, it is evident that the deformation deviation of the majority of points falls within a narrow range of 0.01 m, indicating a relatively stable condition. Only a handful of points exhibit slightly larger deformation deviations. Conversely, in the secondary lining section, the deformation deviation of most points is even more constrained, staying within the range of 0.005 m, signifying an overall stable structural state. Nevertheless, it is noteworthy that certain points still surpass the threshold value of 0.005 m. Therefore, during subsequent monitoring and maintenance activities, special attention should be paid to these threshold-exceeding points to ensure the integrity and safety of the structure.
Author Contributions
Funding
Institutional Review Board Statement
Informed Consent Statement
Data Availability Statement
Conflicts of Interest
References
- Peiqing, L.U.; Chao, T. Application of mobile 3D laser scanning technology in deformation monitoring of subway tunnels. Bull. Surv. Mapp. 2020, 155–157. [Google Scholar] [CrossRef]
- Jia, D.; Zhang, W.; Liu, Y. Systematic approach for tunnel deformation monitoring with terrestrial laser scanning. Remote Sens. 2021, 13, 3519. [Google Scholar] [CrossRef]
- Han, Y.; Sun, H.; Zhong, R. Three-dimensional linear restoration of a tunnel based on measured track and uncontrolled mobile laser scanning. Sensors 2021, 21, 3815. [Google Scholar] [CrossRef] [PubMed]
- Liu, H.; Shi, J.; Li, J.; Liu, C. Investigation on the influence caused by shield tunneling: WSN monitoring and numerical simulation. Adv. Civ. Eng. 2021, 2021, 6620706. [Google Scholar] [CrossRef]
- Wang, X.; Wang, M.; Jiang, R.; Xu, J.; Li, B.; Wang, X.; Yu, J.; Su, P.; Liu, C.; Yang, Q.; et al. Structural deformation monitoring during tunnel construction: A review. J. Civ. Struct. Health Monit. 2023, 1–23. [Google Scholar] [CrossRef]
- Mukupa, W.; Roberts, G.W.; Hancock, C.M.; Al-Manasir, K. A review of the use of terrestrial laser scanning application for change detection and deformation monitoring of structures. Surv. Rev. 2017, 49, 99–116. [Google Scholar] [CrossRef]
- Telling, J.; Lyda, A.; Hartzell, P.; Glennie, C. Review of Earth science research using terrestrial laser scanning. Earth-Sci. Rev. 2017, 169, 35–68. [Google Scholar] [CrossRef]
- Zhang, Z.; Yin, T.; Huang, X.; Zhang, F. An automatic data processing method for deformation analysis and visualization of tunnel cross sections using laser scanning data. In Proceedings of the GeoShanghai 2018 International Conference: Multi-Physics Processes in Soil Mechanics and Advances in Geotechnical Testing, Shanghai, China, 27–30 May 2018; Springer: Singapore, 2018; pp. 436–448. [Google Scholar]
- Cacciari, P.P.; Futai, M.M. Modeling a shallow rock tunnel using terrestrial laser scanning and discrete fracture networks. Rock. Mech. Rock. Eng. 2017, 50, 1217–1242. [Google Scholar] [CrossRef]
- Farahani, B.V.; Barros, F.; Sousa, P.J.; Tavares, P.J.; Moreira, P.M. A railway tunnel structural monitoring methodology proposal for predictive maintenance. Struct. Control Health Monit. 2020, 27, e2587. [Google Scholar] [CrossRef]
- Sun, H.; Liu, S.; Zhong, R.; Du, L. Cross-section deformation analysis and visualization of shield tunnel based on mobile tunnel monitoring system. Sensors 2020, 20, 1006. [Google Scholar] [CrossRef]
- Wang, Q.; Qian, P.; Liu, Y.; Li, T.; Yang, L.; Yang, F. Geometric Accuracy Evaluation Method for Subway Stations Based on 3D Laser Scanning. Appl. Sci. 2022, 12, 9535. [Google Scholar] [CrossRef]
- Chang, L.; Niu, X.; Liu, T. GNSS/IMU/ODO/LiDAR-SLAM integrated navigation system using IMU/ODO pre-integration. Sensors 2020, 20, 4702. [Google Scholar] [CrossRef]
- He, L.; Jin, Z.; Gao, Z. De-skewing lidar scan for refinement of local mapping. Sensors 2020, 20, 1846. [Google Scholar] [CrossRef] [PubMed]
- Mirzaei, K.; Arashpour, M.; Asadi, E.; Masoumi, H.; Bai, Y.; Behnood, A. 3D point cloud data processing with machine learning for construction and infrastructure applications: A comprehensive review. Adv. Eng. Inf. 2022, 51, 101501. [Google Scholar] [CrossRef]
- Yan, Y.; Hajjar, J.F. Automated extraction of structural elements in steel girder bridges from laser point clouds. Autom. Constr. 2021, 125, 103582. [Google Scholar] [CrossRef]
- Jia, S.; Liu, C.; Guan, X.; Wu, H.; Zeng, D.; Guo, J. Bidirectional interaction between BIM and construction processes using a multisource geospatial data enabled point cloud model. Autom. Constr. 2022, 134, 104096. [Google Scholar] [CrossRef]
- Reja, V.K.; Varghese, K.; Ha, Q.P. Computer vision-based construction progress monitoring. Autom. Constr. 2022, 138, 104245. [Google Scholar] [CrossRef]
- Angjeliu, G.; Cardani, G.; Coronelli, D. A parametric model for ribbed masonry vaults. Autom. Constr. 2019, 105, 102785. [Google Scholar] [CrossRef]
- Bassier, M.; Hadjidemetriou, G.; Vergauwen, M.; Van Roy, N.; Verstrynge, E. Implementation of scan-to-BIM and FEM for the documentation and analysis of heritage timber roof structures. In Digital Heritage. Progress in Cultural Heritage: Documentation, Preservation, and Protection: 6th International Conference, EuroMed 2016, Nicosia, Cyprus, 31 October–5 November 2016, Proceedings, Part I 6; Springer International Publishing: Cham, Switzerland, 2016; pp. 79–90. [Google Scholar]
- Angjeliu, G.; Coronelli, D.; Cardani, G. Development of the simulation model for Digital Twin applications in historical masonry buildings: The integration between numerical and experimental reality. Comput. Struct. 2020, 238, 106282. [Google Scholar] [CrossRef]
- Liu, J.; Fu, L.; Cheng, G.; Li, D.; Zhou, J.; Cui, N.; Chen, Y.F. Automated BIM Reconstruction of Full-Scale Complex Tubular Engineering Structures Using Terrestrial Laser Scanning. Remote Sens. 2022, 14, 1659. [Google Scholar] [CrossRef]
- Stepinac, M.; Lulić, L.; Ožić, K. The role of UAV and laser scanners in the post-earthquake assessment of heritage buildings after the 2020 earthquakes in Croatia. In Advanced Nondestructive and Structural Techniques for Diagnosis, Redesign and Health Monitoring for the Preservation of Cultural Heritage: Selected work from the TMM-CH 2021; Springer International Publishing: Cham, Switzerland, 2022; pp. 167–177. [Google Scholar]
- Bae, J.; Lee, J.; Jang, A.; Ju, Y.K.; Park, M.J. SMART SKY Eye system for preliminary structural safety assessment of buildings using unmanned aerial vehicles. Sensors 2022, 22, 2762. [Google Scholar] [CrossRef]
- Wu, Y.; Zhou, Z.; Shao, S.; Zhao, Z.; Hu, K.; Wang, S. Monitoring and Analysis of Deformation Refinement Characteristics of a Loess Tunnel Based on 3D Laser Scanning Technology. Appl. Sci. 2022, 12, 5136. [Google Scholar] [CrossRef]
- Li, Z.; Xiaoming, C.; Shengliang, Z. Application of mobile 3D laser scanning technology in tunnel structure monitoring. Bull. Surv. Mapp. 2020, 153–156. [Google Scholar] [CrossRef]
- Ningning, Z.; Wei, W.; Yong, W. Research on application of structural deformation monitoring of metro tunnel based on 3D laser scanning technology. China Min. Mag. 2020, 29, 176–180. [Google Scholar]
- Jiang, Q.; Zhong, S.; Pan, P.Z.; Shi, Y.; Guo, H.; Kou, Y. Observe the temporal evolution of deep tunnel’s 3D deformation by 3D laser scanning in the Jinchuan No. 2 Mine. Tunn. Undergr. Space Technol. 2020, 97, 103237. [Google Scholar] [CrossRef]
- Kontogianni, V.A.; Stiros, S.C. Induced deformation during tunnel excavation: Evidence from geodetic monitoring. Eng. Geol. 2005, 79, 115–126. [Google Scholar] [CrossRef]
- Kontogianni, V.; Tzortzis, A.; Stiros, S. Deformation and failure of the Tymfristos tunnel, Greece. J. Geotech. Geoenviron. 2004, 130, 1004–1013. [Google Scholar] [CrossRef]
- Zhao, Y.; Zhu, Z.; Liu, W.; Zhan, J.; Wu, D. Application of 3D laser scanning on NATM tunnel deformation measurement during construction. Acta Geotech. 2023, 18, 483–494. [Google Scholar] [CrossRef]
- Wei, Z.; Wang, Y.; Weng, W.; Zhou, Z.; Li, Z. Research on Tunnel Construction Monitoring Method Based on 3D Laser Scanning Technology. Symmetry 2022, 14, 2065. [Google Scholar] [CrossRef]
- Han, J.Y.; Guo, J.; Jiang, Y.S. Monitoring tunnel profile by means of multi-epoch dispersed 3-D LiDAR point clouds. Tunn. Undergr. Space Technol. 2013, 33, 186–192. [Google Scholar] [CrossRef]
- Cheng, L.I.; Xiaoping, L.U.; Ningning, Z.H.U.; Yao, L.U.; Yongbin, W.U.; Guoqing, L.I. Continuously extracting section and deformation analysis for subway tunnel based on LIDAR points. Acta Geod. Cartogr. Sin. 2015, 44, 1056. [Google Scholar]
- Van Gosliga, R.; Lindenbergh, R.; Pfeifer, N. Deformation Analysis of a Bored Tunnel by Means of Terrestrial Laser Scanning. In Image Engineering and Vision Metrology; International Archives of Photogrammetry, Remote Sensing and Spatial Information Systems: Dresden, Germany, 2006; pp. 25–27. [Google Scholar]
- Ningning, Z. Application of 3D Laser Scanning to The Subway Tunnel Deformation Monitoring. Eng. Surv. Mapp. 2015, 24, 63–68. [Google Scholar]
- Lindenbergh, R.; Pfeifer, N.; Rabbani, T. Accuracy analysis of the Leica HDS3000 and feasibility of tunnel deformation monitoring. In Proceedings of the ISPRS Workshop, Laser Scanning, Enschede, The Netherlands, 12–14 September 2005; Volume 36, p. 3. [Google Scholar]
- Walton, G.; Delaloye, D.; Diederichs, M.S. Development of an elliptical fitting algorithm to improve change detection capabilities with applications for deformation monitoring in circular tunnels and shafts. Tunn. Undergr. Space Technol. 2014, 43, 336–349. [Google Scholar] [CrossRef]
- Jian, L.; Wan, Y.; Jiang, M. Tunnel deformation monitoring based on the terrestrial laser scanning technology. Geospat. Inf. 2012, 10, 14–17. [Google Scholar]
- Xie, X.; Lu, X. Development of a 3D modeling algorithm for tunnel deformation monitoring based on terrestrial laser scanning. Undergr. Space 2017, 2, 16–29. [Google Scholar] [CrossRef]
- Hu, D.; Li, Y.; Yang, X.; Liang, X.; Zhang, K.; Liang, X. Experiment and Application of NATM Tunnel Deformation Monitoring Based on 3D Laser Scanning. Struct. Control Health Monit. 2023, 2023, 3341788. [Google Scholar] [CrossRef]
- Ma, D.L.; Cui, J.; Wang, S.Y. Application and research of 3D laser scanning technology in steel structure installation and deformation monitoring. Appl. Mech. Mater. 2014, 580, 2838–2841. [Google Scholar] [CrossRef]
- Wan, C.H.; He, X.P. Tunnel monitoring method based on 3D laser scanning technology. In Proceedings of the 2016 International Conference on Computational Modeling, Simulation and Applied Mathematics, Beijing, China, 28–29 May 2016; pp. 110–114. [Google Scholar]
- Liu, C.; Liu, Y.; Chen, Y.; Zhao, C.; Qiu, J.; Wu, D.; Liu, T.; Fan, H.; Qin, Y.; Tang, K. A state-of-the-practice review of three-dimensional laser scanning technology for tunnel distress monitoring. J. Perform. Constr. Fac. 2023, 37, 03123001. [Google Scholar] [CrossRef]


| Comparative Item | Traditional Measurement Method | Three-Dimensional Laser Scanning Technique |
|---|---|---|
| Tool | Tape measure; laser rangefinder; total station; drawing | Three-dimensional laser scanner |
| Measurement mode | Contacting, close measurement; light affected | Completely non-contact; Remote measurement; not affected by light; works day and night |
| Field drawing manuscript | Need | No need; automatically generates 3D data |
| Measurement efficiency | Low efficiency; only the distance from point to point can be measured; high labor intensity | Fast sampling rate; single-station panoramic scan in 1 min |
| Degree of safety | High risk factor; great limitation | Non-contact measurement; ensures personnel safety |
| Scanned Area | Scanning Speed | Resolution Ratio | Precision | ||
|---|---|---|---|---|---|
| Angular Precision | Ranging Precision | Range Noise | |||
| 0.5 m–50 m | 1,000,000 points/s | 3.1 mm @ 10 m | 18″ | 1 mm + 10 ppm | 0.4 mm @ 10 m |
| Constraint ID | ScanWorld | ScanWorld | Type | Status | Weight | Overlap Points | Error (m) | Error Vector (m) |
|---|---|---|---|---|---|---|---|---|
| 1 | Job 007-Setup 001 | Job 007-Setup 002 | Coincident: Vertex-Vertex | On | 1.0000 | n/a | 0.002 | (−0.001, 0.000, 0.001) |
| 7 | Job 007-Setup 001 | Job 007-Setup 002 | Coincident: Vertex-Vertex | On | 1.0000 | n/a | 0.001 | (−0.001, 0.000, −0.001) |
| 1 | Job 007-Setup 001 | 20200729kzd.txt (Leveled) | Coincident: Vertex-Vertex | On | 1.0000 | n/a | 0.002 | (−0.002, −0.001, 0.001) |
| 3 | Job 007-Setup 001 | 20200729kzd.txt (Leveled) | Coincident: Vertex-Vertex | On | 1.0000 | n/a | 0.002 | (0.002, −0.001, 0.001) |
| 4 | Job 007-Setup 001 | 20200729kzd.txt (Leveled) | Coincident: Vertex-Vertex | On | 1.0000 | n/a | 0.002 | (0.002, 0.000, 0.001) |
| 7 | Job 007-Setup 001 | 20200729kzd.txt (Leveled) | Coincident: Vertex-Vertex | On | 1.0000 | n/a | 0.001 | (0.001, 0.001, 0.001) |
| 6 | Job 007-Setup 002 | 20200729kzd.txt (Leveled) | Coincident: Vertex-Vertex | On | 1.0000 | n/a | 0.002 | (−0.002, −0.001, −0.001) |
| 7 | Job 007-Setup 002 | 20200729kzd.txt (Leveled) | Coincident: Vertex-Vertex | On | 1.0000 | n/a | 0.002 | (0.001, 0.001, 0.001) |
| 1 | Job 007-Setup 002 | 20200729kzd.txt (Leveled) | Coincident: Vertex-Vertex | On | 1.0000 | n/a | 0.002 | (−0.001, −0.001, −0.001) |
| 5 | Job 007-Setup 002 | 20200729kzd.txt (Leveled) | Coincident: Vertex-Vertex | On | 1.0000 | n/a | 0.003 | (−0.001, 0.002, 0.001) |
Disclaimer/Publisher’s Note: The statements, opinions and data contained in all publications are solely those of the individual author(s) and contributor(s) and not of MDPI and/or the editor(s). MDPI and/or the editor(s) disclaim responsibility for any injury to people or property resulting from any ideas, methods, instructions or products referred to in the content. |
© 2024 by the authors. Licensee MDPI, Basel, Switzerland. This article is an open access article distributed under the terms and conditions of the Creative Commons Attribution (CC BY) license (https://creativecommons.org/licenses/by/4.0/).
Share and Cite
Tan, D.; Tao, Y.; Ji, B.; Gan, Q.; Guo, T. Full-Section Deformation Monitoring of High-Altitude Fault Tunnels Based on Three-Dimensional Laser Scanning Technology. Sensors 2024, 24, 2499. https://doi.org/10.3390/s24082499
Tan D, Tao Y, Ji B, Gan Q, Guo T. Full-Section Deformation Monitoring of High-Altitude Fault Tunnels Based on Three-Dimensional Laser Scanning Technology. Sensors. 2024; 24(8):2499. https://doi.org/10.3390/s24082499
Chicago/Turabian StyleTan, Dongmei, Yu Tao, Baifeng Ji, Qinlin Gan, and Tai Guo. 2024. "Full-Section Deformation Monitoring of High-Altitude Fault Tunnels Based on Three-Dimensional Laser Scanning Technology" Sensors 24, no. 8: 2499. https://doi.org/10.3390/s24082499
APA StyleTan, D., Tao, Y., Ji, B., Gan, Q., & Guo, T. (2024). Full-Section Deformation Monitoring of High-Altitude Fault Tunnels Based on Three-Dimensional Laser Scanning Technology. Sensors, 24(8), 2499. https://doi.org/10.3390/s24082499