Figure 1.
Diagram illustrating the interactions among solar radiation (), the Earth’s atmosphere, and the Earth’s surface. Initially, solar radiation penetrates the atmosphere and undergoes scattering and absorption by atmospheric particles and gases; represents the atmospheric effect response. The multispectral camera mounted on the UAV captures the reflected radiance (), which contains valuable information about the surface properties, such as the vegetation’s features.
Figure 2.
The proposed workflow in this paper for the NDVI evaluation incorporates the modeling of solar irradiation and atmospheric transmission under various conditions (including dry–clear and humid–hazy scenarios), vegetation reflection corresponding to both dry and fresh leaf states, as well as the performance of the camera sensor and digitization step.
Figure 3.
SSI measured by SIM at 1 AU (24 h average) 15 March 2018 00:00 Z to 24:00 Z [
43]. (
a) SSI over the 200 nm–2400 nm; (
b) SSI around the R band; (
c) SSI around the NIR band.
Figure 3.
SSI measured by SIM at 1 AU (24 h average) 15 March 2018 00:00 Z to 24:00 Z [
43]. (
a) SSI over the 200 nm–2400 nm; (
b) SSI around the R band; (
c) SSI around the NIR band.
Figure 4.
(
a) The atmospheric transmission in the spectral range of 500 nm–1000 nm is plotted for two conditions (dry–clear in red and humid–hazy in blue colors). This plot results from contributions to the overall transmission by mixed gases, aerosols, and water vapor, with data estimated from the paper [
18]. Accordingly, (
b) depicts the spectral wavelength around the R band, while (
c) shows the spectral wavelength around the NIR band.
Figure 5.
Solar irradiation is affected by two atmospheric conditions (dry–clear in red and humid–hazy in green colors), (a) in the R band and (b) in the NIR band.
Figure 5.
Solar irradiation is affected by two atmospheric conditions (dry–clear in red and humid–hazy in green colors), (a) in the R band and (b) in the NIR band.
Figure 6.
Spectral reflectance of dry and fresh vegetation. (a) In the wavelength range of 400 nm–980 nm, (b) in the R band with its fit curve, and (c) in the NIR band with its fitted curve.
Figure 6.
Spectral reflectance of dry and fresh vegetation. (a) In the wavelength range of 400 nm–980 nm, (b) in the R band with its fit curve, and (c) in the NIR band with its fitted curve.
Figure 7.
The spectral reflected irradiance of dry and fresh vegetation is affected by two atmospheric conditions (dry–clear and humid–hazy) in both (a) the R band and (b) the NIR band.
Figure 7.
The spectral reflected irradiance of dry and fresh vegetation is affected by two atmospheric conditions (dry–clear and humid–hazy) in both (a) the R band and (b) the NIR band.
Figure 8.
Sensitivity assessment of the workflow proposed in this paper through Monte Carlo analysis.
Figure 8.
Sensitivity assessment of the workflow proposed in this paper through Monte Carlo analysis.
Figure 9.
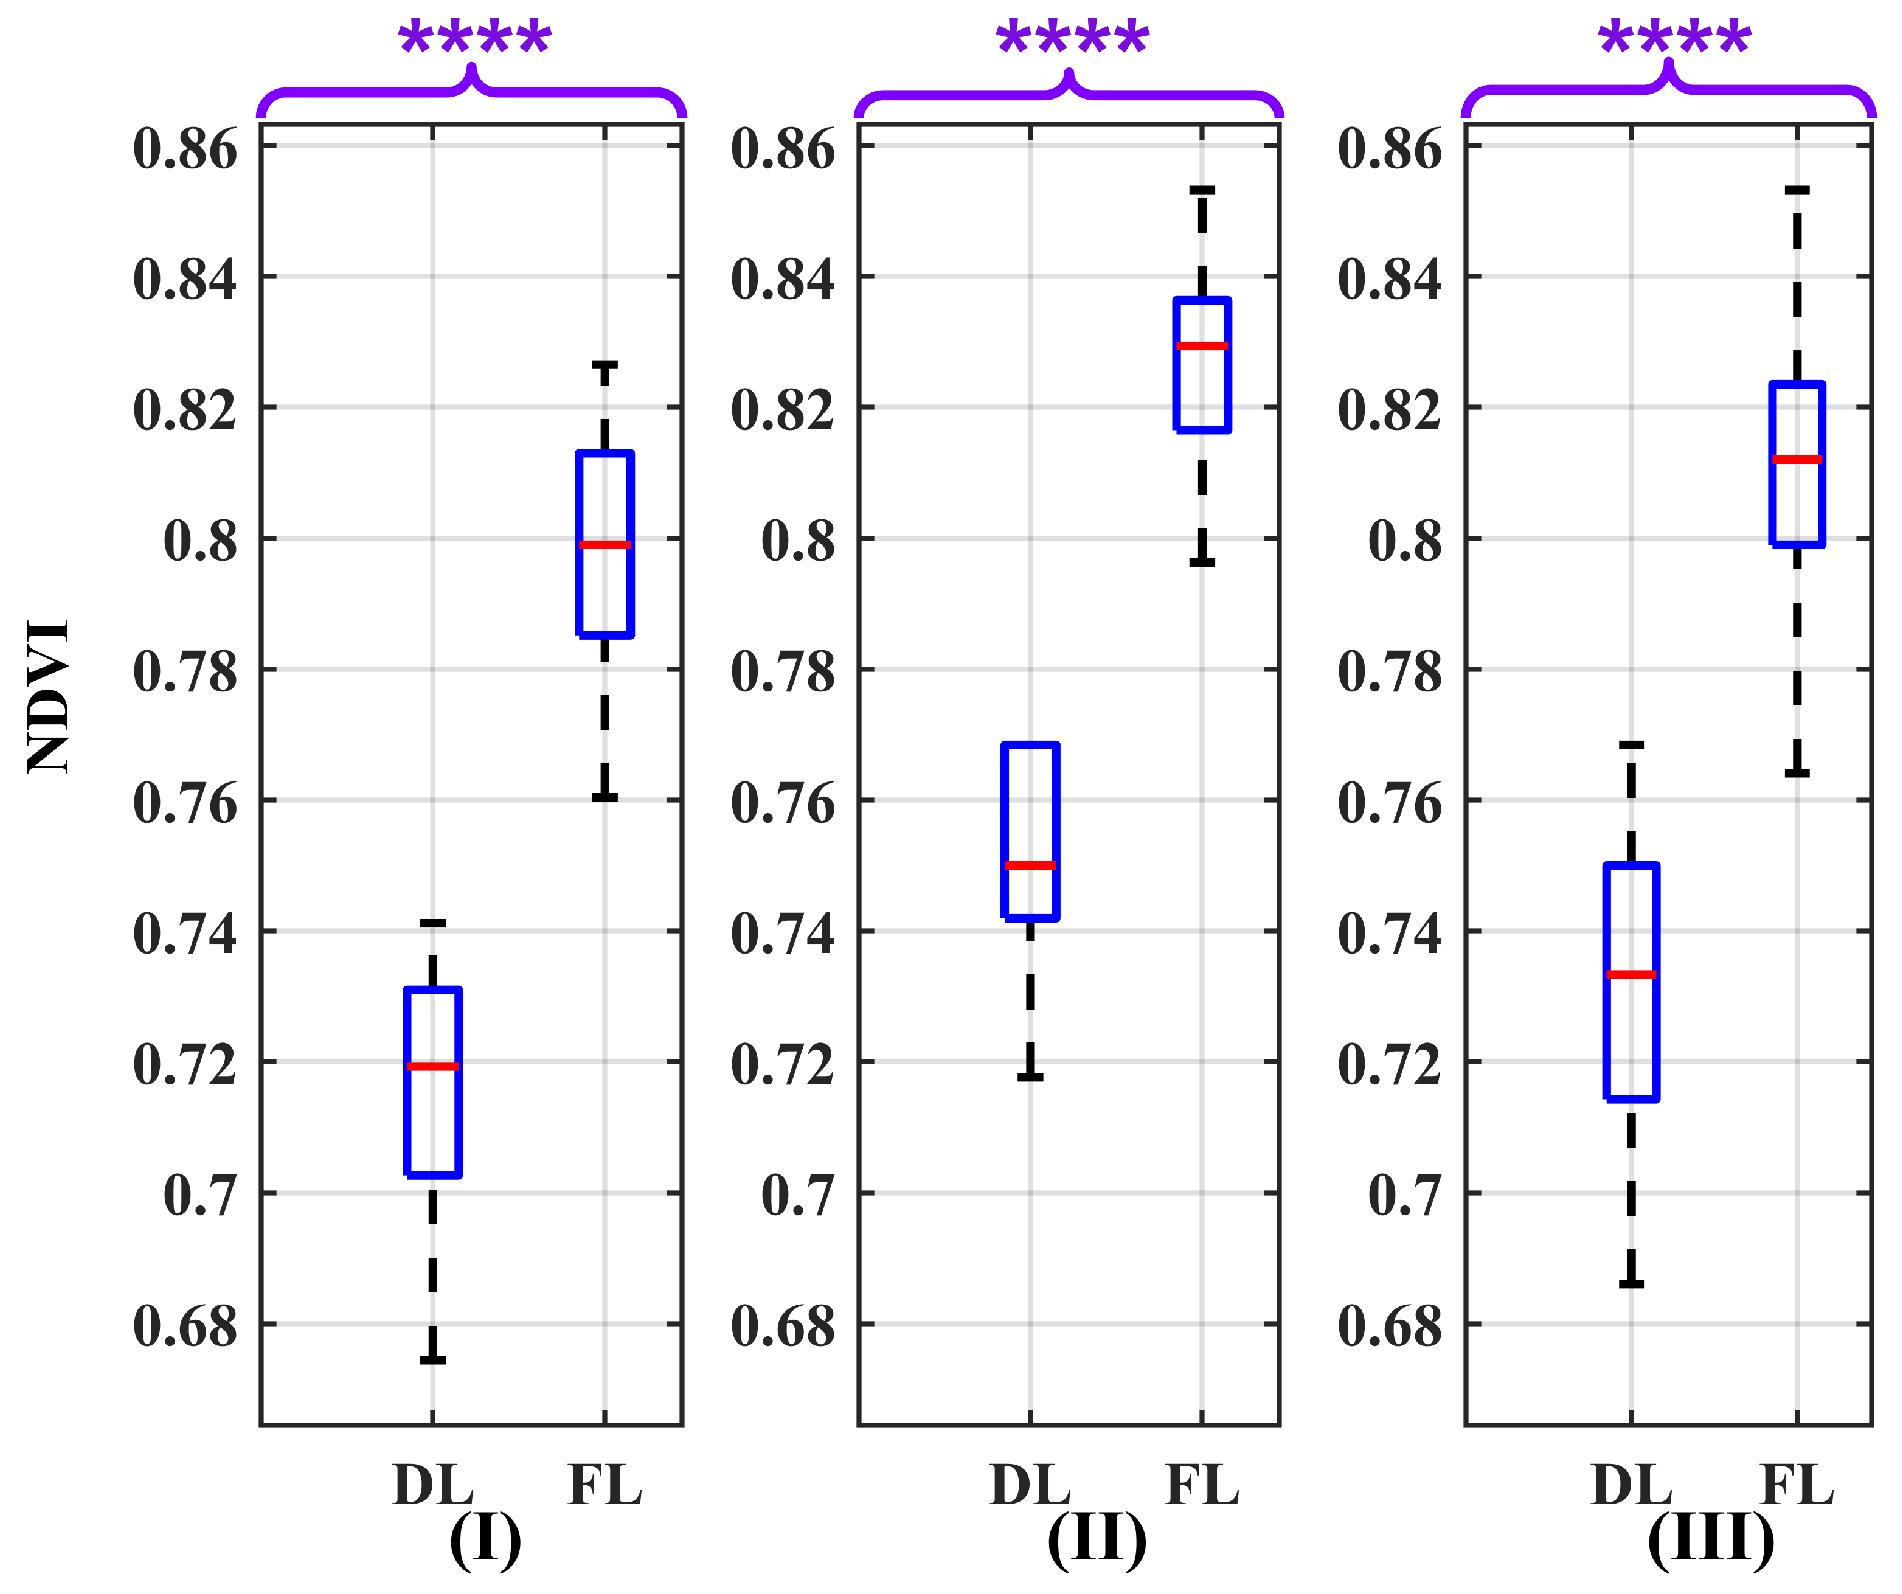
Box plots illustrating the effect of nominal wavelength as a source of uncertainty on the NDVI values for the atmospheric conditions: (I) dry–clear, (II) humid–hazy, and (III) mixed, considering both dry leaves (DLs) and fresh leaves (FLs). The p-value results of the Wilcoxon Rank Sum Test are significantly below 0.0001 (p ≤ 0.0001). Therefore, to report them, four asterisks are used to denote the level of significance. The red line in each box represents the median (Med) of NDVI values in related conditions.
Figure 9.
Box plots illustrating the effect of nominal wavelength as a source of uncertainty on the NDVI values for the atmospheric conditions: (I) dry–clear, (II) humid–hazy, and (III) mixed, considering both dry leaves (DLs) and fresh leaves (FLs). The p-value results of the Wilcoxon Rank Sum Test are significantly below 0.0001 (p ≤ 0.0001). Therefore, to report them, four asterisks are used to denote the level of significance. The red line in each box represents the median (Med) of NDVI values in related conditions.
Figure 10.
Box plots illustrating the effect of the variability in solar irradiance measurement as a source of uncertainty on the NDVI values for the atmospheric conditions: (I) dry–clear, (II) humid–hazy, and (III) mixed, considering both dry leaves (DLs) and fresh leaves (FLs). The p-value results of the Wilcoxon Rank Sum Test are significantly below 0.0001 (p ≤ 0.0001). Therefore, to report them, four asterisks are used to denote the level of significance. The red line in each box represents the median (Med) of NDVI values in related conditions.
Figure 11.
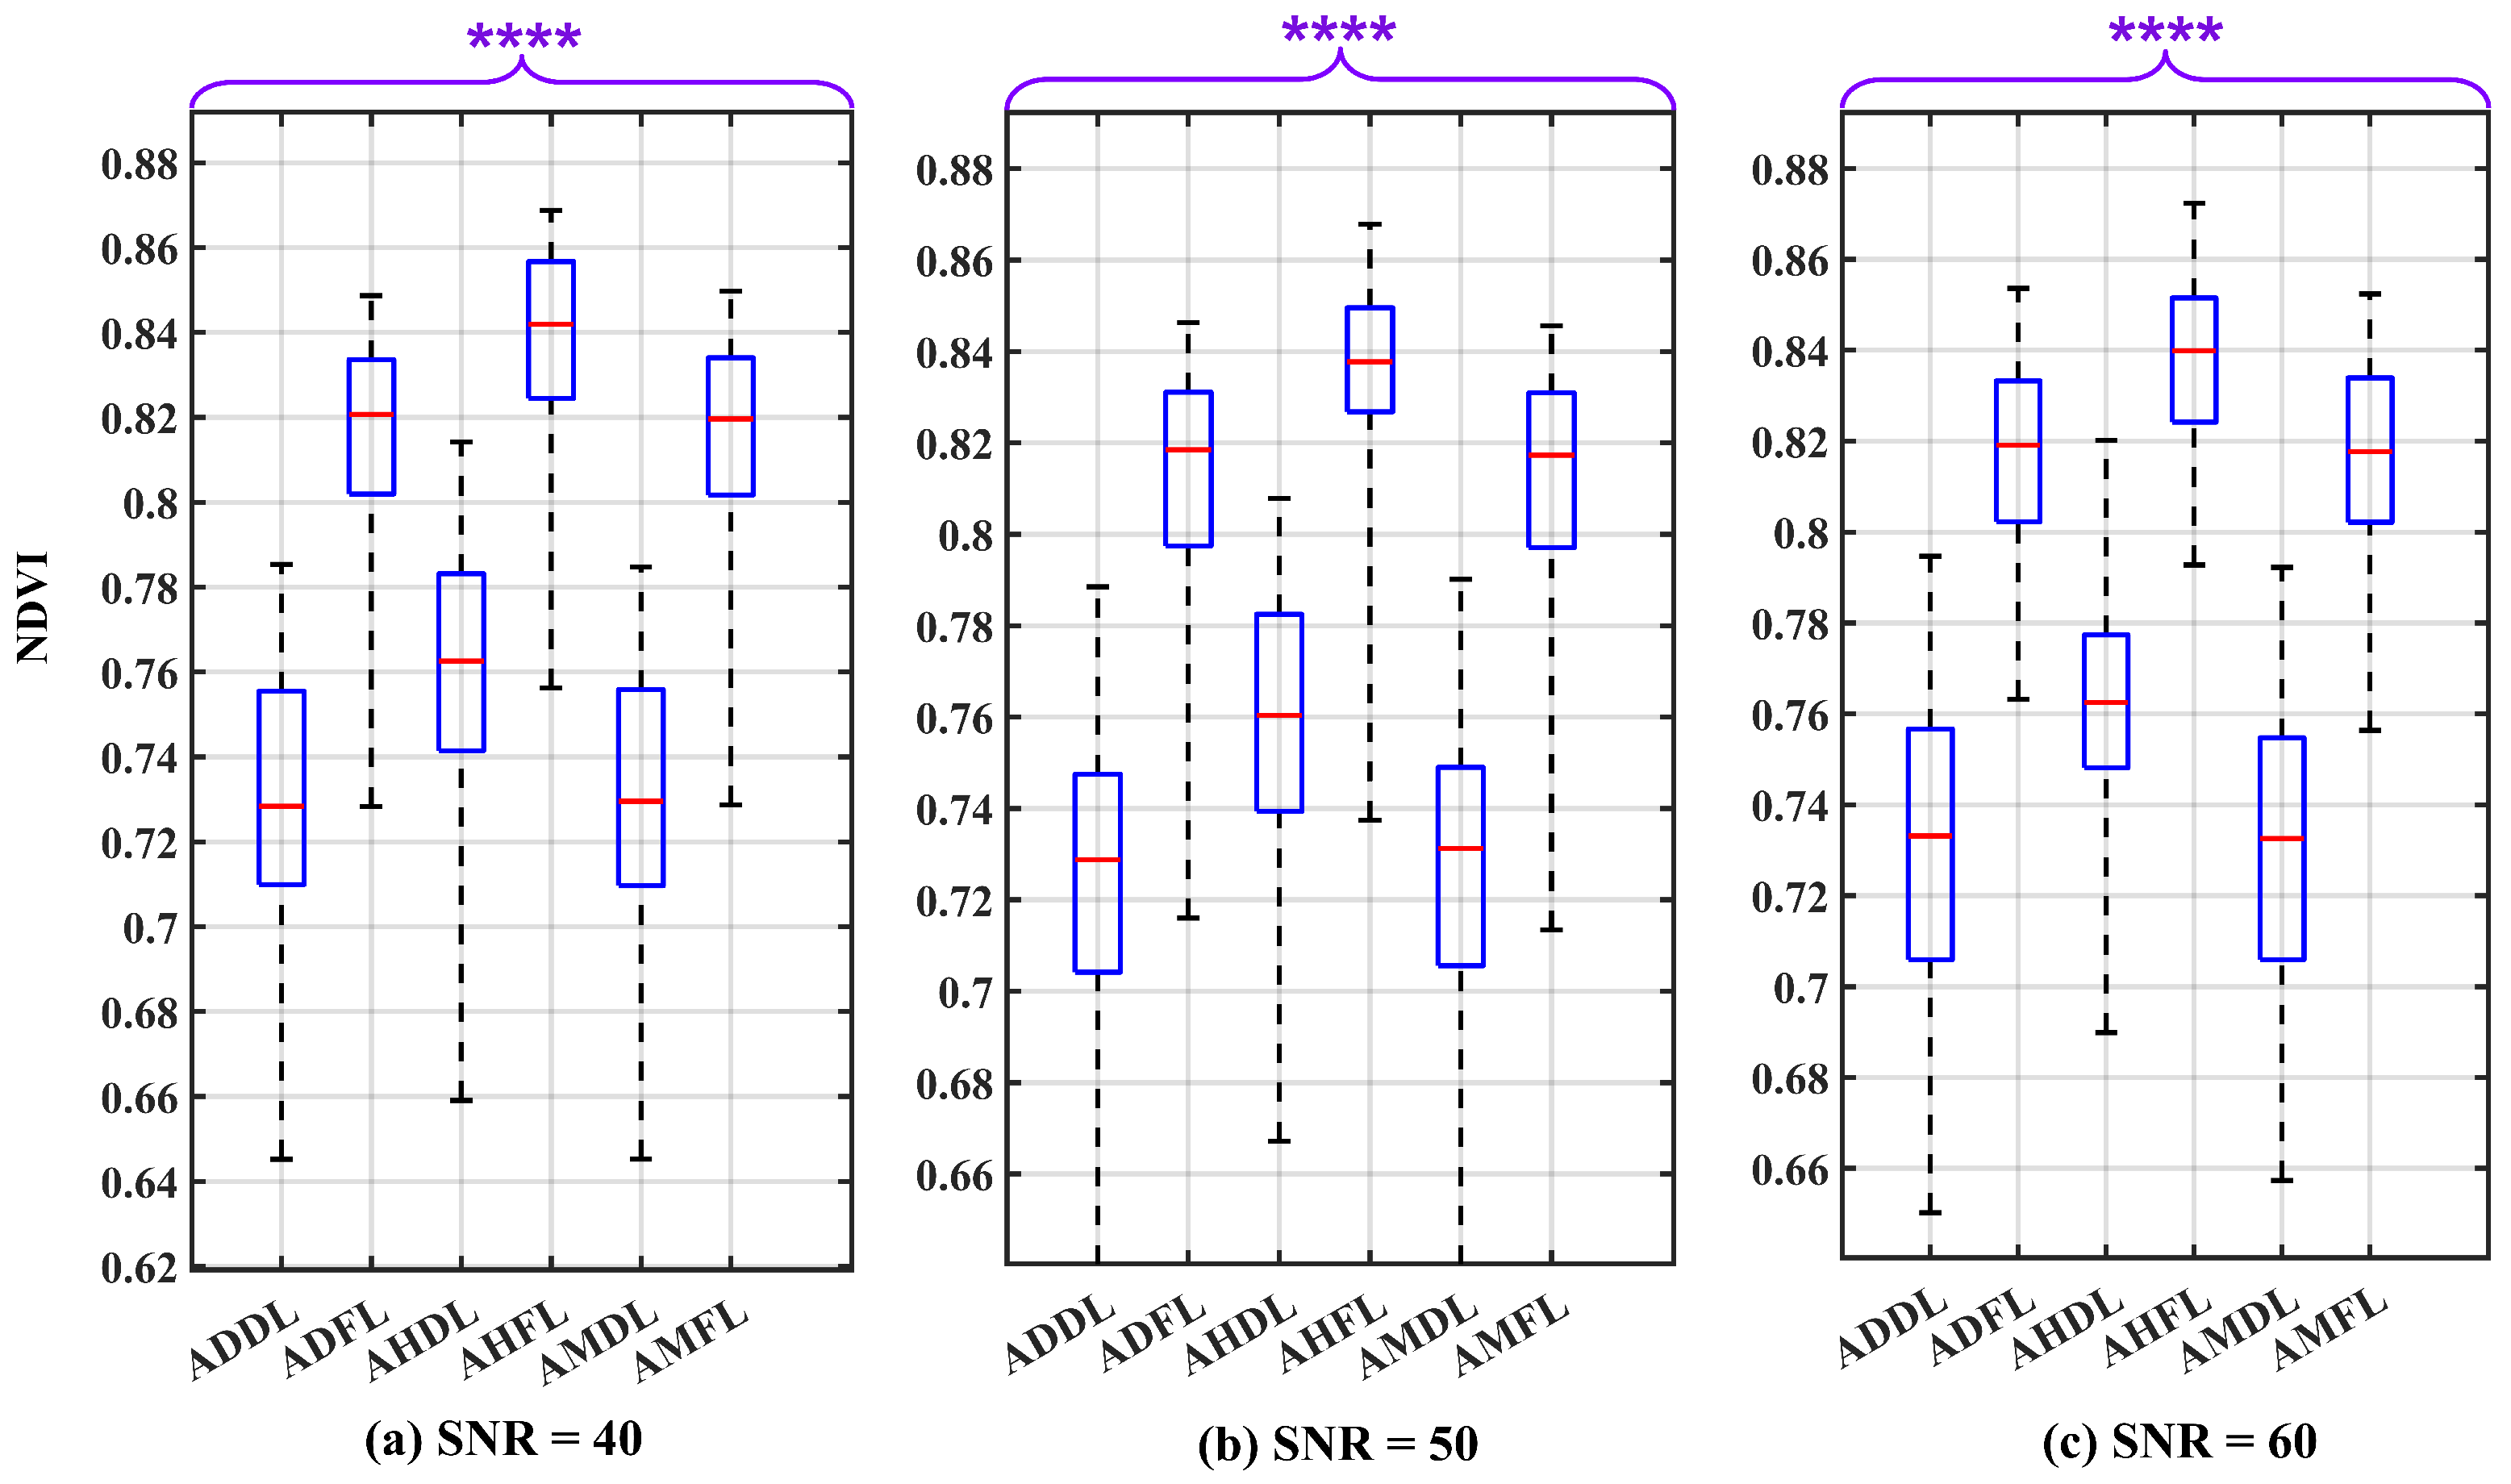
Box plots illustrating the influence of the camera sensor under three different SNR conditions: (a) SNR = 40 dB, (b) SNR = 50 dB, and (c) SNR = 60 dB, serving as uncertainty factors on the NDVI values. The plot considers various atmospheric conditions and leaf states, including: atmosphere dry–clear and dry leaf (ADDL), atmosphere dry–clear and fresh leaf (ADFL), atmosphere humid–hazy and dry leaf (AHDL), atmosphere humid–hazy and fresh leaf (AHFL), atmosphere mixed for dry leaf (AMDL), and atmosphere mixed for fresh leaf (AMFL). The p-value results of the Wilcoxon Rank Sum Test are significantly below 0.0001 (p ≤ 0.0001). Therefore, to report them, four asterisks are used to denote the level of significance. The red line in each box represents the median (Med) of NDVI values in related conditions.
Figure 11.
Box plots illustrating the influence of the camera sensor under three different SNR conditions: (a) SNR = 40 dB, (b) SNR = 50 dB, and (c) SNR = 60 dB, serving as uncertainty factors on the NDVI values. The plot considers various atmospheric conditions and leaf states, including: atmosphere dry–clear and dry leaf (ADDL), atmosphere dry–clear and fresh leaf (ADFL), atmosphere humid–hazy and dry leaf (AHDL), atmosphere humid–hazy and fresh leaf (AHFL), atmosphere mixed for dry leaf (AMDL), and atmosphere mixed for fresh leaf (AMFL). The p-value results of the Wilcoxon Rank Sum Test are significantly below 0.0001 (p ≤ 0.0001). Therefore, to report them, four asterisks are used to denote the level of significance. The red line in each box represents the median (Med) of NDVI values in related conditions.
Figure 12.
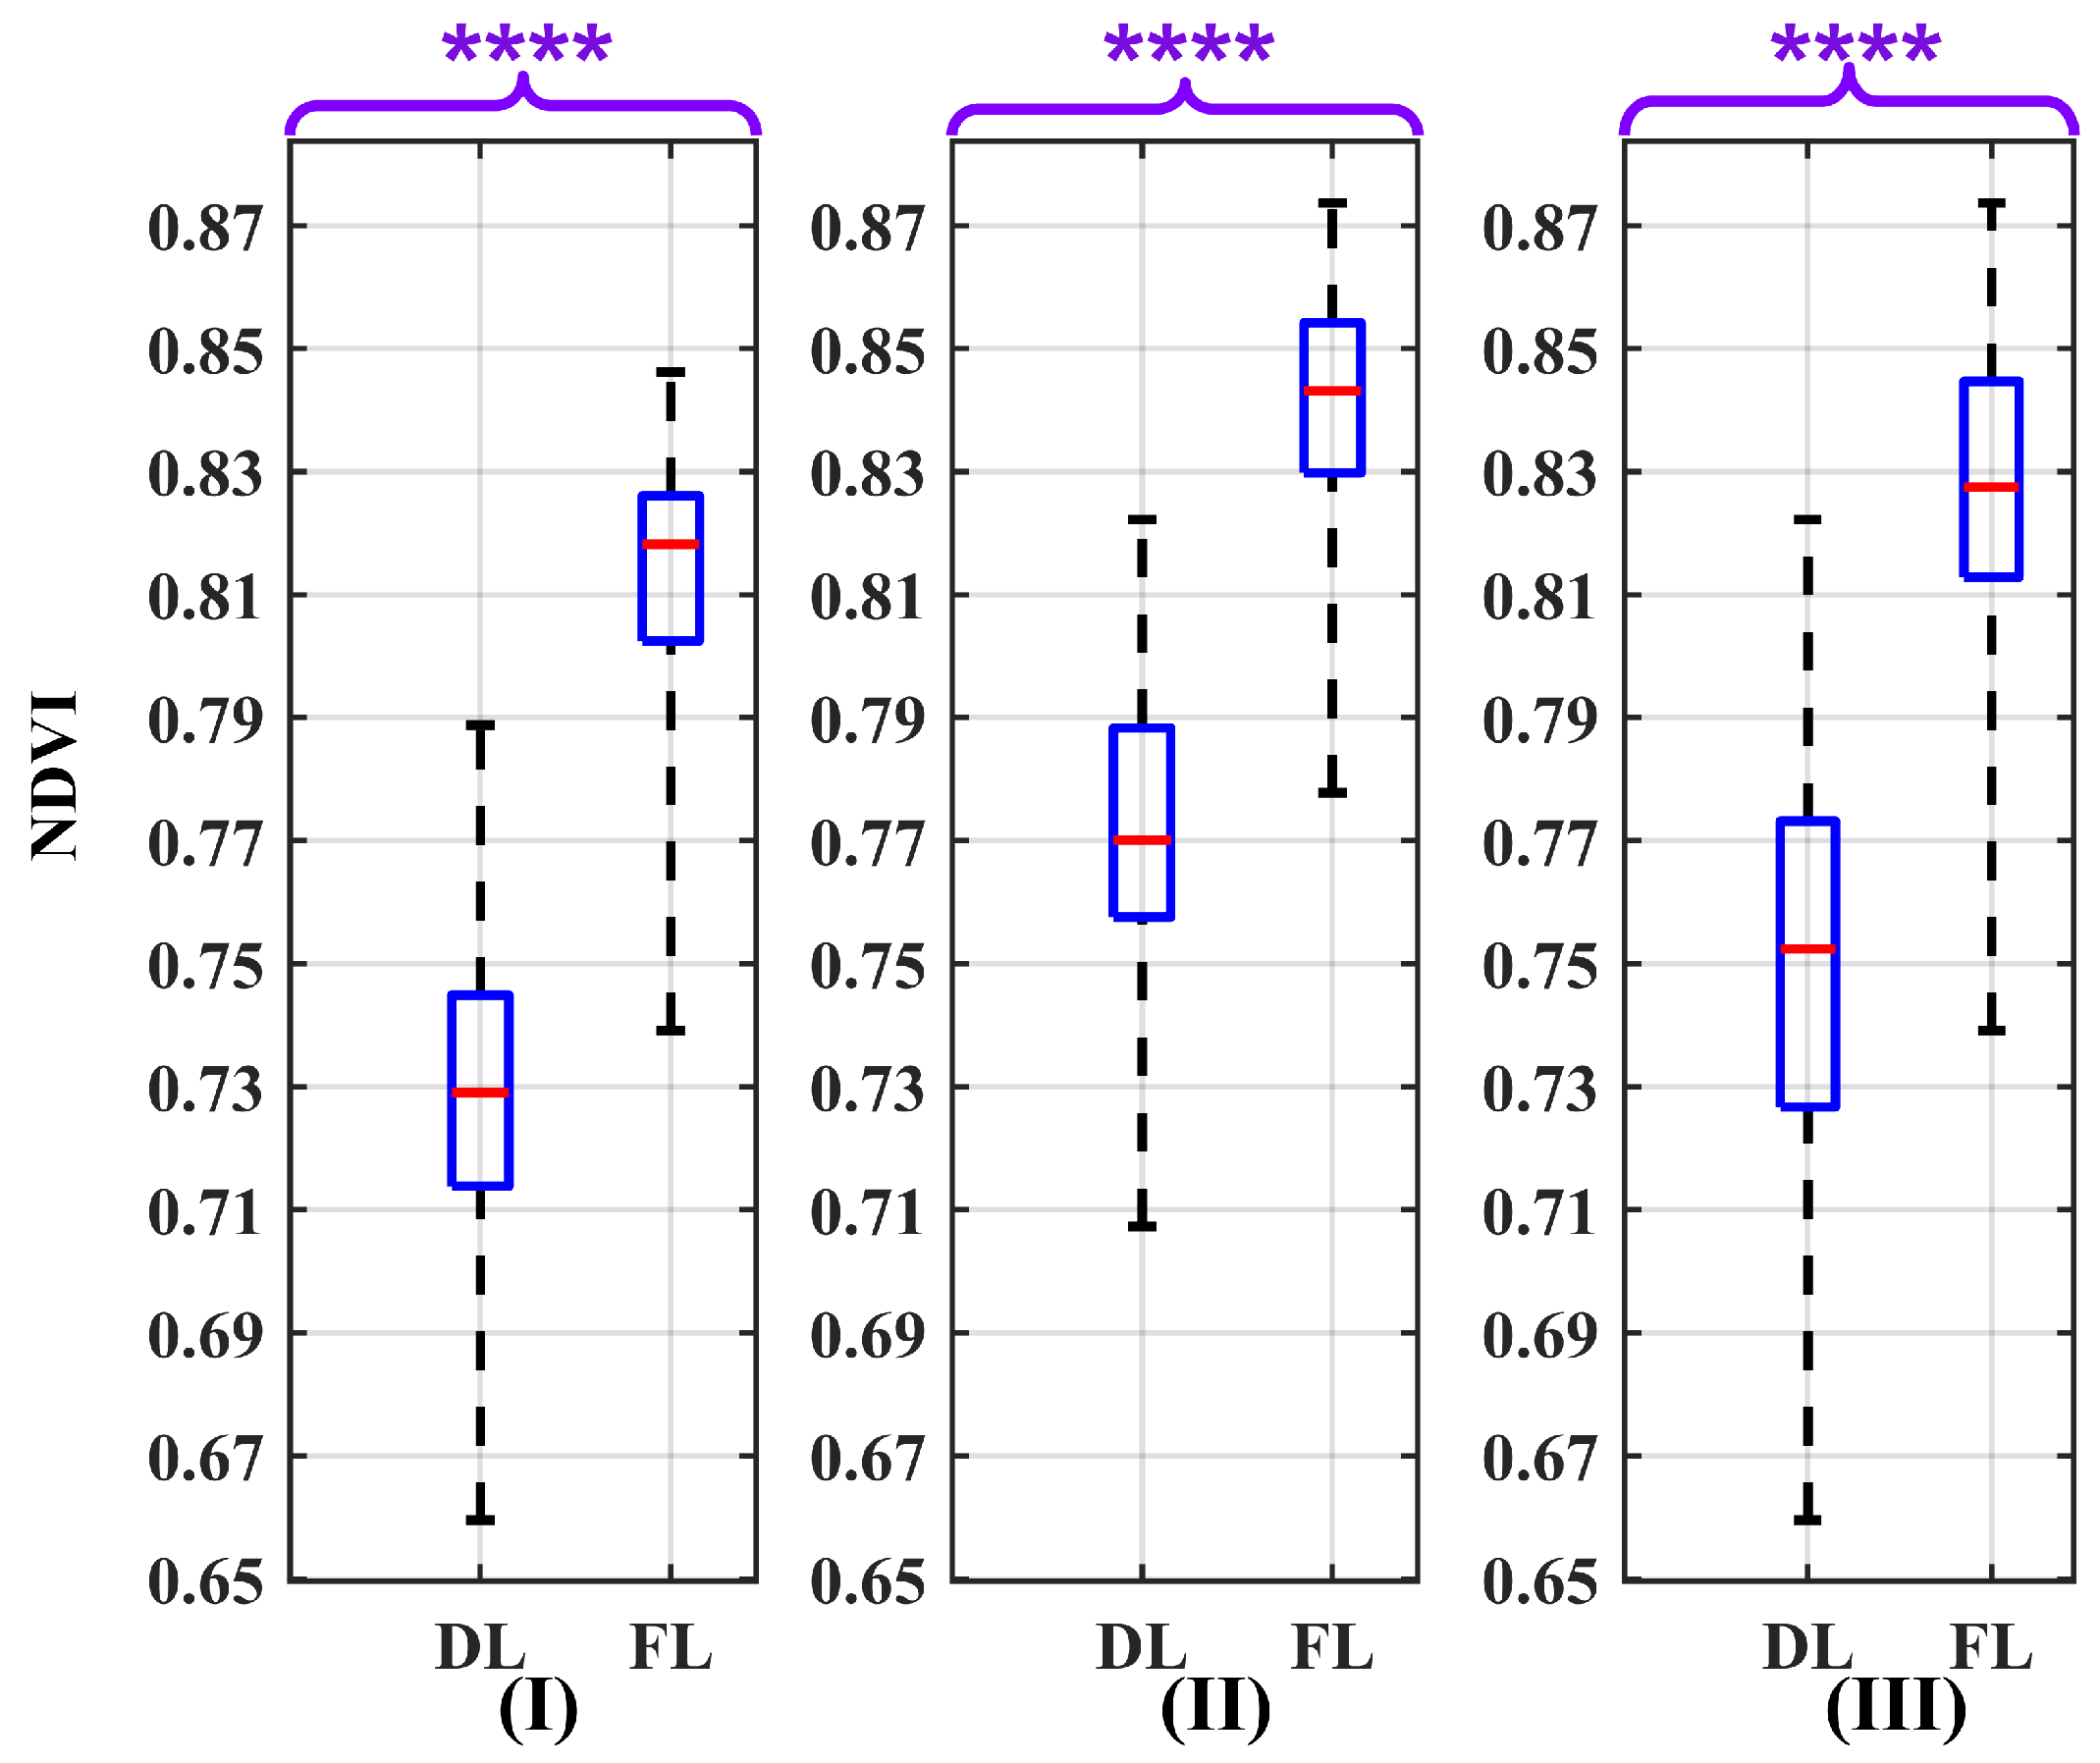
Box plots illustrating the effect of the variability of the NDVI values as a source of uncertainty on the NDVI values for atmospheric conditions: (I) dry–clear, (II) humid–hazy, and (III) mixed, considering both dry leaves (DLs) and fresh leaves (FLs). The p-value results of the Wilcoxon Rank Sum Test are significantly below 0.0001 (p ≤ 0.0001). Therefore, to report them, four asterisks are used to denote the level of significance. The red line in each box represents the median (Med) of NDVI values in related conditions.
Figure 12.
Box plots illustrating the effect of the variability of the NDVI values as a source of uncertainty on the NDVI values for atmospheric conditions: (I) dry–clear, (II) humid–hazy, and (III) mixed, considering both dry leaves (DLs) and fresh leaves (FLs). The p-value results of the Wilcoxon Rank Sum Test are significantly below 0.0001 (p ≤ 0.0001). Therefore, to report them, four asterisks are used to denote the level of significance. The red line in each box represents the median (Med) of NDVI values in related conditions.
Figure 13.
Box plots illustrating the effect of all uncertainty sources under three different SNR conditions: (a) SNR = 40 dB, (b) SNR = 50 dB, and (c) SNR = 60 dB, serving as uncertainty factors on the NDVI values. The plot considers various atmospheric conditions and leaf states, including: atmosphere dry–clear and dry leaf (ADDL), atmosphere dry–clear and fresh leaf (ADFL), atmosphere humid–hazy and dry leaf (AHDL), atmosphere humid–hazy and fresh leaf (AHFL), atmosphere mixed for dry leaf (AMDL), and atmosphere mixed for fresh leaf (AMFL). The p-value results of the Wilcoxon Rank Sum Test are significantly below 0.0001 (p ≤ 0.0001). Therefore, to report them, four asterisks are used to denote the level of significance. The red line in each box represents the median (Med) of NDVI values in related conditions.
Figure 14.
Box plots illustrating the effect of all uncertainty sources by using the AQ600 camera features under three different SNR conditions: (a) SNR = 40 dB, (b) SNR = 50 dB, and (c) SNR = 60 dB, serving as uncertainty factors on the NDVI values. The plot considers various atmospheric conditions and leaf states, including: atmosphere dry–clear and dry leaf (ADDL), atmosphere dry–clear and fresh leaf (ADFL), atmosphere humid–hazy and dry leaf (AHDL), atmosphere humid–hazy and fresh leaf (AHFL), atmosphere mixed for dry leaf (AMDL), and atmosphere mixed for fresh leaf (AMFL). The p-value results of the Wilcoxon Rank Sum Test are significantly below 0.0001 (p ≤ 0.0001). Therefore, to report them, four asterisks are used to denote the level of significance. The red line in each box represents the median (Med) of NDVI values in related conditions.
Table 1.
Statistical parameters the median (Med), the first and third quartiles (Q1, Q3), the Interquartile Range (IQR), and the distance of the first quartiles of fresh leaves and the third quartiles of dry leaves when the effect of the nominal wavelength as an uncertainty source on the NDVI values for different leaf states (LSs) and atmospheric conditions (ATM. Conds.) is evaluated.
| LS | Atm. Cond. | Med | Q1 | Q3 | IQR | |
|---|
| Fresh | Humid–Hazy | 0.829 | 0.817 | 0.836 | 0.019 | 0.049 |
| Dry–Clear | 0.799 | 0.785 | 0.813 | 0.028 | 0.054 |
| Mixed | 0.812 | 0.799 | 0.824 | 0.025 | 0.049 |
| Dry | Humid–Hazy | 0.750 | 0.742 | 0.768 | 0.026 | 0.049 |
| Dry–Clear | 0.719 | 0.703 | 0.731 | 0.028 | 0.054 |
| Mixed | 0.733 | 0.714 | 0.750 | 0.036 | 0.049 |
Table 2.
Statistical parameters the median (Med), the first and third quartiles (Q1, Q3), the Interquartile Range (IQR), and the distance of the first quartiles of fresh leaves and third quartiles of dry leaves when the effect of solar irradiance standard deviation as an uncertainty source on the NDVI values for different leaf states (LSs) and atmospheric conditions (ATM. Conds.) is evaluated.
| LS | Atm. Cond. | Med | Q1 | Q3 | IQR | |
|---|
| Fresh | Humid–Hazy | 0.836 | 0.836 | 0.838 | 0.002 | 0.068 |
| Dry–Clear | 0.797 | 0.797 | 0.798 | 0.001 | 0.076 |
| Mixed | 0.809 | 0.797 | 0.836 | 0.039 | 0.029 |
| Dry | Humid–Hazy | 0.768 | 0.750 | 0.768 | 0.018 | 0.068 |
| Dry–Clear | 0.721 | 0.719 | 0.721 | 0.002 | 0.076 |
| Mixed | 0.737 | 0.721 | 0.768 | 0.047 | 0.029 |
Table 3.
Statistical parameters the median (Med), the first and third quartiles (Q1, Q3), the Interquartile Range (IQR), and the distance of the first quartiles of fresh leaves and the third quartiles of dry leave when the effect of the camera SNR at 40 dB, 50 dB, and 60 dB as an uncertainty source on the NDVI values for different leaf states (LSs) and atmospheric conditions (ATM. Conds.) is evaluated.
| LS | Atm. Cond. | SNR [dB] | Med | Q1 | Q3 | IQR | |
|---|
| Fresh | Humid–Hazy | 40 | 0.836 | 0.836 | 0.836 | 0.000 | 0.068 |
| 50 | 0.836 | 0.836 | 0.836 | 0.000 | 0.068 |
| 60 | 0.836 | 0.836 | 0.836 | 0.000 | 0.068 |
| Dry–Clear | 40 | 0.797 | 0.797 | 0.797 | 0.000 | 0.076 |
| 50 | 0.797 | 0.797 | 0.797 | 0.000 | 0.076 |
| 60 | 0.797 | 0.797 | 0.797 | 0.000 | 0.076 |
| Mixed | 40 | 0.817 | 0.797 | 0.836 | 0.039 | 0.029 |
| 50 | 0.817 | 0.797 | 0.836 | 0.039 | 0.029 |
| 60 | 0.817 | 0.797 | 0.836 | 0.039 | 0.029 |
| Dry | Humid–Hazy | 40 | 0.768 | 0.750 | 0.768 | 0.018 | 0.068 |
| 50 | 0.768 | 0.768 | 0.768 | 0.000 | 0.068 |
| 60 | 0.768 | 0.768 | 0.768 | 0.000 | 0.068 |
| Dry–Clear | 40 | 0.721 | 0.721 | 0.721 | 0.000 | 0.076 |
| 50 | 0.721 | 0.721 | 0.721 | 0.000 | 0.076 |
| 60 | 0.721 | 0.721 | 0.721 | 0.000 | 0.076 |
| Mixed | 40 | 0.735 | 0.721 | 0.768 | 0.047 | 0.029 |
| 50 | 0.745 | 0.721 | 0.768 | 0.047 | 0.029 |
| 60 | 0.745 | 0.721 | 0.768 | 0.047 | 0.029 |
Table 4.
Statistical parameters the median (Med), the first and third quartiles (Q1, Q3), the Interquartile Range (IQR), and the distance of the first quartiles of fresh leaves and the third quartiles of dry leaves when the effect of the variability of the NDVI values as an uncertainty source on the NDVI values for different leaf states (LSs) and atmospheric conditions (ATM. Conds.) is evaluated.
| No./LS | Atm. Cond. | Med | Q1 | Q3 | IQR | |
|---|
| 49/Fresh Leaf | Humid–Hazy | 0.843 | 0.830 | 0.854 | 0.024 | 0.042 |
| Dry–Clear | 0.818 | 0.802 | 0.826 | 0.024 | 0.057 |
| Mixed | 0.827 | 0.813 | 0.845 | 0.032 | 0.040 |
| 49/Dry Leaf | Humid–Hazy | 0.770 | 0.758 | 0.788 | 0.030 | 0.042 |
| Dry–Clear | 0.729 | 0.714 | 0.745 | 0.031 | 0.057 |
| Mixed | 0.752 | 0.727 | 0.773 | 0.046 | 0.040 |
Table 5.
Statistical parameters the median (Med), the first and third quartiles (Q1, Q3), the Interquartile Range (IQR), and the distance of the first quartiles of fresh leaves and the third quartiles of dry leaves when the effect of the combination of all uncertainty sources on the NDVI values for different leaf states (LSs) and atmospheric conditions (ATM. Conds.) is evaluated.
| No./LS | Atm. Cond. | SNR [dB] | Med | Q1 | Q3 | IQR | |
|---|
| 49/Fresh | Humid–Hazy | 40 | 0.840 | 0.825 | 0.856 | 0.031 | 0.035 |
| 50 | 0.842 | 0.822 | 0.854 | 0.032 | 0.039 |
| 60 | 0.843 | 0.820 | 0.851 | 0.031 | 0.040 |
| Dry–Clear | 40 | 0.815 | 0.796 | 0.831 | 0.035 | 0.036 |
| 50 | 0.819 | 0.791 | 0.829 | 0.038 | 0.041 |
| 60 | 0.813 | 0.797 | 0.832 | 0.035 | 0.047 |
| Mixed | 40 | 0.829 | 0.808 | 0.843 | 0.035 | 0.038 |
| 50 | 0.825 | 0.800 | 0.843 | 0.043 | 0.030 |
| 60 | 0.828 | 0.810 | 0.842 | 0.032 | 0.040 |
| 49/Dry | Humid–Hazy | 40 | 0.762 | 0.739 | 0.792 | 0.053 | 0.035 |
| 50 | 0.767 | 0.739 | 0.783 | 0.044 | 0.039 |
| 60 | 0.767 | 0.742 | 0.782 | 0.040 | 0.040 |
| Dry–Clear | 40 | 0.737 | 0.704 | 0.755 | 0.051 | 0.036 |
| 50 | 0.730 | 0.697 | 0.750 | 0.053 | 0.041 |
| 60 | 0.731 | 0.699 | 0.751 | 0.052 | 0.047 |
| Mixed | 40 | 0.743 | 0.724 | 0.768 | 0.044 | 0.038 |
| 50 | 0.748 | 0.720 | 0.771 | 0.051 | 0.030 |
| 60 | 0.748 | 0.718 | 0.770 | 0.052 | 0.040 |
Table 6.
Statistical parameters the median (Med), the first and third quartiles (Q1, Q3), the Interquartile Range (IQR), and the distance of the first quartiles of fresh leaves and the third quartiles of dry leaves when the effect of the combination of all uncertainty sources by using the AQ600 camera’s features on the NDVI values for different leaf states (LSs) and atmospheric conditions (ATM. Conds.) is evaluated.
| No./LS | Atm. Cond. | SNR [dB] | Med | Q1 | Q3 | IQR | |
|---|
| 49/Fresh | Humid–Hazy | 40 | 0.842 | 0.824 | 0.857 | 0.033 | 0.041 |
| 50 | 0.838 | 0.827 | 0.850 | 0.023 | 0.044 |
| 60 | 0.840 | 0.824 | 0.852 | 0.028 | 0.047 |
| Dry–Clear | 40 | 0.821 | 0.802 | 0.834 | 0.032 | 0.047 |
| 50 | 0.819 | 0.797 | 0.831 | 0.034 | 0.050 |
| 60 | 0.819 | 0.802 | 0.833 | 0.031 | 0.045 |
| Mixed | 40 | 0.829 | 0.809 | 0.847 | 0.038 | 0.037 |
| 50 | 0.827 | 0.806 | 0.843 | 0.037 | 0.034 |
| 60 | 0.831 | 0.814 | 0.841 | 0.027 | 0.048 |
| 49/Dry | Humid–Hazy | 40 | 0.763 | 0.741 | 0.783 | 0.042 | 0.041 |
| 50 | 0.760 | 0.739 | 0.783 | 0.044 | 0.044 |
| 60 | 0.763 | 0.748 | 0.777 | 0.029 | 0.047 |
| Dry–Clear | 40 | 0.728 | 0.710 | 0.755 | 0.045 | 0.047 |
| 50 | 0.729 | 0.704 | 0.747 | 0.043 | 0.050 |
| 60 | 0.733 | 0.706 | 0.757 | 0.051 | 0.045 |
| Mixed | 40 | 0.752 | 0.722 | 0.772 | 0.05 | 0.037 |
| 50 | 0.745 | 0.713 | 0.772 | 0.059 | 0.034 |
| 60 | 0.751 | 0.725 | 0.766 | 0.041 | 0.048 |

 ,
, 


