Article

CH4, C2H6, and C2H4 Multi-Gas Sensing Based on Mid-Infrared Spectroscopy and SVM Algorithm

by
Wenyuan Shao
1,
Yunjiang Jia
1,
Xilian Su
1,
Benlei Zhao
1,
Jiachen Jiang
1,
Limei Gao
1,
Xiaosong Zhu
1 and
Yiwei Shi
1,2,*
1
School of Information Science and Technology, Fudan University, Shanghai 200438, China
2
Zhongshan-Fudan Joint Innovation Center, Zhongshan 528400, China
*
Author to whom correspondence should be addressed.
Sensors 2025, 25(5), 1427; https://doi.org/10.3390/s25051427
Submission received: 8 February 2025 / Revised: 23 February 2025 / Accepted: 24 February 2025 / Published: 26 February 2025
(This article belongs to the Special Issue Advanced Sensors for Gas Monitoring)

Abstract

:
A multi-gas sensing system based on mid-infrared spectral absorption was developed for the detection of CH4, C2H6, and C2H4. The system utilized a broadband infrared source, a hollow waveguide (HWG) absorption cell, and a tunable Fabry–Pérot (FP) detector. The limits of detection (LODs) of CH4, C2H6, and C2H4 were 7.33 ppm, 2.13 ppm, and 8.09 ppm, respectively. For multi-gas measurements, the support vector machine (SVM) algorithm model was employed to calculate the concentration of each component. The root mean square error of prediction (RMSEP) values for CH4, C2H6, and C2H4 were 15.91 ppm (1.26%), 1.64 ppm (0.57%), and 6.95 ppm (0.55%), respectively. The generation of stimulated absorption spectra of mixed gases was realized, and the sample selection of measurement for accurate concentration calculation of each gas was optimized. The system proposed in this work provides a simple, miniaturized, and cost-effective solution for multi-gas sensing.

1. Introduction

Methane (CH4), ethane (C2H6), and ethylene (C2H4) are typical pollution gases emitted during industrial production, transportation, and building renovation. Excessive concentrations of CH4, C2H6, and C2H4 have been demonstrated to have serious impacts on air quality, climate change, and human health [1,2,3,4]. CH4 and C2H6 are the primary components of oil and natural gas, as well as the predominant volatiles produced by the combustion of fossil fuels [5]. Emissions of CH4 and C2H6 contribute to the greenhouse effect and climate change [6,7]. C2H4, a byproduct of chemical production and motor vehicle exhaust, has been identified as a carcinogen when exposed to high concentrations over an extended period [8]. Consequently, monitoring the emission concentrations of CH4, C2H6, and C2H4 is of special importance for preventing environmental pollution and protecting human health. In recent years, spectroscopic methods have undergone significant advancement and become increasingly prevalent in the domain of multi-gas monitoring. Fiber-enhanced Raman spectroscopy (FERS) and infrared absorption spectroscopy (IR) are commonly used spectroscopic methods for multi-gas detection.
FRES gas sensors are based on Raman scattering, i.e., inelastic light scattering at the vibrational–rotational or rotational energy level of molecules. Each gas can be identified by its ‘molecular fingerprint’, i.e., its unique vibrational or rotational peak pattern. FERS has the advantage of high accuracy, sensitivity, and resolution. However, because the signal is weak due to the small Raman scattering cross-section, a variety of sophisticated enhancement techniques must be employed to amplify the Raman signal. The use of a high-power laser light source and fiber optic sensing techniques is a common solution [9,10]. In 2020, Andreas Kneb et al. implemented a dual gas sensor with detection limits of 3 ppm and 49 ppm for CH4 and H2, respectively, using a laser light source and a hollow-core anti-resonant fiber (HC-ARF) absorption cell [11]. In 2022, Bai et al. used a laser light source to design a Raman gas sensor based on HC-ARF for the simultaneous measurement of CH4, C2H6, C2H4, acetylene (C2H2), hydrogen (H2), and carbon monoxide (CO), with detection limits of 1.2 ppm, 2.9 ppm, and 1.6 ppm for CH4, C2H6, and C2H4, respectively [12]. Excessive laser intensity usually excites a large number of fluorescence signals during practical measurements, resulting in Raman scattering signals being covered by fluorescence. In 2023, Wan et al. proposed a fluorescence noise elimination (FNE) technique that can effectively eliminate horizontal and vertical spatial noise, and the multi-gas optical sensor based on this technique had detection limits of 1.5 ppm for CH4 and 4.8 ppm for C2H4 [13]. These complex signal enhancement techniques result in complex, bulky, and costly FERS sensing systems, which are not conducive to miniaturization, integration, portability, and commercialization.
IR gas sensors are based on the theory of absorption spectroscopy of gas molecules. Based on the ‘fingerprint’ property of gases in the infrared band, the gas absorbs the corresponding infrared radiation, and the detector produces a thermal change, which is converted into an electrical signal to measure the gas concentration. Unlike FERS, IR gas sensors have a variety of options for light sources and detectors. The use of non-dispersive broadband light sources and pyroelectric detectors is conducive to system miniaturization, integration, and commercialization due to their low cost and small size. In 2020, Tan et al. developed a multi-gas sensing system, comprising a broadband light source and multiple narrowband pyroelectric detectors, with a detection limit of 63 ppm for CH4 [14]. In 2020, Liu et al. designed a multi-gas detection sensor composed of a broadband light source and six dual-channel infrared detectors for simultaneous detection of CO, CO2, CH4, formaldehyde (H2CO), ammonia (NH3), and nitric oxide (NO) [15]. The detection limit of CH4 was 500 ppm, with a detection accuracy of ±0.05%. In 2024, Li et al. designed a greenhouse gas detection sensor consisting of a broadband light source and a four-channel detector [16]. This sensor was used to detect the concentrations of CH4, nitrous oxide (N2O), and carbon dioxide (CO2). The full-scale error of the sensor was found to vary by less than 0.81%, the repeatability error was less than 0.39%, and the stability was less than 0.61%. However, for multi-gas detection, superposition of gas absorption in the infrared spectrum leads to crosstalk, significantly impacting detection accuracy [17]. To address the challenge, machine learning algorithms have been employed to eliminate interference between gases, enhancing the performance of the system [18,19,20].
In this work, a portable mid-infrared spectroscopic gas sensing system was established. It consists of a broadband light source, a tunable Fabry–Pérot (FP) filter detector, and a hollow waveguide (HWG) absorption cell. The emission spectrum (2–14 μm) of the broadband light source encompasses the mid-infrared absorption bands of CH4 (3.2–3.6 μm), C2H6 (3.3–3.6 μm), and C2H4 (3.1–3.5 μm). The pyroelectric detector is capable of performing wavelength scan detection in the band of 3.1–4.4 μm. The light source and detector are both characterized by their low cost and small size, which facilitates system miniaturization, integration, and commercialization. The HWG functions as both a transmission medium for mid-infrared light and a gas absorption cell [21,22]. The HWG is flexible and of low loss property owing to the inner coatings of Ag and AgI (Ag/AgI) optical films. It can be directly coupled to the light source and detector, enhancing the system’s engineering stability [23]. The system involved the detection of single-component concentrations of CH4, C2H6, and C2H4, as well as the detection of three-component mixtures. To address the challenge of superposition in characteristic absorption spectra of multiple gases, a support vector machine (SVM) algorithm was employed for concentration calculation. In an effort to reduce expenses and enhance efficiency, this work proposes the utilization of a limited number of measured spectra of mixed gases to generate a substantial quantity of simulated spectra, subsequently employing the simulated spectra for model training.

2. Principle and System

2.1. Sensing System

A multi-gas sensing system was established as shown in Figure 1. The system was composed of three modules: the gas sampling module, the optical sensing module, and the control module.
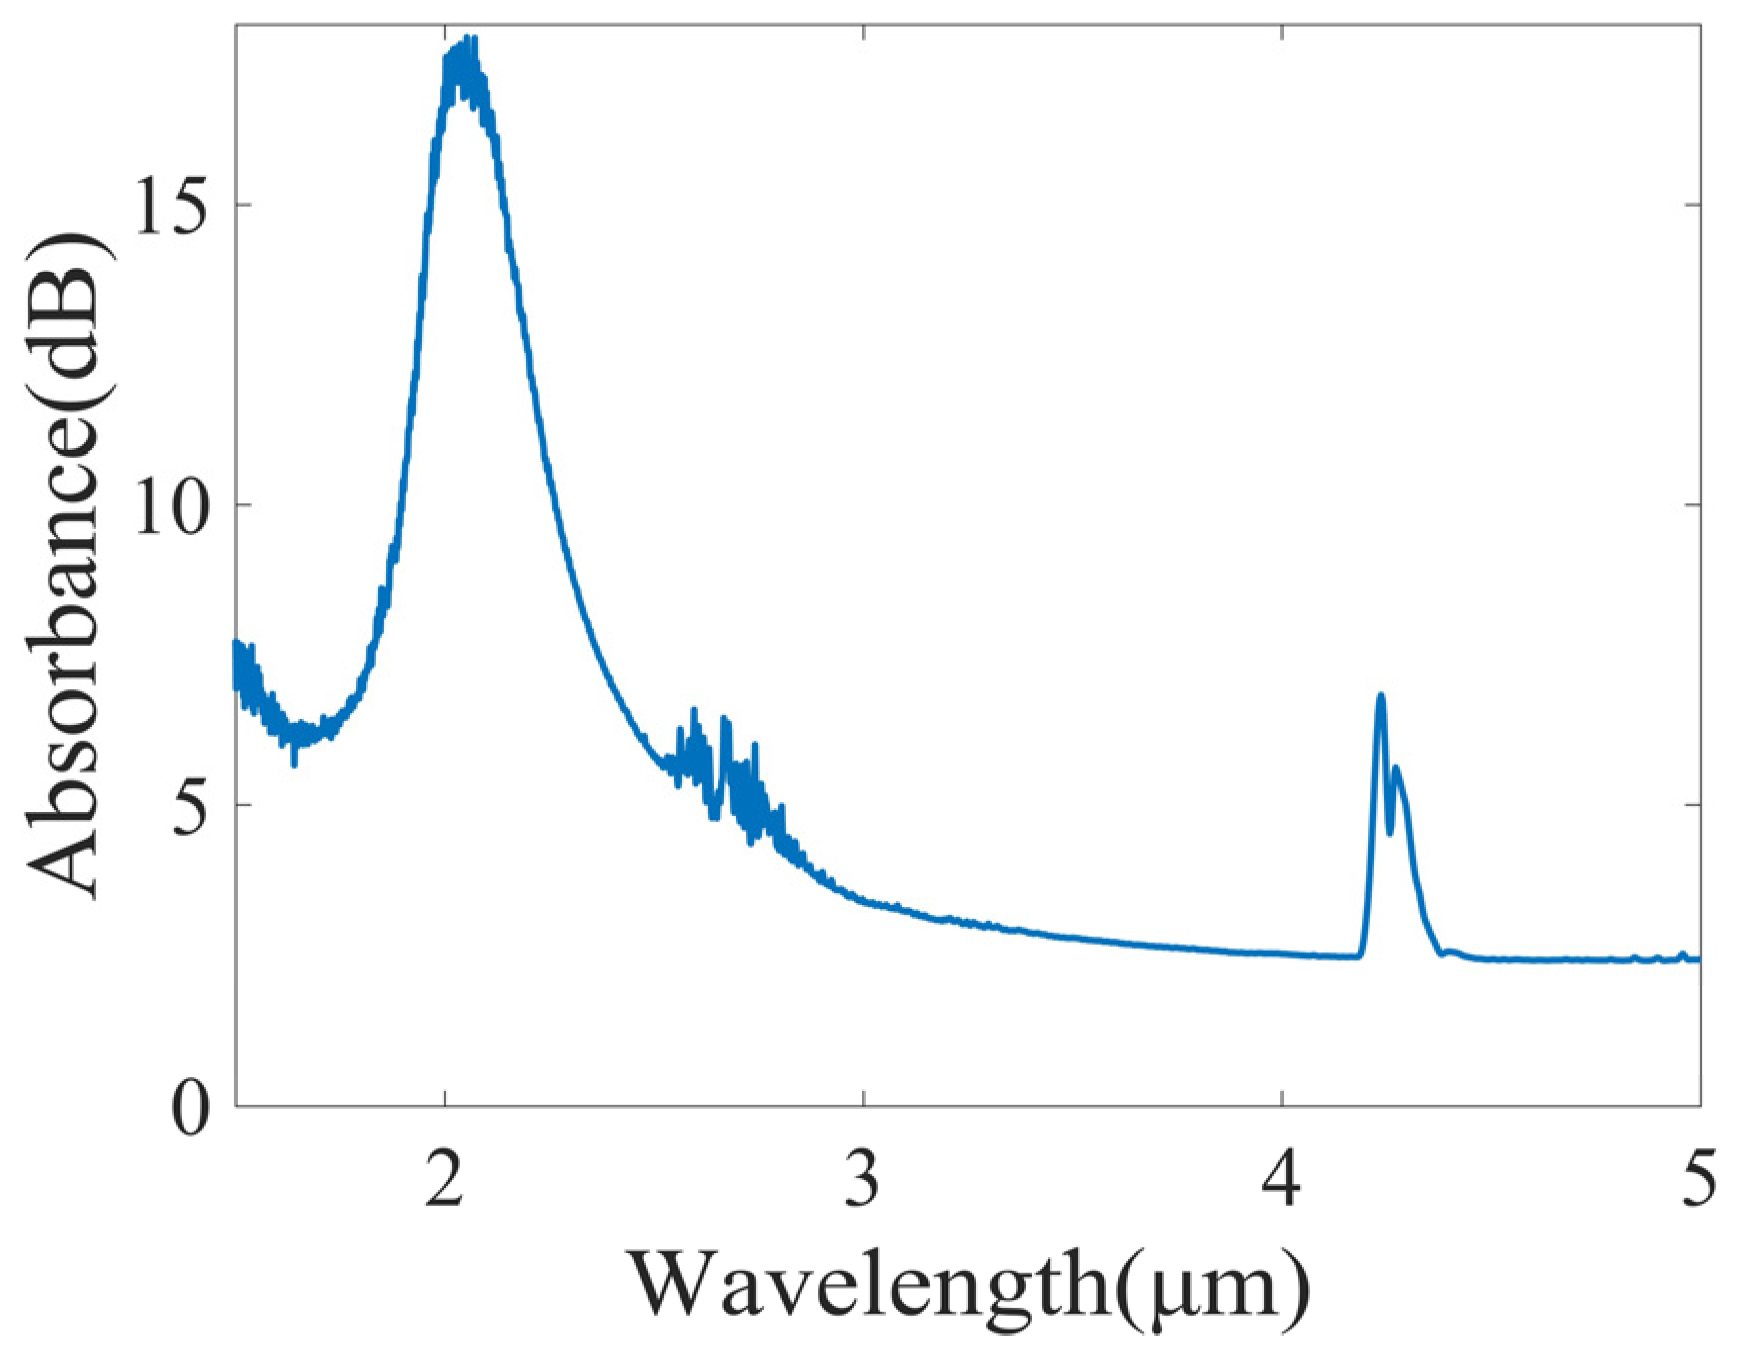
The optical sensing module mainly consisted of an infrared light source, a detector, and a HWG absorption cell. The light source was a commercial mid-infrared broadband light source (Axetris, EMIRS200, Sarnen, Switzerland). It emits light at wavelengths of 2–14 μm, covering the characteristic absorption bands of CH4 (3.2–3.6 μm), C2H6 (3.3–3.6 μm), and C2H4 (3.1–3.5 μm). The detector (Infratech, LFP-3144(C)-337, Dresden, Germany) was a pyroelectric detector with a tunable FP filter. The detection wavelength range is 3.1–4.4 μm, and the wavelength resolution is approximately 68–85 nm. The HWG functions as both a transmission medium for mid-infrared light and a gas absorption cell. It has the advantages of low loss, small size, flexibility, and fast response. This system used an Ag/AgI HWG with an inner diameter of 4 mm and a length of 110 cm. Figure 2 presents the measured loss spectrum of the HWG in the mid-infrared band. As can be seen, the loss of the HWG in the detection band of 3.1–4.4 μm is low. The loss peak at 4.3 μm in the loss spectrum is the intrinsic absorption of CO2 in air, and the peak at 2 μm is the interference peak of the AgI film. The mid-infrared light emitted by the broadband light source was directly coupled into the HWG through a 3D-printed jointer. The mid-infrared light was transmitted in the HWG and absorbed by the gas. Then it was directly coupled through another jointer and detected by the FP detector.
The control module was composed of a computer and controller boards (Infratech, FPI-EvaIKit, Dresden, Germany). The controller board was linked to the computer and a secondary controller board that controls the light source and detector. The computer was responsible for regulating the drive current of the light source and configuring the parameters of the FP detector. It received the signal detected by the detector. The operational wavelength band of the detector configured in this work is 3.1–4.2 μm, with a scanning step of 0.02 μm. A single scan cost 43 s, encompassing a total of 56 data points.
The gas sampling module consisted of a multi-component dynamic gas dispenser (National Institute of Metrology, MF-4B, Beijing, China), three mass flow controllers (HORIBA, S600-BR222, Shanghai, China), and a mixing tube. The output gas of each mass flow controller was connected to the mixing tube and flowed into the HWG. The computer controlled the output gas flow rate of each mass flow controller. This gas sampling system was capable of receiving four types of gases, one of which is pure nitrogen (N2). Consequently, it was capable of achieving a mixed configuration of three gases. The standard gases utilized in this work were high-purity N2 gas (N2 ≥ 99.999%, H2O ≤ 3 ppm, CO2 ≤ 1 ppm, Chemical Center of Fudan University, Shanghai, China), as well as standard 3000 ppm CH4 gas, standard 3000 ppm C2H6 gas, and standard 3000 ppm C2H4 gas (Air Liquide, Shanghai, China).

2.2. Principle

2.2.1. Lambert–Beer’s Law

The basic principle of IR gas sensors is Lambert–Beer’s law, written as follows:
A = l n I 0 ( ν ) I t ( ν ) = σ ( ν ) · L · C
where A is the absorbance (dB), I0 is the incident light intensity, It is the transmitted light intensity, σ(ν) is the absorption cross-section of the gas (cm2/molecule), L is the optical path length (cm), and C is the measured gas concentration (molecule/cm3).
According to Lambert–Beer’s law, the absorbance is linearly related to the concentration of the gas when light scattering and the effects of the system itself are excluded, and the optical path length is fixed. Therefore, the absorbance spectrum can be utilized to directly calculate the concentration of the gas.

2.2.2. Support Vector Machine Regression

The sensing system established in this work is capable of detecting multiple gases within a specific spectral range in a simultaneous manner. However, the measured spectrum is a superposition of multiple gas absorption spectra due to the low wavelength resolution of the FP detector, especially for gases with characteristic absorption bands that are close to or overlap. Therefore, it is not possible to directly calculate the concentration of each gas from the superimposed absorption spectrum of the mixed gases. Figure 3a shows the absorption line strength of CH4, C2H6, and C2H4 from the HITRAN database. Figure 3b presents the measured spectra of CH4, C2H6, and C2H4 separately, as well as their mixture, utilizing the sensing system established in this work. It is evident that the characteristic absorption bands of the three hydrocarbon gases overlap to a significant extent. To address the challenge, a nonlinear mapping algorithm, known as the SVM, was employed to construct a nonlinear model. This model utilizes the absorption spectra of the mixed gases to calculate the concentration of each of the three gases.
SVM has the advantages of being versatile, robust, and computationally simple. With training data H = {(xi,yi)}, i = 1, 2…n, where xi is the input quantity and yi is the corresponding output quantity, there is a fitting function, written as follows:
f ( x ) = ω , x + b
where ω is a hyperplane in space and b is a bias.
In a nonlinear problem, the training data, xi, are preprocessed by mapping Φ: X → F onto a high-dimensional feature space F. At this point, the expression of f(x) is as follows:
f ( x ) = ω , Φ ( x ) + b
According to the principle of structural risk minimization, this optimization problem can be formulated equivalently as follows:
m i n 1 2 w 2 + c i = 1 n ( ξ i + ξ i * ) s . t . y i ω , Φ ( x i ) b ε + ξ i ω , Φ ( x i ) b y i ε + ξ i * ξ i + ξ i * 0 ( i = 1,2 , , n )
where n is the number of samples, c is the penalty factor, ξ is the relaxation factor, and ε is the insensitivity parameter, which is used to reflect the model’s tolerance of errors.
By introducing the Lagrange multiplier, the dual problem of the above problem can be obtained as follows:
m a x [ 1 2 i , j = 1 n ( α i α i * ) ( α j α j * ) Φ ( x i ) , Φ ( x j ) i = 1 n α i ( ε y i ) i = 1 n α i * ( ε + y i ) ] s . t . ( α i α i * ) = 0 0 α i , α i * c ( i = 1,2 , , n )
The above optimization problem is solved using quadratic programming in optimization theory to obtain the parameters αi and αi*.
The final calculated predicted output is written as follows:
f ( x ) = i = 1 n ( α i α i * ) Φ ( x i ) , Φ ( x ) + b
A kernel function k that satisfies Mercer’s theory is introduced to map the input space to a high-dimensional feature space that is separable or approximately separable. An SVM-based feature model is obtained by quadratic optimization in the feature space, and the fitting function can be expressed as follows:
f x = i = 1 n α i α i * K ( x , x i ) + b
Since the quantitative analysis of mixed gases involved in this paper is a nonlinear modeling problem, the radial basis function (RBF) kernel function, which has the best nonlinear fitting effect, is selected as the kernel function for SVM modeling. Its expression is written as follows:
K x , x i = e x p g x x i 2
where g is a parameter of the kernel function and g > 0.
The topological structure of the SVM algorithm is shown in Figure 4. Where X is the input variable, K is the kernel function, Y is the output, and b is the bias.

2.2.3. Evaluation Parameters for SVM

The root mean square error of calibration (RMSEC) is used to evaluate the fitting accuracy of the SVM model.
R M S E C = i = 1 n ( y i y i ) 2 n
where n is the number of samples used for training, yi is the actual value of the ith sample, and yi’ is the correction value of the ith sample.
The smaller RMSEC value means the higher fitting accuracy of the model.
The root mean square error of prediction (RMSEP) is used to evaluate the prediction accuracy of the SVM model.
R M S E P = i = 1 m ( y i y i ) 2 m
where n is the number of samples used for prediction, yi is the actual value of the ith sample, and yi’ is the predicted value of the ith sample.
The smaller RMSEP value means the higher prediction accuracy of the model.

3. Results and Discussion

3.1. Measurement and Analysis of Single-Component Gas

To evaluate the detection performance of the system, measurements were firstly carried out with single-component gas.
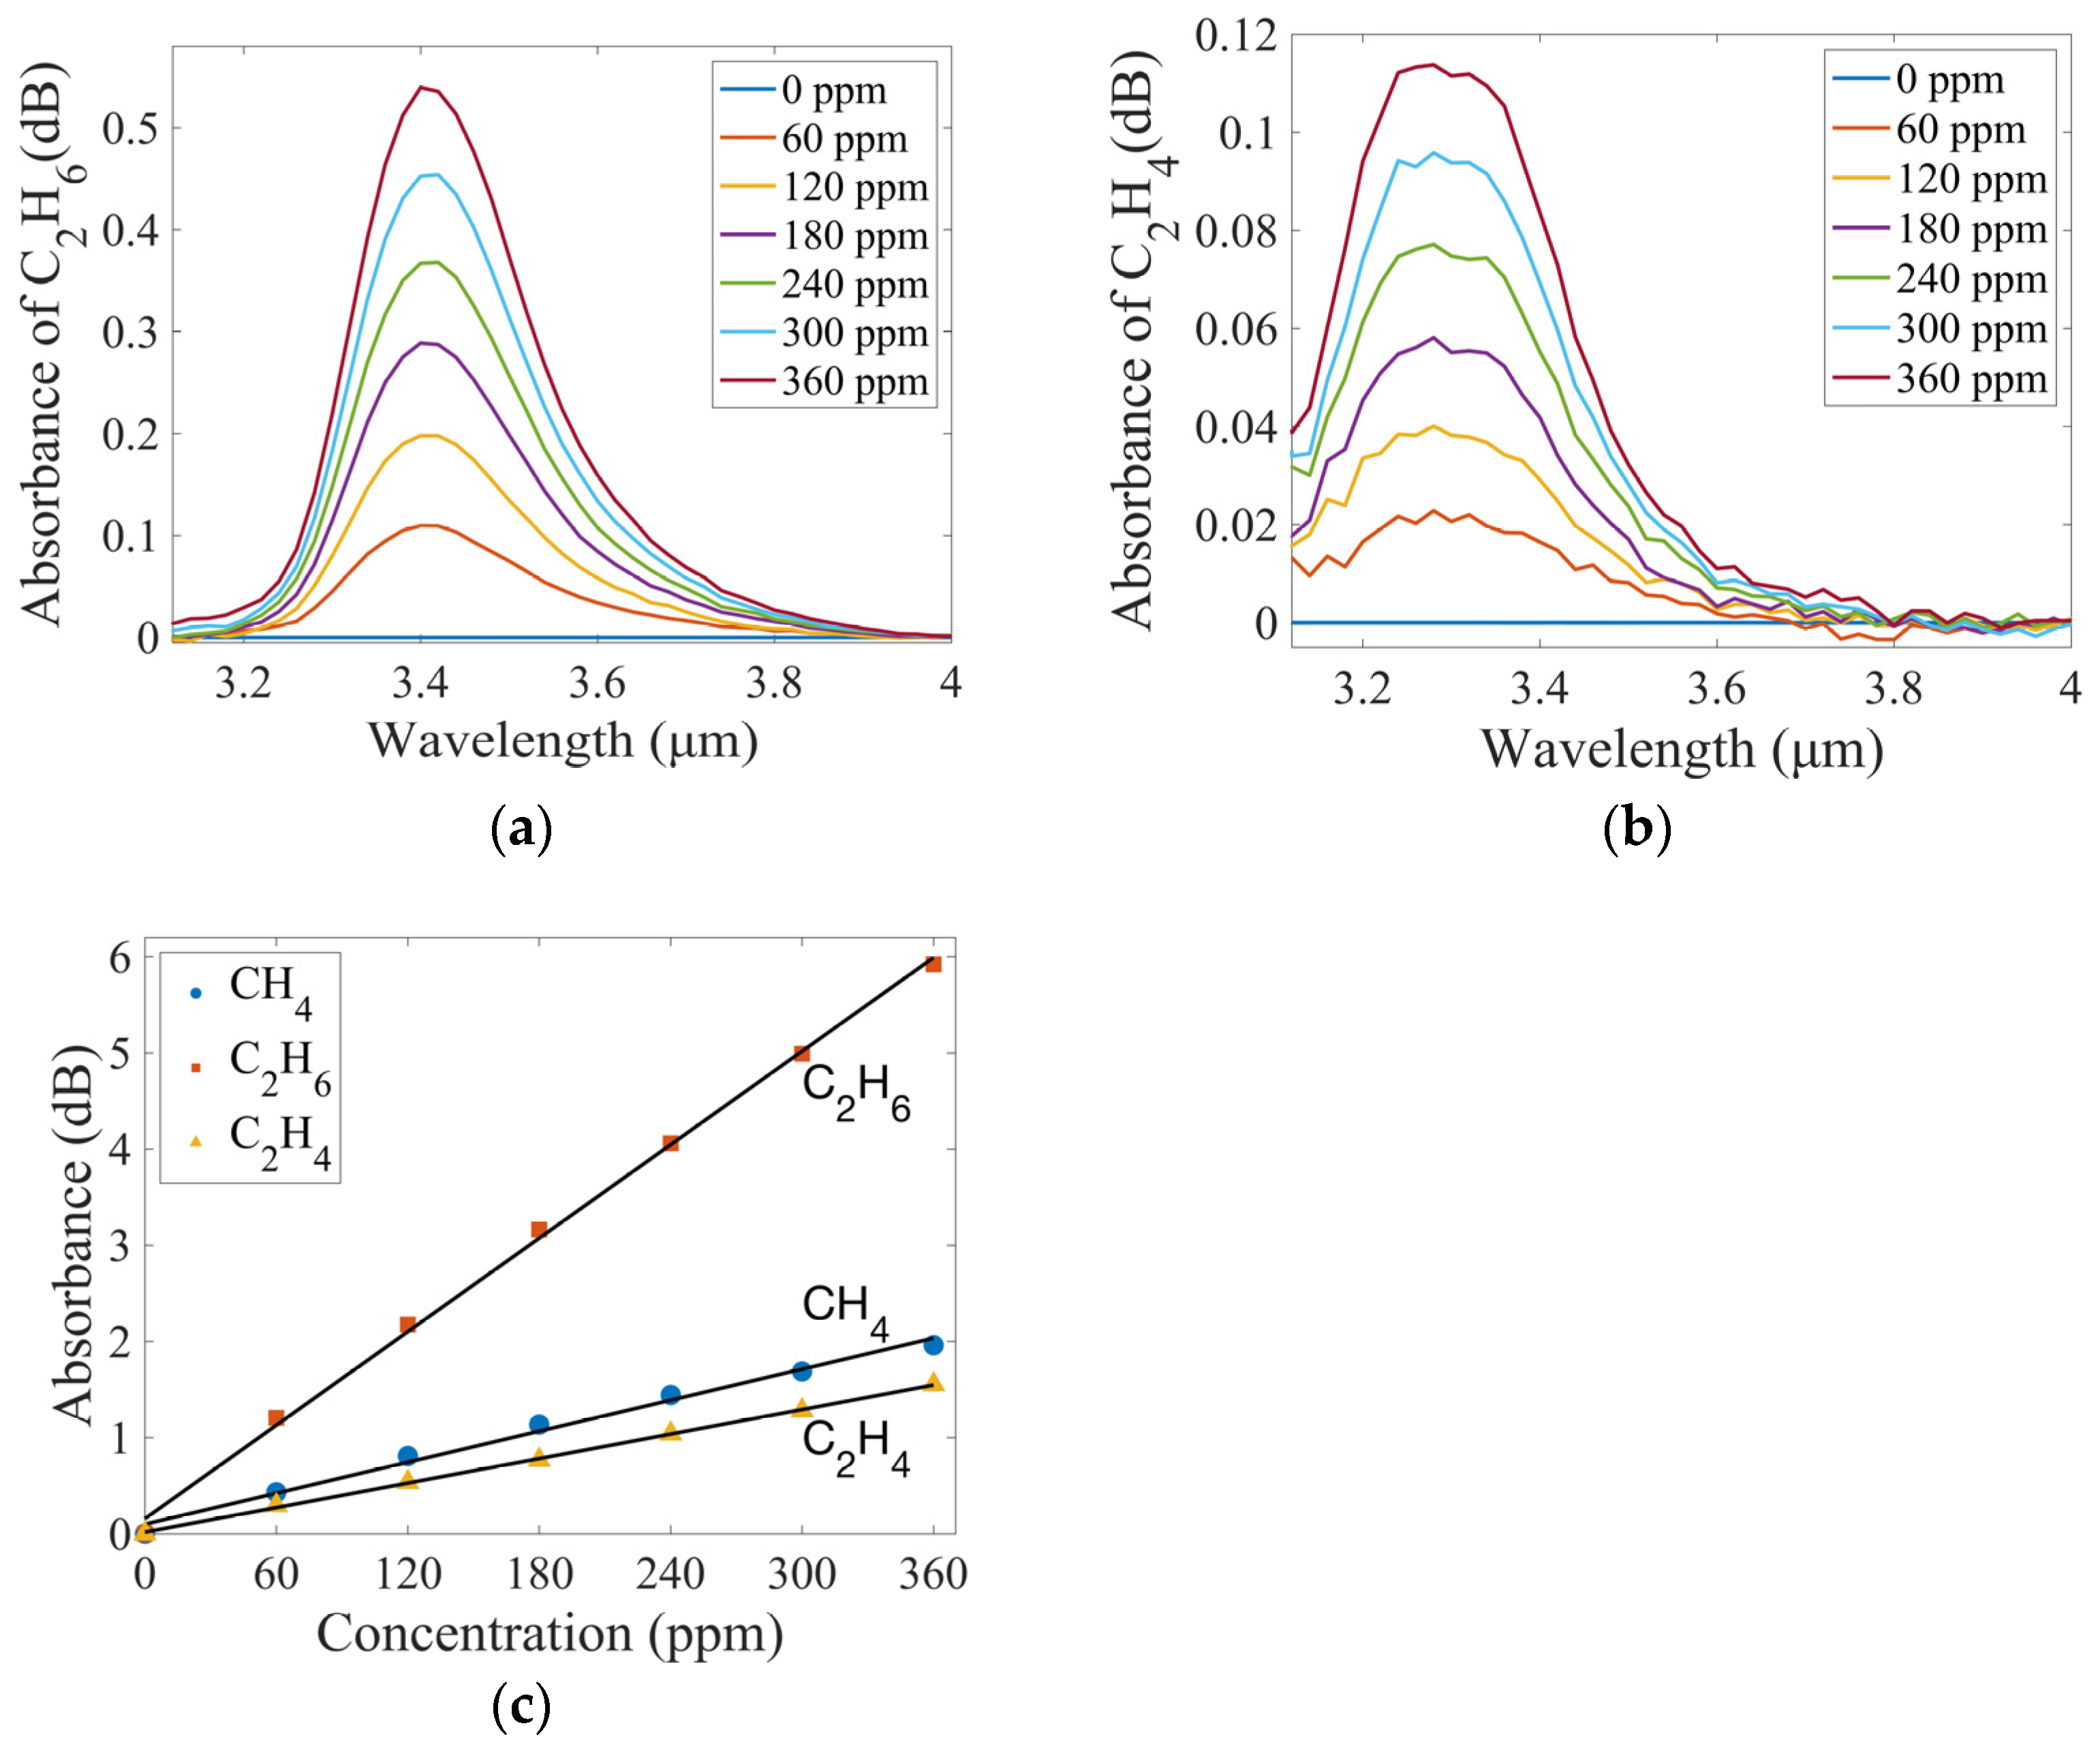
First, the concentration of CH4 was controlled by the gas sampling module, and the range of variation was 0–360 ppm with a variation interval of 60 ppm. The absorbance spectrum of each gas concentration was measured five times and averaged. Baseline calibration was performed using the method described in Equation (11).
A c = A i = 1 k A i k
where Ai is the absorbance value of the selected reference band for spectral baseline calibration, which is usually a band without gas absorption. In this paper, 4.0–4.2 μm is selected as the reference band. k is the number of data points in the reference band, A is the absorbance value before calibration and AC is the absorbance value after calibration.
A comparison of the gas absorption spectra before and after baseline calibration is shown in Figure 5. It can be seen that this method can solve the baseline drift problem very well.
In this work, the absorption peak summation method was used to calculate the absorbance of the gas. After obtaining the absorption spectrum of CH4 at a given concentration, the absorbance of CH4 at each wavelength point in the range of 3.18–3.56 μm was summed to obtain the absorbance of the gas at that concentration. The gas concentration was fitted to the corresponding absorbance value using a polynomial and the least squares method was used to determine the slope and intercept. The relationship between gas concentration and absorbance is shown in Figure 6c, which is linear. Equation (12) is the fitting equation, and the correlation coefficient R-squared is 0.9904, written as follows:
A C H 4 = 0.0054 × c C H 4 + 0.0998
By using the same measurement and analysis methods, the concentration changes of C2H6 and C2H4 were configured. The absorption spectra of C2H6 and C2H4 are shown in Figure 6a,b. Based on the absorption characteristics of each gas, the wavelength range where the absorbance of C2H6 is summed was 3.3–3.6 μm, and the wavelength range of C2H4 was 3.14–3.48 μm. The linear relationship between gas concentration and absorbance is also shown in Figure 6c. The fitting equations are given in Equations (13) and (14). The R-squared values are 0.9981 and 0.9993, respectively.
A C 2 H 6 = 0.0162 × c C 2 H 6 + 0.1572
A C 2 H 4 = 0.0042 × c C 2 H 4 + 0.0179
Limit of detection (LOD) is used to evaluate the performance of a gas sensing system.
L O D = 3 σ s
where σ is the standard deviation of the measured spectra of the blank signal (pure N2) and s is the sensitivity, which is the slope of the curve fitted to the absorbance and gas concentration.
The standard deviation was calculated by measuring 10 blank signals with pure N2. Then, combined with the sensitivity of the system for the three gases in Figure 6c, the LODs of the system for CH4, C2H6, and C2H4 were calculated to be 7.33 ppm, 2.13 ppm, and 8.09 ppm, respectively. Linear regression analysis shows that the R-squared values for CH4, C2H6, and C2H4 were 0.9904, 0.9981, and 0.9993, respectively. This indicates that the sensing system established in this work has high linear performance and can detect gases at ppm level.
The related research on multi-gas detection based on FRES and IR in recent years is summarized in Table 1. Compared with the FRES system, the proposed system has the advantages of low cost, small size, simple structure, and easy maintenance. Compared with other IR systems that use broadband light sources and pyroelectric detectors, the proposed system has higher detection accuracy. The proposed system achieves a compromise between cost and performance.
Table 1. Summary of related research on multi-gas detection based on FERS and IR.
MethodTarget GasDetection Limit/
Detection Error
ReferenceYear
FERSCH43 ppm[11]2020
H249 ppm
FERSCH41.2 ppm[12]2022
C2H62.9 ppm
C2H41.6 ppm
C2H22.7 ppm
H213.8 ppm
CO16.7 ppm
FERSCH41.5 ppm[13]2023
C2H44.8 ppm
C2H23.1 ppm
CO29.4 ppm
CO1 ppm
IRCH4500 ppm[14]2020
CO2100 ppm
CO500 ppm
IRCH463 ppm[15]2020
CO22 ppm
CO11 ppm
IRCH4−0.34%~−0.77%[16]2024
CO2−0.40%~−0.26%
N2O−0.81%~−0.32%
IRCH47.33 ppmThis work-
C2H62.13 ppm
C2H48.09 ppm

3.2. Measurement and Analysis of Mixed Gases

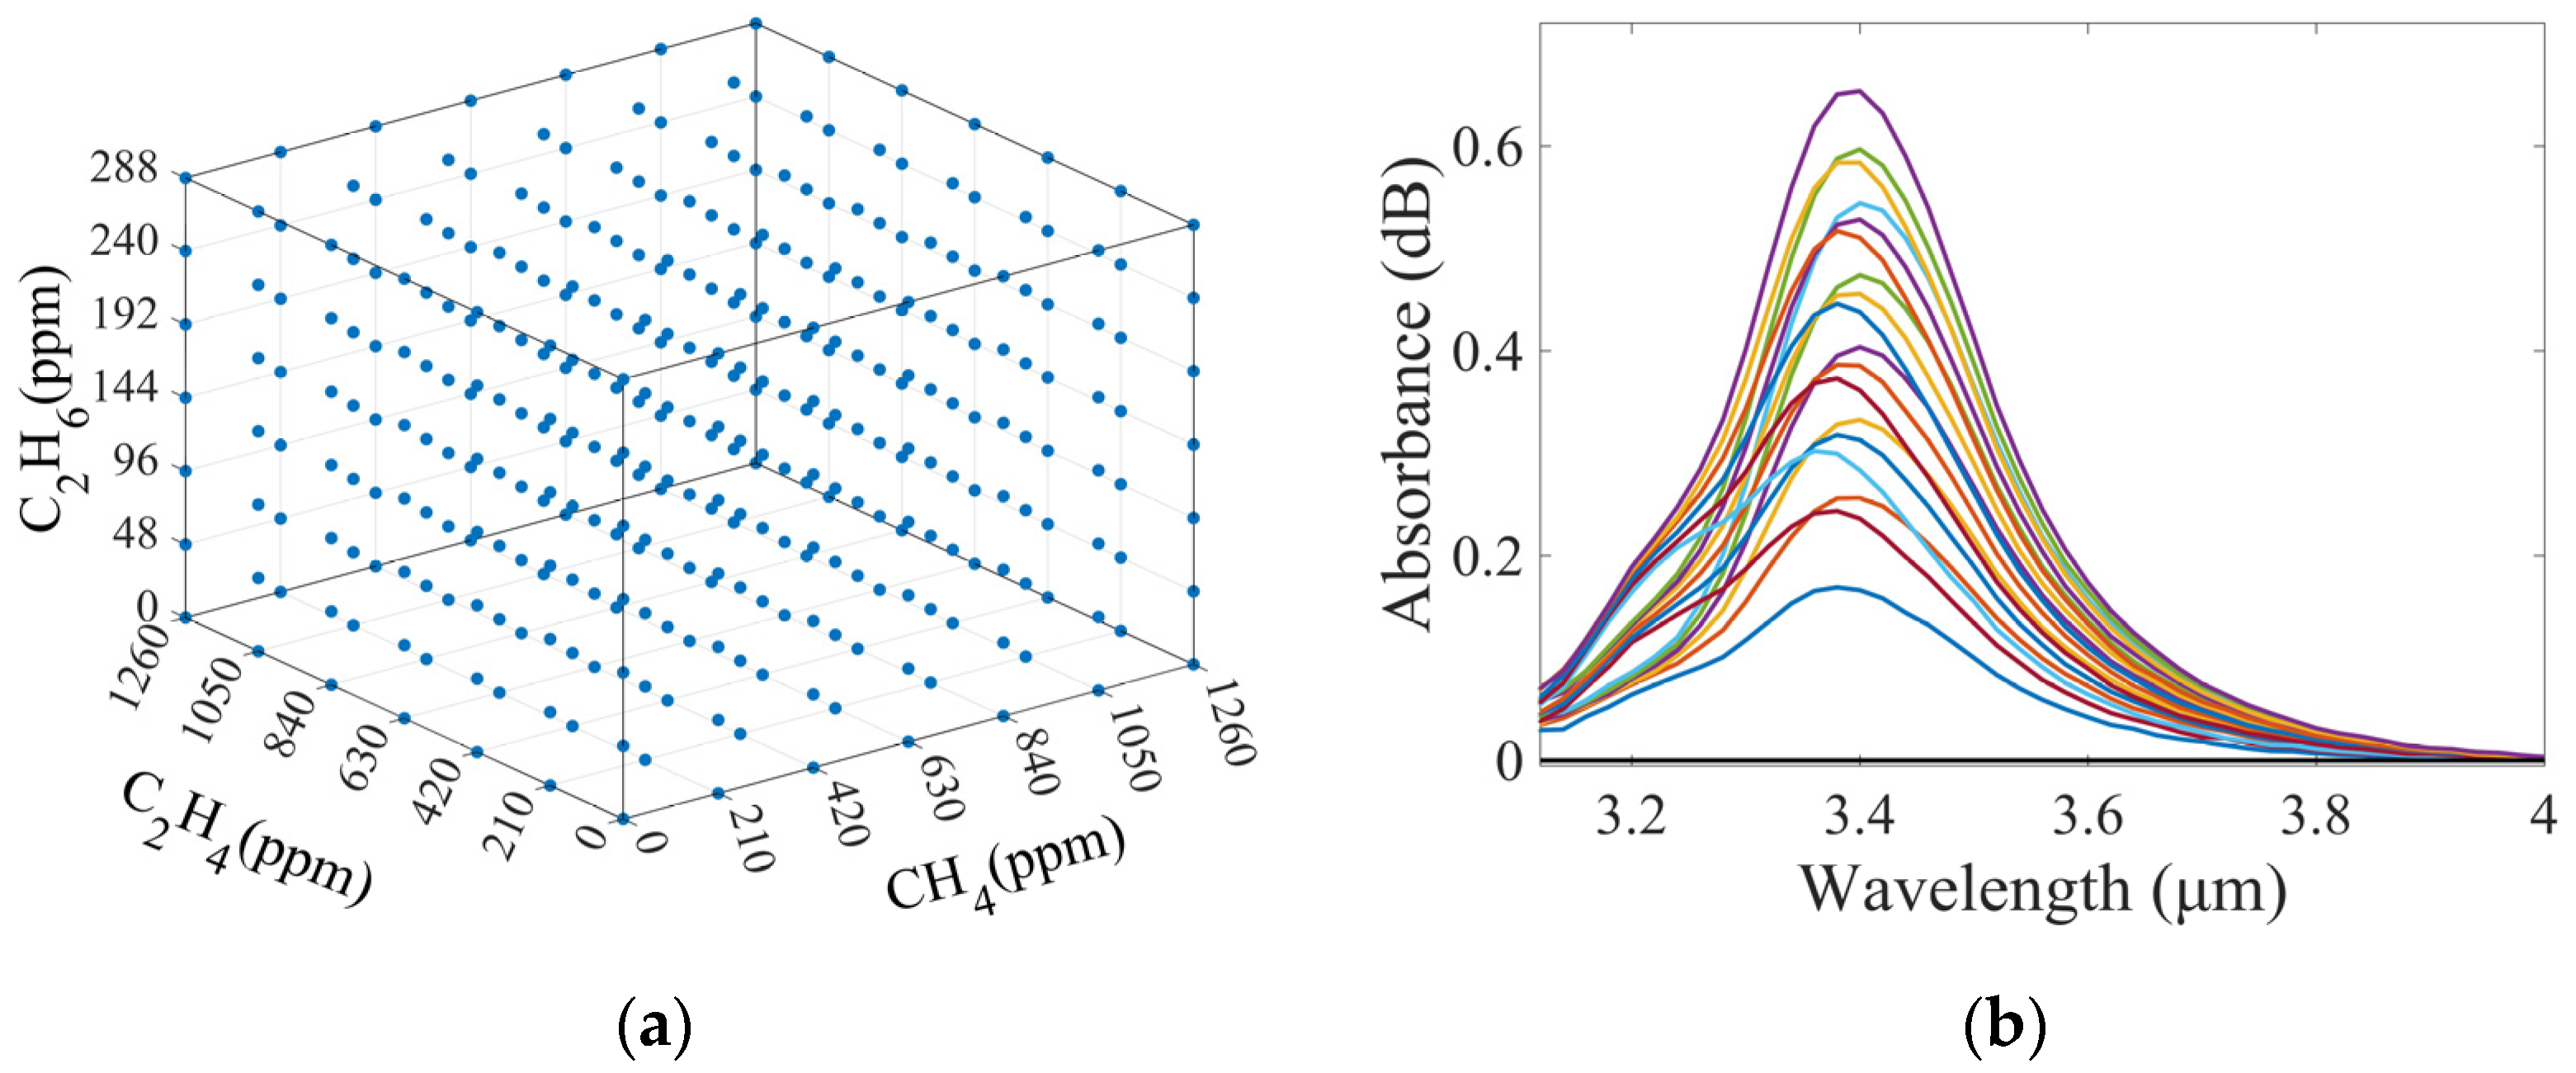
In the experiment, the flow rate of three standard gases was adjusted by the gas sampling system, and high-purity N2 gas was used for dilution to prepare gas mixture samples with different concentration combinations. The concentration range of CH4 was 0–1260 ppm, with an interval of 210 ppm, for a total of seven concentration data points. The concentration range of C2H6 was 0–288 ppm, with an interval of 48 ppm, for a total of seven concentration data points. The concentration range of C2H4 was 0–1260 ppm, with a concentration interval of 210 ppm, for a total of seven concentration data points. The concentrations of the three gases were mixed and configured to provide a total of 7 × 7 × 7 = 343 different concentration combinations of CH4, C2H6, and C2H4 gas mixture samples. The concentration configurations of the 343 samples are shown in Figure 7a.
Each concentration combination was measured three times to obtain the absorption spectra. The data were then baseline calibrated and averaged. Typical measured absorption spectra are shown in Figure 7b. Due to the low wavelength resolution of the FP detector used in the system, samples containing a mixture of CH4, C2H6, and C2H4 gases exhibit a superposition of absorption spectra in the measured spectra. Therefore, it is difficult to directly extract the spectral information of each component gas from the measured spectra to calculate the concentration of each gas. Hence, the SVM algorithm was used to calculate the concentration of multi-component gases with such spectral superposition.
The sensing system is capable of detecting a wavelength range of 3.1–4.2 μm, with a step of 0.02 μm and a total of 56 data points scanned. Based on the gas absorption line strength obtained from the HITRAN database (see Figure 3a) and the measured absorption spectra (see Figure 3b), 45 data points in the 3.12–4.0 μm wavelength range were finally selected for SVM model training. After baseline calibration and selection of the spectral wavelength range, the spectral data matrix X and concentration data matrix Y for modeling were formed.
X = x i j = x 11 x 1 n x m 1 x m n Y = y i j = y 11 y 1 m y p 1 y p m
where m is the number of samples, n is the number of data points, p is the number of components, xij is the absorbance value of the jth sample at the ith data point, and yij is the concentration value of the ith component in the jth sample.
After standardizing the matrix X and Y, they can be used to train the SVM model. The penalty factor c and the kernel function parameter g were initialized. If the former is relatively large and the latter is relatively small, the established model will be more complex and tend to be overfitting; if the former is relatively small and the latter is relatively large, the established model will be simpler and tend to be underfitting. The optimal penalty factor c and kernel function parameter g were determined using 5-fold cross-validation, and the model was trained using the optimal parameters.
In order to evaluate the performance of the established SVM model, the leave-one-out cross-validation method was used to train and evaluate the SVM model using 343 sets of measured spectra. The RMSEC and RMSEP values of CH4, C2H6, and C2H4 are shown in Table 2.
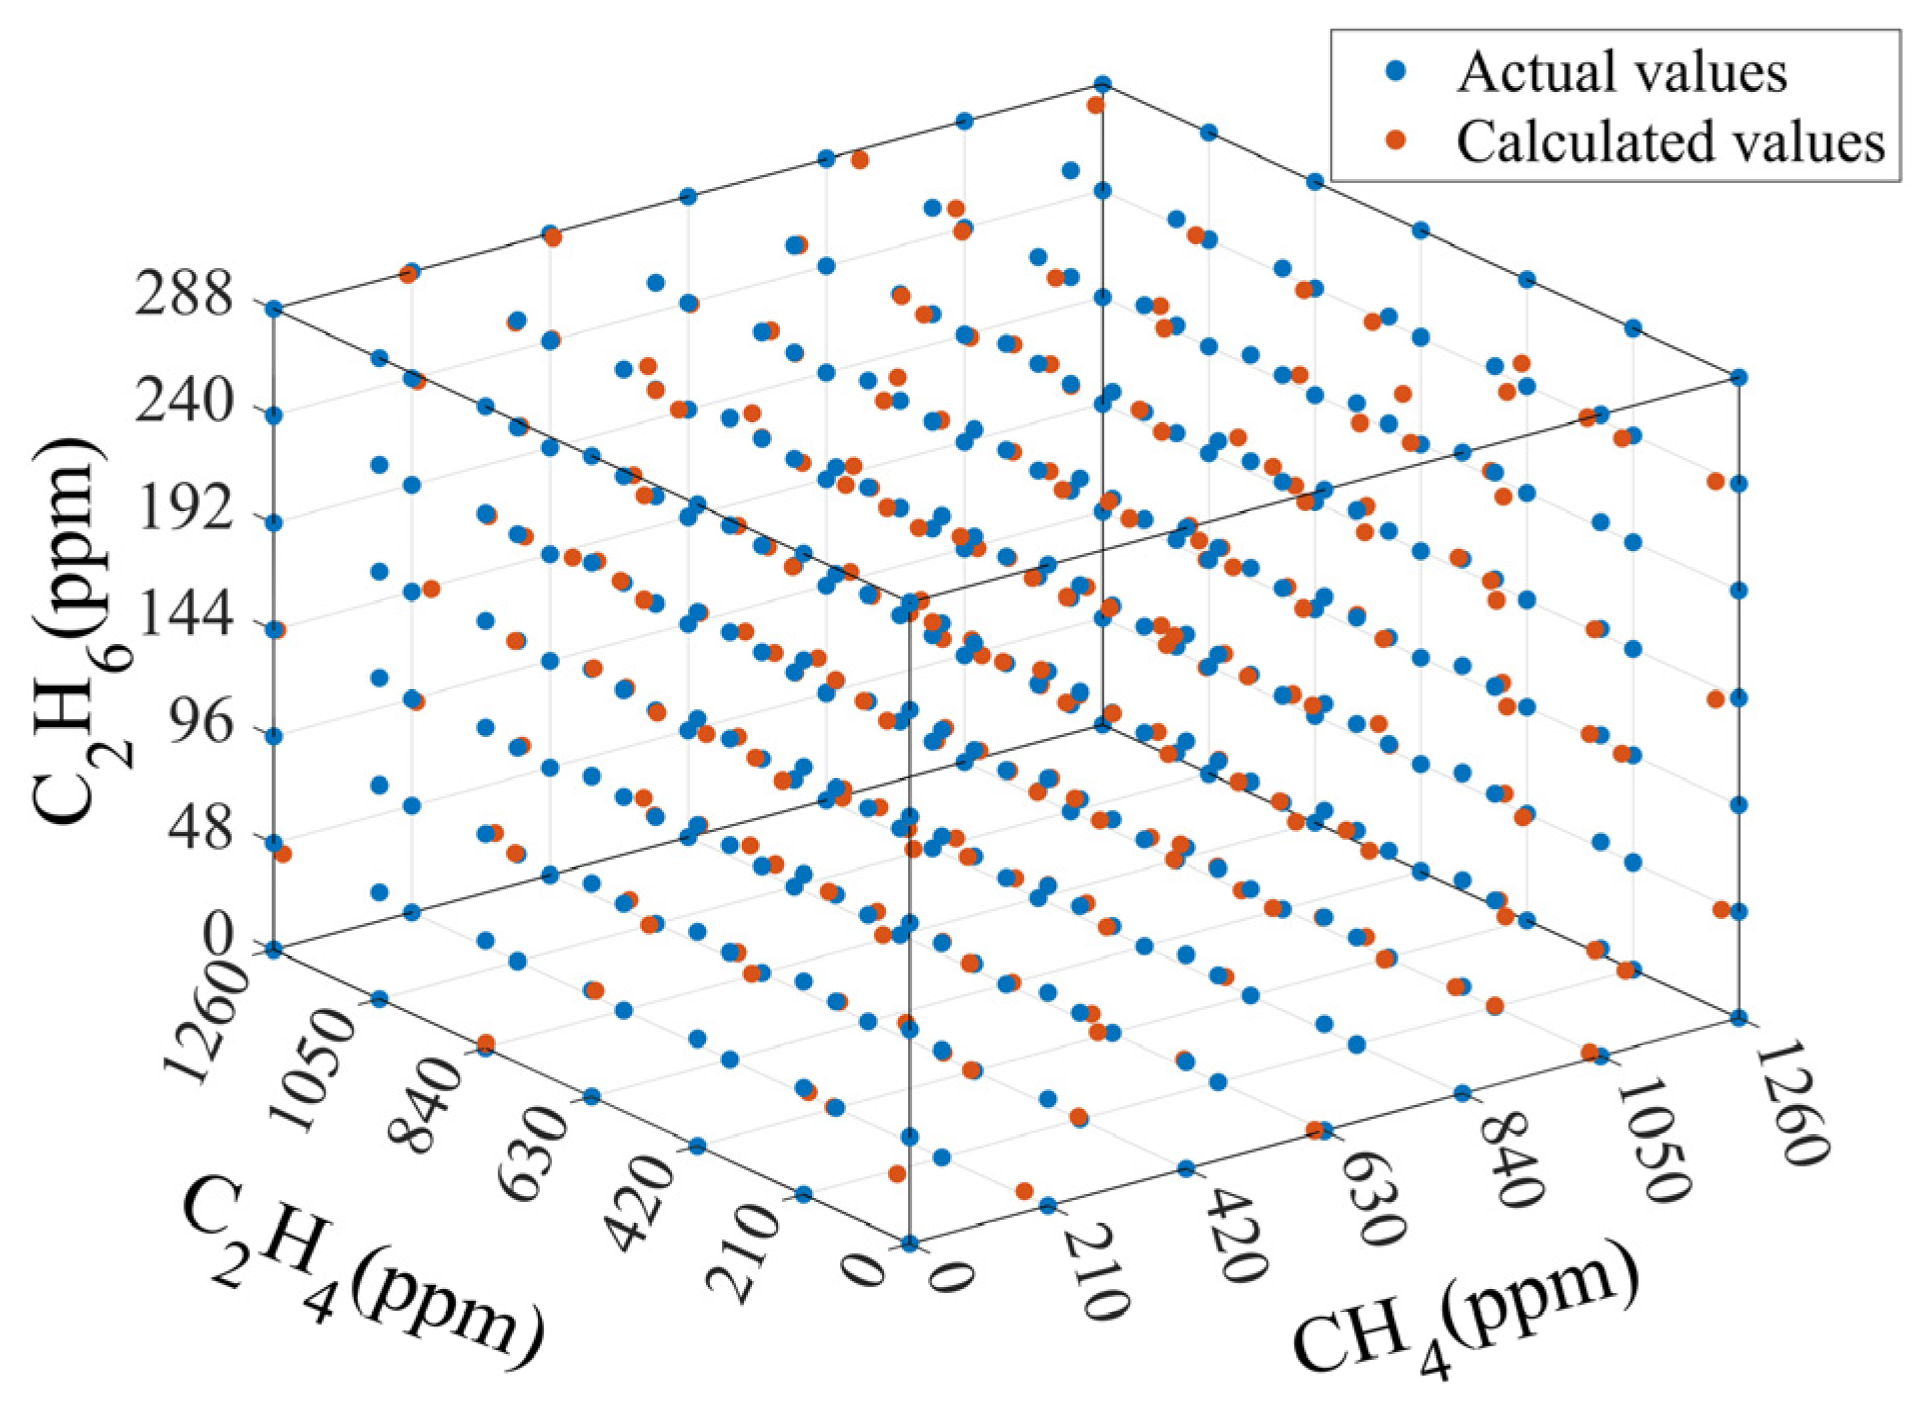
The RMSEC values for CH4, C2H6, and C2H4 are 9.97 ppm (0.79%), 0.36 ppm (0.13%), and 1.47 ppm (0.12%), respectively. None of them exceeds 0.79% of the full scale of each component. These values demonstrate that the SVM algorithm is capable of performing model fitting with a high degree of accuracy. The RMSEP values for CH4, C2H6, and C2H4 are 15.91 ppm (1.26%), 1.64 ppm (0.57%), and 6.95 ppm (0.55%), respectively. None of them exceeds 1.26% of the full scale of each component. This indicates that the concentration values calculated by the SVM algorithm have very little error compared to the actual values. A comparison of the actual concentration values of each sample with the calculated values is shown in Figure 8. The results demonstrate the SVM algorithm’s effectiveness in addressing the spectral superposition problem of the three gases.
The RMSEP value of CH4 is the worst, which may be because the characteristic absorption peak of CH4 is most severely affected by infrared spectral overlap in the 3.1–4.0 μm band. In addition, as SVM can only output one dimension at a time, three models are required to calculate the concentration of these three gases. When modeling, different parameter choices can result in different RMSEP values. Therefore, meticulous parameter tuning is required.

3.3. Simulation-Assisted Training

3.3.1. Generation of Simulated Spectra

The SVM algorithm has been demonstrated to be an effective solution for the quantitative analysis of mixed gases with spectral superposition of CH4, C2H6, and C2H4. However, a large number of measured spectra were required to train the model. In order to improve measurement efficiency, this work proposes a method of generating a large number of simulated spectra from a small number of measured spectra. Then the model can be trained by using a large amount of generated spectra.
In the first step of the process, the spectrum of a single gas is generated. The absorption spectrum is calculated according to Equation (1). The optical path length is the length of the HWG. The absorption line strength of CH4 can be obtained from the HITRAN database. And the absorption cross-section can be calculated by converting the absorption line strength. At least one measured absorption spectrum with a known concentration is necessary to derive the parameters such as the divergence angle of the light source and the FP filter properties required for the simulation. Then, a group of simulated CH4 spectra at different concentrations can be obtained by changing the gas concentration in the simulation. To improve the accuracy of simulations, a correction factor δ is introduced to correct the error between the simulated and measured spectra of CH4 for a group of uniformly distributed concentrations, as shown in Equation (18). Therefore, a minimum of two different concentrations within the concentration measurement range have to be measured in order to simulate CH4 absorption spectra for a group of uniformly distributed concentrations.
δ ( λ ) = ( S i ( λ ) M i ( λ ) S i ( λ ) S j ( λ ) M j ( λ ) S j ( λ ) ) / ( i j )
δ k λ = S j λ M j λ S j λ j k δ λ
A k λ = S k λ × 1 + δ k λ
where Mi and Mj are the measured spectra at the ith and jth concentrations, Si and Sj are the pre-correction simulated spectra at the ith and jth concentrations, Ak is the post-correction simulated spectra at the kth concentration, 2 ≤ i < j ≤ 7, 2 ≤ k ≤ 7.
Spectra of CH4 were measured at concentrations of 840 and 1260 ppm. A group of simulated CH4 spectra was generated from the measured spectra. The concentration of CH4 varied from 0 to 1260 ppm with an interval of 210 ppm. A comparison of the measured and simulated CH4 spectra is shown in Figure 9a.
Similar processes were used to obtain the simulated spectra of C2H6 and C2H4. The spectra of C2H6 at concentrations of 192 and 288 ppm and the spectra of C2H4 at concentrations of 840 and 1260 ppm were measured and used in the simulation. Two groups of spectra were generated, C2H6 concentration varying from 0 to 288 ppm with an interval of 48 ppm and C2H4 concentration varying from 0 to 1260 ppm with an interval of 210 ppm. Comparisons between the measured and simulated spectra of C2H6 and C2H4 are demonstrated in Figure 9b,c, respectively.
As illustrated in Figure 9, the simulated single-gas absorption spectra of CH4, C2H6, and C2H4 are in good agreement with the corresponding measured absorption spectra. Subsequently, the simulated spectra of the mixed gases of CH4, C2H6, and C2H4 can be obtained from the simulated spectra of the single gases.
In the second step of the process, the simulated spectrum of the mixed gases is generated. Theoretical and experimental results have shown that the spectrum of the mixed gases cannot be obtained by simply adding the spectra of each gas due to the non-linear relationship between the absorbance and gas concentration [24]. Equation (20) was used to generate the spectrum of mixed gases and a correction factor δ is introduced to correct the error between the simulated and measured spectrum.
A ( λ )   ( A C H 4 ( λ ) + A C 2 H 6 ( λ ) ) × ( 1 + δ C H 4 C 2 H 6 ( λ ) )   ( A C H 4 ( λ ) + A C 2 H 4 ( λ ) ) × ( 1 + δ C H 4 C 2 H 4 ( λ ) )   ( A C 2 H 4 ( λ ) + A C 2 H 6 ( λ ) ) × ( 1 + δ C 2 H 4 C 2 H 6 ( λ ) )   ( A C H 4 ( λ ) + A C 2 H 6 ( λ ) + A C 2 H 4 ( λ ) ) × ( 1 + δ C H 4 C 2 H 4 C 2 H 6 ( λ ) )
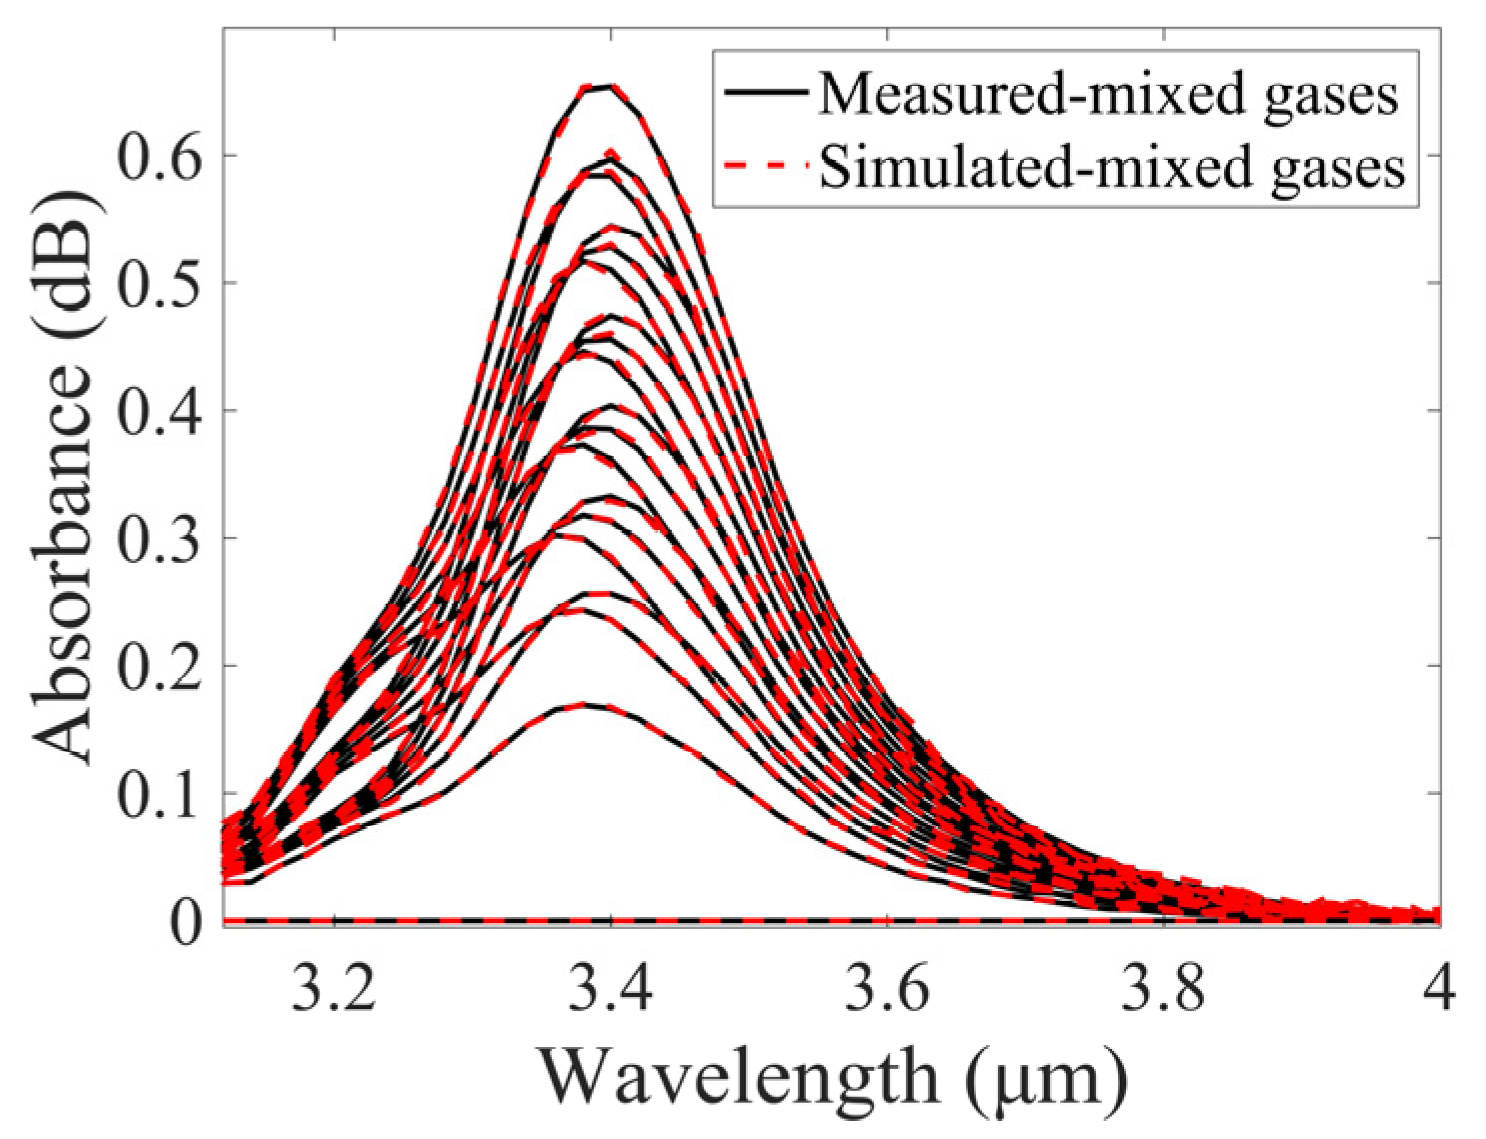
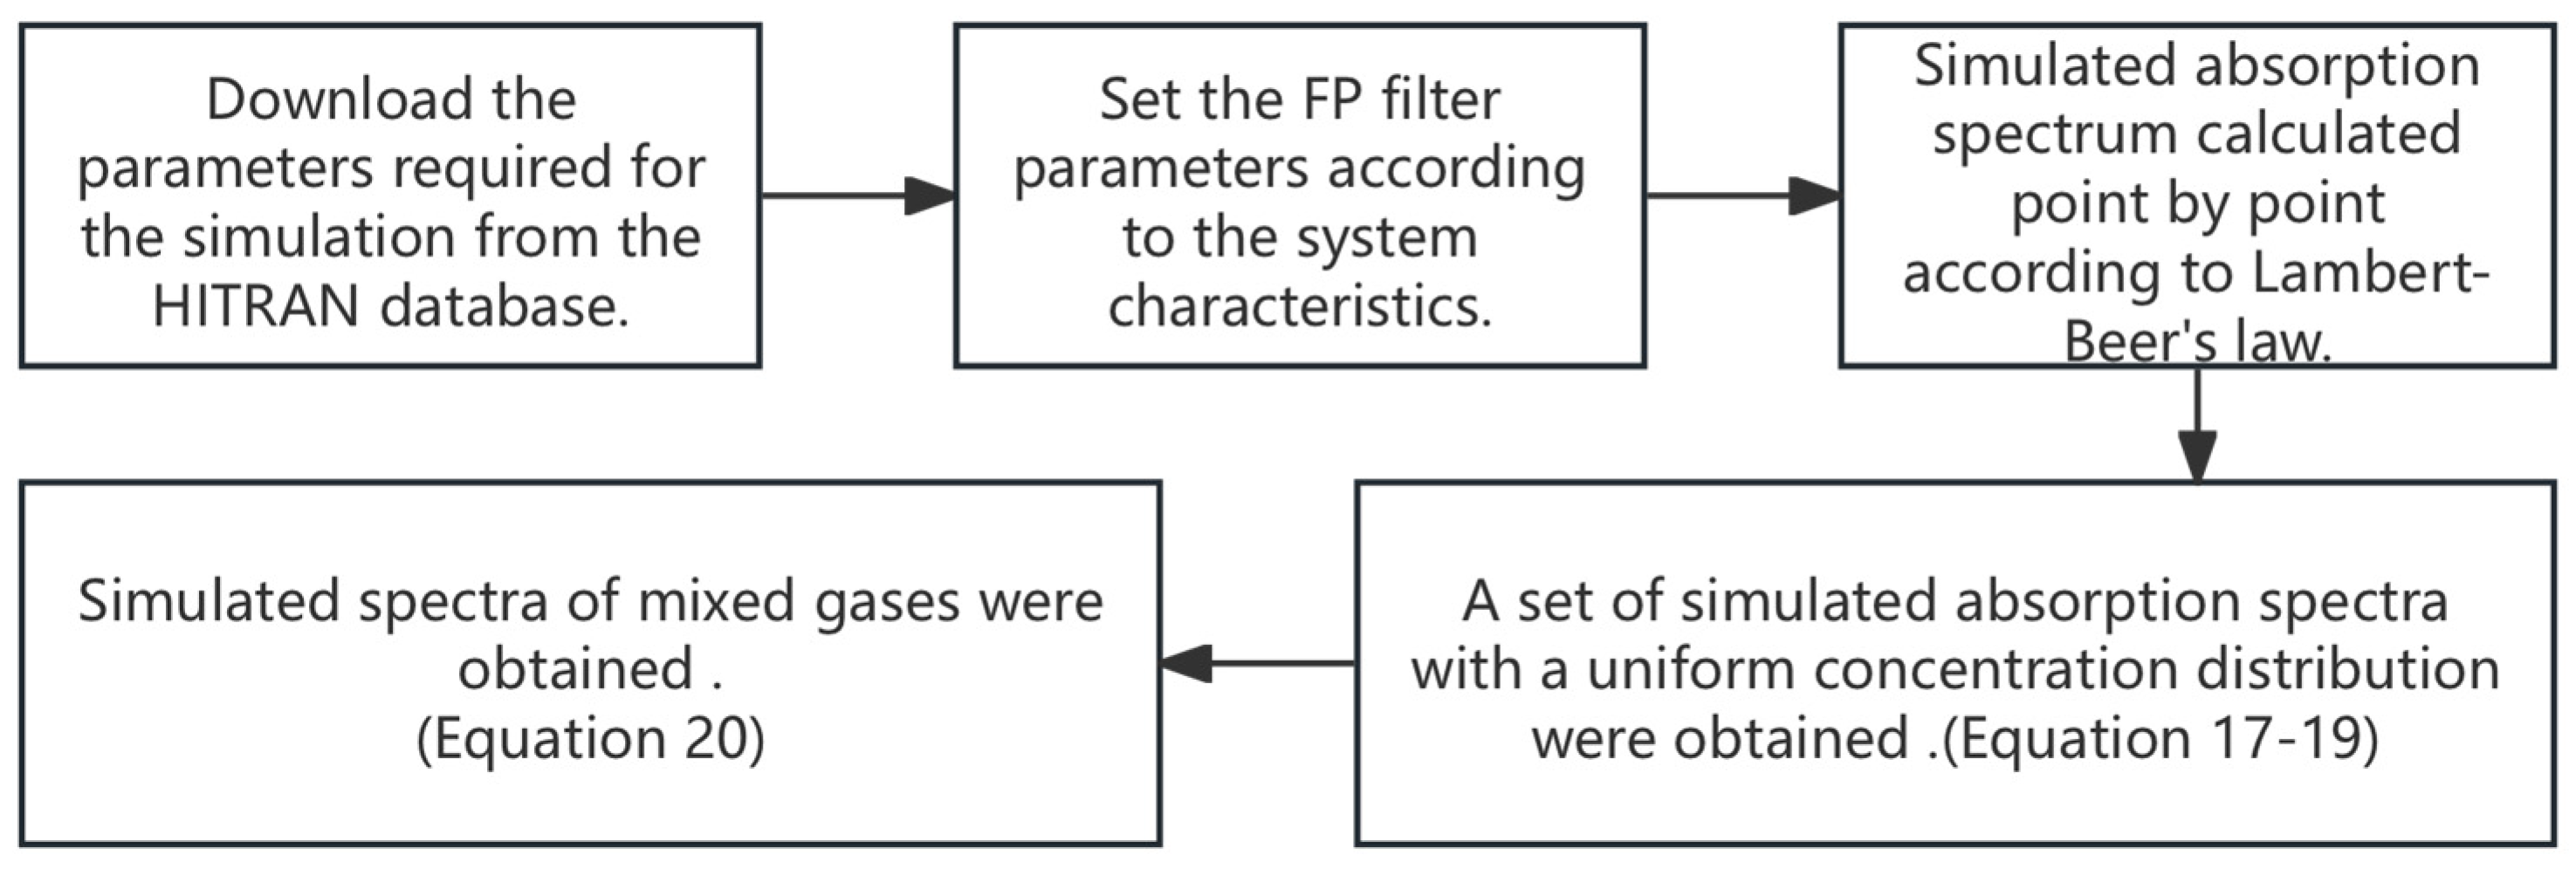
The value of δ needs be determined based on the measured spectrum of the mixed gases and the corresponding summed simulated spectrum. As illustrated in Figure 10, a comparison of the simulated spectra with the measured spectra is presented. It can be seen that there is a high degree of agreement between the two groups of spectra. This means that a small number of measured spectra can be used to generate a substantial number of simulated spectra for training the SVM model. The flowchart for the process of generating simulated spectra is shown in Figure 11.

3.3.2. Selection of Measured Spectra

Based on a limited number of measured spectra, it is possible to generate 343 sets of simulated spectra corresponding to 343 measured ones to train the SVM model. The 343 sets of simulated spectra were used as the training set, and the 343 sets of measured spectra were used as the test set. The RMSEP values of each component were calculated separately.
Considering the index and calibration of the SVM model, the number of measured spectra and the methods of selection of measured spectra will have an impact on the accuracy of the calculation. To this end, a comparative study was conducted in terms of the number of measured spectra and spectra selection methods. In practice, it prefers fewer measured spectra to lower the cost. Certainly, calculations with high accuracy are expected for more measured spectra.
There exist many selection methods even if the number of measured spectra is the same. Figure 12 shows five typical selection methods for 27 measured spectra among 343 concentration combinations. Each small square represents a spectrum of a possible concentration combination, and the darker squares are the measured spectra that were selected. The selections were based on the principle that the measured spectra were relatively concentrated or dispersed within the concentration measurement range. Among them, the concentration distribution was relatively concentrated in the selection methods shown in Figure 12a,e, and the concentration distribution was uniformly dispersed in the selection method shown in Figure 12c.
Figure 13 shows the RMSEP values corresponding to the five selection methods for CH4, C2H6, and C2H4. It can be seen that the RMSEP values were larger when methods a and e were selected, which the concentration distribution of the spectra was relatively concentrated, indicating larger errors between the calculated and actual concentrations. While selection method c with the most uniformly dispersed concentration distribution, resulted in the smallest RMSEP value, suggesting minimal error between the calculated and actual concentrations. This analysis shows the importance of the spectra selection method, indicating that the selection of uniformly distributed spectra in the combinations is good for a high-accuracy calculation of the algorithm.
Figure 14c shows the results with 64 measured spectra. It is the same that measured spectra with uniformly dispersed concentrations output high calculation accuracy.
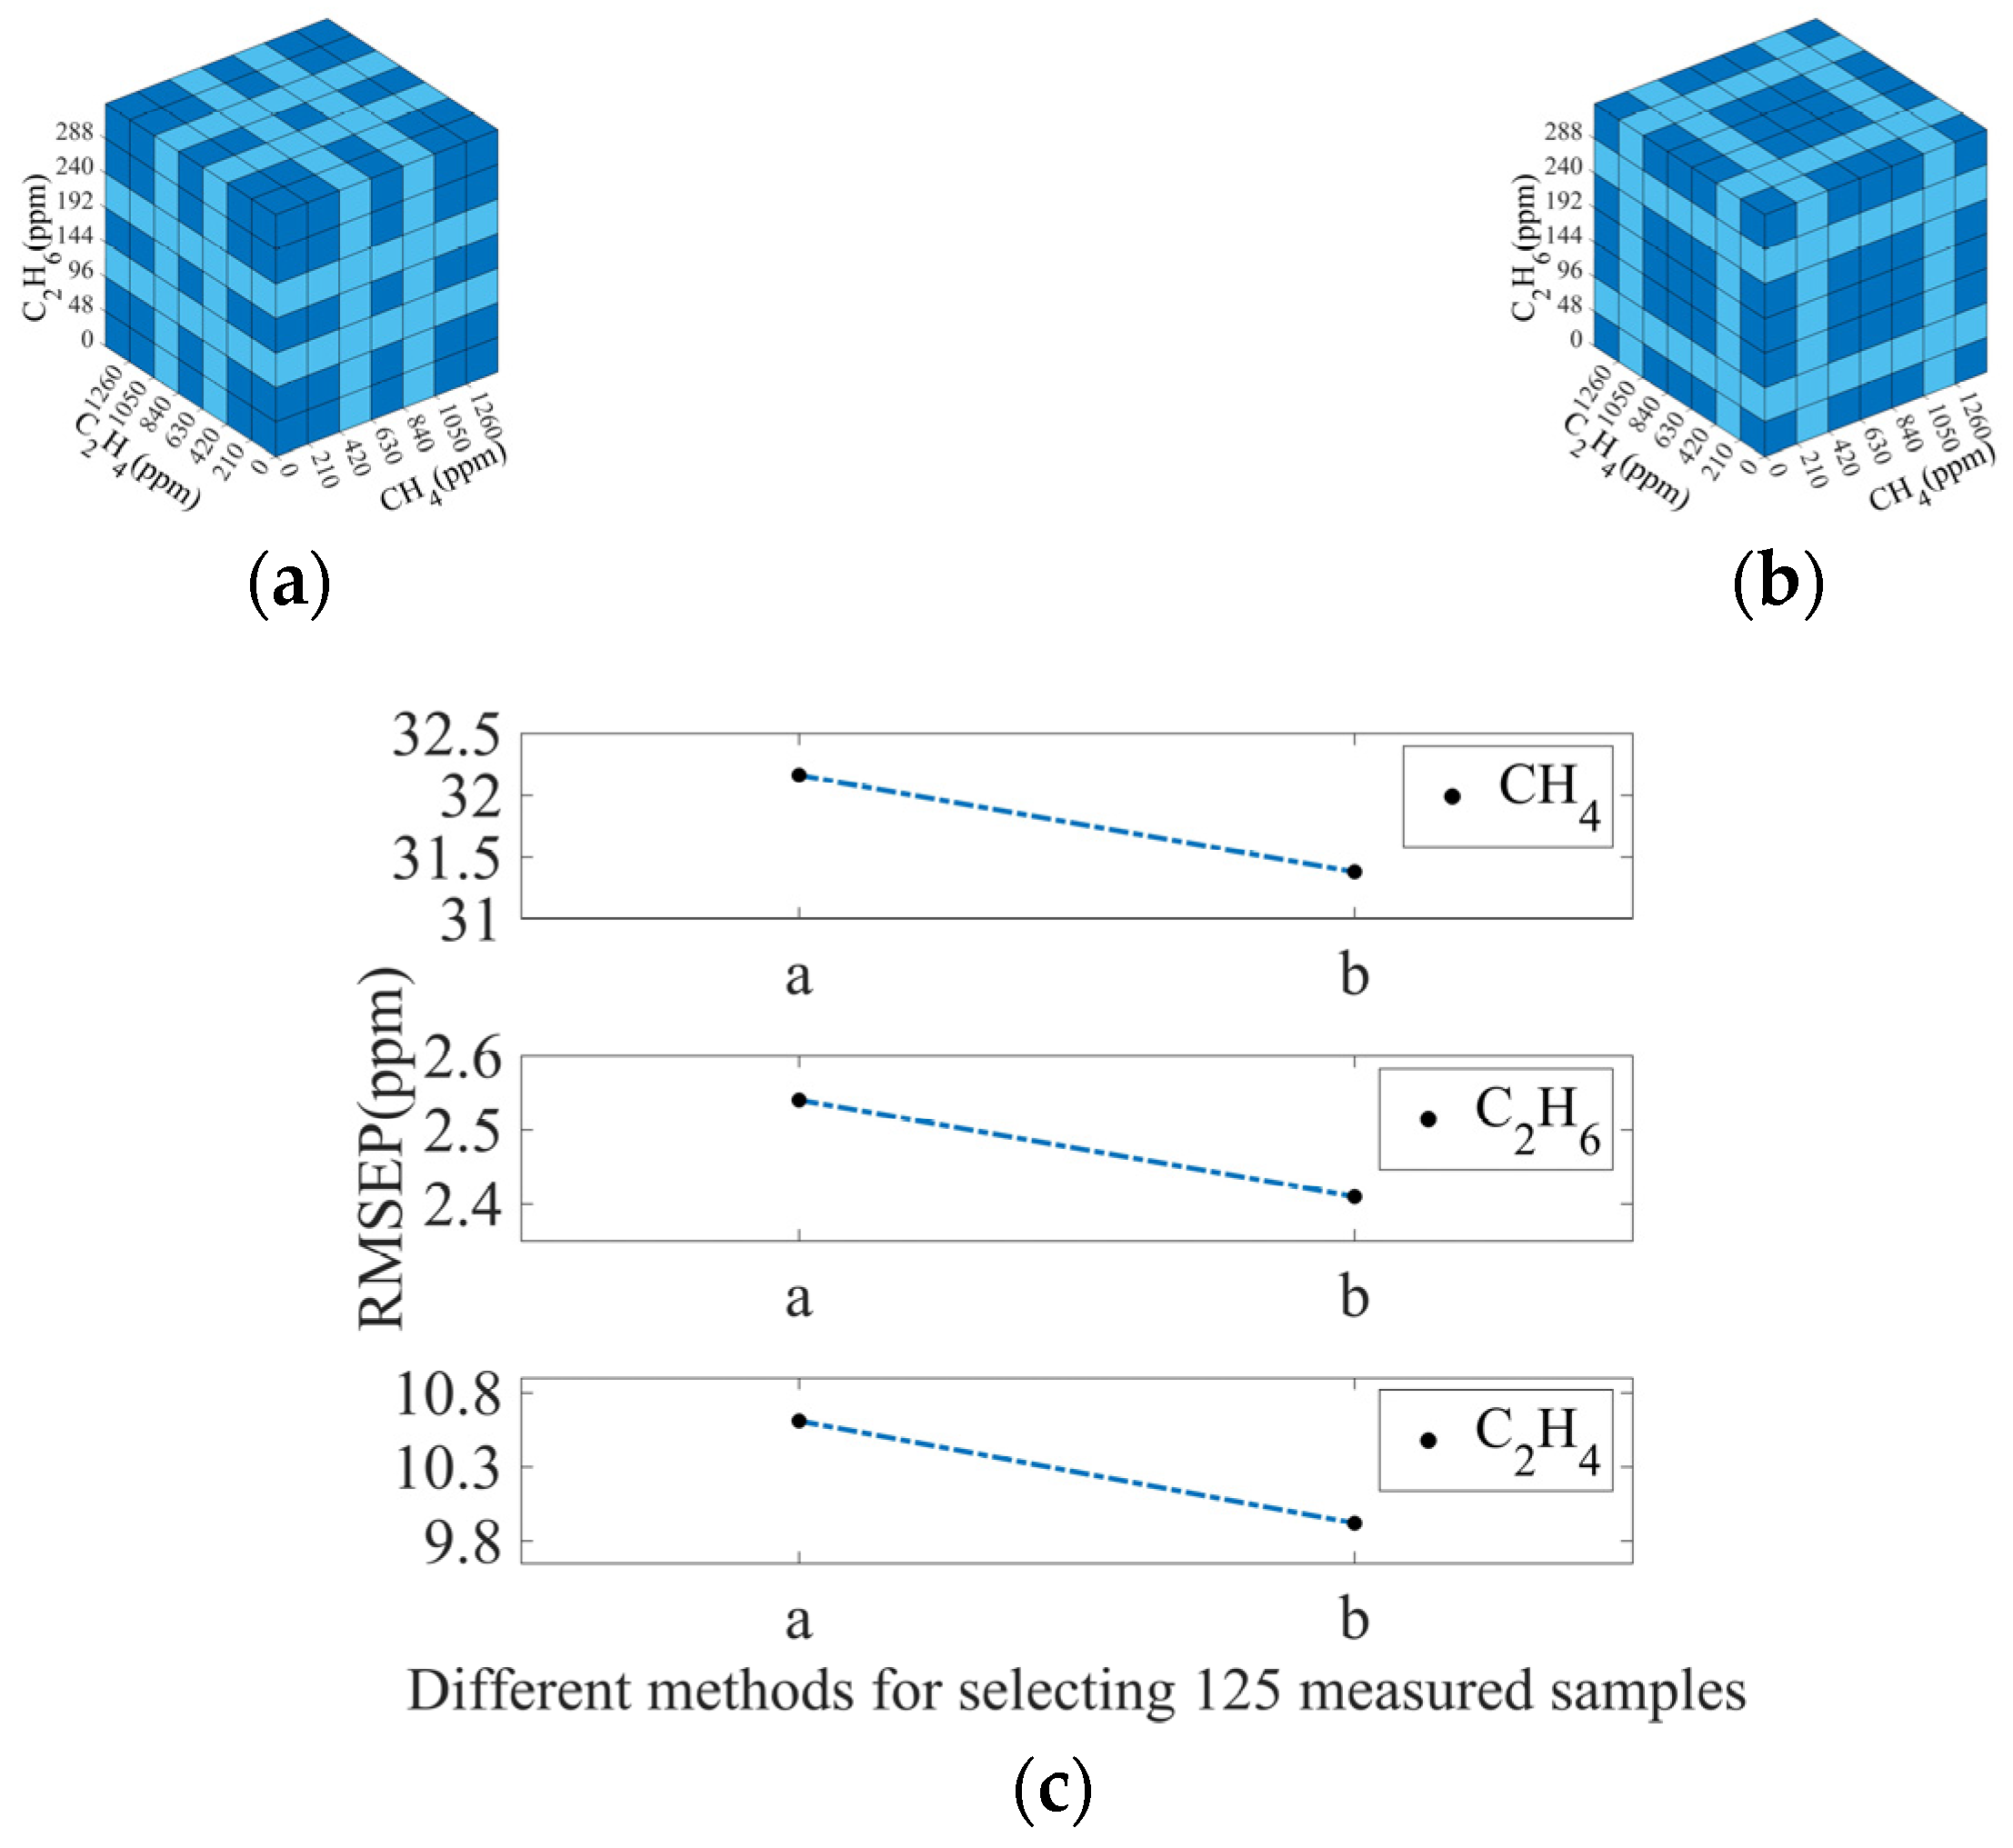
A comparison was also made when 125 measured spectra were used. In this case, the method in Figure 15a dropped more spectra with concentrations that appear in the median of the measurement range, while the method in Figure 15b retained more spectra with concentrations in the area. As shown in Figure 15c, method b has better accuracy than that of method a. This result indicates that retaining more samples with intermediate values in the concentration distribution can improve the accuracy of the algorithm.
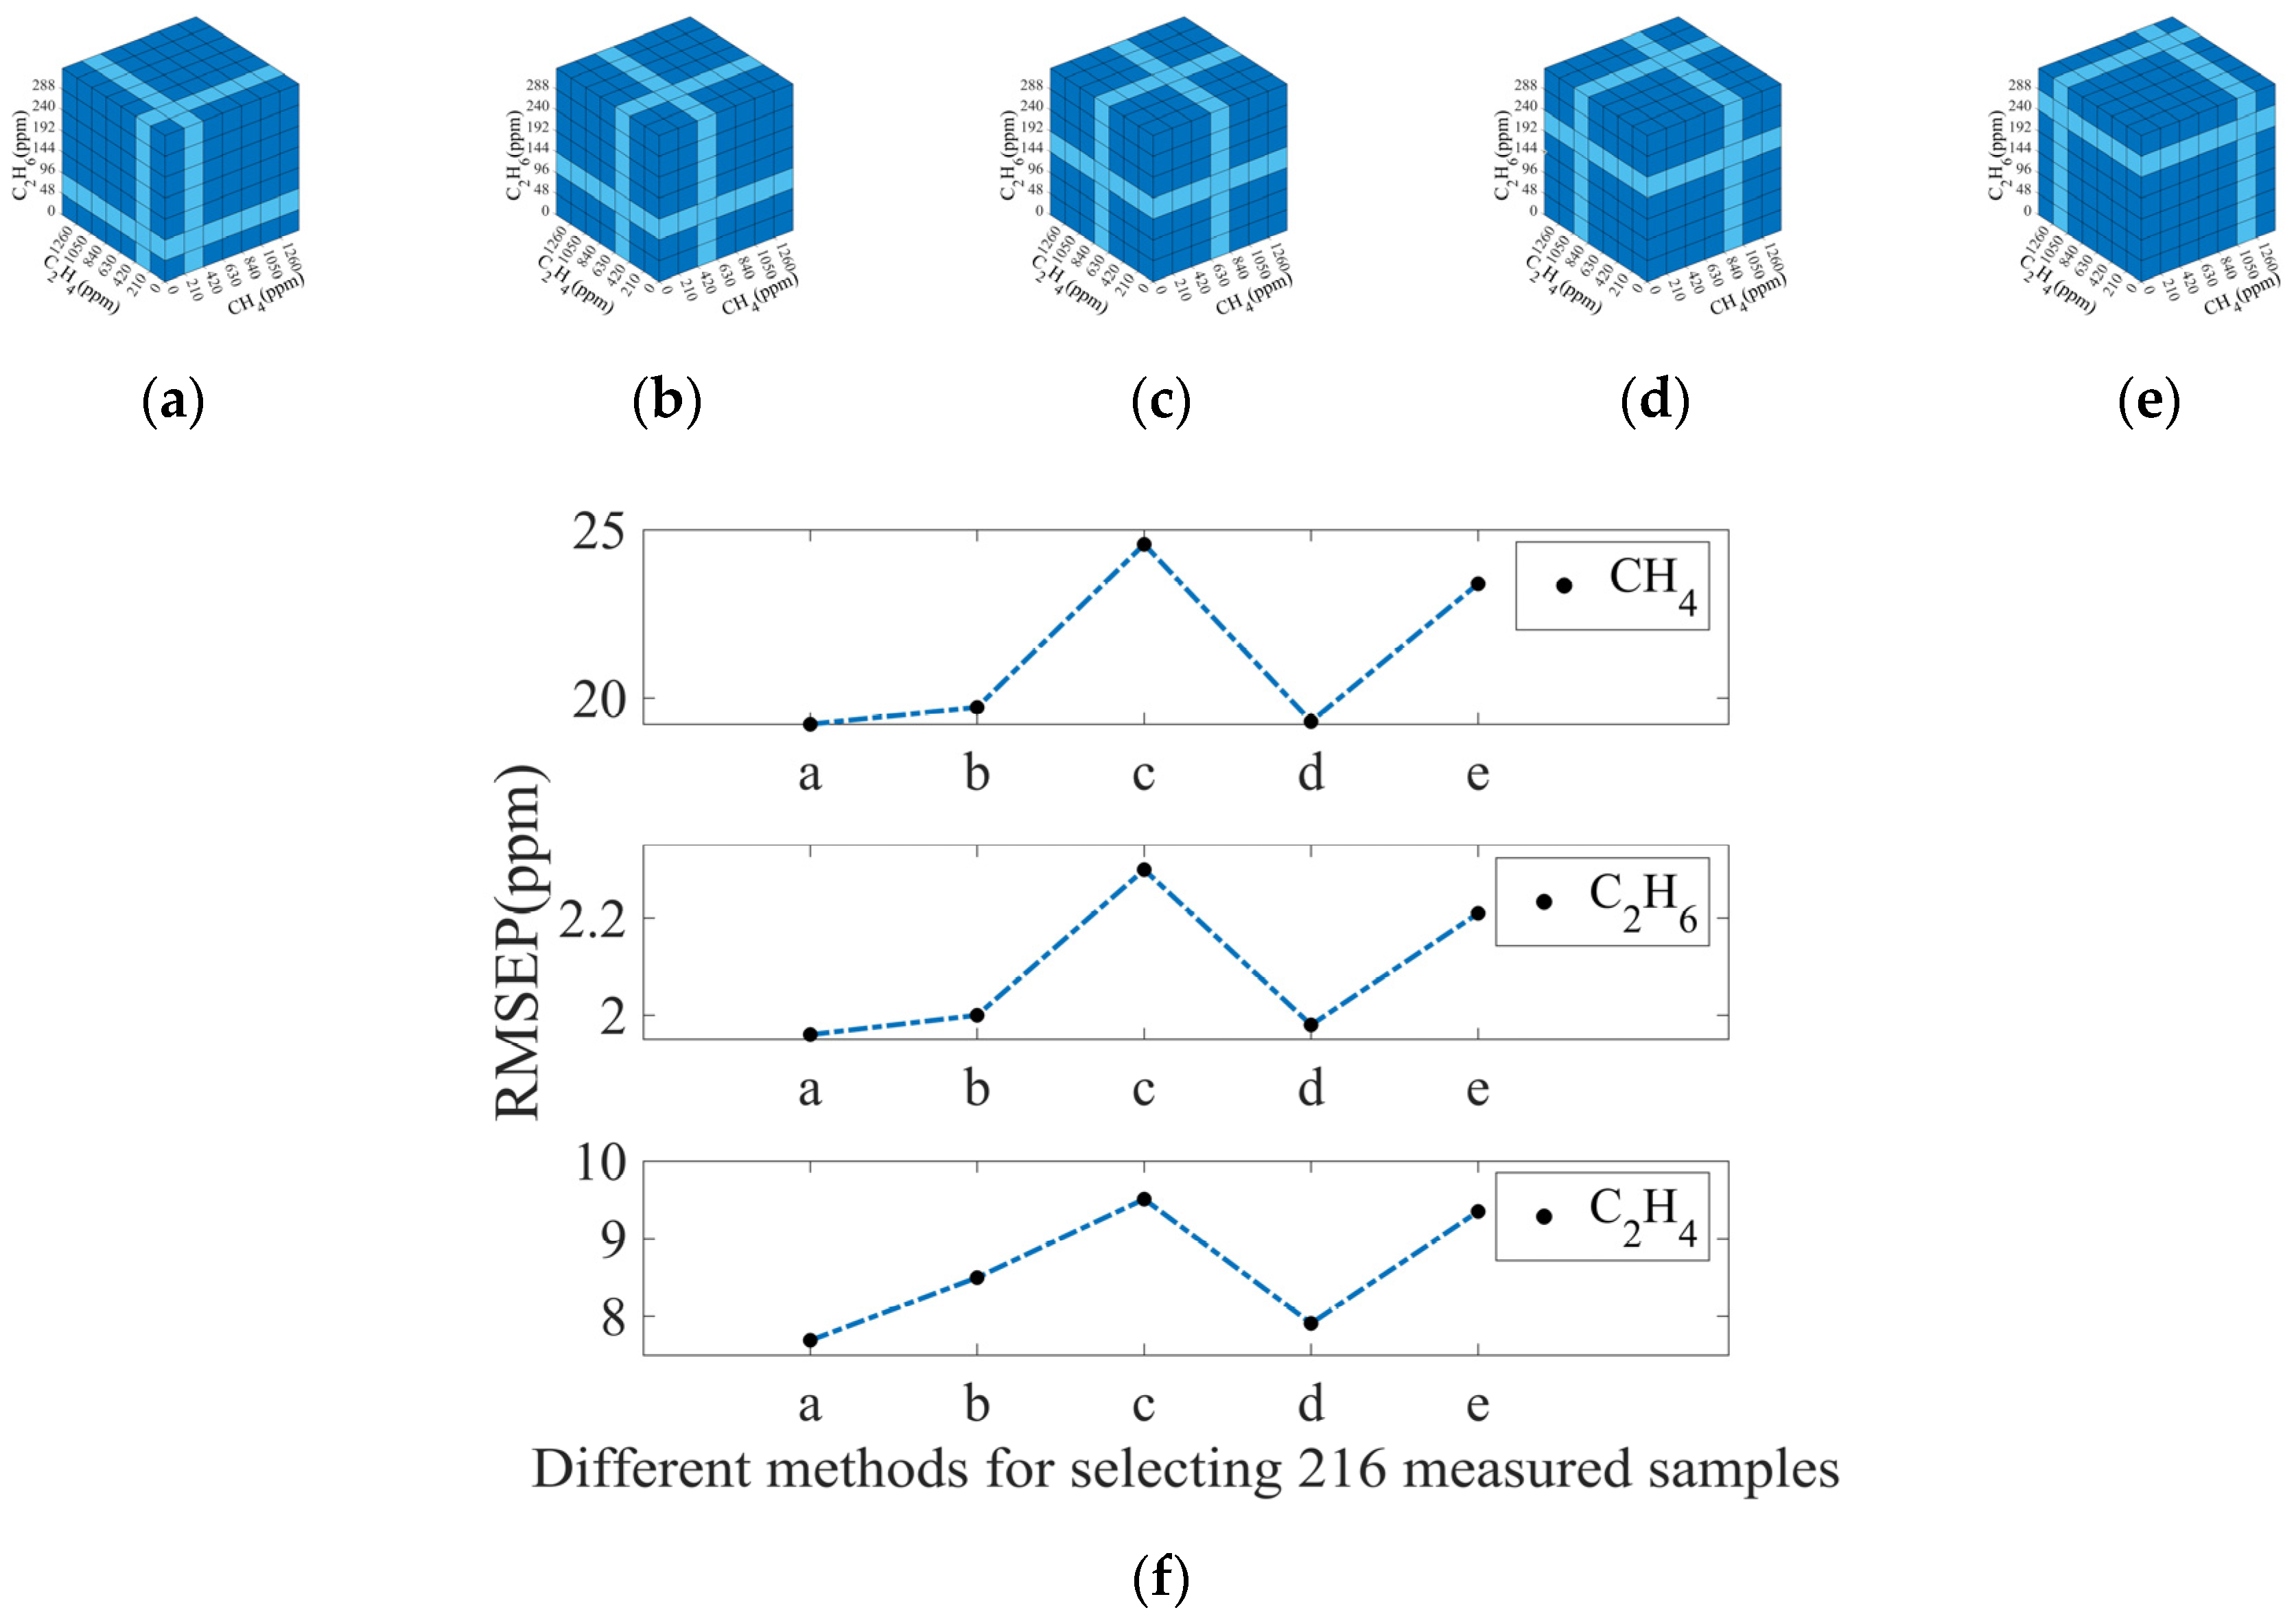
Considering the selection of 216 measured spectra, five typical selection methods were considered. Among them, method c dropped the middle value of the concentration measurement range compared to the other methods. As shown in Figure 16f, the RMSEP values for CH4, C2H6 and C2H4 were the largest when method c was selected. It further indicates the importance of keeping spectra as much as possible in the middle of the concentration measurement range.
Finally, the influence of the number of measured spectra on calculation accuracy was investigated. Figure 17 shows the RMSEP values of CH4, C2H6, and C2H4 for the models trained with different numbers of measured spectra. As expected, the RMSEP values decrease with the increase of the number of measured spectra. Therefore, more measured spectra should be selected to achieve high calculation accuracy. In practice, the number can be determined according to different accuracy requirements.
Now, we conclude three important trends for selecting measured spectra. One is the uniformly distribution in the concentration measurement range, the other is keeping samples as much as possible in the middle of the concentration range, and finally, trying to select more measured spectra.

3.3.3. Simulation Interpolation Method

From the above measured and calculated results, it can be found that CH4 gas has the largest calculation error among the three gases. When CH4, C2H6, and C2H4 were mixed, the characteristic absorption of CH4 was completely overlapped with part of the characteristic absorption of C2H6 and C2H4, which resulted in the most severe influence on the absorption spectra of CH4.
In order to minimize the error of CH4 between the calculated and actual concentrations, the simulation interpolation method was proposed for CH4. More simulated absorption spectra for CH4 were generated. The concentration interval for the CH4 simulated spectra was reduced from 210 ppm to 105 ppm, which means that the number of generated absorption spectra for CH4 was twice that of the other two gases. As shown in Figure 18, when the simulated concentration interval of CH4 is reduced, the number of simulated spectra for both CH4 and mixed gases is doubled. Consequently, the concentration interval of CH4 was 210/105/70/42 ppm, and the number of total simulated spectra for mixed gases was 343/637/931/1519, respectively.
As shown in Figure 19a (with 27 measured spectra), as the number of simulated spectra of the mixed gases increases, the RMSEP value of CH4 first decreases and then increases, and finally tends to be constant. We conclude that selecting a smaller CH4 gas spectral interval can improve the calculation accuracy of CH4 gas. However, too small spectral intervals and too many simulated spectra, while increasing the error of simulated spectra, are not conducive to improving accuracy.
We note from Figure 19b,c that the RMSEP values for C2H6 and C2H4 are almost unchanged in this process. It shows that the simulation interpolation for CH4 has little effect on the error between calculated and actual concentrations for C2H6 and C2H4 gases.
The performance of the simulation interpolation method for CH4 with more measured spectra was also investigated. It can be seen in Figure 20 that the RMSEP value of CH4 reduces with the increase of measured spectra from 27 to 216. And obviously, the calculation error with the interpolation method is smaller than that of the error without the method.

4. Conclusions

In this work, a CH4-C2H6-C2H4 multi-gas sensing system based on mid-infrared spectral absorption was proposed and established. The portable system utilized a commercially available blackbody radiation broadband light source and a tunable FP filter detector. The gas absorption cell is a flexible infrared waveguide inner coated with Ag and AgI optical film. It has low loss in the wavelength band of the intrinsic absorption of the measured gases, which improves the signal-to-noise ratio and achieves lower LODs. The LODs for single-component gases CH4, C2H6, and C2H4 were 7.33 ppm, 2.13 ppm, and 8.09 ppm, respectively.
Because the absorption spectra are highly overlapping for CH4, C2H6, and C2H4 mixed gases, the SVM algorithm was used to calculate the concentrations of each gas. A total of 343 absorption spectra were measured by the system for the gas mixture samples with various concentration combinations. The RMSEP values of CH4, C2H6, and C2H4 were 15.91 ppm (1.26%), 1.64 ppm (0.57%), and 6.95 ppm (0.55%), respectively.
In practice, system costs can be reduced by reducing the number of measured gas samples. Fewer measured spectra were used for spectra generation, and the SVM algorithm was trained by a large amount of generated spectra. The method of selecting measured spectra is important for calculation accuracy. Research results show three important trends for selecting measured spectra. One is the uniform distribution in the concentration measurement range, the other is keeping samples as much as possible in the middle of the concentration range, and finally, trying to use more measured spectra. Furthermore, a simulation interpolation method was proposed to enhance the accuracy for CH4 calculations.
The FP detector utilized in this work has a detection wavelength range of 3.1 to 4.4 μm. In the future, the integration of multiple FP detectors has the potential to expand the system’s detection wavelength range and enhance its capacity to detect diverse gas species. Infratec has launched four FP detectors that can detect different bands: 3.1–4.4 μm, 3.8–5.0 μm, 5.5–8.0 μm, and 8.0–10.5 μm (Infratec, LFP3144C-337, LFP3850C-337, LFP5580C-337, LFP80105C-337, Dresden, Germany). It is possible to integrate these four detectors to achieve measurements in the 3.1~10.5 μm wide band. The system needs to be improved accordingly during implementation. The fabrication of the HWGs needs to be carried out according to the different detection bands, and then the four HWGs and their corresponding detectors are integrated. Furthermore, the coupling joints between the light source and the gas cell as well as between the gas cell and the detectors have to be redesigned.

Author Contributions

Data curation, W.S.; formal analysis, W.S. and L.G.; investigation, W.S.; methodology, W.S. and B.Z.; project administration, X.Z.; resources, W.S. and X.S.; software, W.S. and Y.J.; supervision, Y.S.; validation, W.S. and J.J.; visualization, W.S.; writing—original draft, W.S.; writing—review and editing, W.S. and Y.S. All authors have read and agreed to the published version of the manuscript.

Funding

This research received no external funding.

Institutional Review Board Statement

Not applicable.

Informed Consent Statement

Not applicable.

Data Availability Statement

The data presented in this study are available upon request from the corresponding author. The data are not publicly available due to privacy restrictions.

Conflicts of Interest

The authors declare no conflicts of interest.

Abbreviations

The following abbreviations are used in this manuscript:
FNEFluorescence noise elimination
FPFabry–Pérot
FRESFiber-enhanced Raman spectroscopy
HC-ARFHollow-core anti-resonant fiber
HWGHollow waveguide
IRInfrared spectral absorption
LODLimit of detection
RBFRadial basis function
RMSECRoot mean square error of calibration
RMSEPRoot mean square error of prediction
SVMSupport vector machine

References

  1. Lee, D.; Lee, D. Environmental gas sensors. IEEE Sens. J. 2001, 1, 214–224. [Google Scholar] [CrossRef]
  2. Yadav, R.; Sahu, L.K.; Tripathi, N.; Pal, D.; Beig, G.; Jaaffrey, S.N.A. Investigation of emission characteristics of NMVOCs over urban site of western India. Environ. Pollut. 2019, 252, 245–255. [Google Scholar] [CrossRef]
  3. Melike, D.; Mustafa, O.; Serpil, Y. Source apportionment of biogenic and anthropogenic VOCs in Bolu plateau. Sci. Total Environ. 2020, 731, 139201. [Google Scholar] [CrossRef]
  4. Tanaka, K.; Akishima, K.; Sekita, M.; Tonokura, K.; Konno, M. Measurement of ethylene in combustion exhaust using a 3.3-μm distributed feedback interband cascade laser with wavelength modulation spectroscopy. Appl. Phys. B 2017, 123, 219. [Google Scholar] [CrossRef]
  5. Baker, R.W.; Lokhandwala, K. Natural gas processing with membranes: An overview. Ind. Eng. Chem. Res. 2008, 47, 2109–2121. [Google Scholar] [CrossRef]
  6. Jean, L.M.; Pierre, R. Production, oxidation, emission and consumption of methane by soils: A review. Eur. J. Soil Biol. 2001, 37, 25–50. [Google Scholar] [CrossRef]
  7. Giuseppe, E.; Paolo, C. Earth’s degassing: A missing ethane and propane source. Science 2009, 323, 478. [Google Scholar] [CrossRef]
  8. David, A.M. Anthropogenic and biogenic sources of Ethylene and the potential for human exposure: A literature review. Chem.-Biol. Interact. 2015, 241, 10–22. [Google Scholar] [CrossRef]
  9. Annika, B.; Christian, D.; Andreas, M.; Sebastian, W.; Jurgen, P.; Torsten, F. Comprehensive multi-gas study by means of fiber-enhanced Raman spectroscopy for the investigation of nitrogen cycle processes. Analyst 2024, 149, 1885–1894. [Google Scholar] [CrossRef]
  10. Nie, Q.; Liu, Z.; Cheng, M.; Pei, S.; Yang, D.; Guo, D.; Yang, M. Review on Hollow-Core Fiber Based Multi-Gas Sensing Using Raman Spectroscopy. Photonic Sens. 2024, 14, 4. [Google Scholar] [CrossRef]
  11. Andreas, K.; Robert, D.; Sebastian, W.; Christian, D.; Juergen, P.; Torsten, F. Fiber-enhanced Raman gas spectroscopy for the study of microbial methanogenesis. Anal. Chem. 2020, 92, 12564–12571. [Google Scholar] [CrossRef]
  12. Bai, Y.; Xiong, D.; Yao, Z.; Wang, X.; Zuo, D. Analysis of CH4, C2H6, C2H4, C2H2, H2, CO, and H2S by forward Raman scattering with a hollow-core anti-resonant fiber. J. Raman Spectrosc. 2022, 53, 1023–1031. [Google Scholar] [CrossRef]
  13. Wan, F.; Kong, W.; Liu, Q.; Wang, P.; Wang, M.; Li, Q.; Yao, X. Fluorescence noise eliminating fiber-enhanced Raman spectroscopy for simultaneous and multi process analysis of intermediate compositions for C2H2 and H2 Production. Anal. Chem. 2023, 95, 8596–8604. [Google Scholar] [CrossRef]
  14. Tan, X.; Zhang, H.; Li, J.; Wan, H.; Guo, Q.; Zhu, H.; Liu, H.; Yi, F. Non-dispersive infrared multi-gas sensing via nano antenna integrated narrowband detectors. Nat. Commun. 2020, 11, 5245. [Google Scholar] [CrossRef]
  15. Liu, H.; Shi, Y.; Wang, T. Design of a six-gas NDIR gas sensor using an integrated optical gas chamber. Opt. Express 2020, 28, 11451–11462. [Google Scholar] [CrossRef] [PubMed]
  16. Li, Q.; He, Y.; Zhao, K.; Ji, J.; Li, H.; Jeffrey, M.B. Development and testing of NDIR-based rapid greenhouse gas detection device for dairy farms. Sustainability 2024, 16, 2131. [Google Scholar] [CrossRef]
  17. Zou, M.; Sun, L.; Wang, X. Multigas sensing based on wavelength modulation spectroscopy using frequency division multiplexing combined with time division multiplexing. IEEE Sens. J. 2022, 22, 12930. [Google Scholar] [CrossRef]
  18. Fu, L.; You, S.; Li, G.; Fan, Z. Enhancing methane sensing with NDIR technology: Current trends and future prospects. Rev. Anal. Chem. 2023, 42, 20230062. [Google Scholar] [CrossRef]
  19. Zhou, S.; Liu, N.; Shen, C.; Zhang, L.; He, T.; Yu, B.; Li, J. An adaptive Kalman filtering algorithm based on back-propagation (BP) neural network applied for simultaneously detection of exhaled CO and N2O. Spectrochim. Acta A 2019, 223, 117332. [Google Scholar] [CrossRef] [PubMed]
  20. Kan, Z.; Zhang, Y.; Luo, L.; Gao, Y. Ultraviolet absorption spectrometry with symmetrized dot patterns and deep learning for quantitative analysis of SO2, H2S, CS2 mixed gases. Eng. Appl. Artif. Intell. 2024, 133, 108366. [Google Scholar] [CrossRef]
  21. Zhang, B.; Jiang, J.; Zhang, X.; Zhu, X.; Shi, Y. Flexible Hollow Core Fiber Photoacoustic Gas Sensor Based on Embedded Acoustic Resonant Structure. Anal. Chem. 2023, 95, 34. [Google Scholar] [CrossRef] [PubMed]
  22. Jia, Y.; Jiang, J.; Zhang, B.; Zhao, B.; Yang, Y.; Zhang, X.; Zhu, X.; Shi, Y. Ppb-level CO2 detection with miniaturized gas absorption cell based on low-loss flexible infrared hollow waveguide. Sens. Actuators A Phys. 2023, 363, 114767. [Google Scholar] [CrossRef]
  23. Chen, Z.; Zeng, J.; He, M.; Zhu, X.; Shi, Y. Portable ppb-level carbon dioxide sensor based on flexible hollow waveguide cell and mid-infrared spectroscopy. Sens. Actuators B Chem. 2022, 359, 131553. [Google Scholar] [CrossRef]
  24. Yang, Y.; Jiang, J.; Zeng, J.; Chen, Z.; Zhu, X.; Shi, Y. CH4, C2H6, and CO2 multi-gas sensing based on portable mid-infrared spectroscopy and PCA-BP algorithm. Sensors 2023, 23, 1413. [Google Scholar] [CrossRef]
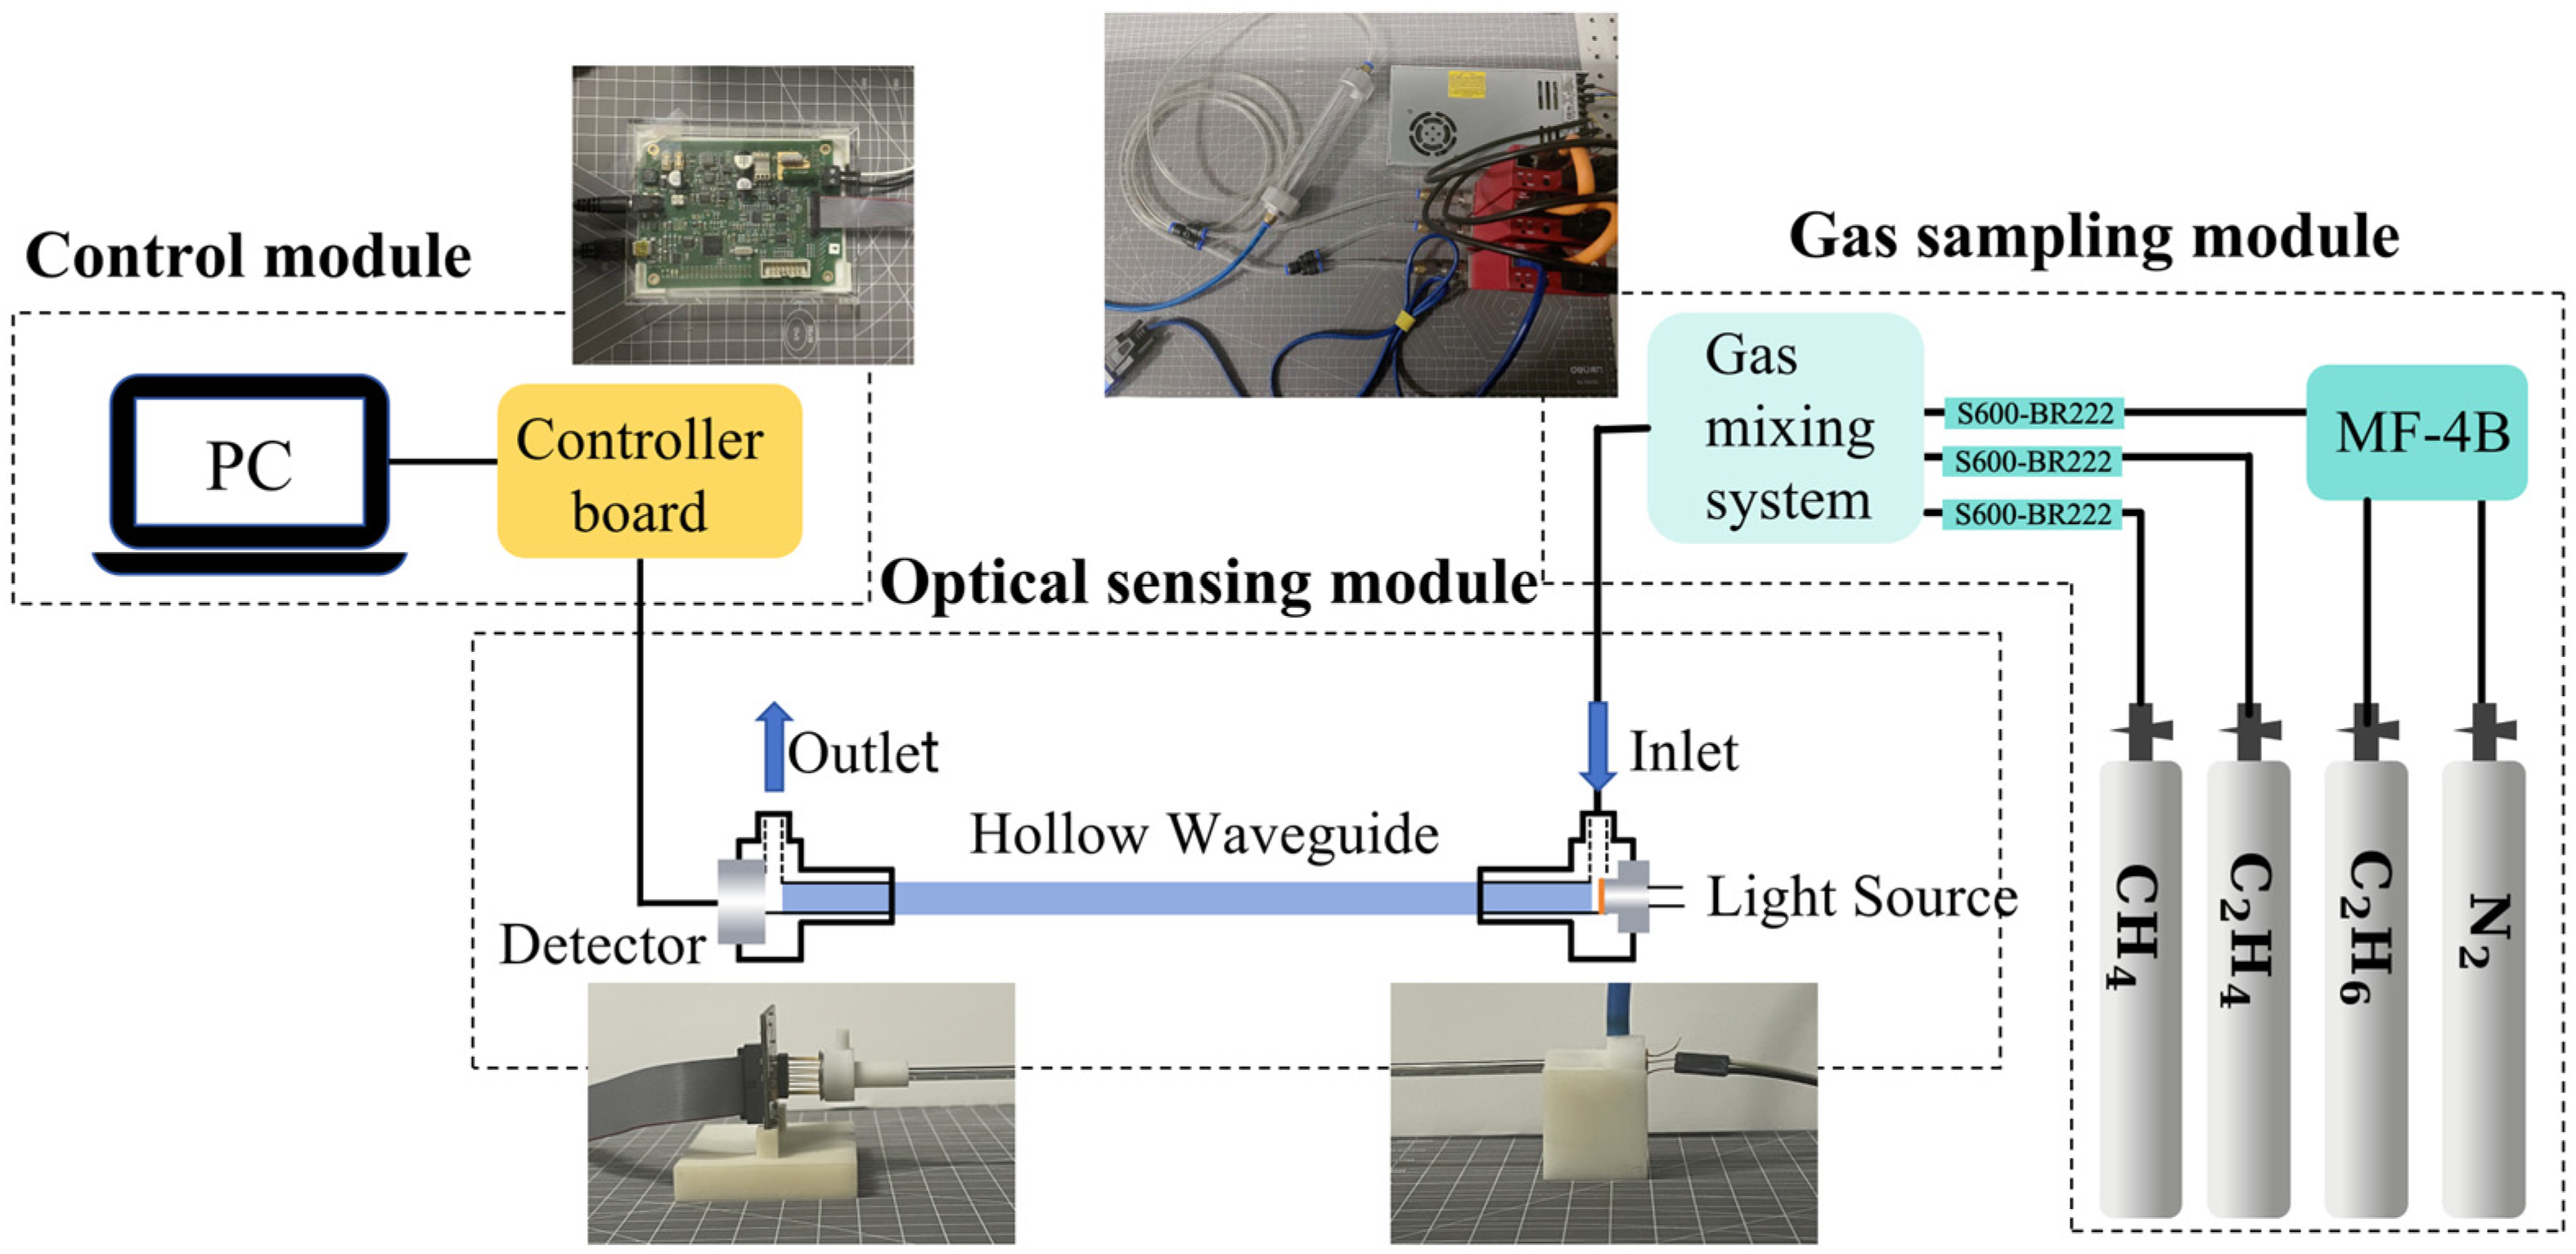
Figure 1. Schematic diagram of the established sensing system.
Sensors 25 01427 g001
Figure 2. Measured loss spectrum of the HWG by using a Fourier transform infrared spectrometer. The inner diameter of the HWG is 4 mm, with a length of 110 cm.
Sensors 25 01427 g002
Figure 3. (a) Absorption line strength of CH4, C2H6, and C2H4 from HITRAN. (b) Measured absorption spectra of CH4, C2H6, C2H4, and their mixture by the established sensing system.
Sensors 25 01427 g003
Figure 4. Topology of SVM.
Sensors 25 01427 g004
Figure 5. (a) CH4 absorption spectra before baseline calibration; (b) CH4 absorption spectra after baseline calibration.
Sensors 25 01427 g005
Figure 6. Measured absorption spectra of (a) C2H6, and (b) C2H4 with different concentrations; (c) Experimental data and fitting curve of CH4, C2H6, and C2H4 concentration versus absorbance area.
Sensors 25 01427 g006
Figure 7. (a) Gas concentration distribution of 343 gas mixture samples; (b) Typical measured absorption spectra of 343 gas mixture samples. Different color lines represent absorption spectra for different concentration combinations of gas mixture samples.
Sensors 25 01427 g007
Figure 8. Actual concentrations of CH4, C2H6, and C2H4 and calculated ones using SVM.
Sensors 25 01427 g008
Figure 9. Comparisons of measured and stimulated absorption spectra of (a) CH4, (b) C2H6, and (c) C2H4 at different concentrations.
Sensors 25 01427 g009
Figure 10. Comparison of measured and stimulated absorption spectra of CH4, C2H6, and C2H4 mixed gases at different concentrations.
Sensors 25 01427 g010
Figure 11. The flowchart for the process of generating simulated spectra.
Sensors 25 01427 g011
Figure 12. (ae) Five typical selection methods for selecting 27 measured spectra. Dark blue squares represent the measured spectra that were selected. Light blue squares represent the measured spectra that were not selected.
Sensors 25 01427 g012
Figure 13. RMSEP values of (a) CH4, (b) C2H6, and (c) C2H4 using different selection methods with 27 measured spectra.
Sensors 25 01427 g013
Figure 14. (a,b) Two typical selection methods for selecting 64 measured spectra. Dark blue squares represent the measured spectra that were selected. Light blue squares represent the measured spectra that were not selected; (c) RMSEP values of CH4, C2H6, and C2H4 using different selection methods for selecting 64 measured spectra.
Sensors 25 01427 g014
Figure 15. (a,b) Two typical selection methods for selecting 125 measured spectra. Dark blue squares represent the measured spectra that were selected. Light blue squares represent the measured spectra that were not selected; (c) RMSEP values of CH4, C2H6, and C2H4 using different selection methods for selecting 125 measured spectra.
Sensors 25 01427 g015
Figure 16. (ae) Five typical selection methods for selecting 216 measured spectra. Dark blue squares represent the measured spectra that were selected. Light blue squares represent the measured spectra that were not selected; (f) RMSEP values of CH4, C2H6, and C2H4 using different selection methods for selecting 216 measured spectra.
Sensors 25 01427 g016
Figure 17. The minimum RMSEP value of (a) CH4, (b) C2H6, and (c) C2H4 obtained by training simulated spectra data generated from samples with different measured quantities.
Sensors 25 01427 g017
Figure 18. Comparison of measured and stimulated spectra of (a) CH4, (b) several mixed gases at different concentrations.
Sensors 25 01427 g018
Figure 19. RMSEP values of (a) CH4, (b) C2H6, and (c) C2H4 obtained by training with different numbers of simulated spectra.
Sensors 25 01427 g019
Figure 20. Comparison of RMSEP values of CH4 before and after using simulation interpolation method.
Sensors 25 01427 g020
Table 2. RMSEC and RMSEP values of CH4, C2H6, and C2H4 using SVM.
GasRMSECRMSEP
CH49.97 ppm (0.79%)15.91 ppm (1.26%)
C2H60.36 ppm (0.13%)1.64 ppm (0.57%)
C2H41.47 ppm (0.12%)6.95 ppm (0.55%)
Disclaimer/Publisher’s Note: The statements, opinions and data contained in all publications are solely those of the individual author(s) and contributor(s) and not of MDPI and/or the editor(s). MDPI and/or the editor(s) disclaim responsibility for any injury to people or property resulting from any ideas, methods, instructions or products referred to in the content.