Introduction
Traditionally, human sensory panels (group of people with highly trained senses of smell), gas chromatography (GC), and mass spectrometry (MS) have been used to analyze food odors. The disadvantages of human sensory panels include subjectivity, poor reproducibility (i.e., results fluctuate depending on time of day, health of the panel members, prior odors analyzed, fatigue, etc.), time consumption, and large labor expense. Also, human panels can not be used to assess hazardous odors, work in continuous production, or remote operation. GC and GC/MS systems can require a significant amount of human intervention to perform the analysis and then relate the analysis to something useable[
1]. The main motivation for tin oxide gas sensor array based devices is the development of a qualitative, low-cost, real-time, and portable method to perform reliable, objective, and reproducible measures of volatile compounds and odors. In the past these devices (electronic noses) have been developed for the classification and recognition of a large variety of foods, such as juices[
2], coffee[
9] meats [
4,
7,
10], fishes[
12], cheese[
3], spirits[
1],wines[
5,
6,
8],and fruits[
11].
In many applications for chemical sensors, information can be gained not only from a steady-state value of the sensor signal, but also from the kinetics of the response. However, using steady-state sensor value to classify different mixture gases results in losing many information of the sensor signal. Few articles mention the advantage of the transient signal when classifying flavors [1□15]. And there was not a comfortable method. Therefore, the purpose of this work is to show how to extract parameters containing information from an array of sensors (feature extraction), a good working method to determine which of the features are the most important (feature optimization). In this paper, a gas sensor system designed to perform vinegar analysis is introduced, and its application aiming at the classification of two different type vinegars named as ‘Chinkang Vinegar’ and ‘Sanxi Vinegar’, which are the most saleable vinegars in China.
Experiments
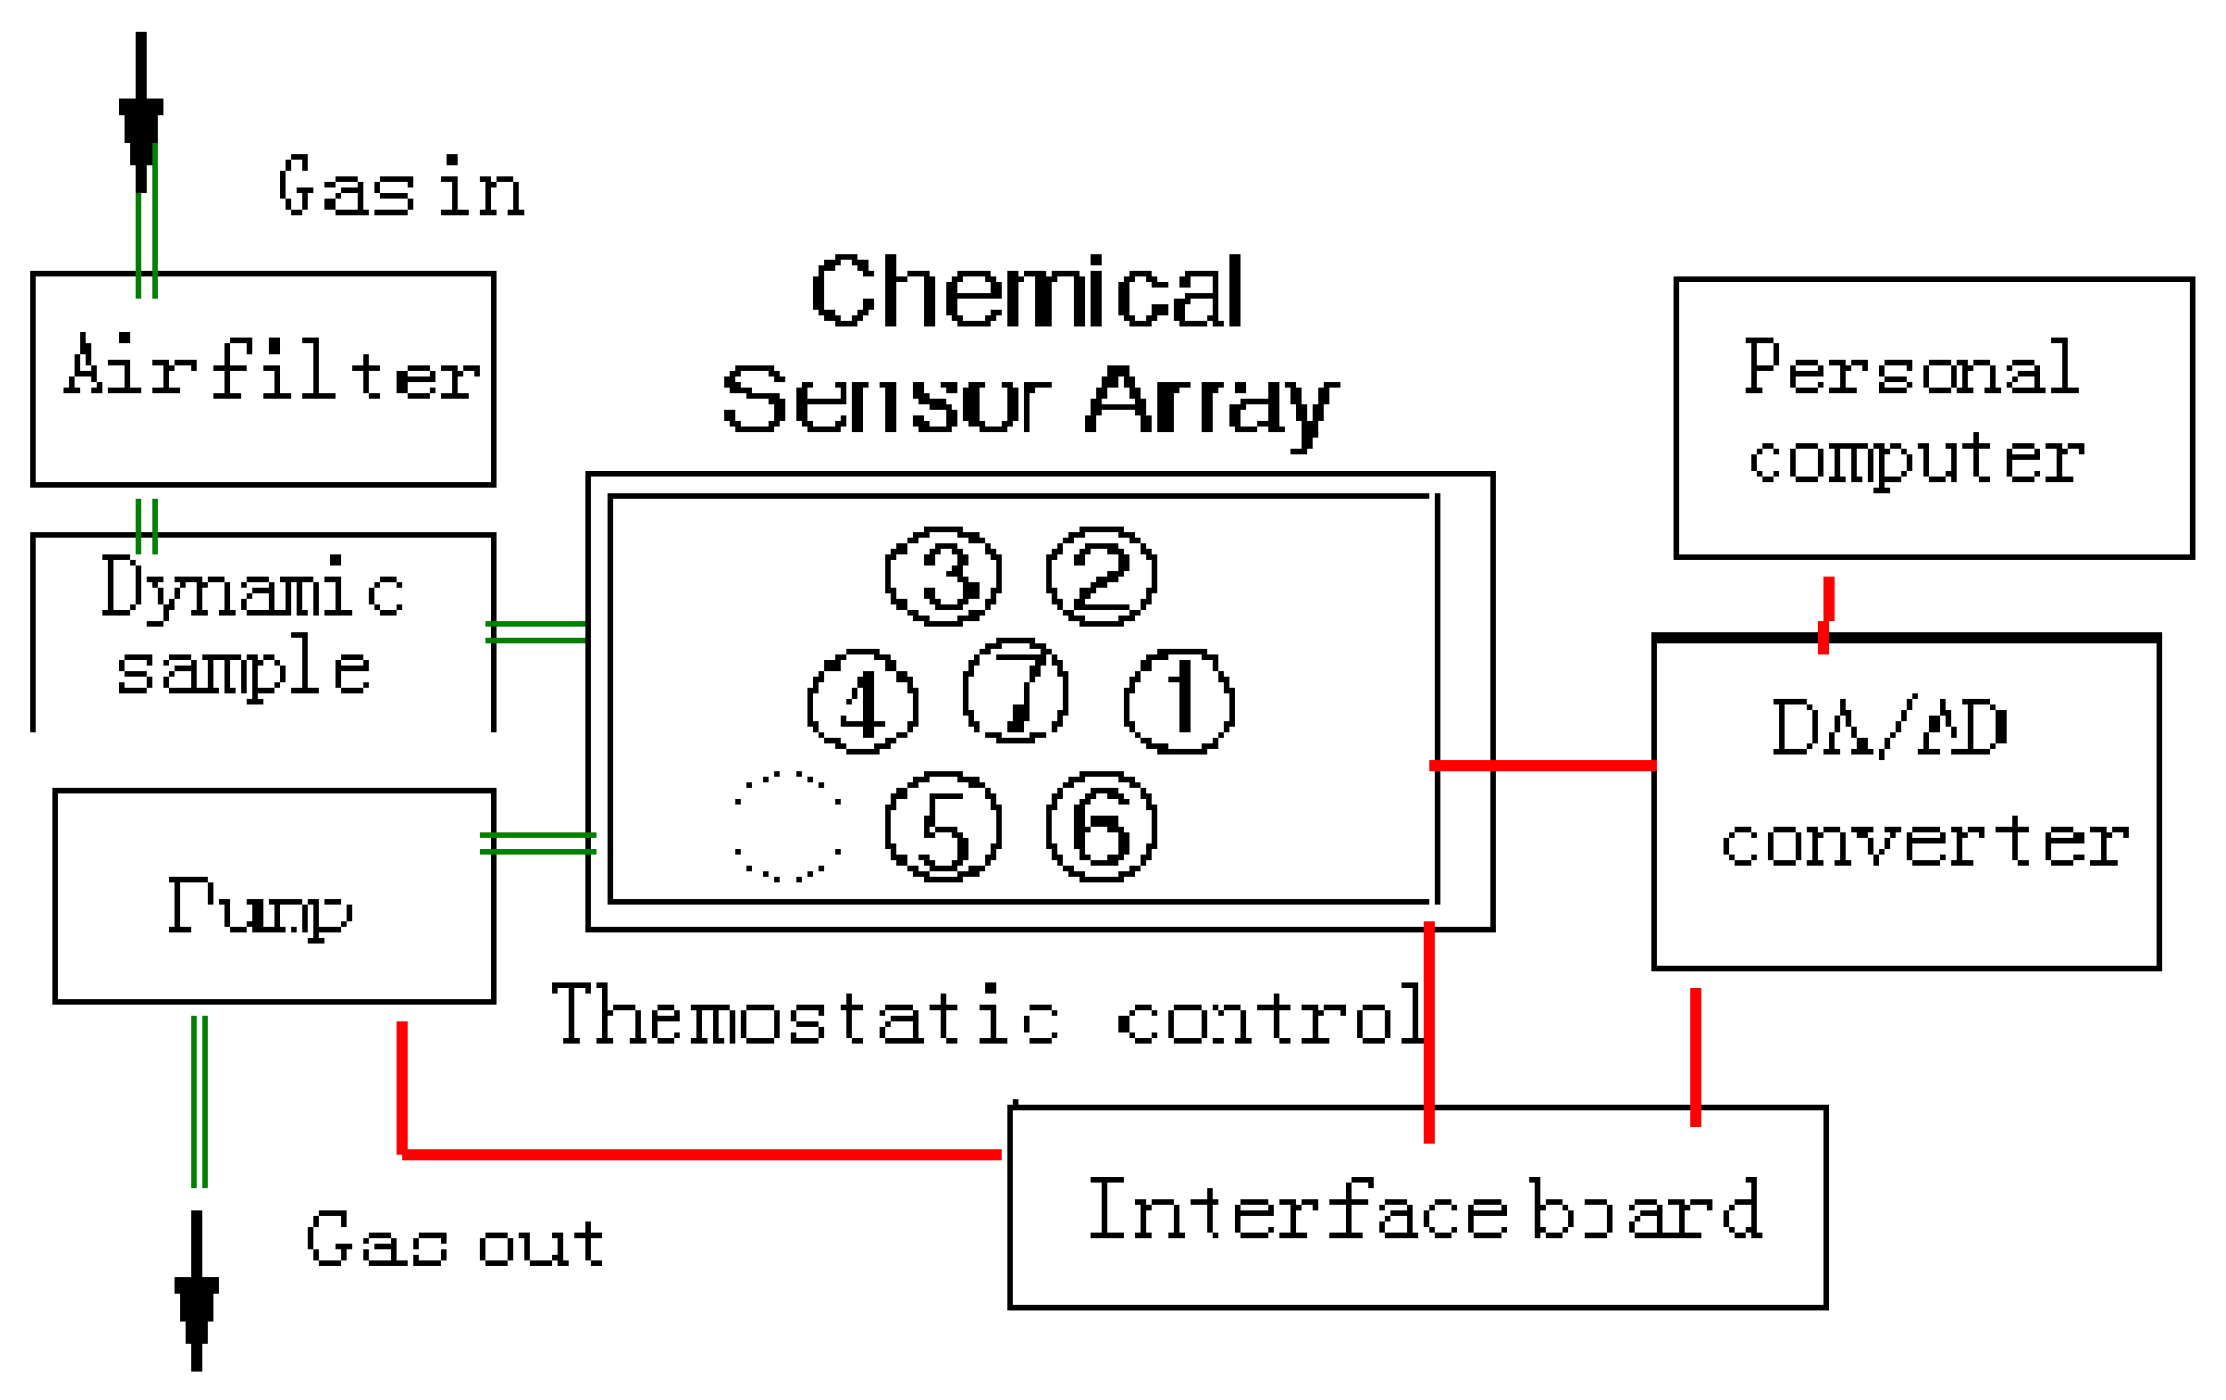
The electronic nose (
Fig.1) can identify and quantify chemical vapors. The system is composed of a 12 bit AD/DA converter, an air filter for suppressing humidity, a suction pump, and a personal computer. The chemical sensor array employs an array of five tin-oxide gas sensors, a humidity sensor and a temperature sensor to examine the environment. Although each sensor is designed for a specific chemical, each responds to a wide variety of chemical vapors. Collectively, these sensors respond with unique signatures (patterns) to different chemicals[
17].
Figure 1.
Schematic diagram of the electronic nose.
Figure 1.
Schematic diagram of the electronic nose.
The five tin-oxide sensors are commercially available Taguchi-type gas sensors obtained from Figaro Co. Ltd. (Sensor 1, TGS 813; Sensor 2, TGS 880; Sensor 3, TGS 822; Sensor 4, TGS 825; Sensor 5, TGS 812). These sensors are heated to a constant temperature, holding the sensor heator voltage at 5V. The humidity sensor (Sensor 6: HS-01) and the temperature sensor (Sensor 7: Pt100) are used to monitor the conditions of the experiment. The head space sample is injected in the 1000ml thermostatically controlled measurement cell in a dynamic way. In the dynamic mode, the gas sample is conveyed to the measurement cell by a carrier gas. This gas is the atmospheric air, thermostatically controlled, filtered on active charcoal and dehydrated with silica gel. Its flow-rate is controlled at 500ml/nim, either for cleaning the measurement cell or for the dynamic injection. Exposure of a tinoxide sensor to vapor produces a change in its electrical resistance [
16].
The system has been trained to identify the two different type vinegars named as ‘Chinkang Vinegar’ and ‘Sanxi Vinegar’, which are the most saleable vinegars in China. In order to generate one dynamic dead space, 10ml of liquid sample is drawn form one of the vinegars and injected into a 250ml thermostatically controlled cell; The headspace is generated over 10 min. Then the carrier gas conveyed the gas sample to the measurement cell. During operation the sensor array "smells" the gas from the dynamic head-spaces of one vinegar, the sensor signals are digitized and fed into computer, and the whole signal is exploited, from the absorption beginning to the stationary phase of equilibrium between reversible adsorption and desorption, the process lasts 150s. At last, we use the carrier gas cleaning the measurement cell 8 min until the sensors is recovered. Each vinegar measurement was repeated several times in order to obtain accurate and reliable data.
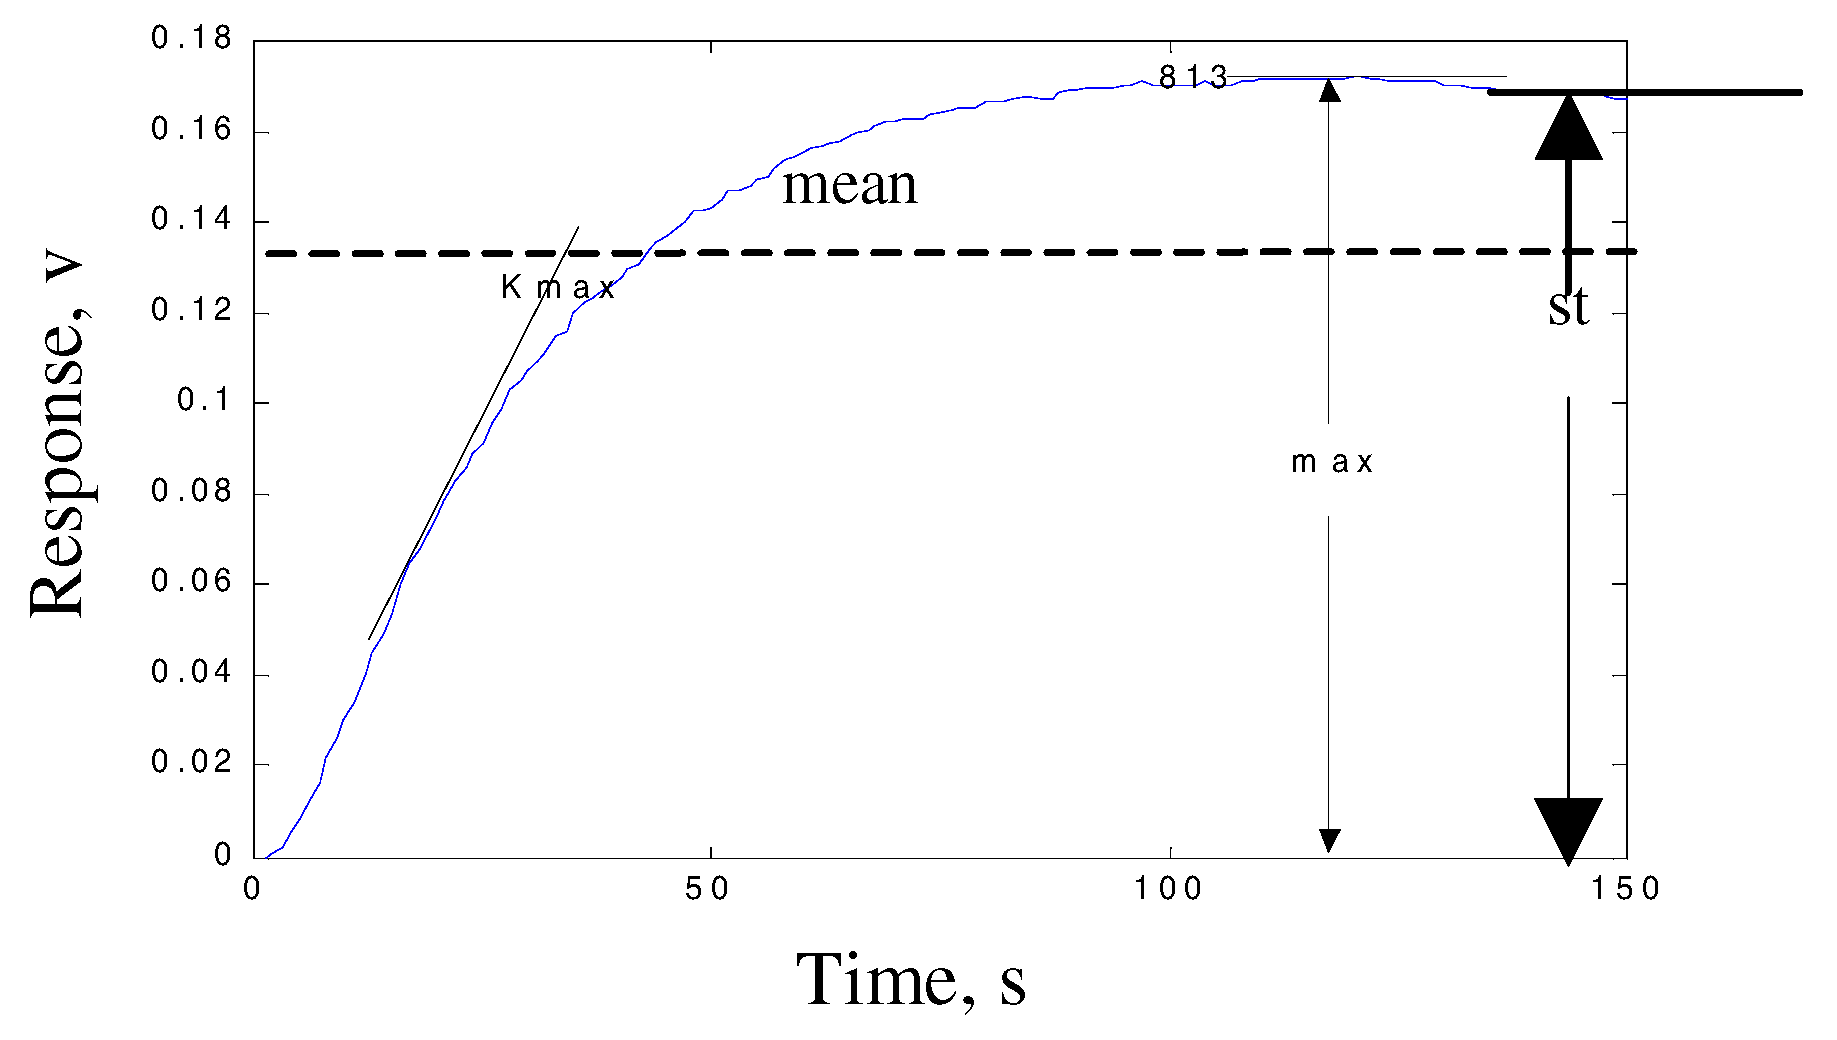
Typical response curve for the gas sensor array reaction, the curve is smoothed and the baseline is subtracted. Here we cite the experiment of the sensors response to ‘Chinkang Vinegar’. (
Fig.2).
Figure 2.
Typical response curve for the gas sensor array reaction.
Figure 2.
Typical response curve for the gas sensor array reaction.
Feature Extraction and Selection
In order to utilize all information from a time-developing system, it is possible either to use all the data points in the analysis, or to find some features (typically much fewer than the number of data points) that makes it possible to represent all the information in the measurements. The features can be picked manually[
1], or by making an ordinary function approximation if the expected mathematical behavior is known[
15].If too many features are used for the classification, there is a risk that the model gets too complex, and the generalization capability of the model (i.e. the ability to correctly classify new data) can then be very poor. It is therefore useful to reduce the number of features in the model by determining which of the features contain most necessary information to distinguish between the different classes. When this is made, the problem of finding a good model for the classification is rather easy, and what model type (e.g. partial least squares or artificial neural network) to use is easy to determine. In this paper we introduce known concepts from statistics and control theory, and show their applicability to measurements with a gas sensor array in order to find a rather quick and easy way to classify different common types of vinegar.
It is well known that each sensor responds to different chemical vapors at different rate and value. Therefore, from each curve, 4 features are extracted (
fig.3). They are the slope max (kmax), maximum (max), average of the last 20 points (st) and the average of whole points (mean) of curve.
Table 1 show the represent meaning of the four extracted features. Then 20 features were extracted from 5 sensors curve. The measure of the goodness of the parameters was then used in follow performance criteria.
Figure 3.
Sensor TGS813 smoothed curve and the features extracted are shown on the curve.
Figure 3.
Sensor TGS813 smoothed curve and the features extracted are shown on the curve.
Table 1.
The represent of the 4 extracted features.
Table 1.
The represent of the 4 extracted features.
| Extracted feature | Represent meaning |
| Max slope (kmax) | The respond rate of sensor to different vinegar gas |
| Maximum (max) | The maximum respond value |
| Average of last 20 points (st) | The stationary phase of equilibrium between reversible adsorption and desorption |
| Average of whole points (mean) | Sensor respond value during the whole process |
Results and Discussion
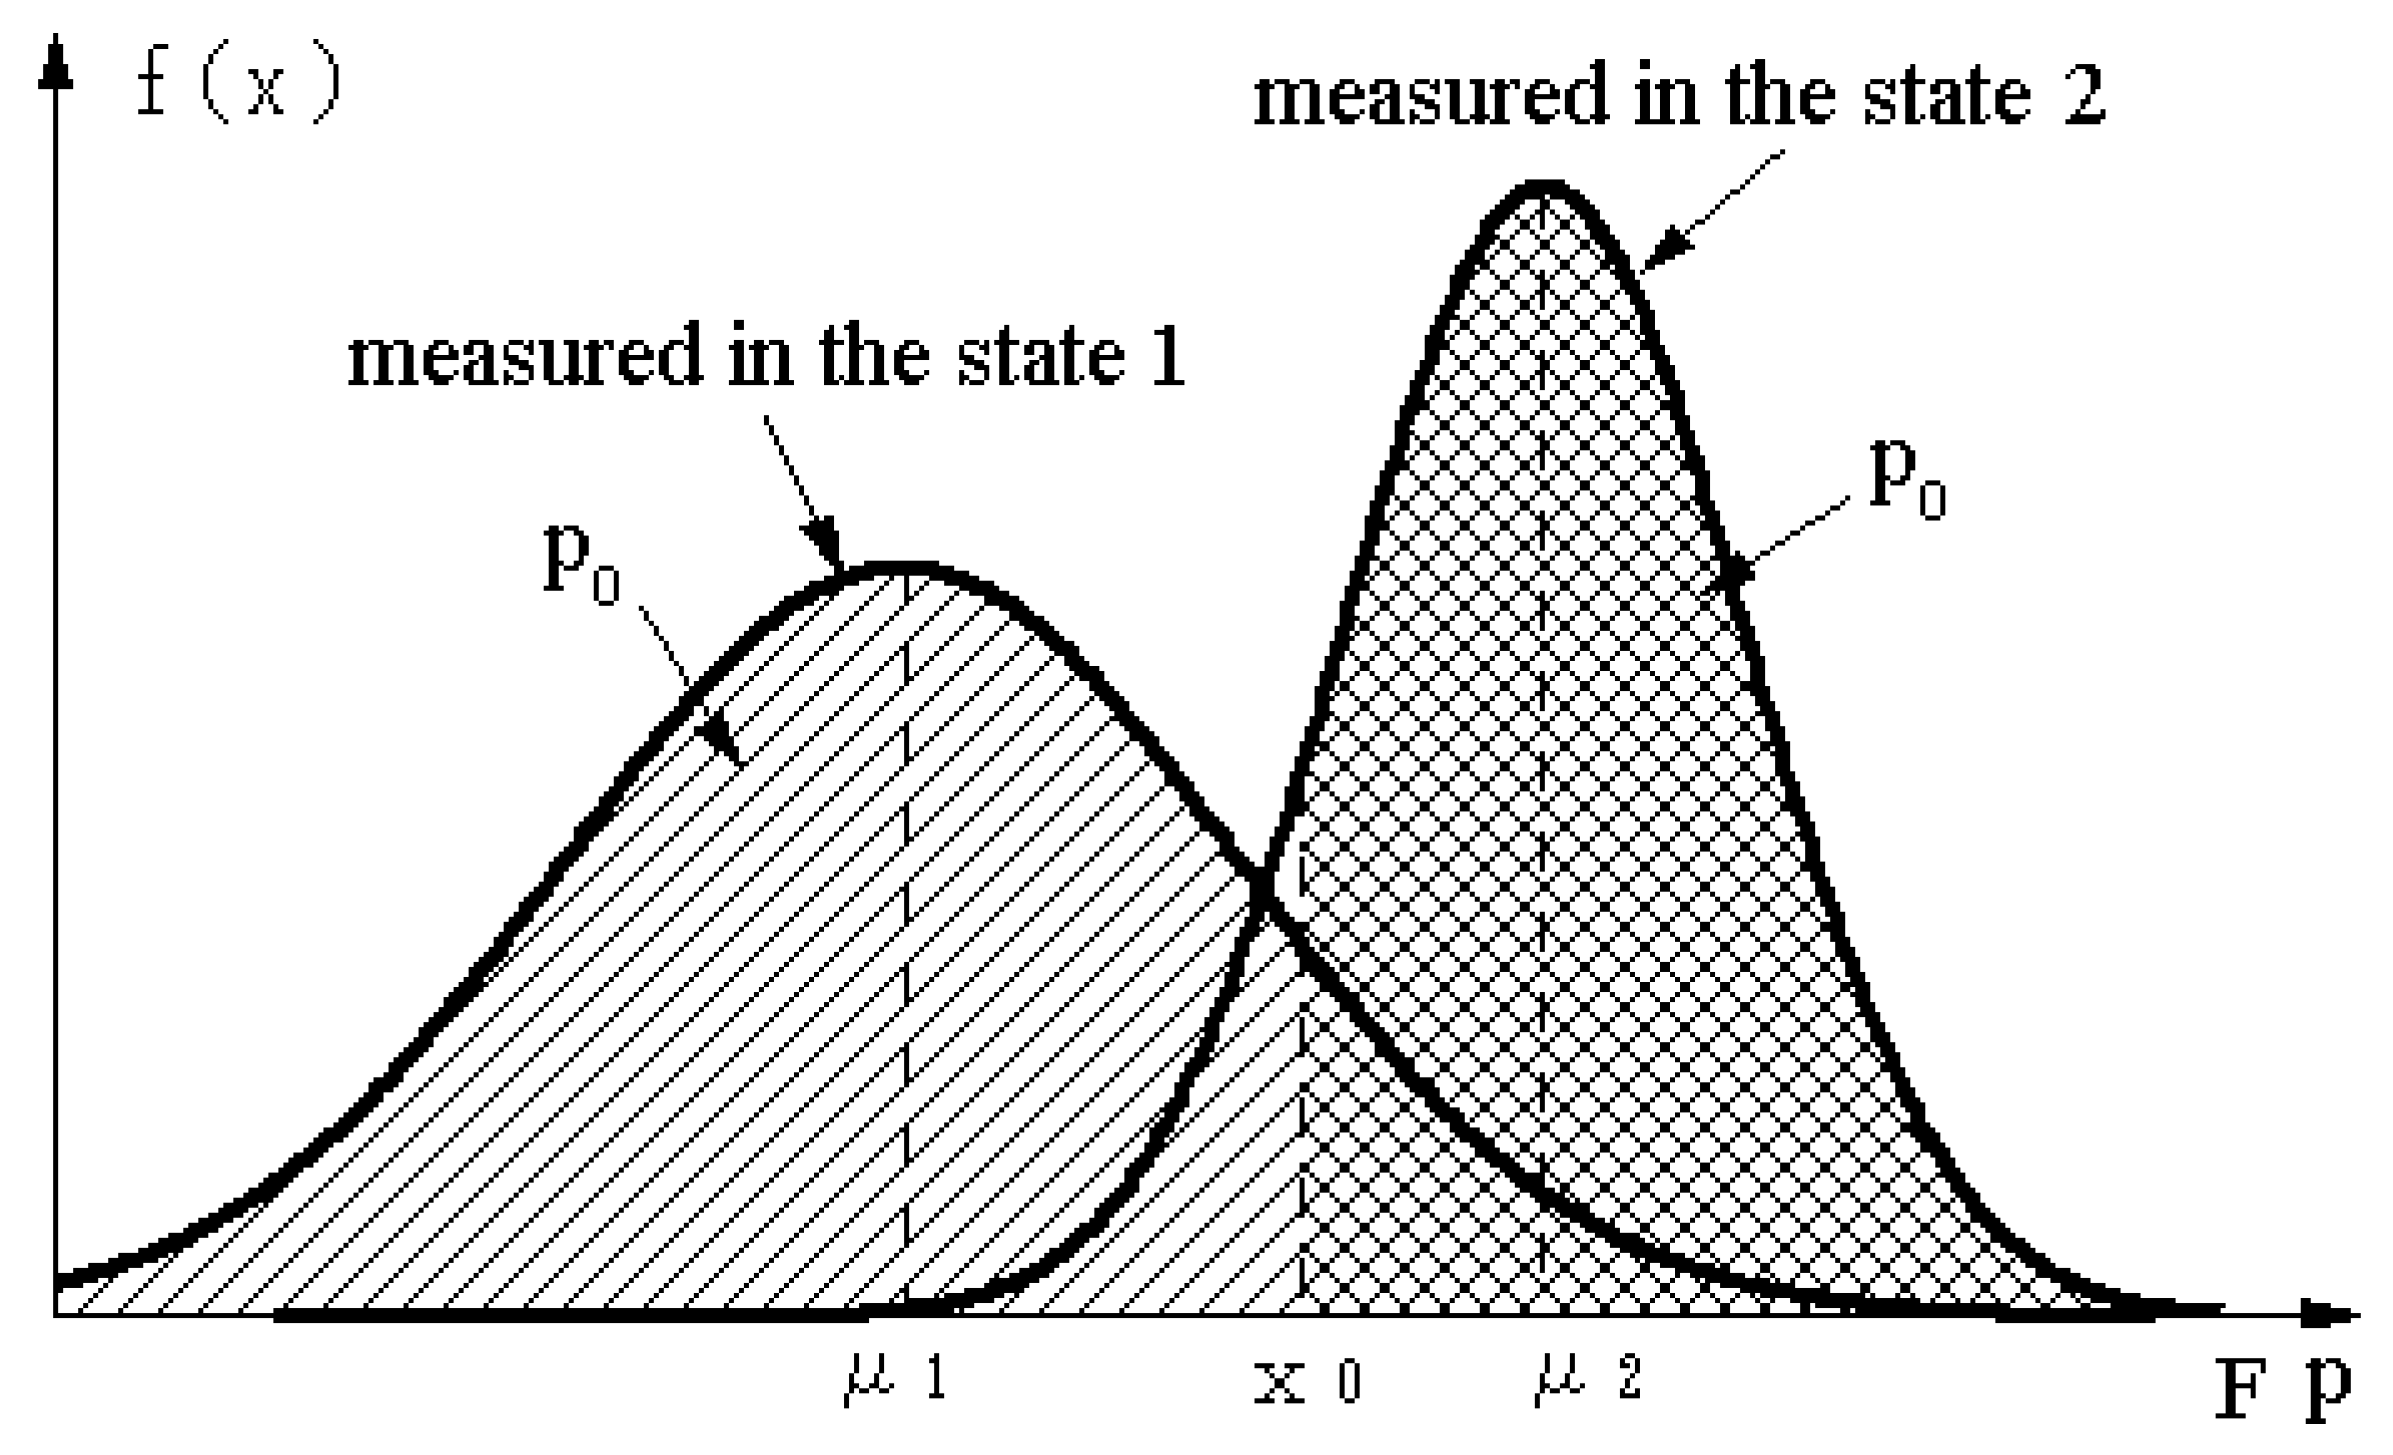
The new method discussed here has been used to distinguish between ‘Chinkang Vinegar’ and ‘Sanxi Vinegar’. The D.I. and D.R.(P
0) of each FP defined as sensor’s value are shown in
Table 2.
Table 2 shows that the D.I.’s are less than 1.6 and D.R’(P
0’s) are less than 92%. Consequently each FP is not good enough to distinguish between ‘Chinkang Vinegar (CV)’ and ‘Sanxi Vinegar (SV)’. The sensitivity levels vary from one sensor to another, the feature is quite similar, whatever the sensor.
Table 2 shows that the feature maximum points (
max) shows the best and the max slope (
Kmax) shows the poorest for each sensor. We selected 10 optimum feature according to their D.I.:
max1, max2, max3, st1, st2, mean2, max4, max5, mean1 and
st3.
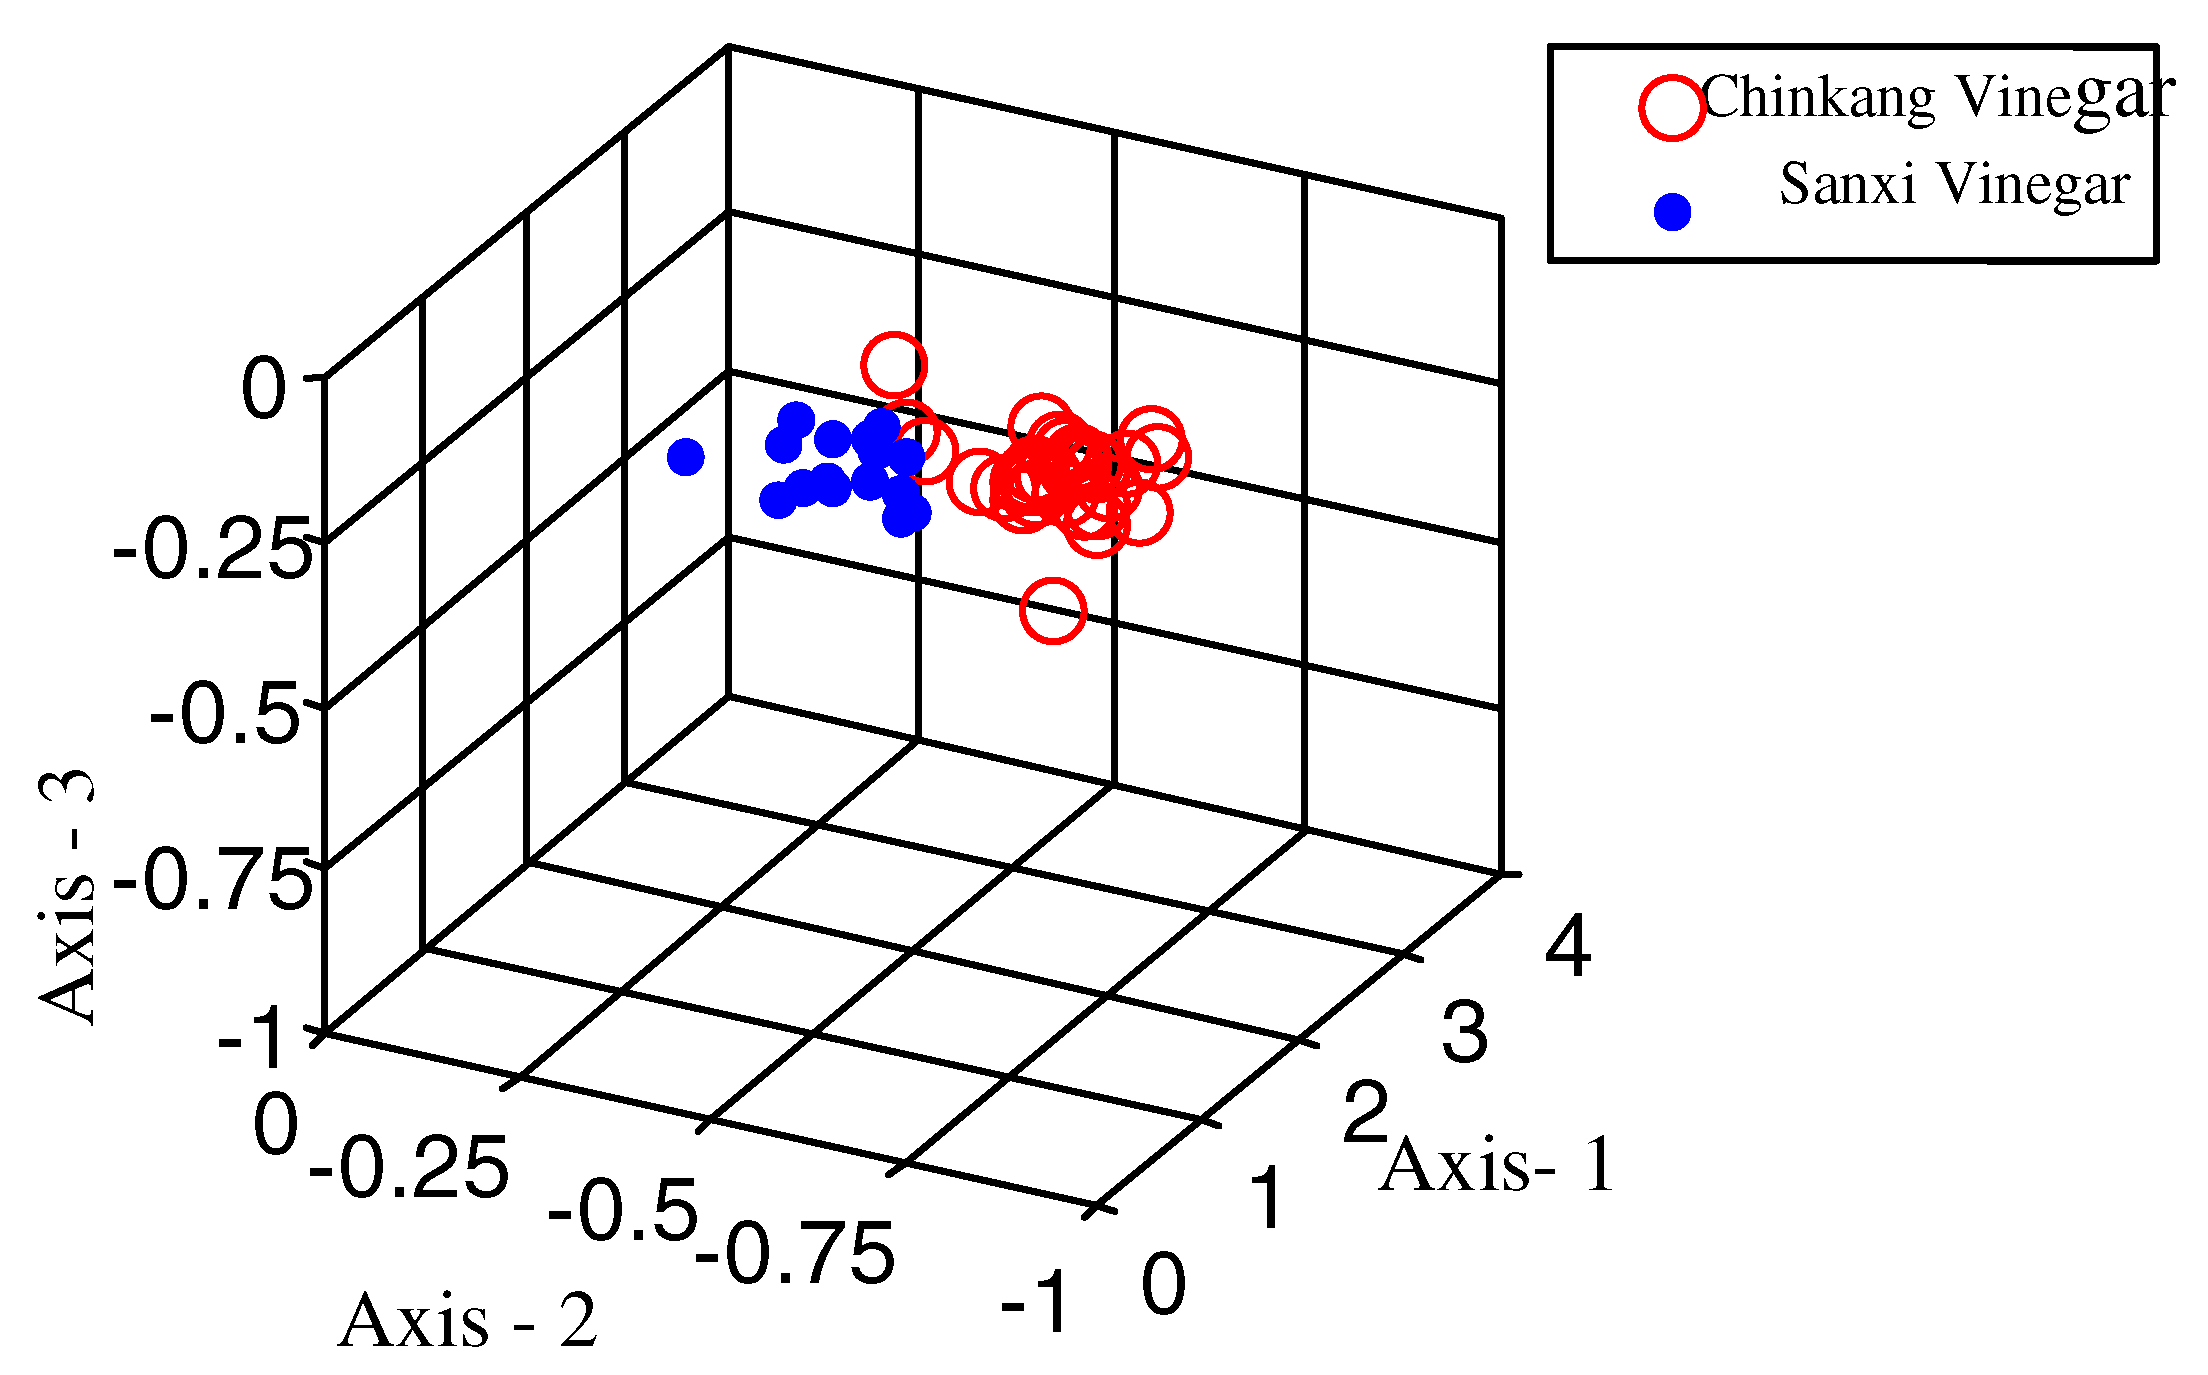
Fig.5 exhibits the results of principal component analysis (PCA) for the two vinegars with these 10 features. PCA is a simple method to project data from several FP to a three-dimensional space. The values of 86.66% of 1-axis (
Fig.3 / x-axis), 5.65% of 2-axis (
Fig.3 / y-axis) and 1.39% of 3-axis (
Fig.3 / z-axis) indicate contribution rate to pattern separation. It shows that the pattern separation is not sharp.
Table 2.
D.I. and D.R. of 20 feature parameters.
Table 2.
D.I. and D.R. of 20 feature parameters.
| Feature parameter | TGS813 | TGS880 |
| Max 1 | St1 | Mean 1 | Kmax 1 | Max | St2 | Mean 2 | Kmax 2 |
| D□I□ | 1.53 1 | 1.416 | 1.217 | 0.791 | 1.501 | 1.384 | 1.373 | 0.816 |
| D□R□ | 91.8 | 88.5 | 85.0 | 75.1 | 91.5 | 88.1 | 87.5 | 77.3 |
| Feature parameter | TGS822 | TGS825 |
| Max
| St | Mean
| Kmax
| Max | St | Mean
| Kmax
|
| D□I□ | 1.42 4 | 1.158 | 0.976 | 0.074 | 1.352 | 0.930 | 0.859 | 0.002 |
| D□R□ | 89.3 | 84.9 | 83.7 | 54.6 | 86.9 | 82.6 | 80.5 | 50.5 |
| Feature parameter | TGS812 | |
| Max
| St | Mean
| Kmax
|
| D□I□ | 1.32 1 | 1.110 | 0.622 | 0.005 |
| D□R□ | 86.1 | 84.5 | 73.2 | 52.0 |
The ten optimum features that were selected by the D.I. were also used in an artificial neural net network.. But before the ten features were transmitted into the input layer, they need to be normalized. Because the ten features were coming from the same example, we can use the method that can change general normal distribution into standardized normal distribution [
18,
19,
20]. Such as two different feature distributions, we separately noted them as follows:
Figure 5.
Results of the PCA of the gas sensor array for 40 vinegar gas samples.
Figure 5.
Results of the PCA of the gas sensor array for 40 vinegar gas samples.
Then
T′
1 and
T′
2 both are stochastic variable with
N(0,1) distribution. Then we can use formula (9) to make unified normalization for the ten different features. Therefore, we got
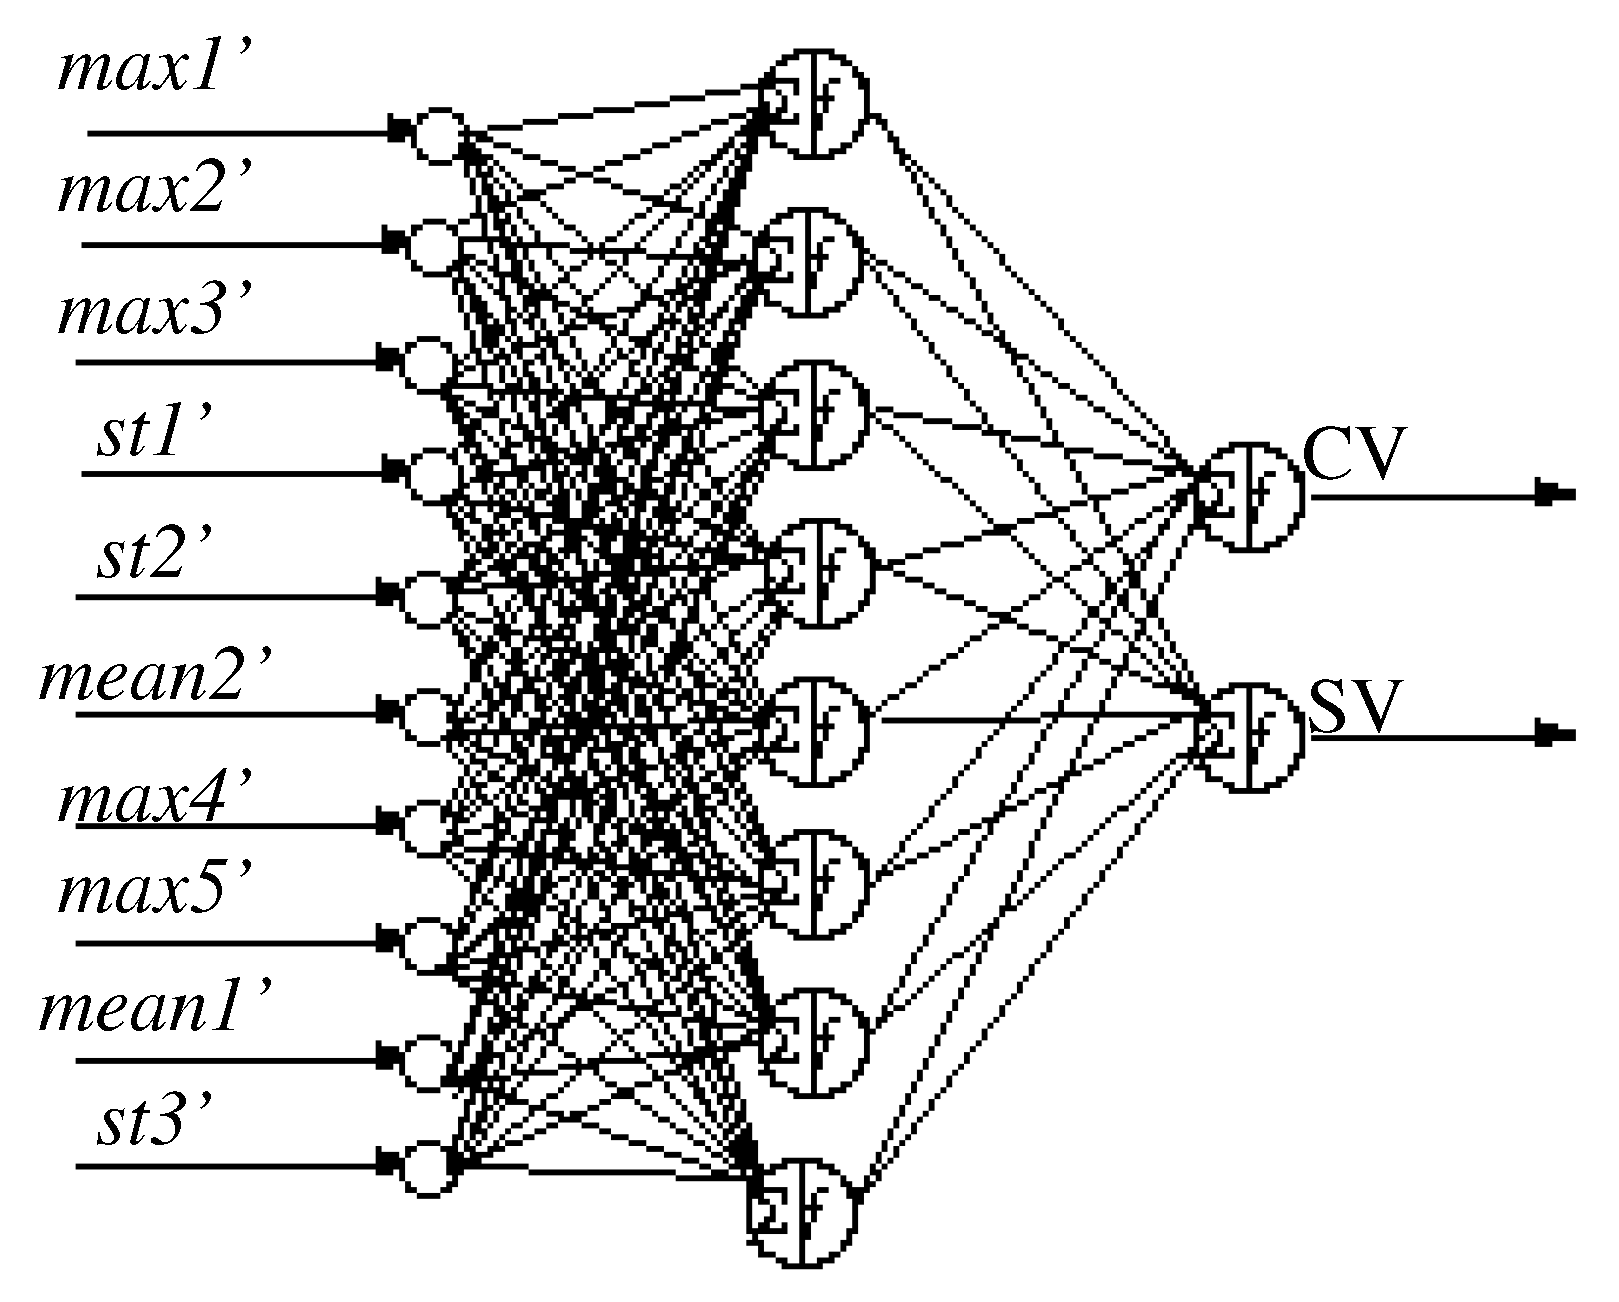
max1’, max2’, max3’, st1’, st2’, mean2’, max4’, max5’, mean1’ and
st3’ substitute for the ten optimum features transmitted into the input layer. The structure and parameters of neural network have been described in
Fig.6 and
Table 3. Two different vinegars were used as the output layer. The network was trained using data so that the desired outputs could be obtained. The connections between hidden and both input and output layers were optimized after 15,000 times training for the two vinegar samples.
Fig.6 illustrates both the ten normalized optimum features and the ANN classification of the system for the two of test vinegars presented to the system. The recognition probability of the neural network analysis, defined as the ratio of the number of right answers to that of total trials was 98%.
Table 3.
ANN training parameters.
Table 3.
ANN training parameters.
| Type: | Backpropagation in batch mode |
|---|
| Architecture: | 10-8-2 feedforward |
| Activation: | Logistic |
| Learning Rate: | 0.01 |
| Momentum: | 0.2 |
| No. of Epochs: | 15000 |
As a comparison, a neural network was also trained using all the 20 features extracted from 5 sensors curve. The recognition probability, using the same validation method as for the network above, was then 90%, which is significantly lower than for the network with only the parameters chosen by the D.I. method. This is probably due to the fact that a network with many parameters requires a much larger sample data set to be able to fit the network parameters without over-training.
Figure 6.
Vinegar classification with ANN.
Figure 6.
Vinegar classification with ANN.


