Introduction
The TSM resonator is now widely used in many sensing applications. In most instances the TSM resonator is configured as a gravimetric mass sensor often referred to as a Quartz Crystal Microbalance (QCM), where the crystal works as the frequency-determining element in an electrical oscillator circuit. In chemical sensing applications the QCM is coated with a chemically active coating which absorbs the target analyte. The additional absorbed mass is reflected in the resonant frequency of the crystal and can therefore be detected [
1]. This method is however limited as mass loading is only measured without considering the effect of characteristic properties of analytes.
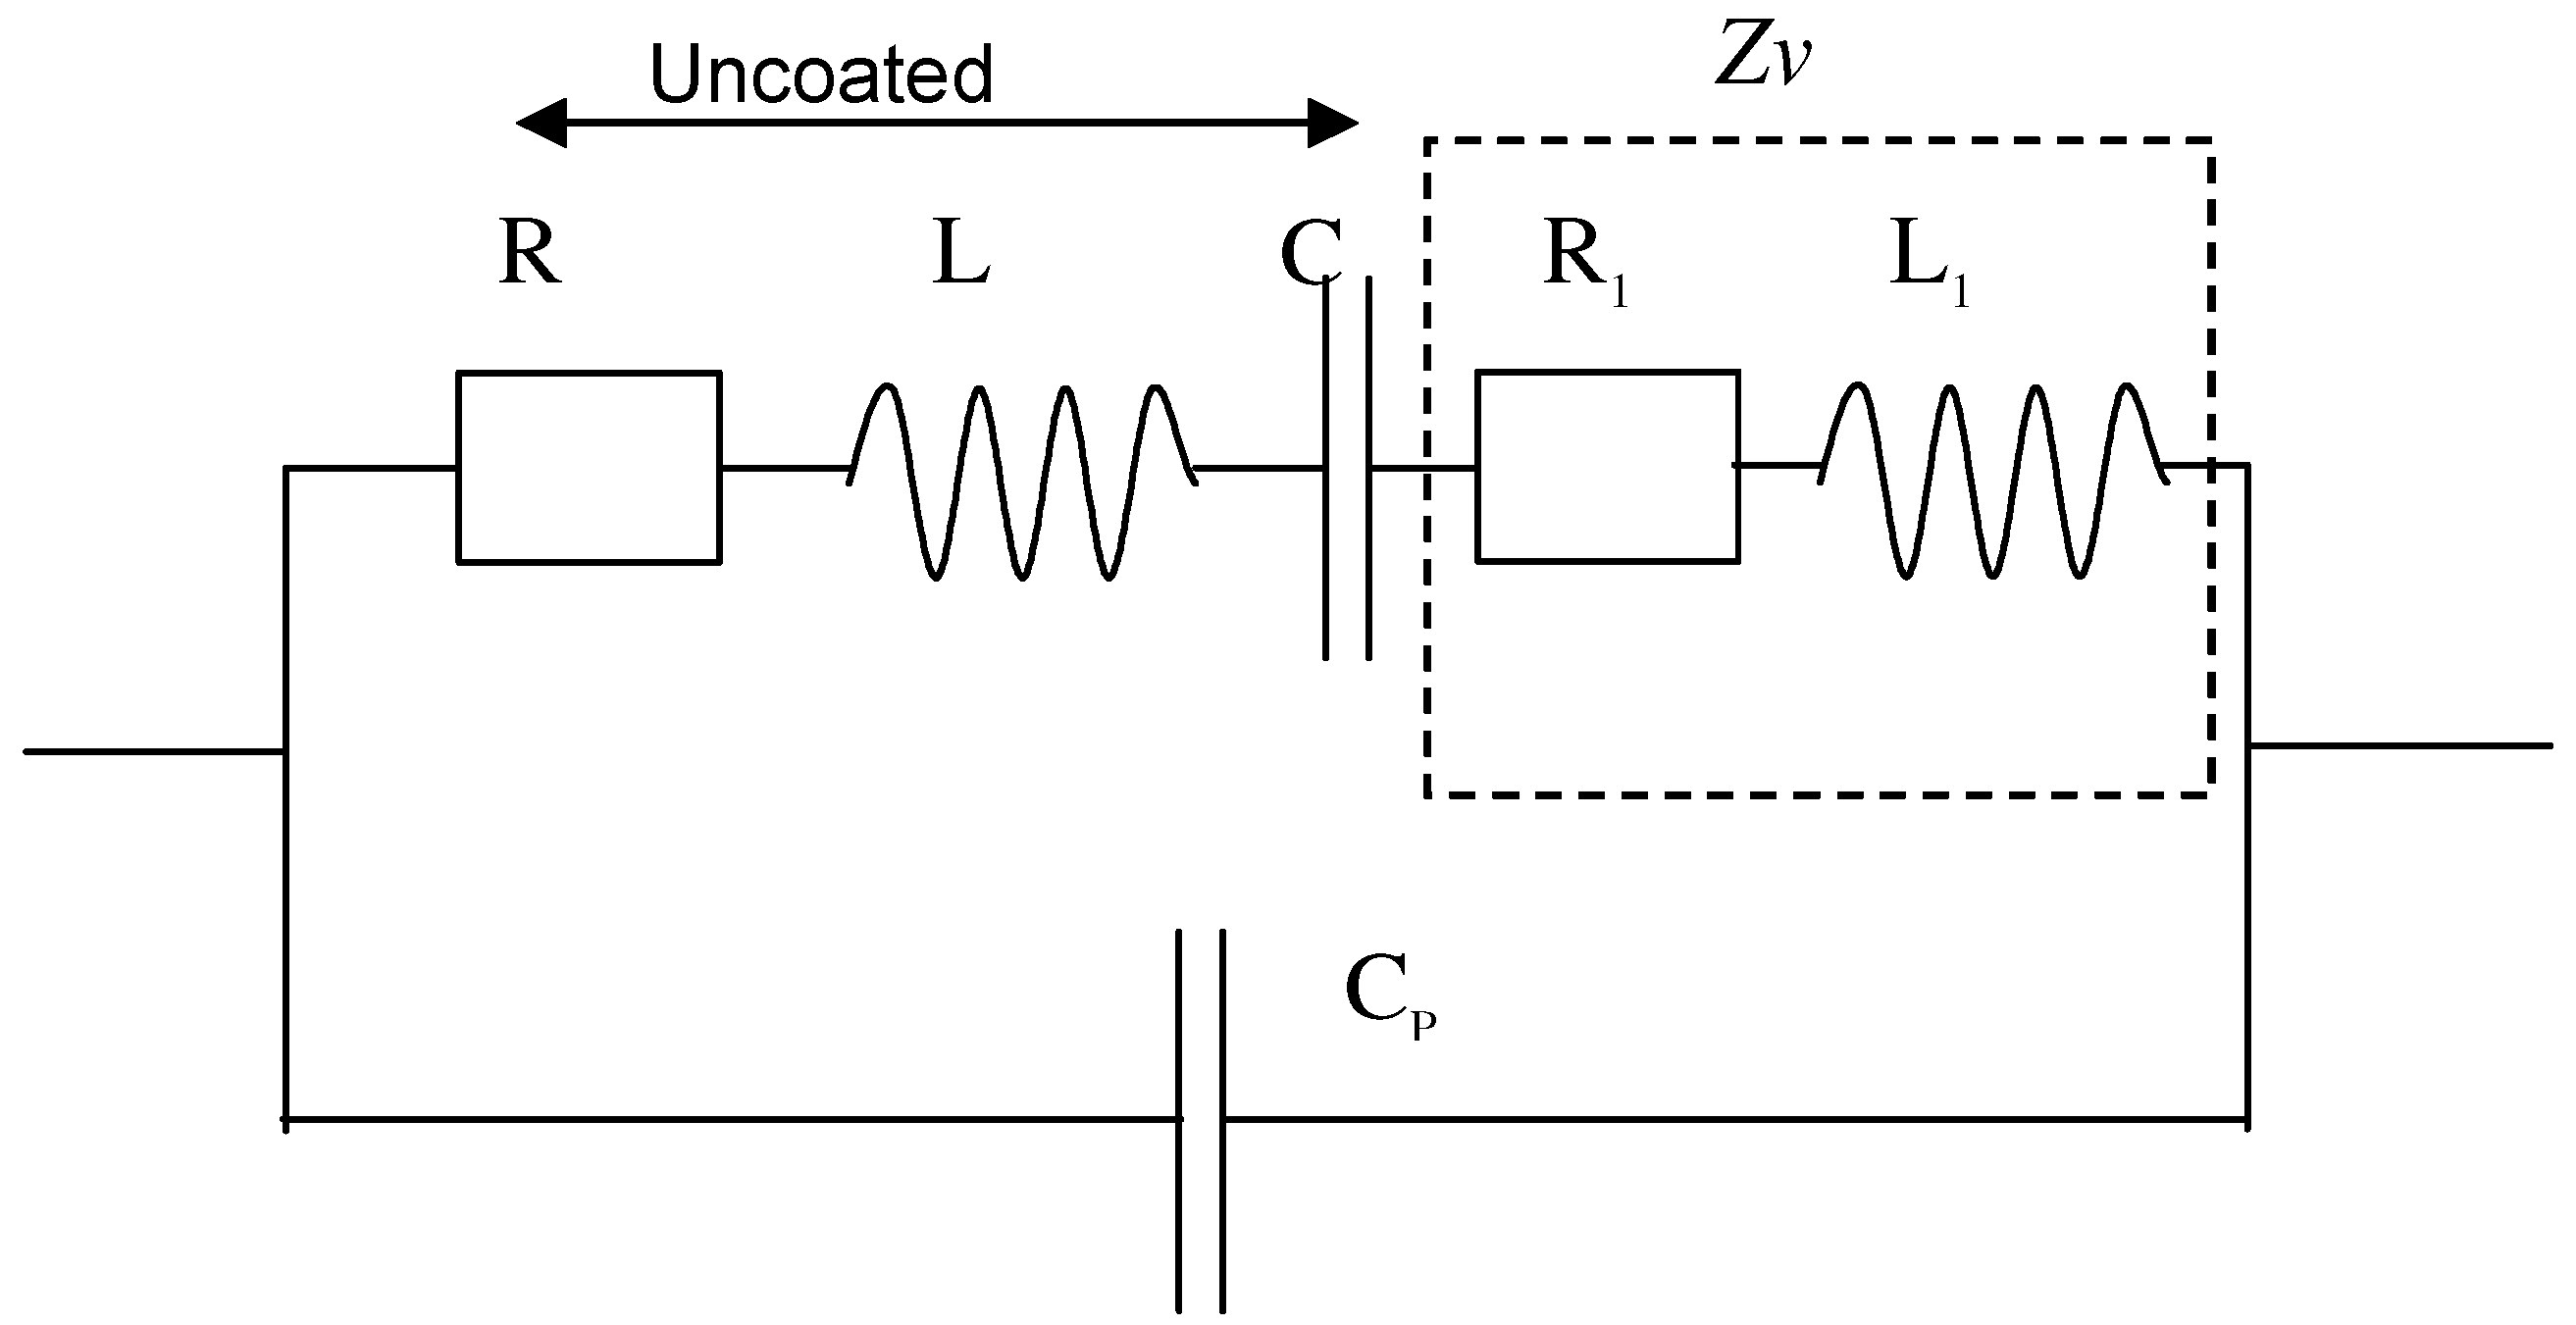
An improved method involves measuring the electrical characteristics (impedance/admittance) of the device over a range of frequencies near resonance. The obtained spectra are subsequently fitted to an equivalent circuit model as shown in
Fig. 1, with each element representing a physical property of the crystal. R represents the energy loss arising from viscous effects and internal friction, L the initial mass/motional inertia of the system, C the mechanical elasticity of the quartz. C
p determines the admittance away from resonance and consists of the capacitance of the quartz between the electrodes and the parasitic capacitance of the crystal fixture. The deposition of a viscoelastic sensing membrane on top of QCM adds two additional components L
1 and R
1 in the equivalent circuit in
Fig.1, related respectively to the additional mass (normally measured through ∆f) and acoustic energy dissipation in the film [
2,
3]. Adsorption of organic vapours into the membrane causing an increase in mass and/or changing elastic film properties can therefore be detected by monitoring changes in
L1 and
R1, e.g.
∆L and
∆R.
Figure 1.
Butterworth Van Dyke (BVD) equivalent circuit model of TSM resonator near resonance.
Figure 1.
Butterworth Van Dyke (BVD) equivalent circuit model of TSM resonator near resonance.
Results and Discussion
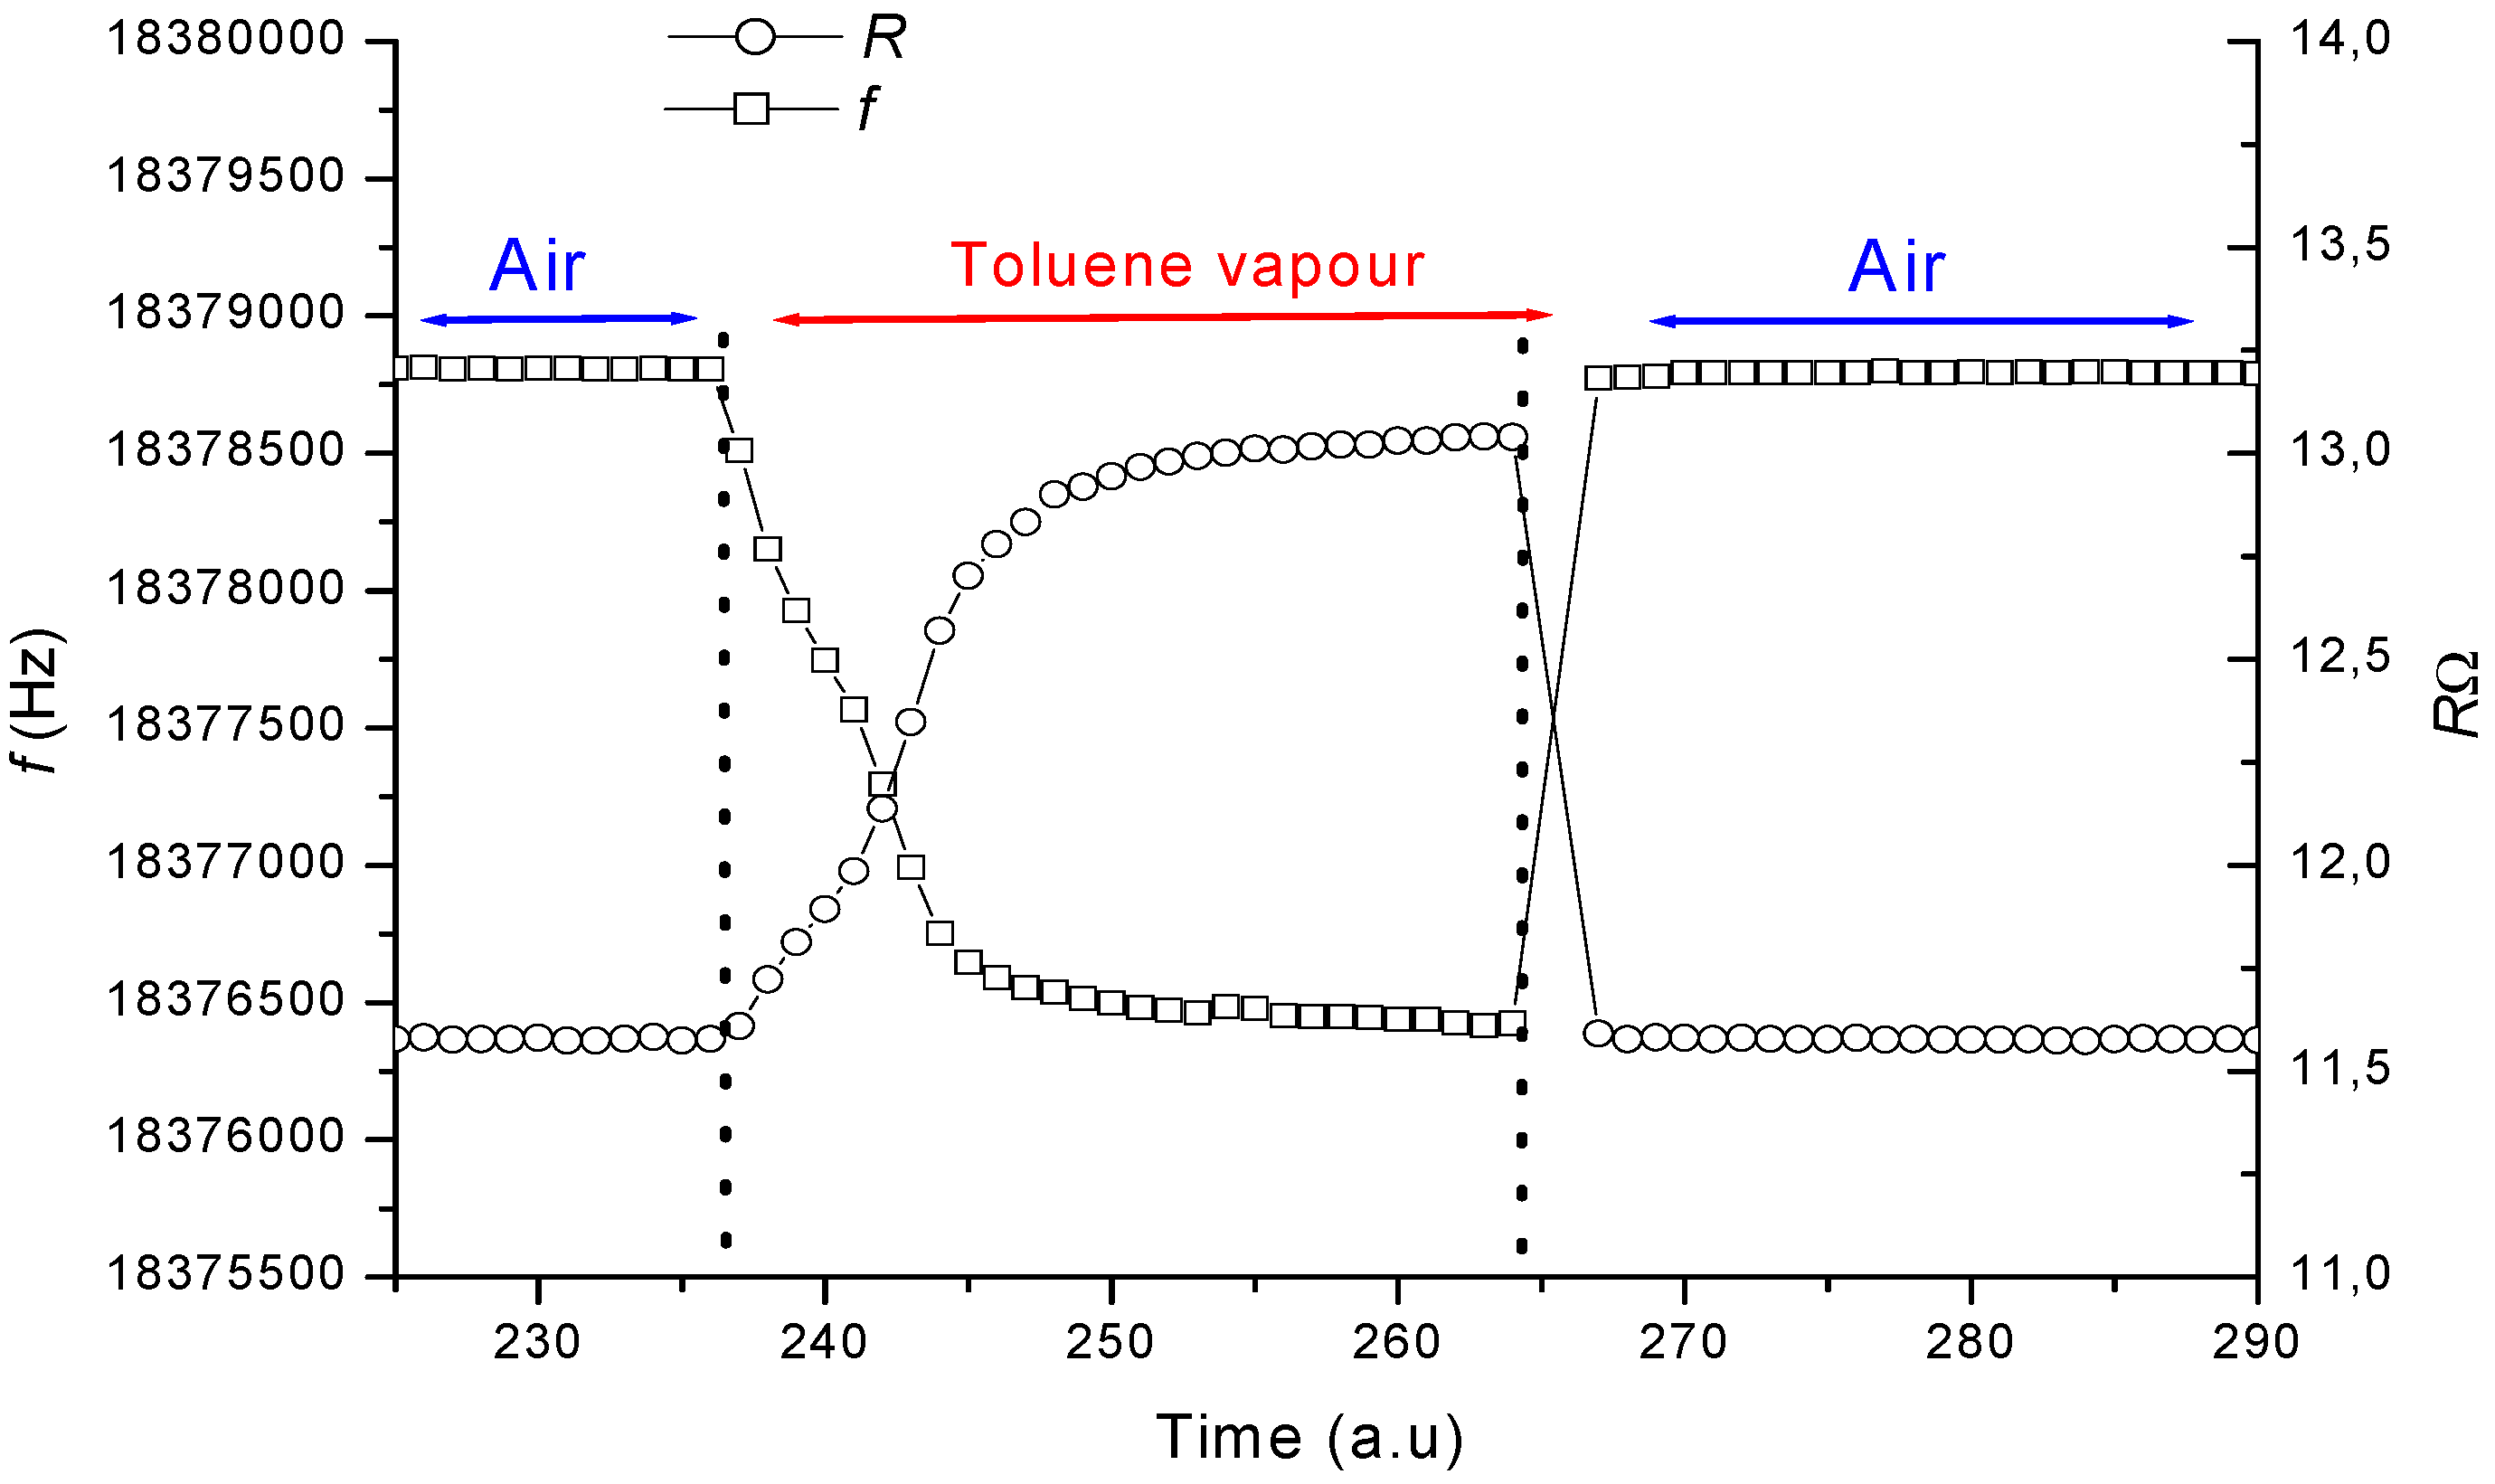
Typical kinetics of parameters ∆f (a function of L
1) and ∆R during exposure to hexane vapours are plotted in
Fig 2. As one can see the response is fast and fully recoverable, relatively slow changes on exposure being attributed to the evaporation time of the liquid solvent, and a much faster recovery gives a real picture of the sensor response time.
Figure 2.
Pseudo real time plot of changes in frequency and resistance as a response on exposure to 25000 ppm of toluene vapour.
Figure 2.
Pseudo real time plot of changes in frequency and resistance as a response on exposure to 25000 ppm of toluene vapour.
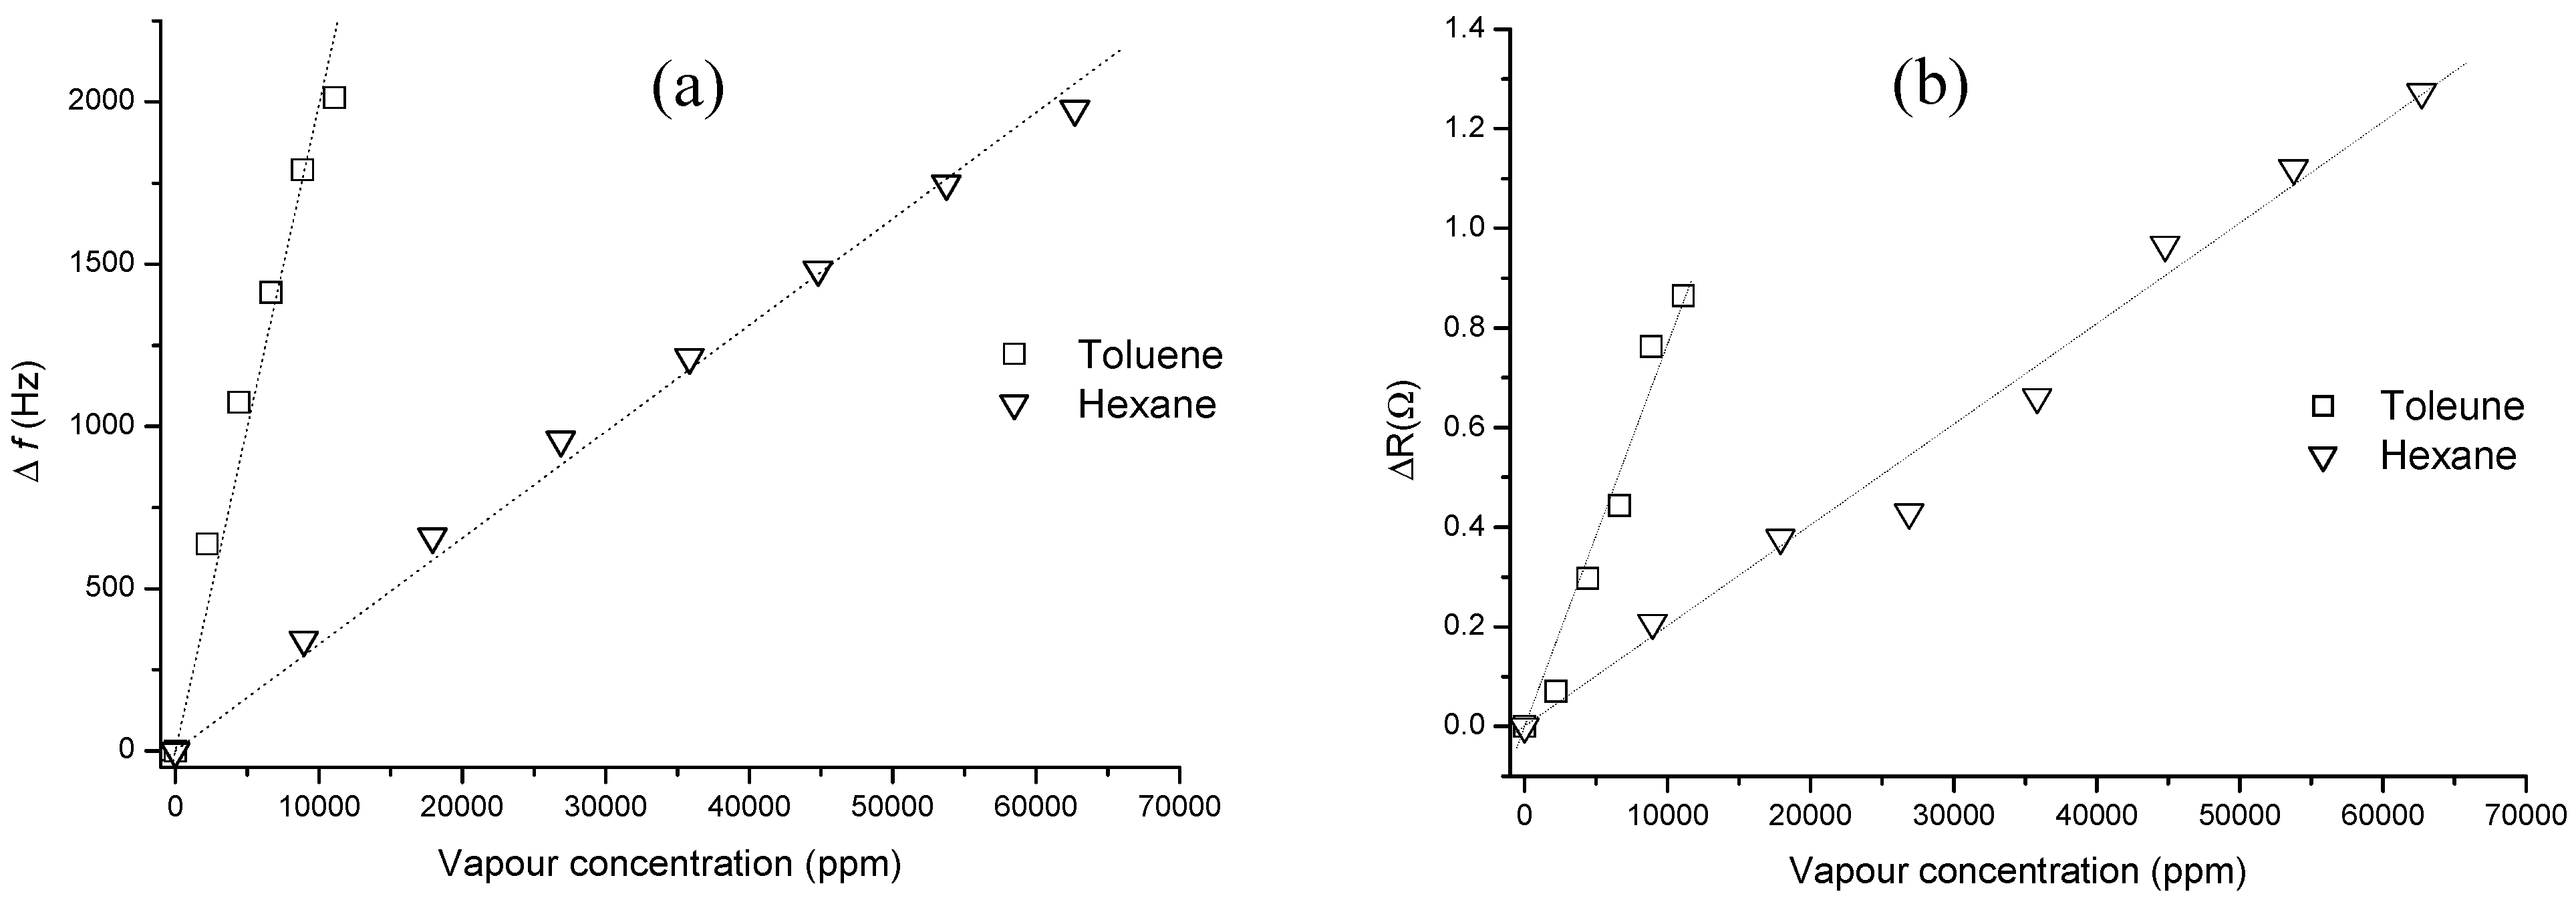
Figure 3a shows the changes in resonant frequency against analyte concentrations measured in ppm, the results clearly showing the difference between hexane and toluene vapours. The general trend for the above dependencies is approximately linear suggesting a bulk absorption mechanism in the film. From
Fig. 3a the limitation of frequency measurements alone has become evident since attempts of discrimination between vapours gave multiple solutions.
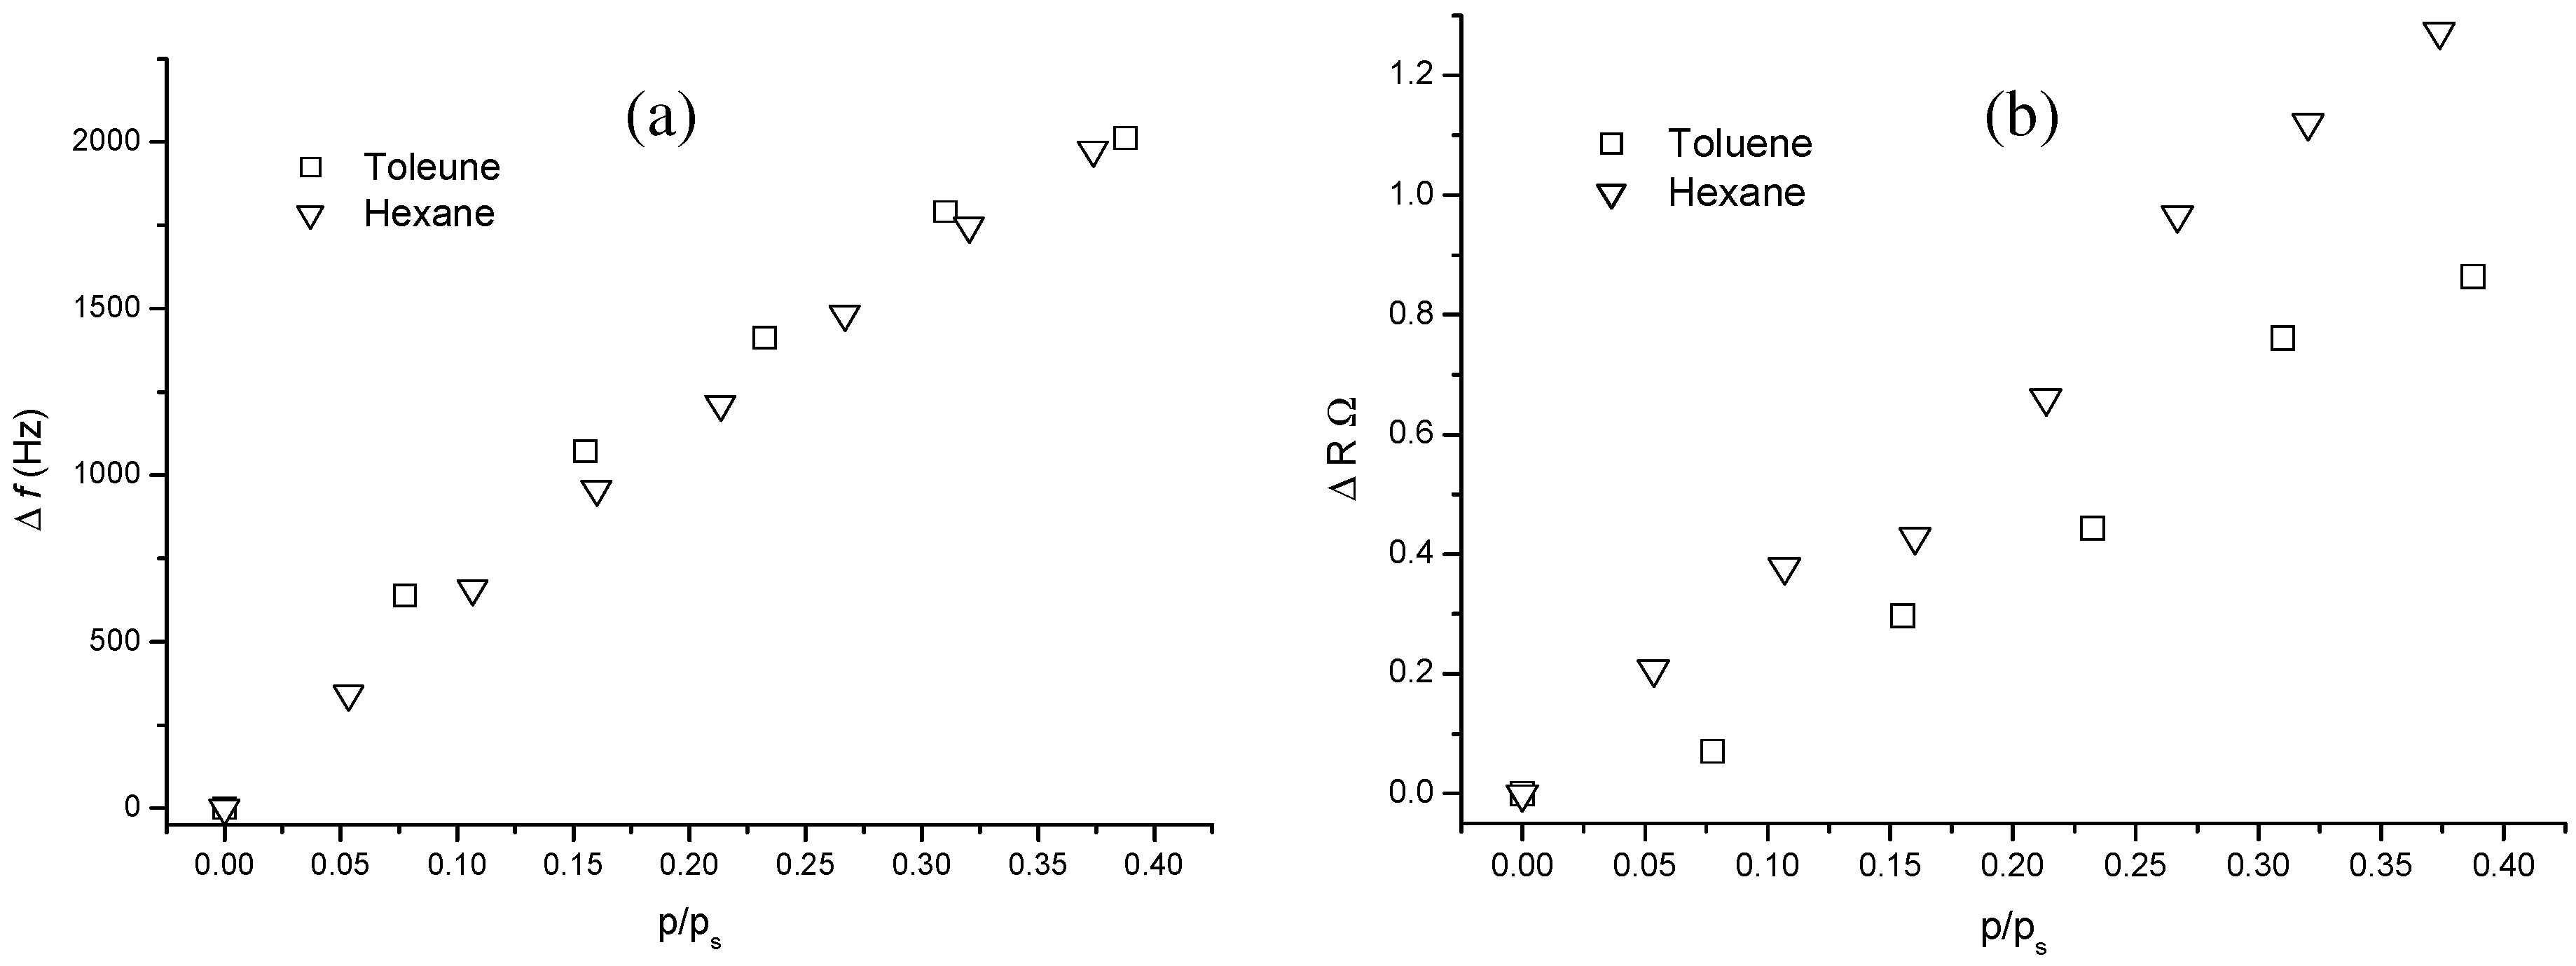
This is emphasized by plotting
Δf against the relative vapour pressure units (
p/ps), where
ps is the saturated vapour pressure. This resulted in very similar responses for both toluene and hexane vapours, indicating that the mass sensitivity is a function of
p/ps rather than the result of interaction of the analyte with the sensitive membrane. Changes in film viscosity were monitored through increase in ∆R along with the increase in vapour concentration (
Fig 3b,
4b) and therefore indicates film softening. Such effect is believed to be caused by capillary condensation of organic vapours within nano-porous C4RA film, as was suggested previously [
4]. Plotting ΔR against vapour concentration in ppm again shows separation between analytes, although measurements of the resistance alone can not help to identify the vapour type. The plot of ΔR vs.
p/ps unlike mass loading, does however show clear separation between analytes.
Figure 3.
a) ∆f and b) ∆R against vapour concentration in ppm relative to air.
Figure 3.
a) ∆f and b) ∆R against vapour concentration in ppm relative to air.
Figure 4.
a) ∆f and b) ∆R against vapour concentrations relative to saturated vapour pressure (p/ps).
Figure 4.
a) ∆f and b) ∆R against vapour concentrations relative to saturated vapour pressure (p/ps).
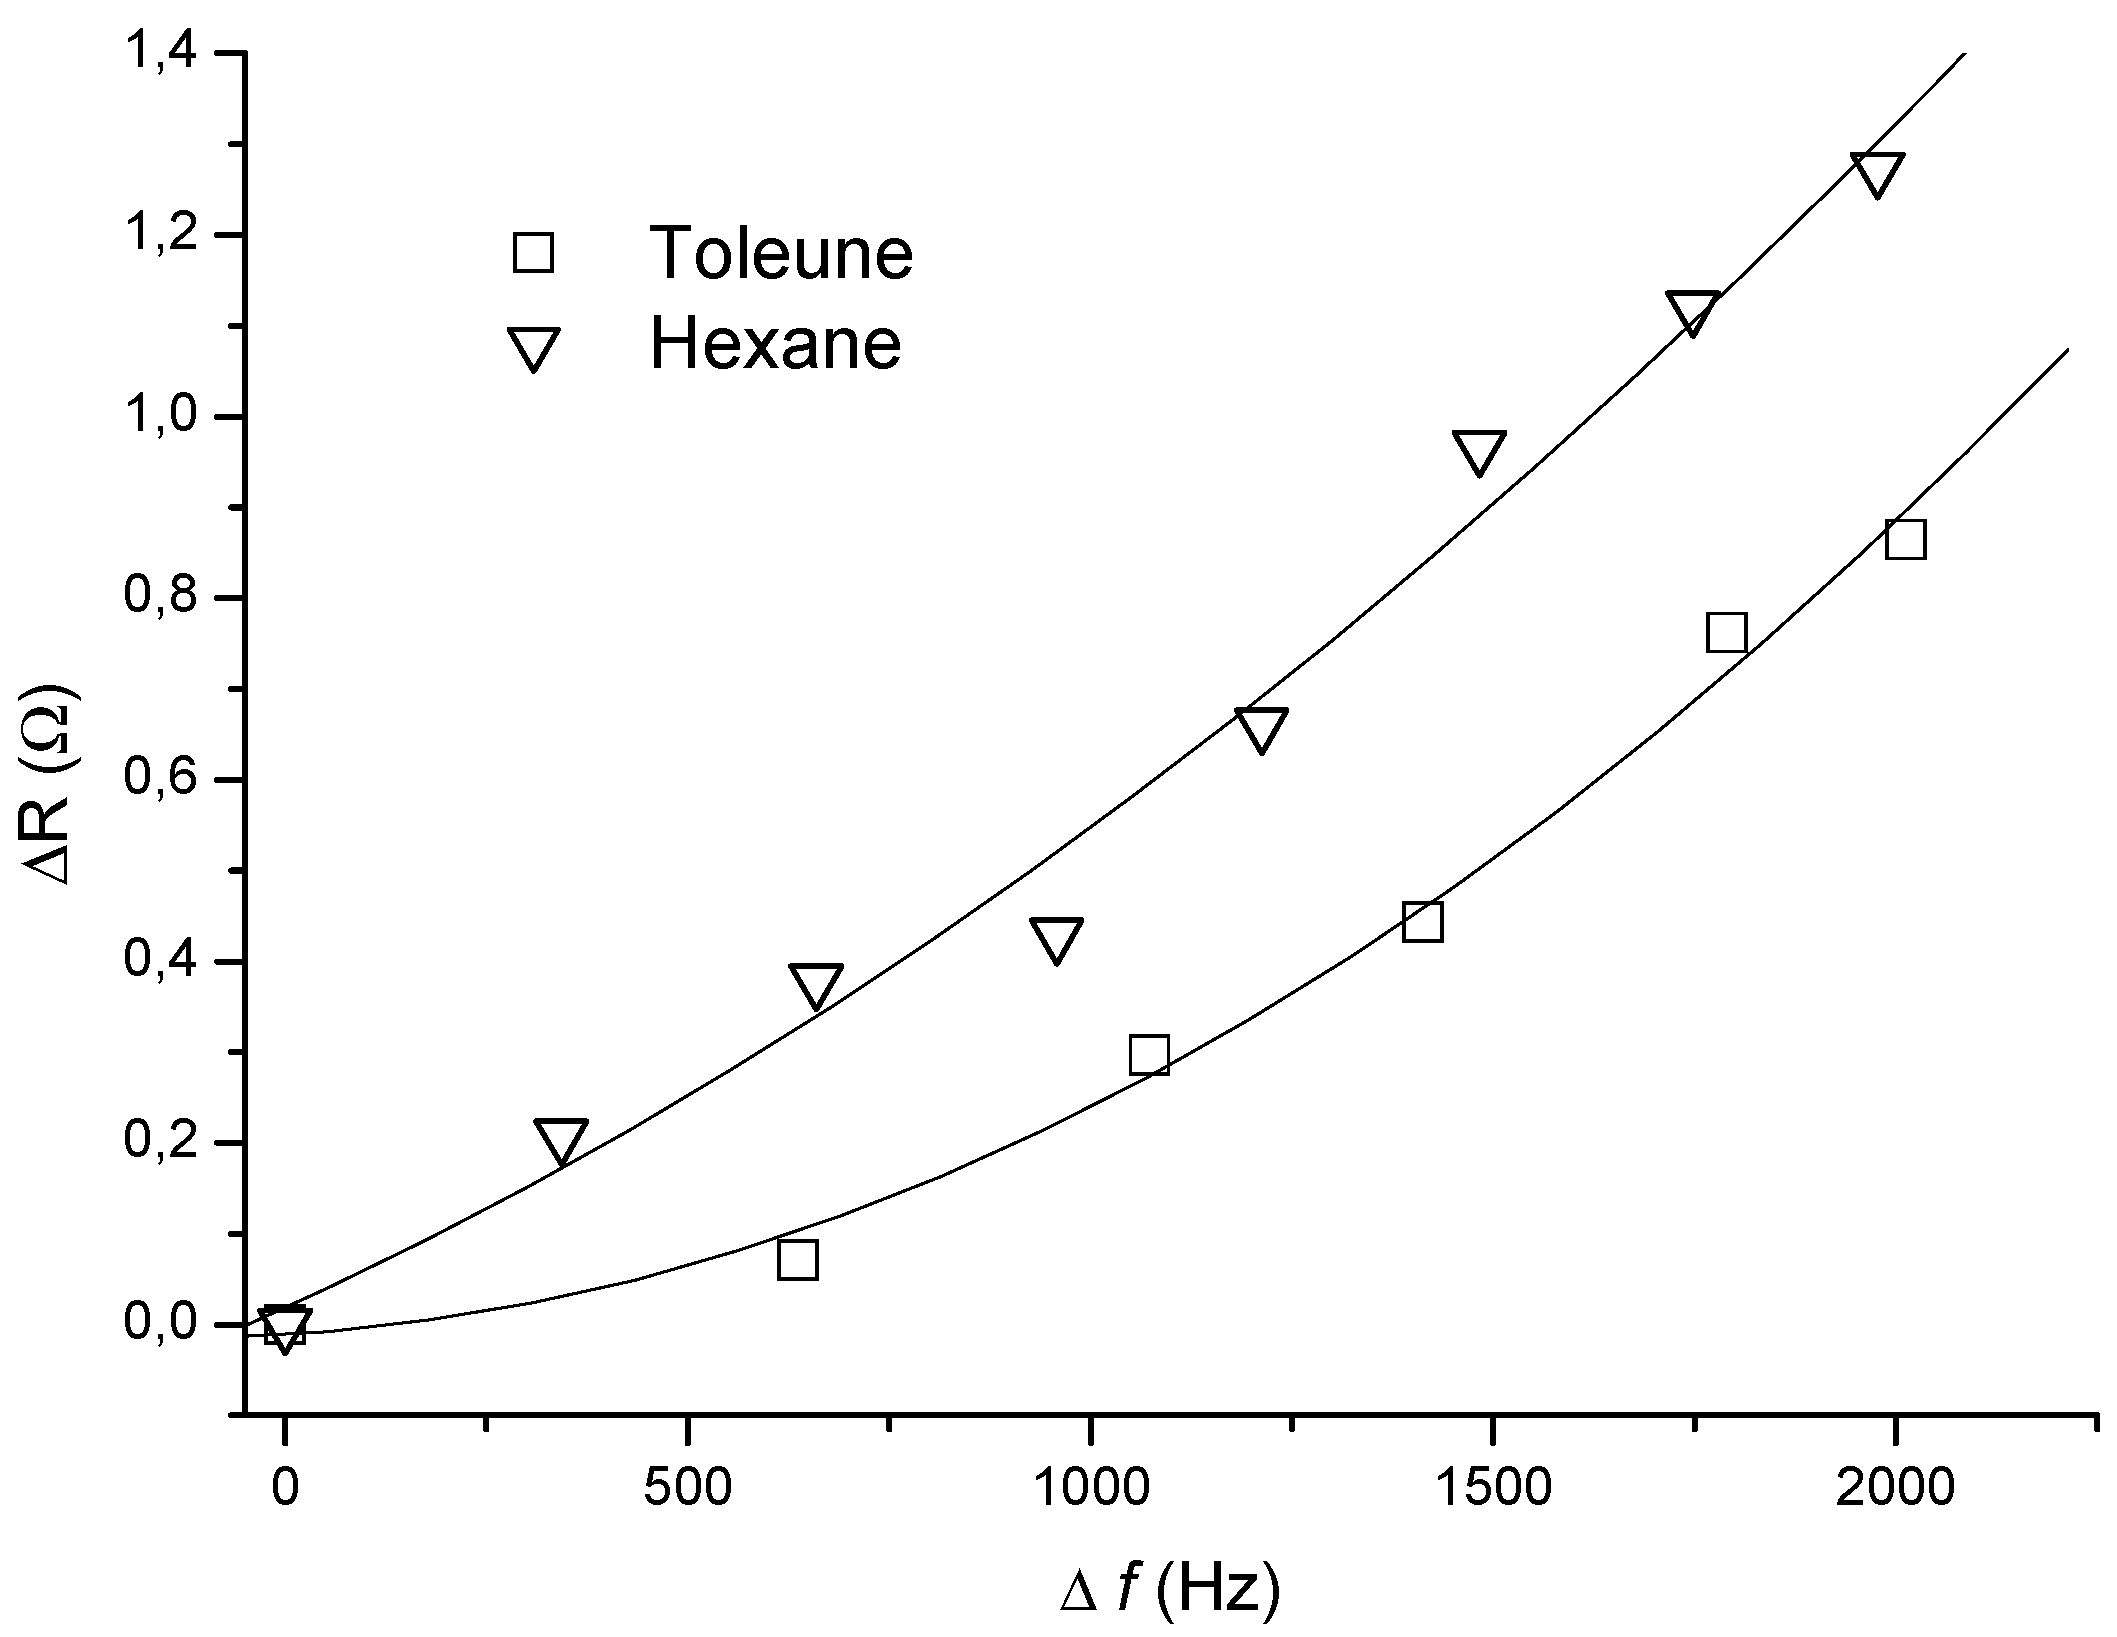
Discrimination between vapours can therefore be achieved through the correlation between Δf and ΔR, presented in
Fig. 5. The graph demonstrates clear separation of parameters for hexane and toluene vapours. The vapour concentration level in the range of 1000-100000 ppm studied here is relatively high, however suitable for the envisaged application as a discriminative sensor for LEL – HEL (Lower/Higher Explosion Limit) of volatile organic solvents.
Figure 5.
∆R against ∆f showing discrimination between vapours.
Figure 5.
∆R against ∆f showing discrimination between vapours.
Experimental
The QCMs with a fundamental resonant frequency of 18.423 MHz were coated with calyx[4]resorcinarene (C4RA) films. The film deposition procedure consisted of spin coating of a relatively thin layer of C4RA in order to unify the surface of the crystal, followed by Langmuir-Blodgett (LB) deposition of a relatively thick C4RA film [
5,
6]. The admittance spectra of the crystals were measured using a Solartron 1260 impedance gain/phase analyser connected to a PC via GPIB interface. The whole system was controlled by a specifically written Labview based data acquisition package and curve fitting software. The measurements were carried out in a frequency range of ±1000Hz centered on the series resonance with a sampling frequency of 100Hz. Data points were interpolated by fitting the peak of the admittance curve to a 4th order polynomial, increasing the precision to which the resonant frequency and equivalent circuit parameters could be extracted. The curve fitting was based on two algorithms. A simulated annealing approach [
7] was first applied to establish initial parameters and a Levenberg Marquardt non linear least squares algorithm [
8,
9] used for the final fit and subsequent fits during vapour exposure. The vapour exposure was realised by injecting of a small amount of liquid solvent (hexane or toluene) into a PTFE airtight chamber containing QCM. Both the admittance spectra measurements and fitting to equivalent circuit were performed in-situ during vapour exposure and resulted in the time dependence of ∆L (or ∆f) and ∆R. The time scale is presented in arbitrary units of a sampling time, which was approximately 20 s per spectra. The effect of humidity/moisture was practically nullified by using extremely hydrophobic C4RA coating, and temperature instability of ±1Hz/CO was negligible as compared to the observed frequency shift.


